Package Compare Report Friday, 2022-07-22 05:08:01 PM
Goal & Scope This report shows the environmental impact calculated using a screening Life Cycle Analysis. The analysis below can include the environmental impact for all life cycle phases in a Cradle-to-Grave analysis. Analysis Data Version: COMPASS 2022.4 User: francesca.croci@bruniglass.com Company: Berlin Packaging Number of BOMs in Analysis: 2 Material Scrap Rates considered: No
Note: This COMPASS report uses life cycle inventory (LCI) data that represents an industry average for materials, manufacturing processes, and end of life impacts. The Life Cycle Analysis (LCA) in this report can be used for directional guidance in internal decision making and understanding trade-offs. COMPASS follows the guidelines of ISO 14040 in determining and documenting the scope, assumptions, consistent boundary conditions and data sources. According to ISO 14040, LCA results should not be used to make comparative assertions between competitive products to be disclosed to the public without first conducting a third party critical review.
Functional Unit: 26 g The environmental impact calculated in this analysis is for the packaging required to deliver the amount of product described by the functional unit. This includes the number of primary, secondary and tertiary packages shown below. These package numbers were calculated based on the pallet configuration modeled in the BOM. If the secondary and tertiary package data is not entered their environmental impact cannot be calculated.The analysis below can include the environmental impact for all life cycle phases in a Cradle-to-Grave analysis. # of # of # of Primary Secondary Tertiary Packages Packages Packages
Package Name
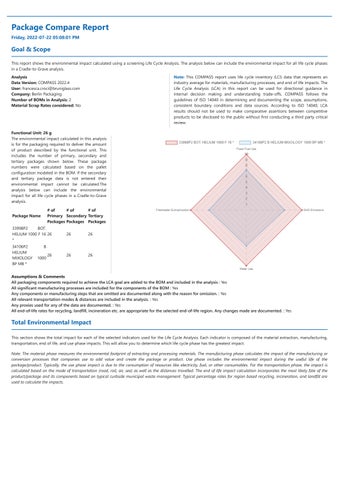
33998P2 BOT. HELIUM 1000 F 16 26 *
26
26
34106P2 HELIUM MIXOLOGY BP MB *
26
26
B 1000
26
Assumptions & Comments All packaging components required to achieve the LCA goal are added to the BOM and included in the analysis : Yes All significant manufacturing processes are included for the components of the BOM : Yes Any components or manufacturing steps that are omitted are documented along with the reason for omission. : Yes All relevant transportation modes & distances are included in the analysis. : Yes Any proxies used for any of the data are documented. : Yes All end-of-life rates for recycling, landfill, incineration etc. are appropriate for the selected end-of-life region. Any changes made are documented. : Yes
Total Environmental Impact This section shows the total impact for each of the selected indicators used for the Life Cycle Analysis. Each indicator is composed of the material extraction, manufacturing, transportation, end of life, and use phase impacts. This will allow you to determine which life cycle phase has the greatest impact. Note: The material phase measures the environmental footprint of extracting and processing materials. The manufacturing phase calculates the impact of the manufacturing or conversion processes that companies use to add value and create the package or product. Use phase includes the environmental impact during the useful life of the package/product. Typically, the use phase impact is due to the consumption of resources like electricity, fuel, or other consumables. For the transportation phase, the impact is calculated based on the mode of transportation (road, rail, air, sea) as well as the distances travelled. The end of life impact calculation incorporates the most likely fate of the product/package and its components based on typical curbside municipal waste management. Typical percentage rates for region based recycling, incineration, and landfill are used to calculate the impacts.