
Foreword
Over the 2020-21 financial year we have demonstrated our commitment to being an environmentally conscious organisation and highlighted the integral role that sustainability has at the core of our business operations.
This Environmental Management Report communicates our environmental performance over the year, identifying a reduction in our energy use, water and waste consumption, and our carbon emissions. Our scope 1 and 2 emissions per capita is reduced by 7.3% compared to financial year 201920. Though the impact of the COVID–19 pandemic has had on business-related emissions around the world cannot be overlooked, we have continued to identify and implement opportunities to reduce our resource consumption. Whilst our studios remained under utilised for the majority of this financial year, like many, we’ve had to invest in increasing our data capacity and resilience to enable effective remote working across processor-hungry activities. We also had to keep our studios open for those that were unable to work from home. So, whilst energy consumption has reduced, we have not seen the reductions we might have expected at the start of the year.
The pandemic has also, understandably, resulted in a significant reduction in our travel emissions, which saw an overall reduction in business travel miles by 95.9% compared to FY 2019-20. We have also seen significant reductions in waste and water consumption with the majority of people working from home. As we approach the end of 2021, we are starting to see a slow return to our studios as confidence grows.
Our next steps involve rolling out our monitoring processes and procedures more robustly to our international studios, starting to build a database of our project impacts, and completing our Science Based Targets application, which seeks to set a target of a 46.2% reduction in Scope 1, 2, and 3 emissions by 2030 from a 2019-20 base year.
2021-2022 presents exciting new challenges as the world returns to the new normal and places a more meaningful emphasis on tackling climate change.

Philip Gray Head of Sustainability
14001 and 50001
Summary of Performance
The figures below show our headline performance for FY 2020-2021. Over the year we have maintained compliance with ISO 14001 and ISO 50001, demonstrating our commitment to continual improvement.
Whilst we finalise our Science Based Targets application, our targets are to improve on the previous years’ performance. Our Science Based Target application aims to set a 2030 performance target on a 2019 (pre-pandemic) baseline.
Scope 1 and 2 energy consumption reduced by 8.4% compared to FY 2019-20
Scope 1 and 2 emissions per capita reduced by 7.2% compared to FY 2019-20
Business travel miles reduced by 94.9% compared to FY 2019-20
Reduced total water consumption by 63.7% compared to FY 2019-20
Total waste reduced by 77% compared to FY 2019-20
Studio Initiatives 2020–21
For much of the financial year, our studios remained at least partially closed as a result of national or local directives in response to the COVID–19 pandemic. As a result, interventions and initiatives have been minimal.
UK and Ireland:
• London studio has replaced ‘back-of-house’ lighting with LEDs, saving around 1100kWh/yr.
• Manchester studio reconfigured their communications room in 2020 to incorporate new more efficient chillers. 95% of the studio’s lighting is now LED.
• Glasgow have introduced the use of electronic drawing devices to eliminate need for printing.
• Bristol has expanded staff responsibilities to require engagement across a wider range of energy saving initiatives, in addition to increased communication .
International:
• Our Toronto studio in Canada has implemented leadership training on sustainable design, has run monthly ‘Green’ Lunch and Learns, and developed new Sustainability Orientation to all new starters.
Headline Performance Figures
Introduction
Founded in 1961, BDP has a leading track record in all major sectors including health, education, workplace, retail, urbanism, heritage, housing, transport, leisure, public safety and energy utilities. We are an integrated design practice of architects, designers, engineers, urbanists and specialists. We work closely with users, clients and the community to create sustainable living environments, regenerate communities and stimulate human interaction.
In 2016 we combined forces with Japan’s leading engineering practice Nippon Koei to form an integrated design group of international reach. Sharing a philosophy which places an emphasis on design integration and community impact, the group offers a unique combination of deep technical skills. In 2019 we joined forces with Quadrangle, one of Canada’s most respected architecture and interior design practices, to enhance our expertise and resources across Canada and North America, and enable us to share knowledge and approaches to sustainability and innovation.
A fundamental feature of BDP’s professional services offer is the delivery of sustainable design to facilitate good environmental performance by our clients. This commitment to environmental performance is also integral to our everyday practice within each of our design studios. We believe we have a duty to promote high quality sustainable design within our projects and to also ensure excellent environmental performance within our business operations.
Since 2011, BDP in the UK has held ISO 14001 certification which demonstrates a continuous commitment to monitor the environmental performance of our business operations, develop targets to deliver environmental performance improvements, and annually review and revise our targets to secure future improvements in the environmental performance of the business. In 2016, BDP secured ISO 50001:2011 certification. This internationally recognised standard is awarded to organisations that operate a robust energy management system, and confirms BDP’s compliance with the DECC Energy Savings Opportunity Scheme (ESOS) 2014 Regulations.
By way of greater transparency, BDP produces a detailed annual Environmental Report which is made available to all our stakeholders. The Environmental Report provides an annual review of performance relating to carbon emissions, water use and waste generated from business activities against our targets, and establishes plans and targets to further manage and minimise our environmental footprint over the coming financial year.
This report marks our eighth year of public reporting and covers the financial year from July 2020 to June 2021 (inclusive), the year in which BDP celebrated our 60th anniversary. Our data collection and reporting in in line with the Green House Gas (GHG) Protocol.
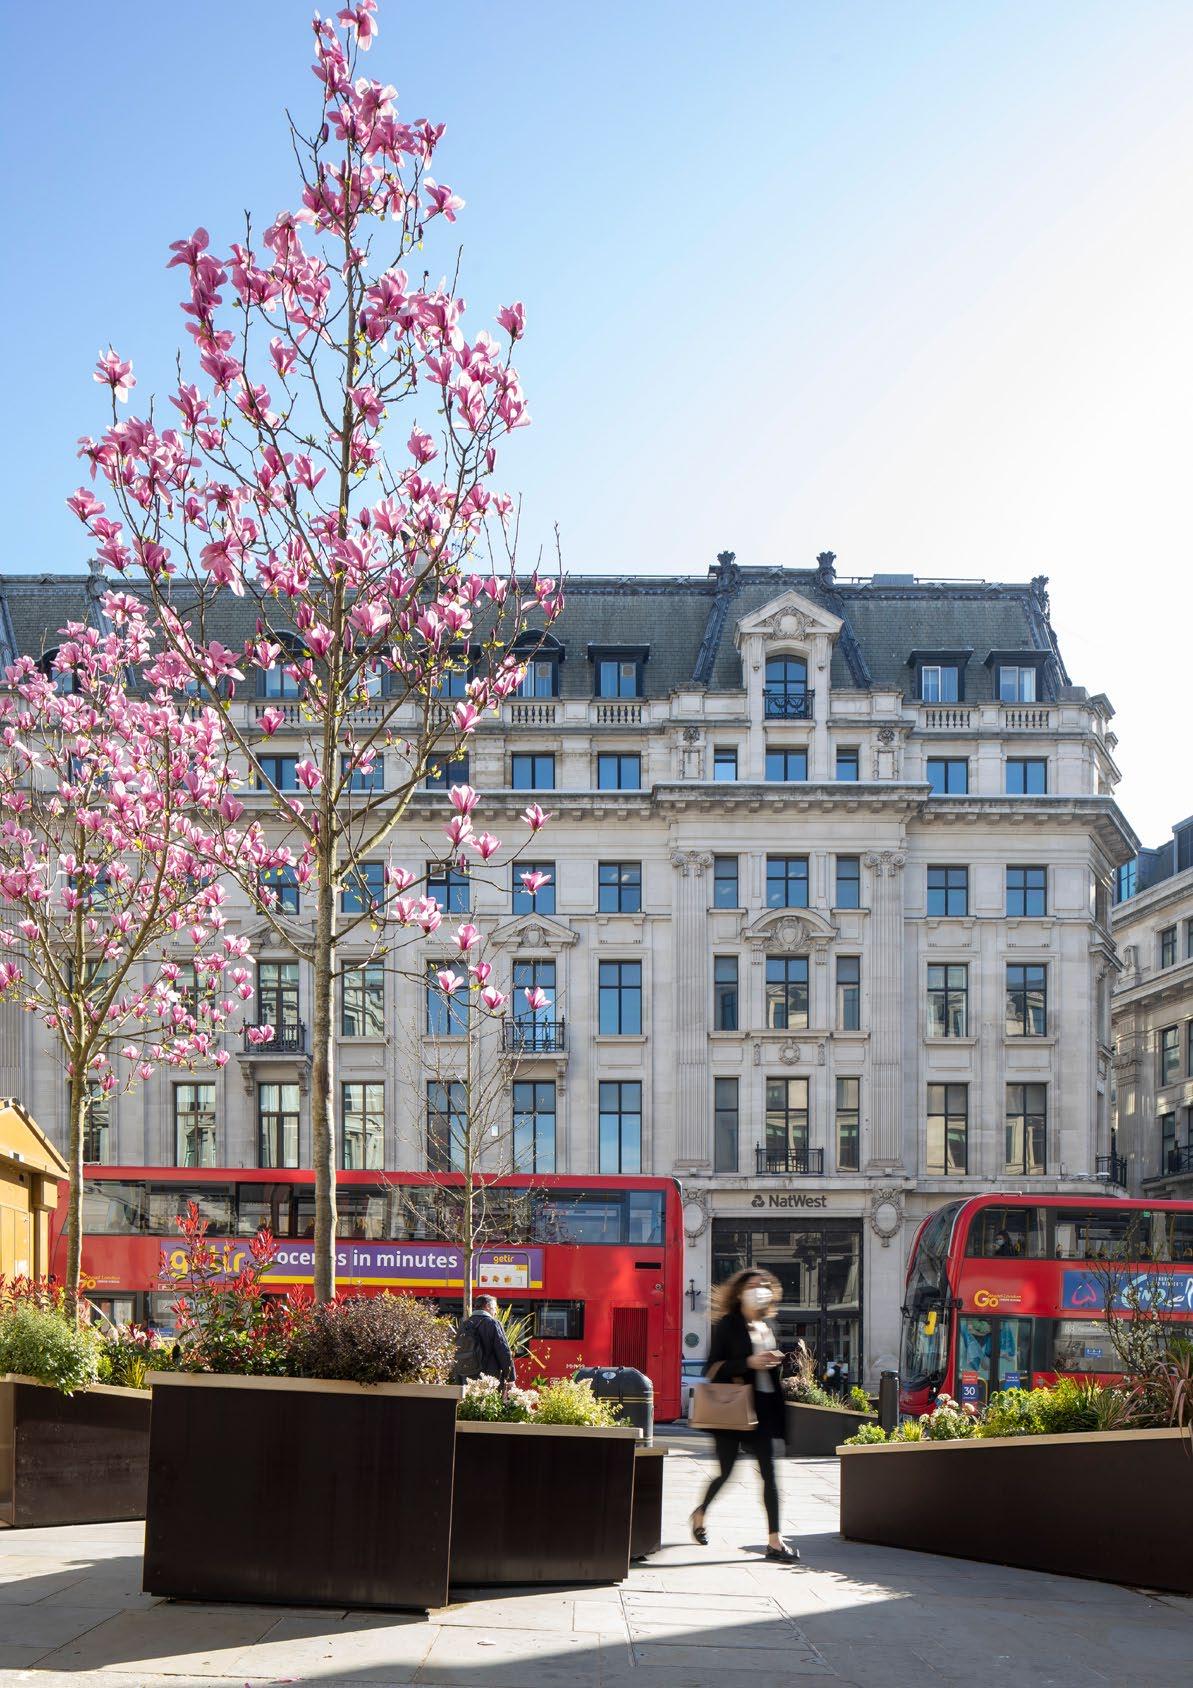
Picture: Regent Street Greening Project
Our Studios
We now have 18 studios, comprising of 10 in the UK and 8 internationally. We currently measure and report detailed performance data for our Birmingham, Bristol, Dublin, Glasgow, London, Manchester and Sheffield studios.
We have started to implement processes to collect performance data from our China, India, MENA, Netherlands and Singapore and Canada (BDP Quadrangle) studios, which we intend to fully incorporate
into our environmental management measuring and reporting next year. The current scope of monitoring for these international studios is included in this report with efforts underway to populate the remaining metrics during our next reporting period.
Our headcount across these studios is shown below. These figures have been used to produce our ‘per capita’ performance figures.
ISO 14001 and 50001
In 2020–21 we maintained both ISO 14001 and 50001 certifications, evidencing our commitment to improving and maintaining our environmental and energy management systems, and compliance with the Energy Savings Opportunity Scheme (ESOS). The certification process involves an annual audit, where we demonstrate our activities are in compliance with the standards, whilst highlighting our successes and identifying opportunities for continual improvement.
The following opportunities for improvement were identified:
• Increase and improve tracking of procurement decisions, investments and outcome of initiatives across studios.
• Better utilisation of our legal and health and safety subscription service and associated register.
• Maintenance of local energy objectives, targets, and action plans in each individual studio.
• Further identification of needs, expectations and influence of our international studios and their partners as we explore bringing them in line with the standard(s).
We are also working to implement new project related controls for environmental and energy impacts, with the medium-term ambition of tracking performance and setting targets related to our project work, which currently sits outside of the scope of our certification.
We are committed to continuous improvement, and this report serves as a tool to communicate and demonstrate the value we place on being an environmentally conscious and transparent organisation.

Picture: BDP’s London studio
UN Sustainable Development Goals
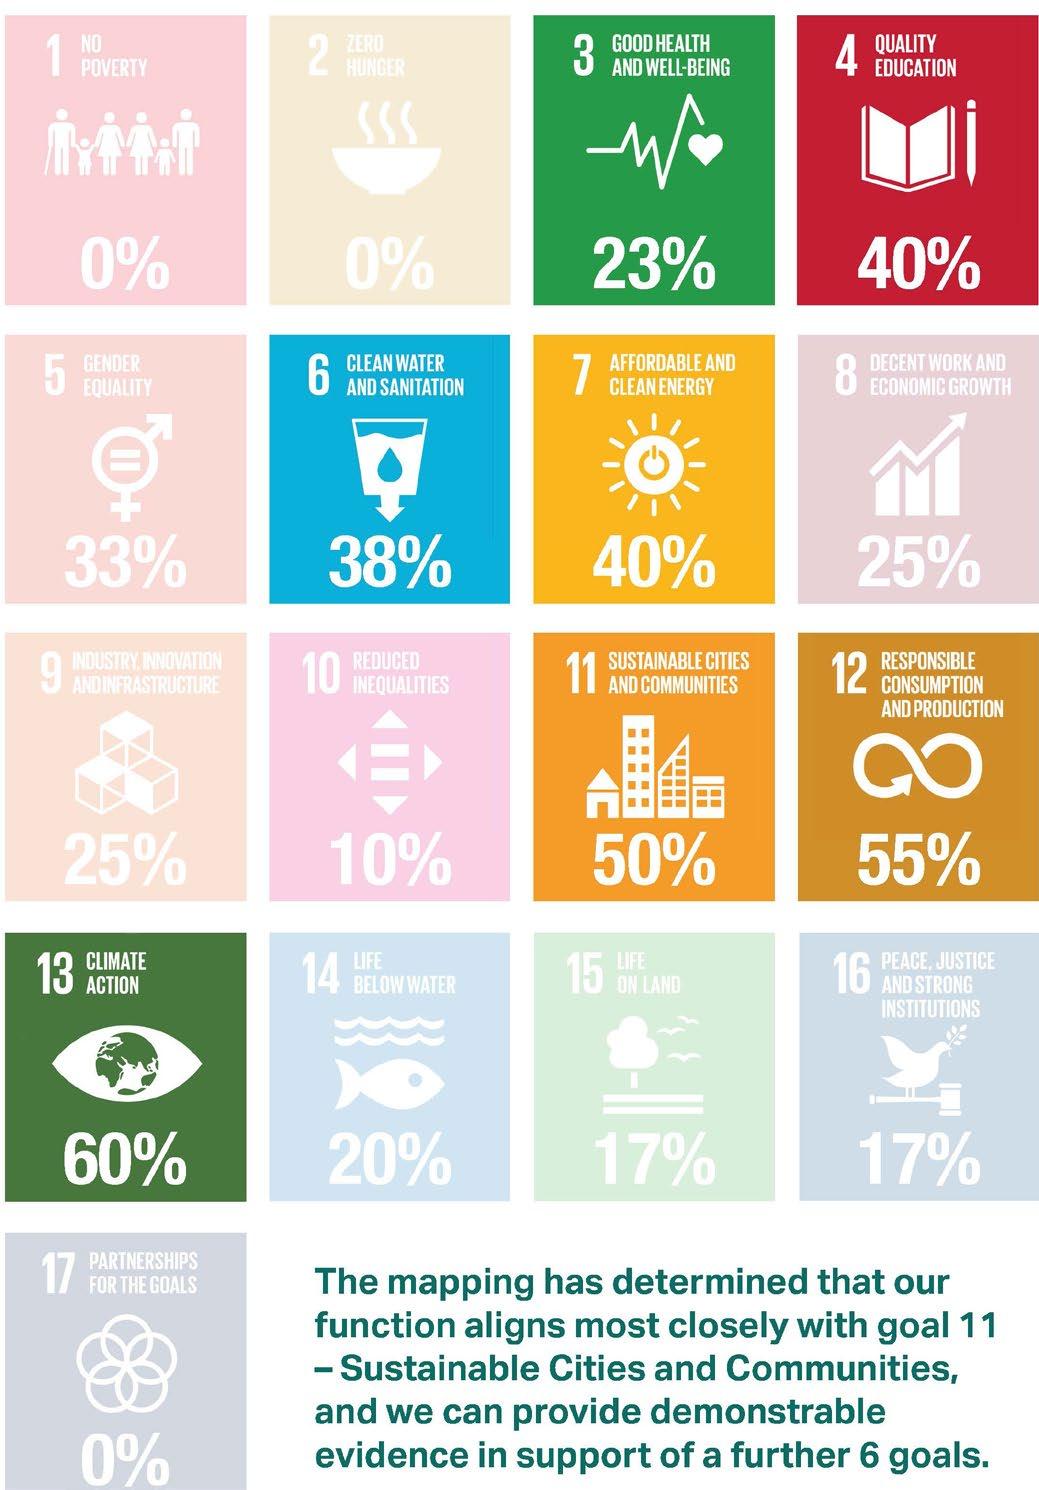
Detailed mapping of the 17 United Nations Sustainable Development Goals (UNSDG’s) has been undertaken to determine the goals we contribute to most effectively and those where there is an opportunity to further our contribution.
The mapping has determined that our function aligns most closely with 6 goals: Sustainable Cities and Communities, Responsible Consumption and Production, Climate Action, Clean Water and Sanitation, Good health and Well-being and Affordable and Clean Energy. Our evaluation and justification are described below:
Sustainable Cities and Communities (Goal 11)
• We have embedded our organisational Policy commitment into our Design Process (Process+) to respond to the climate and biodiversity emergency. Through Process+, all our projects are required to report their Whole Life Carbon impact, which will help us quantify, interrogate, and improve our project impacts on air quality.
• We promote proactive sustainability-led design decision-making and the application of rigorous analytical tools and frameworks such as BREEAM and LEED.
• We are actively involved in protecting and safeguarding the world’s cultural and natural heritage through providing expert design and consultancy advice on heritage buildings including the Grade listed Palace of Westminster Restoration and Renewal Programme.
Internally:
• We promote sustainable travel by providing cycle bike storage and showers in all our offices for employees’ usage.
• We provide fully accessible workplace in all our offices.
• Our ISO 14011 Certification evidences our commitment to reduce operational internal waste and to consider environmental issues related to the operations of our offices such as air pollution and waste management.
Responsible Consumption and Production (Goal 12)
• We use state-of-the-art knowledge, multidisciplinary holistic design and methodology to reduce the embodied carbon associated with new buildings. We apply circular economy principles to ensure materials in designed buildings are retained in use at their highest value for as long as possible and are then reused or recycled, leaving a minimum of residual waste. We undertake OneClick LCA embodied carbon calculations on our projects, promoting circular economy principles and Whole Life Cycle analysis.
• Over the last 18 months we have been developing new processes, guidance documents and tools to ensure all our projects incorporate material circularity principles throughout the design process. The new process introduces setting up a Sustainability Brief and setting up targets at RIBA Stage 1, undertaking a Whole Life Carbon Analysis and developing a Materiality Strategy at RIBA Stages 2, 3, 4 and 5 and an Environmental Assessment at Stage 6.
• Through applying the BREEAM framework on projects, we directly influence contractors to adopt Sustainable Material Procurement methods.
Internally:
• Our waste management approach is ISO 14001 compliant, leading to an organisation-wide reduction in general waste.
• We are actively undergoing campaigns that remind staff to reduce waste and recycle.
• We started initiatives to go disposable-free in London and Manchester canteens.
Climate Action (Goal 13)
• Our fundamental approach to buildings design has been tailored to tackle overheating and future proof buildings for Climate Change resilience. Through extensive thermal dynamic modelling on buildings, passive and sustainable active measures are being implemented to ensure buildings resilience to Climate Change.
• We incorporate flood risk resilience into the drainage and public health design strategy developed on buildings.
• Our approach to tackle Climate Change impact is formalised through our Process+ Design Process, introducing a Climate Change Risk Assessment evaluation at RIBA Stages 2, 3 and 4.
Internally:
• We are committed to setting Science Based Target by 2022 and achieve net zero operational carbon for all UK and Ireland studios by 2025.
Clean water and sanitation (Goal 6)
• Through close collaborative design between Architects, MEP engineers and Landscape Architects, we incorporate water efficiency measures on our projects, including efficient sanitaryware and rainwater harvesting. This contributes to significant water savings across developments in all sectors, including Education, Healthcare, Offices, Residential and others.
Internally:
• Our ISO 14011 certification demonstrates that we are continuously working on reducing our water consumption across all of our offices.
• Part of our water reduction measures include sensors on bathroom taps, waterless urinals, taps upgrades and consideration of the CWS tank cleaning processes.
Quality Education (Goal 4)
• We are renowned for our work in the education sector, delivering cutting edge education facilities that support 21st century education and learning for Harris Academy, the London Borough of Islington, Manchester College, Manchester Metropolitan University, London South Bank University, Manchester City Council, University of Bristol, University of Strathclyde and Watergrove Trust amongst many others.
Internally:
• We provide opportunities for training alongside support through professional subscriptions that enable our employees to develop their knowledge and skills relevant to their profession.
• We have developed a range of initiatives, including our BDP Belonging network, which aims to drive our equity, inclusion and diversity agenda by providing education and training on topics such as race, gender and religion.
• We are in our 9th year of our apprenticeship scheme, bringing young people into built-environment professions. Since taking on the first three apprentices in 2012, we has upskilled 46 apprentices across various professions in Birmingham, London, Manchester and Sheffield.
Good health and well-being
(Goal 3)
• We carry out WELL Certification assessments on buildings. By using the leading tool for advancing health and well-being in buildings globally, we are promoting the implementation of design measures on buildings to improve mental health, well-being, reduce exposure to hazardous chemicals and air, water and soil pollution and contamination.
• We undertake thermal modelling to ensure high standards of air quality in buildings, and natural daylighting measures are an intrinsic part of the design process.
Internally:
• We work closely with our employees and mental health first aiders to help deliver a well-being programme which allows employees to access areas of support, help and advice.
• During the pandemic, we encouraged our employees to stay active by launching #BDPMovesTogether, which is a series of online fitness classes, challenges and motivational webinars open to all UK, Ireland and Canada staff and their immediate family, supported by coaches from Runstars, and special guest speakers.
Affordable and Clean Energy (Goal 7)
• We have formalised our design process to promote energy efficiency, renewable energy and reduce reliability on fossil-fuel technology on each project we are involved in. This is done by setting up a Sustainability Brief and Targets and identifying a Sustainability Champion at Stage 1, undertaking Sustainability Charettes, Environmental Assessments and Green Infrastructure Strategy development at Stage 2, 3 and 4, revaluating the Environmental Assessment at Stage 6 and undertaking a Post Occupancy Evaluation at Stage 7.
Internally:
• 60% of BDP’s UK and Ireland consumed electricity is procured through REGO or GoO renewable tariffs accredited by Ofgem.
• In 2020-21 we maintained both ISO 14001 and 50001 certifications, evidencing our commitment to improving and maintaining our environmental and energy management systems, and compliance with the Energy Savings Opportunity Scheme (ESOS).
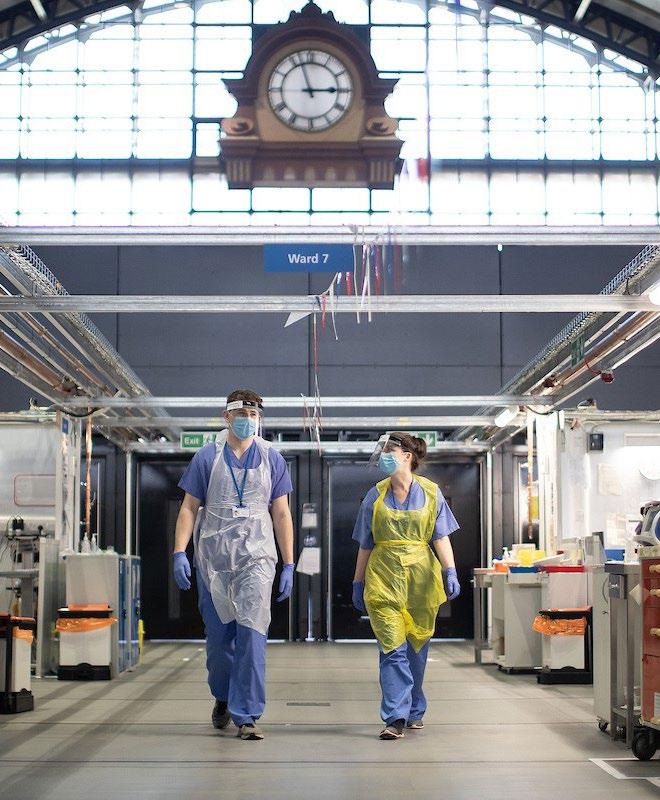
Picture: Nightingale Hospital Northwest
Science Based Targets COVID–19
Science Based Targets (SBTs) show companies how much and how quickly they need to reduce their greenhouse gas (GHG) emissions to meet the emissions reductions required by the 2015 Paris agreement.
We are developing our application to the Science Based Targets Initiative (SBTI). Our proposed targets are as follows:
• Reducing absolute Scope 1 and 2 GHG emissions 46.2% by 2030 from a 2019–20 base year;
• Reducing absolute Scope 3 GHG emissions across Purchased Goods and Services and Capital Goods by 46.2% by 2030 from a 2019–20 base year;
• Increase annual sourcing of renewable electricity from 63% in 2019–2020 to 100% by 2025.
These targets will become embedded within our longterm objectives and will provide a clear and measurable goal for our organisation.
To achieve these reduction targets, we have started to develop processes and procedures that will focus on improving the energy efficiency of its supply chain, with a particular focus on increasing the stringency of procurement controls. We are looking to implement a rigorous process where procurement of energy consuming products e.g., IT is suitably validated.
While the COVID–19 pandemic impacted our environmental performance as a business, we also recognise that a global event can impact our staff in a more holistic nature. In the 2020–21 financial year we have continued to follow government guidance. This has involved working-from home when possible, only moving to a hybrid approach when it was safe to do so.
Studios have remained open for those who could not work adequately from home, and precautions such as regular lateral flow testing and temperature scanners in our studios have ensured that our staff safety and wellbeing was a prioritised.
We also implemented an allowance of 14 days to work abroad in order to account for quarantine restrictions in various countries that could be changeable at short notice. This also enabled those who had been away from home and family for prolonged periods to extend their trips.
Supporting our staff by upgrading the infrastructure in our studios to facilitate processor-heavy software alongside the supply of suitable remote working equipment such as second screens and chairs aims to enable our staff to work as effectively from home as we can from the studios. We expect to retain a hybrid working pattern as we emerge from the pandemic.
Detailed Performance
The following section summarises our environmental performance during 2020–2021, based on comparison to our previous reporting year 2019–2020. We acknowledge that submetering is required to enable more effective interventions and utility cost savings, hence sub-metering is an important consideration when determining new studio leases.
Carbon and Energy
The tables and graphs below provide a summary of our 2020–2021 energy consumption and carbon emissions against the previous year (2019–2020).
Carbon Conversion Factors
The emissions values were calculated using carbon conversion factors from the Department for Business, Energy and Industrial Strategy (BEIS). The carbon conversion factors are revised each year and vary due to the mix of energy sources generated in the UK, and internationally imported.
This year, the UK electricity (kgCO2e/kWh) carbon conversion factor has decreased as a result of a significant decrease in coal generation, and an increase in renewable and nuclear generation compared to the previous year.
Our Sheffield office is supplied by the local Veolia District Heat network with a carbon factor of approximately 0.12 kgCO2e/kWh. It is also important to note that carbon factors for electricity and natural gas in Ireland are higher than those in the UK at 0.33599 and 0.2040 respectively.
For our international studios the emissions values were calculated using carbon conversion factors from the Association of Issuing Bodies, the Dubai Electricity and Water Authority, and Climate Transparency, via the Carbon Footprint database. As in the UK, the carbon conversion factors are revised each year and vary depending on factors within each country such as energy sources.
Figure
Figure
Heating Demand
There has been a 3.4% reduction in UK and Ireland overall gas consumption (Scope 1) in FY 2020–21. This is mirrored in the heating degree days which were reduced for all but the Dublin and Bristol studios. As would be expected, reduced HDD correlates with reduced demand for heating. This increase in HDDs shown in Bristol could then explain why Bristol’s gas emissions per capita are the highest of all our studios.
However, this is not the case in Dublin, which has an increase in HDDs but reduced its gas consumption. The reduction is attributed to the COVID–19 pandemic, where the studios were empty while BDP followed the work from home guidance issued by the government.
The carbon conversion factors for gas have increased slightly, which is why the emissions per capita for scope 1 (gas kWh) has increased by 5.8% compared to last year. This is counteracted by the scope 2 (electricity kWh) emissions which reduced by 12.0% per capita. The result is that our Scope 1&2, and overall emission figures show a reduction. This shows the importance of measuring our performance in greater granularity to understand which areas we can make improvements.
Electricity Demand
The UK and Ireland electricity consumption (Scope 2) for FY 2020–21 has reduced by 10.9%. This is compared to the previous year (2019–20) and it is therefore clear that the COVID–19 pandemic has been a factor in the reduction. When we moved to home working, some studios were kept open to allow for anyone who was not able to work from home, but were advised to save energy where possible such as turning of lights in areas where there were no staff present.
Interventions
The improvements in gas and energy can in part be attributed to our studio initiatives. The London studio has replaced back stairs lighting with LEDs, saving around 1,100kWh/yr. The Manchester studio redeveloped their communications room in 2020 to incorporate new more efficient chillers, in addition to replacing 95% of their lights with LED. Glasgow studio introduced the use of electronic drawing devices, to eliminate need for printing. And lastly, Bristol expanded staff responsibilities to include energy saving initiatives. These include switching lights and coffee machines off, in addition to increased communication and reminders.
60.2% of our global electricity contracts are REGO backed renewable energy. This is based on the proportion of renewable electricity confirmed relative to the global total electricity consumed. The London, Glasgow, Sheffield, Dublin studios within the UK and Ireland are powered by REGO backed renewable electricity, and the global total figure excludes the Singapore and Delhi studios where electricity consumption is unknown.
Weather Normalisation
Heating Degree Days (HDDs) are a measurement designed to quantify the demand for energy needed to heat a building based on outside air temperature.
Often, an increase in HDD can result in an increase in gas consumption. However, over the last two years this pattern has become less clear as the COVID–19 pandemic resulted in periods of working from home and hybrid working in which gas usage was reduced. Longer term we expect this correlation to return, and may also expect to see the HDD reducing each year as global temperatures rise. Part of our sustainability aspirations is to help limit global temperatures. The gas consumption in kWh data and therefore HDDs calculated are for our UK and Ireland studios.
The Heating Degree Day’s data for the UK and Ireland for the FY 2020–21 was obtained from https://www. degreedays.net /. The weather stations were selected based on their proximity to each studio. Birmingham 2018–2021 Dublin
2018–2021
Tables 5, 6 and 7 show water consumption per studio and per capita, compared to last year’s consumption for UK and Ireland. The majority of our studios have reduced water consumption – only Birmingham and Bristol have increased water consumption. Overall, this results in a reduction of total water consumption by 63.7%. Bristol and Birmingham had the highest water consumption per capita in 2019–20, and their further increase could be due to a staff increase at the Birmingham studio.
Our improvements in total water consumption across our studios may be in part due to the move to hybrid working patterns through the COVID–19 pandemic, resulting in a reduced number of staff using studios facilities. However, we are committed to ensuring our water consumption is reduced despite return to greater studio-based work post-pandemic. This will be achieved through review of existing measures and analysis of opportunities to reduce water consumption each year.
(m3)
(m3/person)
Figure 3: Water consumption per studio (m3)
Figure 4: Water consumption per studio per capita (m3/person)
Business Travel
Choosing the most sustainable mode of transport for business travel is one way we reduce our impact on the environment. Our total miles of travel for flights, trains, taxi’s and private cars has reduced this year, with the significant reduction in flights attributed to the COVID–19 pandemic.
Overall travel miles have reduced by 94.9% compared to last year. Company car travel has increased which may be due an effort to reduce public transport use during the pandemic. We hope to continue this reduction of business travel, and encourage using Microsoft Teams for meetings wherever possible to reduce our impact on the environment.
Materials and Waste
All of our UK and Ireland studios have in place robust waste management procedures to ensure that we are accountable for the waste we produce and make every effort to maximise waste diversion from landfill. Waste management procedures vary considerably between each studio. For example, in some studios comingled waste is collected for sorting and recycling off site, whilst in other studios waste is separated at source.
In our Sheffield studio, un-recyclable waste feeds into the local Veolia district heat system that supplies our building with heat, and in London our chosen waste contractor First Mile collects waste and coverts it to energy to power London homes.
Total non-electrical waste has reduced by 77% compared to FY 2019–20, with the largest waste stream being comingled recyclables. This significant reduction can in part be attributed to the COVID–19 pandemic in which use of our studios was reduced as we continued following government advice to work from home. However, we are hopeful that our studio interventions have also contributed to this reduction, and are committed to reducing waste when we return to studio-based working. We will be working to assess where we can reuse materials and reduce waste through our supply chains, implementing circular economy principles where viable.
Table 8: Business travel by mode of transport (miles) (UK&I)
Figure 5: Total business travel by mode (miles) (UK&I)
Figure 6: Total waste by waste stream (kg)) (UK&I)
Procurement and Environmental Improvements
We have renewed our commitment to a responsible procurement policy, which requires consideration of the following when making procurement decisions:
• The environmental impact of goods or services in their manufacture;
• The energy performance of any new electrical or mechanical item;
• The life cycle cost of the item, factoring capital cost, maintenance implications, replacement cost and end of life disposal;
• Ethical sourcing of products and services, to ensure that employees are treated fairly and that materials are obtained legally;
• Supply-chain management to ensure that value is maximised through purchasing power;
• Legal compliance.
BDP has put a strategy in place so that for the procurement of individual energy consuming office items purchased in multiples, over the value of £200, or any other high electricity consuming items such as kettles, toasters and fans, at least 3 models are compared. Where there is an energy saving > 10% available, the more energy efficient model is selected, unless there are other significant reasons for selecting an alternative (e.g. dimensions / availability of space).
We are focussed on improving the stringency of our procurement controls, which will be fundamental in our pursuance our Science Based Target, where we are proposing to reduce absolute Scope 3 GHG emissions from Purchased Goods and Services and Capital Goods by 46.2% by 2030 from a 2019-20 base year.
Although our IT infrastructure has increased significantly to accommodate staff working from home in response to the COVID-19 pandemic, we are working hard to reduce this impact and expect it to reduce as we return to greater studio-based working.
In addition, we have started collecting and analysing spend data, which will give another angle to our procurement analysis. Understanding spending patterns can help us to determine how closely we are aligning with our procurement policy and identify opportunities for improvements. In line with our work to broaden our understanding of our Scope 3 impacts, we aim to incorporate this analysis in our next annual statement.
During the FY 2020–21, we have been successful at reducing our carbon emissions, energy consumption, water consumption and waste. This is due to several factors including interventions and the COVID–19 pandemic. Our interventions will continue to be determined based on those that offer the greatest benefit to our working environment, appropriate to our commercial position and length of lease (where investment is required).
We will continue to review the relevance of targets, and adapt or amend where we feel necessary. In doing this we will ensure that we continue to drive down our environmental impact.
Carbon Emissions
Our carbon emissions reduced by 6.1% overall, and 7.3% per capita. When this is shown per studio, our Bristol studio has the highest emissions per capita, while our Birmingham studio has the lowest.
Energy
Our energy consumption was reduced by 8% overall, and 9.6% per capita. Similar to carbon emissions, the Bristol studio has the highest energy consumption per capita.
Water
Our water consumption has reduced by 63.7% overall, and by 64.2% per capita. While our London studios consumed the most water as expected for its size, when this is per capita it is shown that Bristol has the highest consumption.
Waste
Our total waste (in kg) was reduced by 77%, with the largest waste stream being comingled recyclables.
The following graphs summarise our performance throughout the FY 2020–21, compared to FY 2019–20 and FY 2019–18.
Future Projections 2021–2022 Action Plan
Our projected energy and water consumption and CO2 emissions for our UK and Ireland studios, based on the trend analysis from 2011, are shown below. The graphs highlight that we need to continue to be making meaningful and consistent reductions in

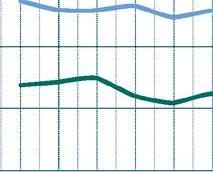

order to stay below our targets and progress towards a reduced environmental impact. We are ambitious with our goals, and our Science Based Target will consolidate the scientific reasoning behind our targets.
Studio-based Action Plan
Studio Action Plan for the forthcoming year
Birmingham
Bristol
• Works will be carried out to boardroom to improve meeting conditions - items will be purchased centrally in line with IT procurement policy.
• Replacement of lighting with LED fittings.
• Workshops to discuss achieving net zero carbon by 2025.
• Expand vegan and vegetarian food deliveries.
Dublin
Glasgow
London
Manchester
Sheffield
• Refurbishment of ground floor and incorporation of sustainability considerations into the design.
• Will seek to maintain close to zero waste on return to office.
• Plan for 3rd floor to have no PC’s, be a collaborative meeting space where staff bring laptops and connect remotely to mini PC in basement.
• Plans to replace remaining 5% of lighting to LEDs as they come to the end of their life.
• CBRE to replace stairwell and external lighting with LED.
• Assess feasibility for a more minimal fit out to selected rooms.
BDP Action Plan
We have set broader targets for our environmental management at BDP and have identified some targets we aim to make process towards within the next financial year:
• Increase our monitoring, this will include:
- Expanding current metrics to international studios,
- Introduction of spend data as a monitored metric both UK and Ireland, and International.
• Expand training and involvement of Sustainability Champions within projects and internal sustainability.
• Develop our policy on social value, and develop monitoring and processes around social value metrics.
• Submit our SBT application to set a 46.2% reduction in Scope 1, 2, and 3 emissions by 2030 from a 201920 base year.
• Increase the percentage of our studios on certified renewable energy tariffs.
• Agree and implement an offsetting strategy to mitigate the impacts of studio operations.
• Develop a formal sustainability marketing strategy to support internal and external communications.
• Implement new reporting platforms to improve our performance data collection and analysis process.
• Develop procurement guidance and requirements alongside the development of an emerging customer relationship management platform.
International Studios
We have collected consistent data for energy consumption in our international studios for FY 2020–21. This allows for a comparison between international studios and between the UK and Ireland studios which have been monitored more closely over previous years. As stated in our long-term goals and action plan for next year, we will be expanding the scope of the metrics we monitor and intend to incorporate regular and detailed monitoring of these international studios into our annual reporting.
The carbon intensity of this energy consumption will also vary depending on location. We also need to work to ensure that any carbon normalisation is consistently applied to the kWh figures provided from each region.
The energy consumption and emissions data is shown below in Table 10. We intend to incorporate comparison with previous years to identify trends as with our UK and Ireland studios.
In China, the lower consumption results in higher emissions because of applying a grid-average carbon conversion factor where much of China’s energy comes from non-renewable source.
The extent of the international studio performance monitoring is shown in the illustration below.
NETHERLANDS
The data shows that our China studio has
Table 10: Breakdown of energy consumption and associated emissions across BDP’s international studios
Figure 9: Comparison of electricity consumption across international studios
Figure 10: Global data availability complexion


