Industry Report | Industrial production and trade in the individual industries 17/05/2018
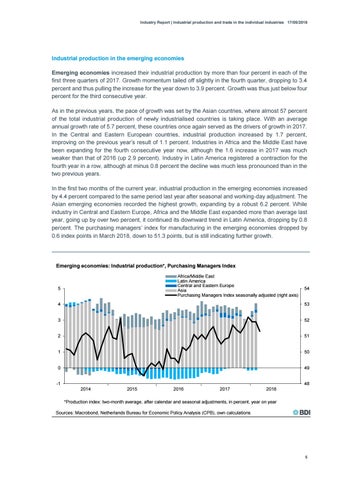
Industrial production in the emerging economies Emerging economies increased their industrial production by more than four percent in each of the first three quarters of 2017. Growth momentum tailed off slightly in the fourth quarter, dropping to 3.4 percent and thus pulling the increase for the year down to 3.9 percent. Growth was thus just below four percent for the third consecutive year. As in the previous years, the pace of growth was set by the Asian countries, where almost 57 percent of the total industrial production of newly industrialised countries is taking place. With an average annual growth rate of 5.7 percent, these countries once again served as the drivers of growth in 2017. In the Central and Eastern European countries, industrial production increased by 1.7 percent, improving on the previous year’s result of 1.1 percent. Industries in Africa and the Middle East have been expanding for the fourth consecutive year now, although the 1.6 increase in 2017 was much weaker than that of 2016 (up 2.9 percent). Industry in Latin America registered a contraction for the fourth year in a row, although at minus 0.8 percent the decline was much less pronounced than in the two previous years. In the first two months of the current year, industrial production in the emerging economies increased by 4.4 percent compared to the same period last year after seasonal and working-day adjustment. The Asian emerging economies recorded the highest growth, expanding by a robust 6.2 percent. While industry in Central and Eastern Europe, Africa and the Middle East expanded more than average last year, going up by over two percent, it continued its downward trend in Latin America, dropping by 0.8 percent. The purchasing managers’ index for manufacturing in the emerging economies dropped by 0.6 index points in March 2018, down to 51.3 points, but is still indicating further growth.
Emerging economies: Industrial production*, Purchasing Managers Index Africa/Middle East Latin America Central and Eastern Europe Asia Purchasing Managers Index seasonally adjusted (right axis)
5
54
4
53
3
52
2
51
1
50
0
49
-1
48 2014
2015
2016
2017
2018
*Production index: two-month average, after calendar and seasonal adjustments, in percent, year on year Sources: Macrobond, Netherlands Bureau for Economic Policy Analysis (CPB), own calculations
5