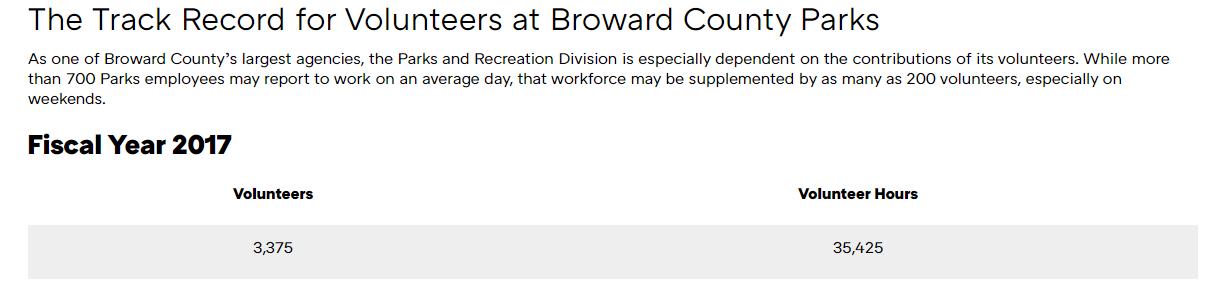
Broward County Parks and Recreation Master Plan 2022
The Broward County Parks and Recreation Division, established by the Broward County Board of County Commissioners in February 1956, cordially invites you to peruse and enjoy our agency’s first system-wide Master Plan.
Thank you to the many citizens, staff, and community groups who helped make this accomplishment possible!
Acknowledgements
Broward County Commissioners
Mayor Lamar P. Fisher, District 4
Vice-Mayor Nan H. Rich, District 1
Mark D. Bogen, District 2
Michael Udine, District 3
Steve Geller, District 5
Beam Furr, District 6
Tim Ryan, District 7
Robert McKinzie, District 8
Hazelle P. Rogers, District 9
Broward County Administration
Monica Cepero, County Administrator
Kimm Campbell, Deputy County Administrator
Kevin Kelleher and Michael W. Ruiz, Assistant County Administrators
Bertha Henry, Former County Administrator
Broward County Parks & Recreation Division
Dan West, Director
Erik Westberg, CPRP, Assistant Director
Mary Noe, Administrative Manager
Chris Deal, CPRP, Superintendent
Trevor Fell, CPRP, Superintendent*
Tim Waln, CPRP, CPM, Superintendent
Gayle Preston, Former Assistant Director
Adrian Anghel, Information Systems Manager
Cyndy Baker, Manager, Public Communications and Outreach
Linda Briggs, Environmental Program Manager
Mehrdad Fayyaz, Capital Program Administrator
George Gregory, Human Resources Officer
Cathy Hagen, Administrative Officer, Senior
Kelton Harvey, Budget and Contracts Manager
Meoshi Jackson, Administrative Officer**
Nicolas Ortiz, CPRP, Parks Manager**
Edgar Ruiz, Operations Manager
Jay Sanford, Program/Project Coordinator, Senior
* Project Team Lead
** Project Team
Acknowledgements
Parks & Recreation Advisory Board
Arthur L. McNeil, Chair
Terry Danger, Vice-Chair
Michelle Brown • Joseph Carter • Christina Clifford • Monroe D. Kiar • Lawrence Martin
Howard Garson • Bill Gilmartin • Javier Lasaga • Dan Mulieri • Howard Nelson
Kristen Reineke • Derek Silver
Marine Advisory Committee
John Fiore, Chair
Barry S. Webber, Vice-Chair
Douglas G. Beals • Clifford Berry II • Suzanne Cutrone • Penny Cutt
Mark Ercolin • Peter G. Grady • Kelvin Haynes • James M. Mathie • Clive E. Taylor
Urban Wilderness Advisory Board
Roberto Fernández III, Chair
Ken Evans, Vice-Chair
Marcey Carabelli • Diana Guidry • F. David Markward
Charlotte Mather-Taylor • Thomas D. Oates • Sen. Eleanor Sobel
Roy Rogers, Chair Emeritus
Acknowledgements
Consulting Team
PROS Consulting Inc.
Neelay Bhatt, Vice-President and Principal Consultant
Phil Parnin, Associate Principal
Brayton McClure, Senior Project Manager
Chen Moore
Cristóbal Betancourt, Vice-President
Jennifer Cook, Landscape Designer
Barth Associates
Dr. David Barth, President (Deceased)
Carlos Perez, Principal Consultant
Adams Consulting
Pamela Adams, President
Davicka Thompson, Vice-President
ETC Institute
Chris Tatham, CEO
Chapter One Executive Summary
1.1. Introduction
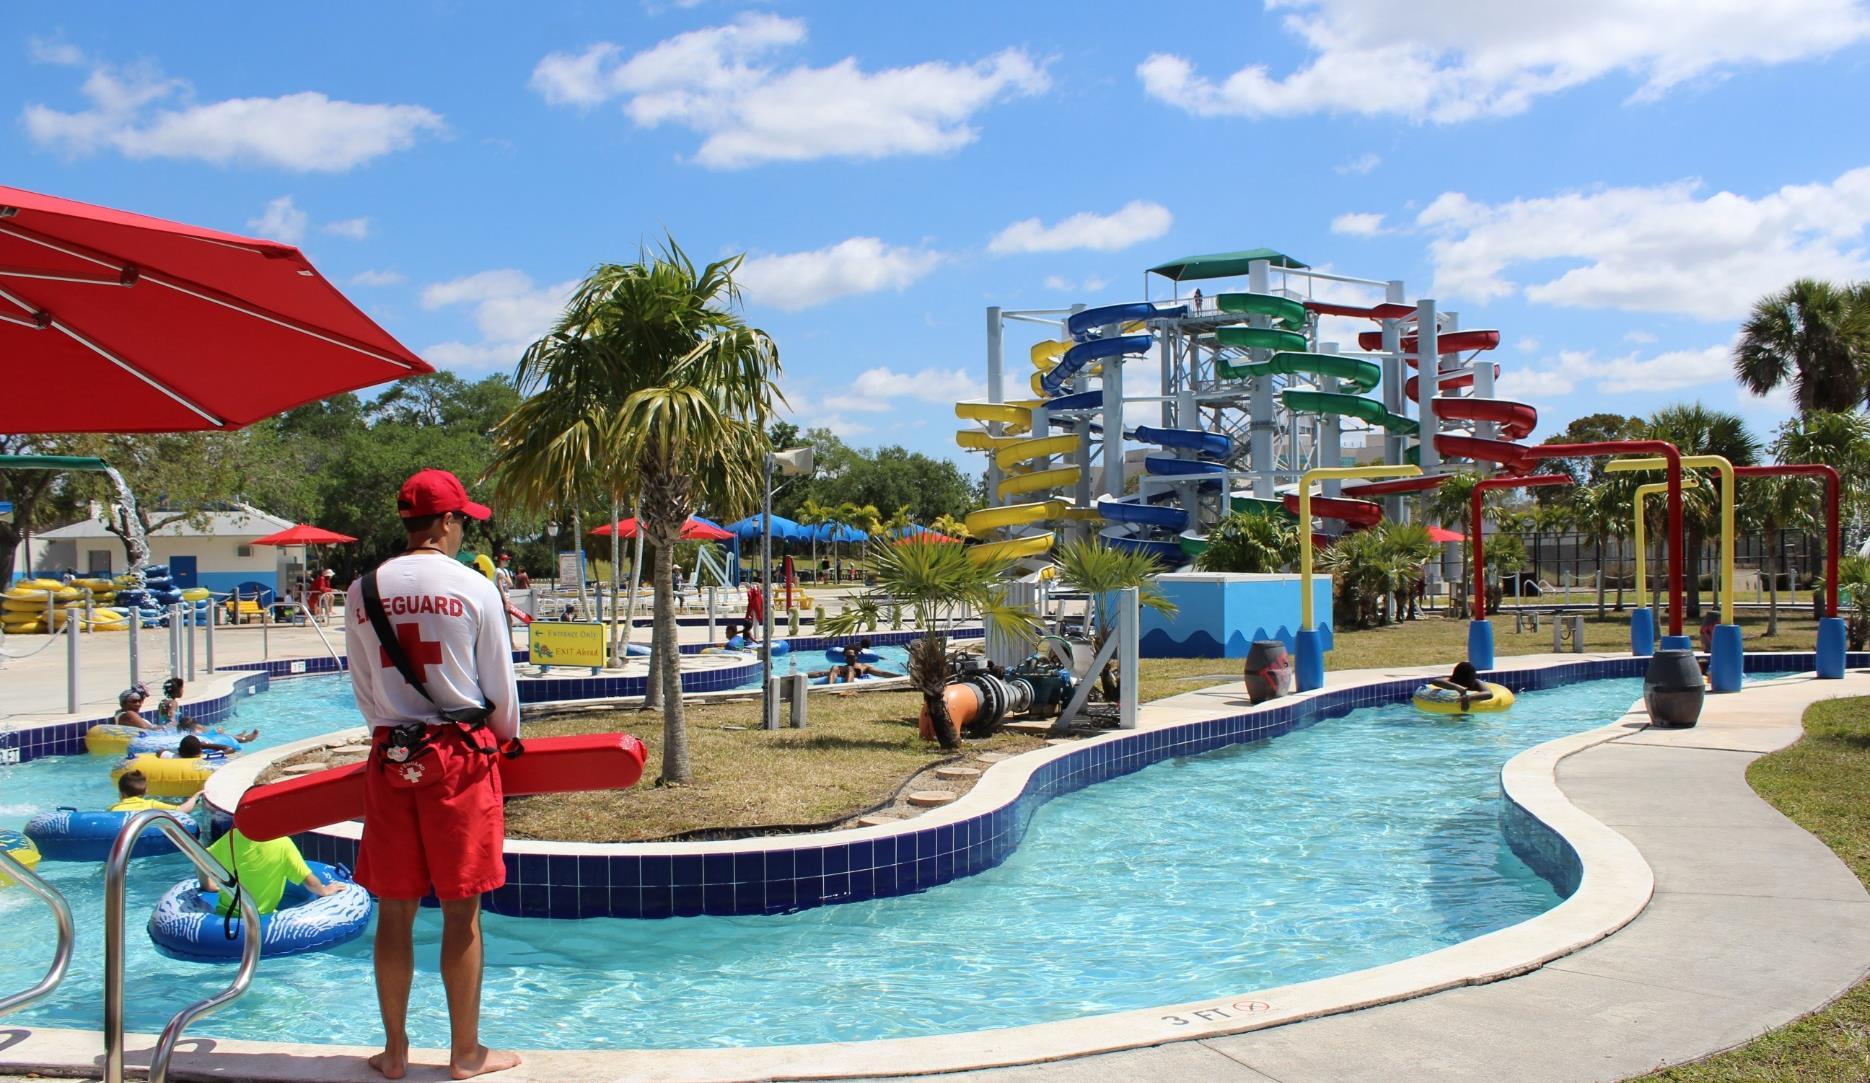
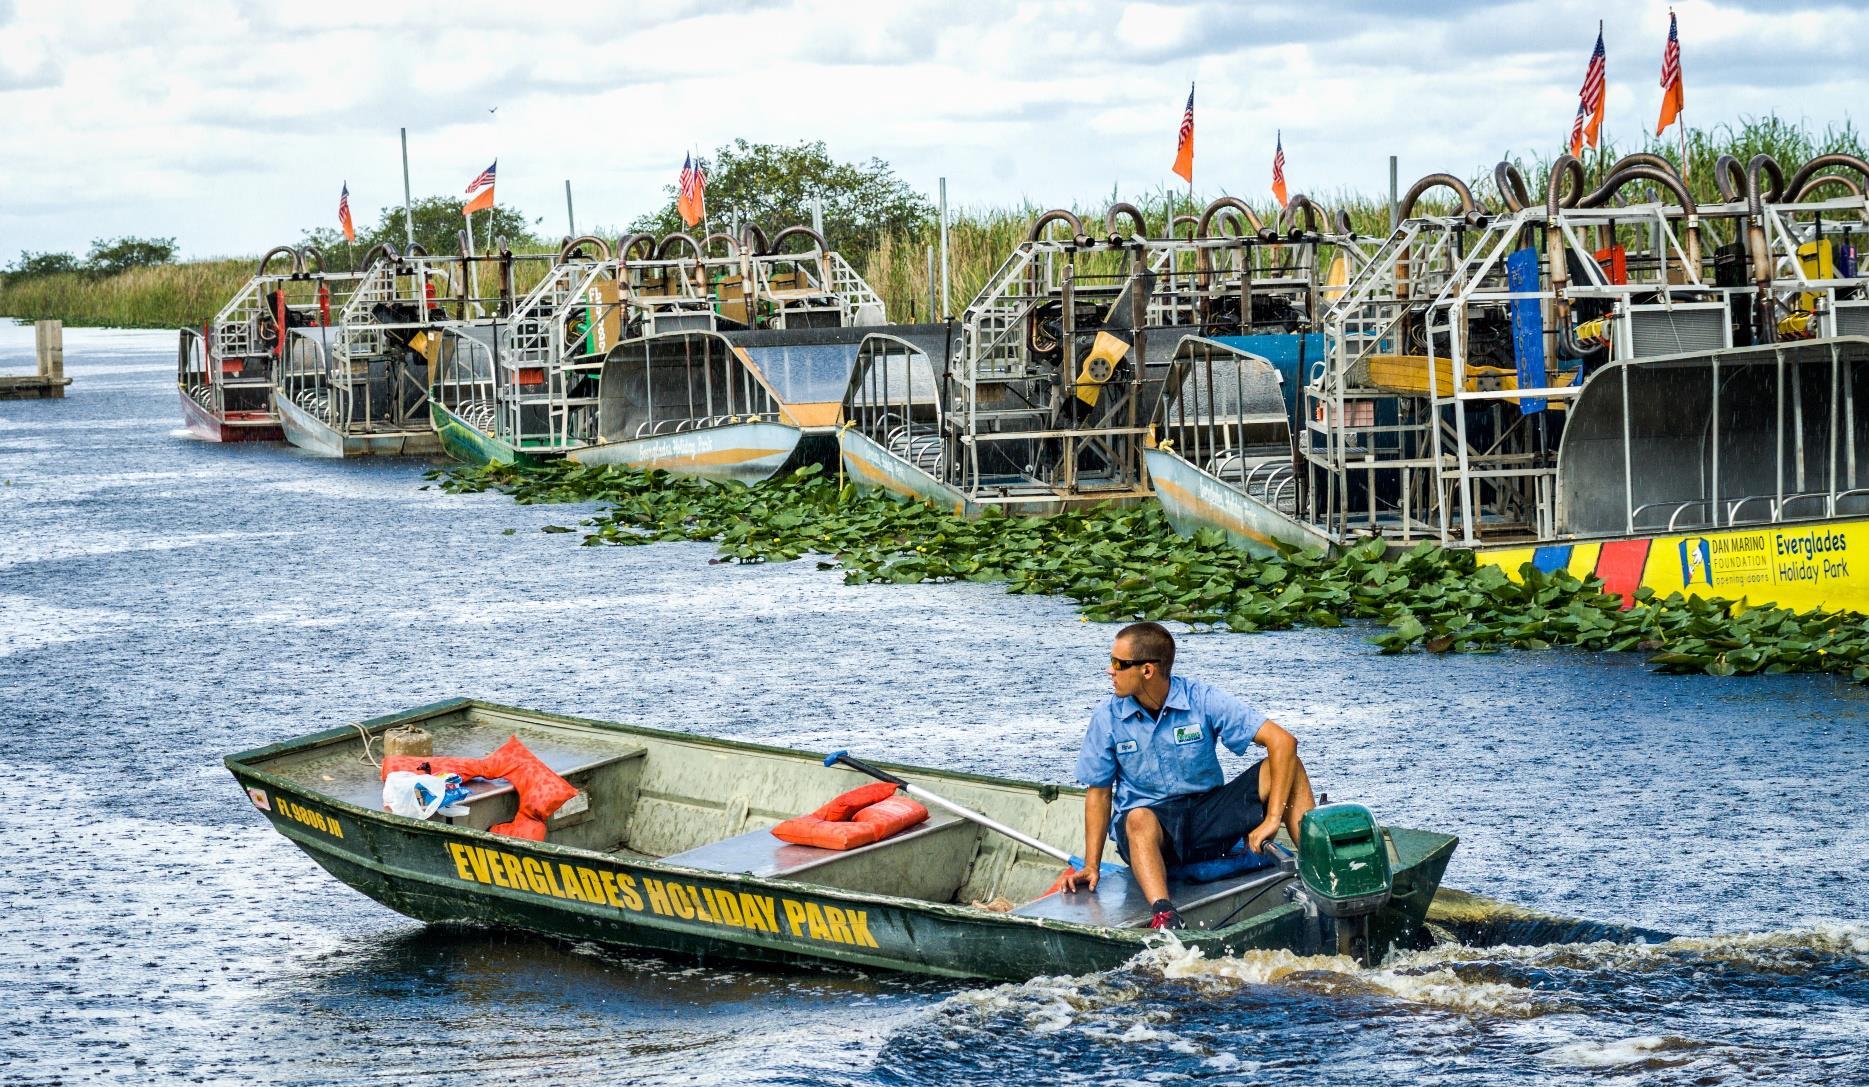
In Broward County (“County”), “SUNsational Service” is as plentiful as sunshine. The Parks and Recreation Division (“Division”) embodies the County’s world-class customer service philosophy, and for good reasons. The Division is responsible for preserving one of the most diverse ecosystems, parks system, and world-class facilities while balancing the use by residents and international visitors. Residents and visitors are fortunate to have access to a recreational smorgasbord of programs, athletics, and nature education experiences across the County.
During the Parks and Recreation System Master Plan (“Plan” or “Master Plan”) process, the United States had to take precautions against the spread of COVID-19, later to become the COVID pandemic. The Division’s ability to pivot in the early stages of the pandemic was swift and beneficial to many residents. Preparing parks to become testing and vaccination locations was instrumental to public health. Equally impressive was the Division’s dynamic approach to reopening parks and services under COVID protocols while managing fluctuating staffing levels. This dedication to ensuring that essential services and parks were available for physical, social, and emotional well-being demonstrates a commitment to the quality of life, even under the most difficult circumstances.
This is the first-ever systemwide Master Plan developed for the Division and is intended to be a dynamic and forward-thinking road map to help fulfill the vision of Better Parks, Better Broward.
1.2. Strategic Plan Objectives
The County and the Division selected PROS Consulting Inc. to assist in completing a 10-year Master Plan. The primary purpose of this Plan is to help determine the future of parks and recreation offerings for a fastgrowing and highly diverse population that calls Broward County home as well as the many more who visit the South Florida area. The following goals were identified as key to achieving the outcomes of this planning process:
Engage the diverse Broward County community, leadership, and stakeholders through an innovative public-outreach process to build a shared vision for parks, facilities, and recreation services for the next 10 years.
Utilize a wide variety of data sources and best practices, including a statistically valid survey to predict trends and patterns of use and how to address unmet needs in Broward County.
Shape financial and operational preparedness through innovative and “next” practices to achieve the strategic objectives, performance measures, and recommended actions.
Determine unique action steps for the County to ensure reliable and sustainable operations, and capital management for parks and amenities in Broward County.
Develop a dynamic and realistic strategic plan that creates a road map to ensure long-term success and financial sustainability for Division parks, recreation programs, and facilities, as well as action steps to support the family-oriented community and businesses in the surrounding areas
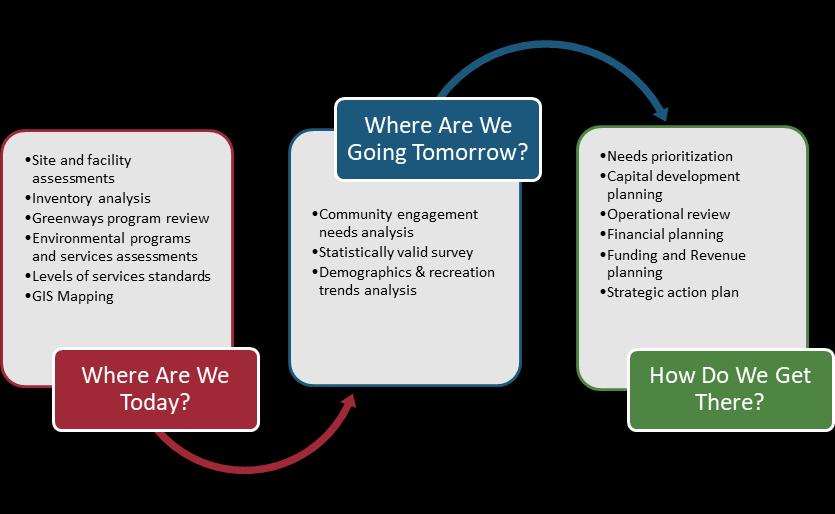
1.3. Planning Process
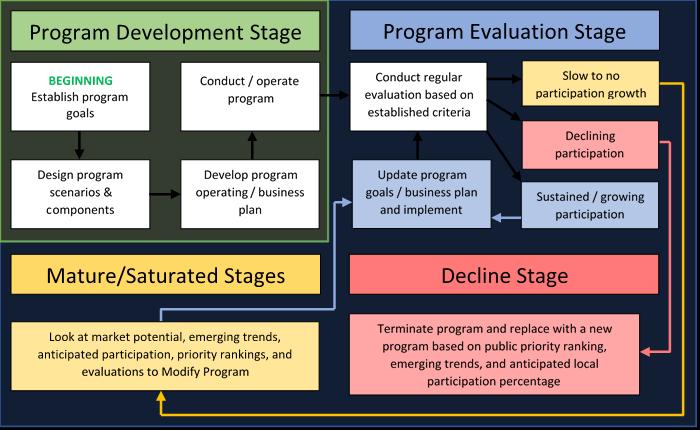
The Plan followed a process of data collection, public input, on-the-ground study, assessment of existing conditions, market research, and open dialogue with local leadership and key stakeholders. The project process followed a planning path, as illustrated be
1.4. Vision, Mission, Values, & Big Moves
The Division focuses on the three pillars from its Mission: “Recreation. Preservation. Education.” Through a workshop, staff leveraged these pillars, community input, demographic data, current recreational trends, and the system analysis to establish core values for the Division’s future parks, trails, programs, facilities, and operations.
With participation from 141 Division employees from diverse backgrounds and across all areas of operations, the workshop resulted in the creation of Core Values and Big Moves, aligned with the existing Mission and Vision statements.
1.4.1. Mission
Recreation. Preservation. Education.
The Parks and Recreation Division is dedicated to providing a countywide park system with diverse facilities and recreation opportunities, along with natural area conservation and research-based educational outreach, to enhance the well-being of all residents, businesses, and visitors.
1.4.2. Vision
The Broward County Parks and Recreation Division envisions:
Opportunities for Recreation through programs, events, and facilities that provide a sense of community and enhance the quality of life
Preservation of our natural resources, open spaces, and environment through responsible management and stewardship
Innovative programming to promote Education through learning experiences for all segments
1.4.3. Core Values
Community Development
Customer Service Excellence
Diversity, Equity, and Inclusion
Enrichment
Environmental Sustainability/Resilience
1.4.4. Big Moves
The following Big Moves are the key outcomes that can help shape the legacy of this Master Plan as one looks back 10 years from now:
1. Create a world-class and truly inclusive guest experience.
a. Centralize onboarding staff (similar to Disney’s traditions), establish standards (consistent onboarding and training process), and simplify processes.
b. Ensure adequate staffing levels and training to deliver great service.
2. Develop specialty parks and signature elements unique to Broward County.
3. Ensure long-term financial sustainability with dedicated funding.
a. Prepare for a potential bond measure, reinvest earned income, develop ecotourism services, fees and charges increase with enterprise system potential, and cost containment measures.
4. Incorporate green initiatives, resilience, and environmental sustainability in all aspects of operations, especially return on investments.
5. Pursue National (re)Accreditation and second Gold Medal Award.
1.5. Key Findings
Based on the assessment of the County’s parks and recreation system, key findings were identified to support the implementation of the Plan. These key findings help guide decision-making for the next 10 years.
1.5.1. Demographics & Trends DEMOGRAPHICSSUMMARY
Population:
1,907,040 people live in Broward County
The County is expected to grow to an estimated 2,220,894 residents by 2034
Race & Ethnicity:
58% of the population is White Alone
29% of the population is Black Alone
31% of the population is of Hispanic/Latino origin
Age:
Median age: 41.2 years
By 2034, the 55+ age segment will encompass 38% of the population
Income:
Median household income: $57,848
Median household income is higher than the state average but lower than the national average
LOCALRECREATIONTRENDSSUMMARY
Overall, the County’s residents demonstrate participation trends that have above-average potential index numbers in three of the four categories analyzed (general sports, fitness, and commercial recreation) plus outdoor fitness. Recreation of particular interest includes:
Participation in sports such as tennis, soccer, and baseball.
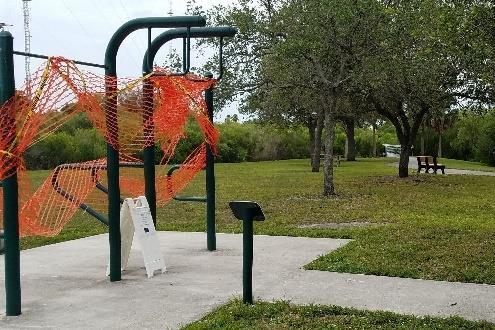
Outdoor fitness equipment and fitness-related programming in Zumba, yoga, and aerobics classes.
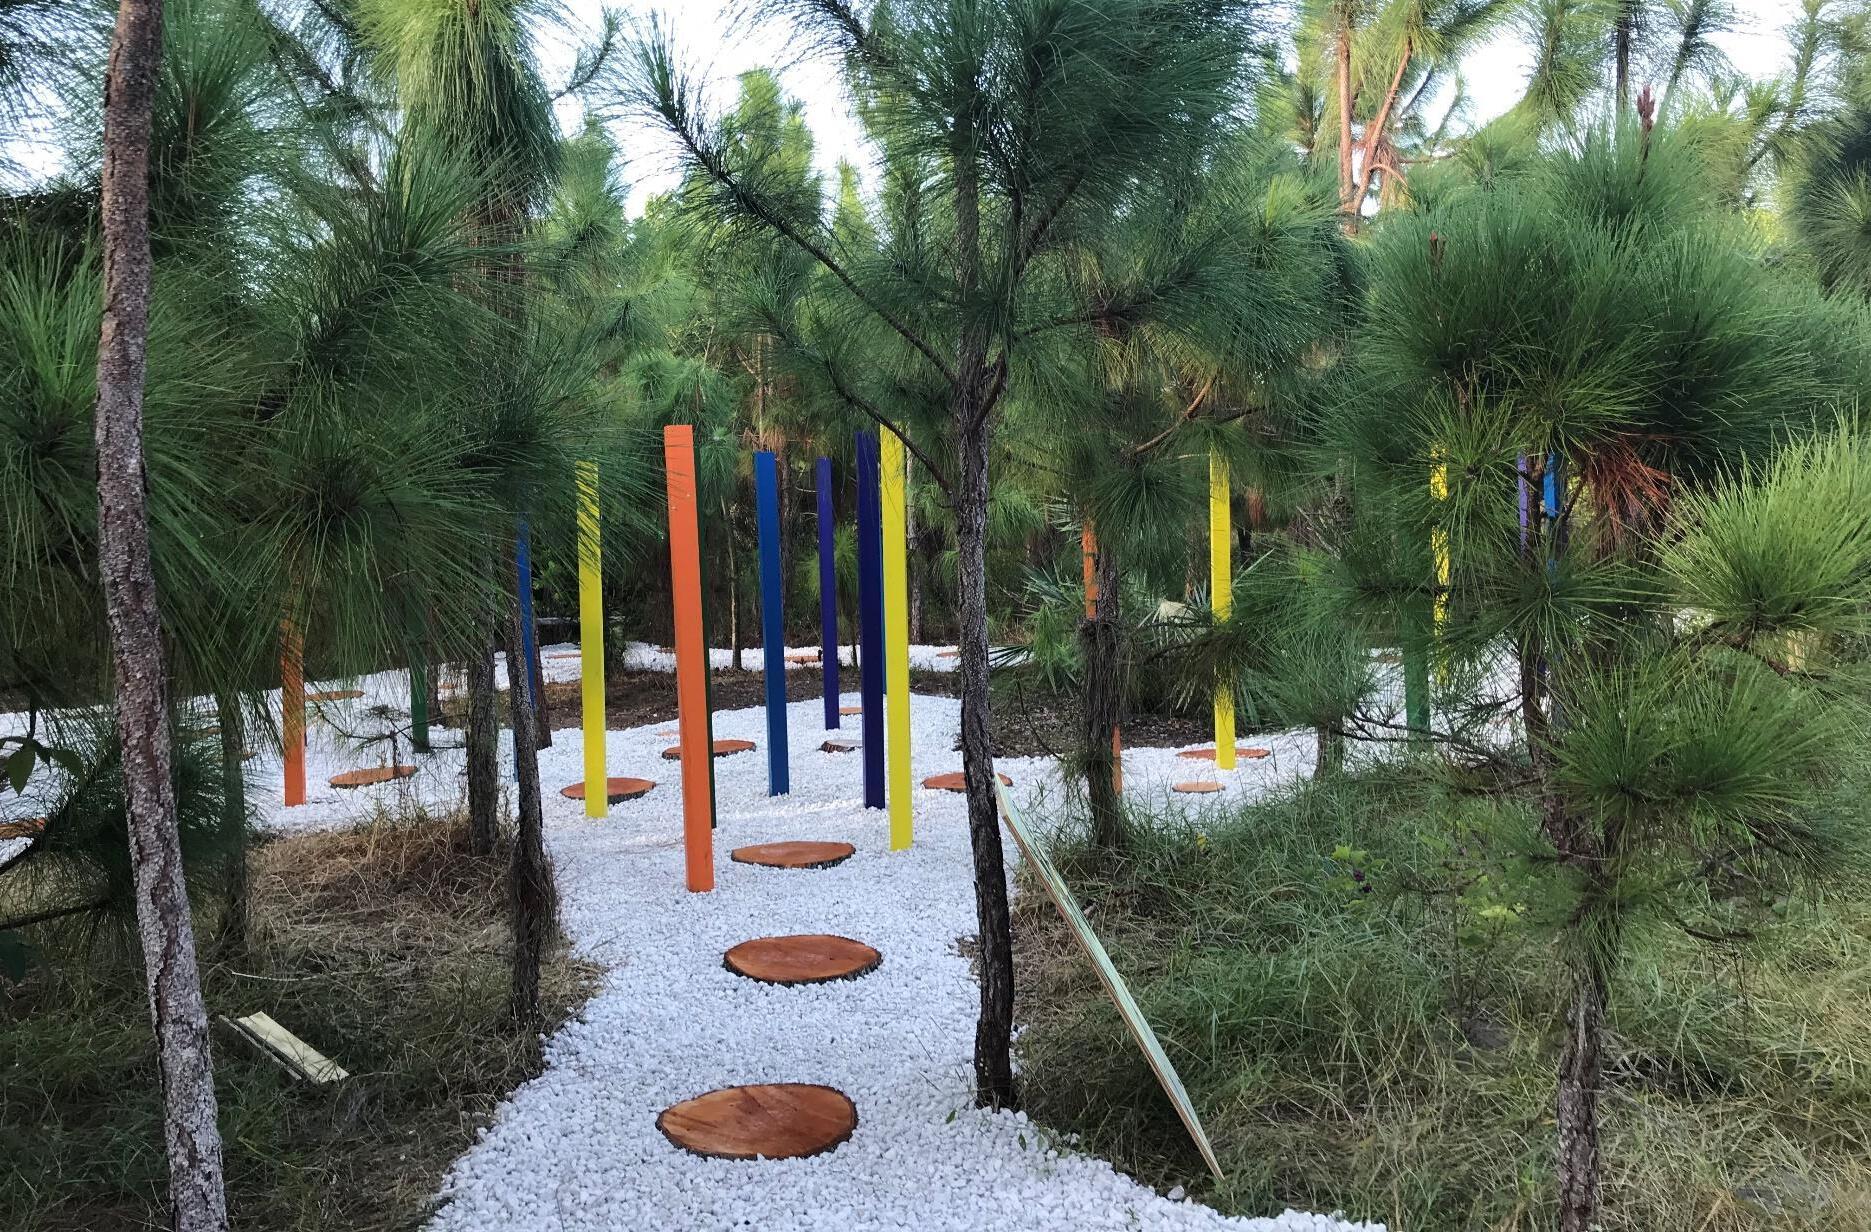
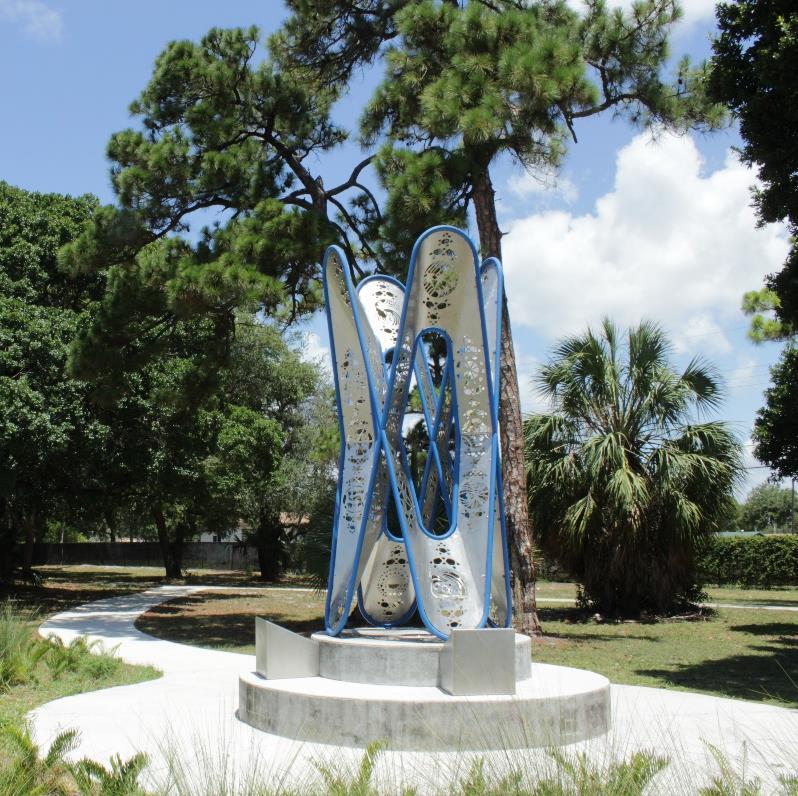
Money spent on attending live theater as well as visiting art galleries and theme parks. The County could capture people participating in commercial recreation while blending nature and art into design components, such as with a sculpture park.
Moving forward, the Division should continue offering these recreational opportunities for its residents and/or partner with other organizations that can ensure resident needs continue to be met.
1.5.2. Community Engagement
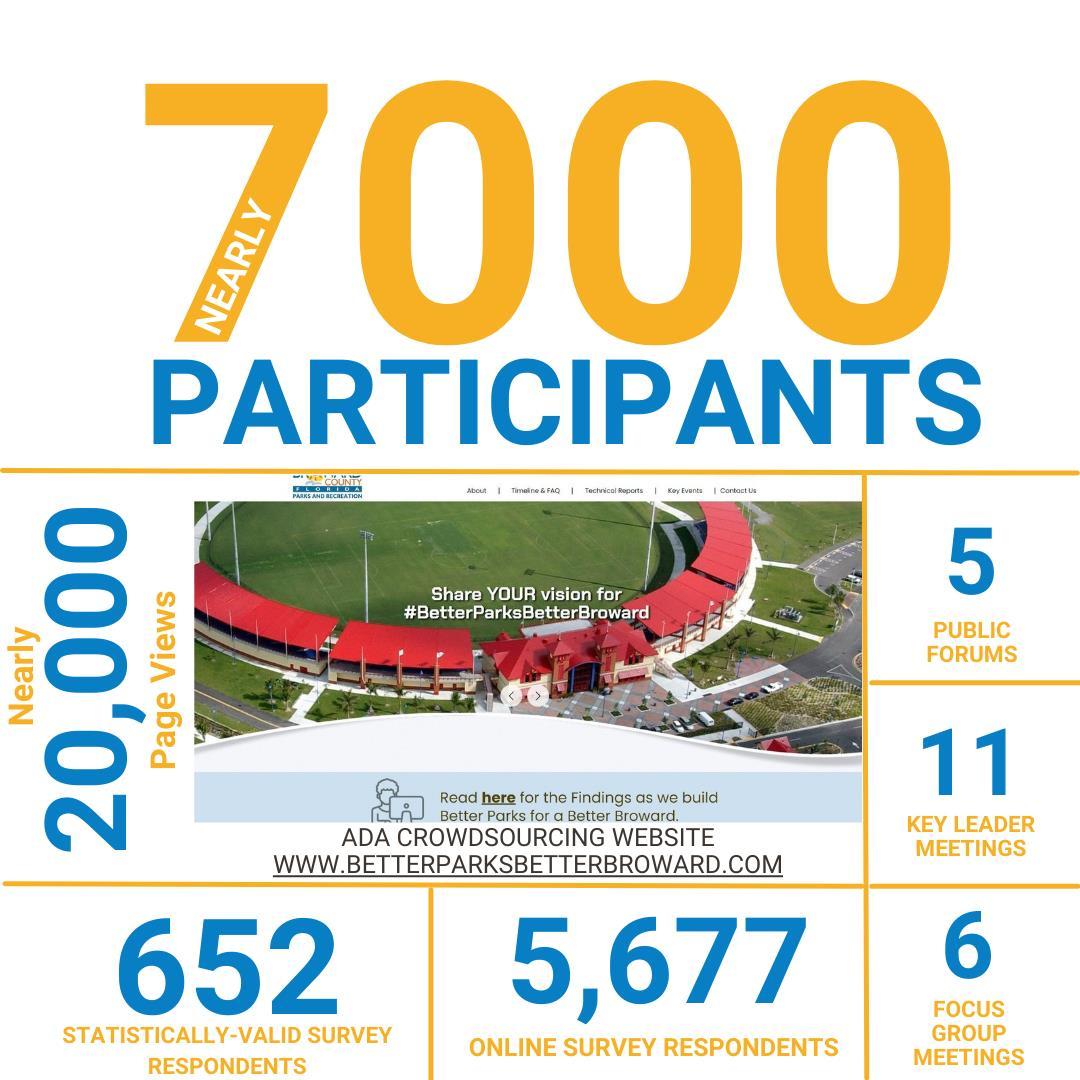
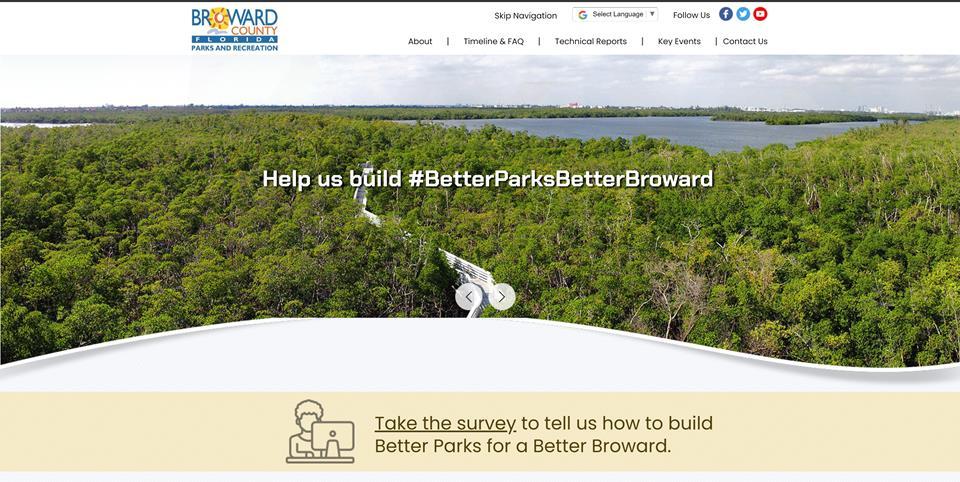
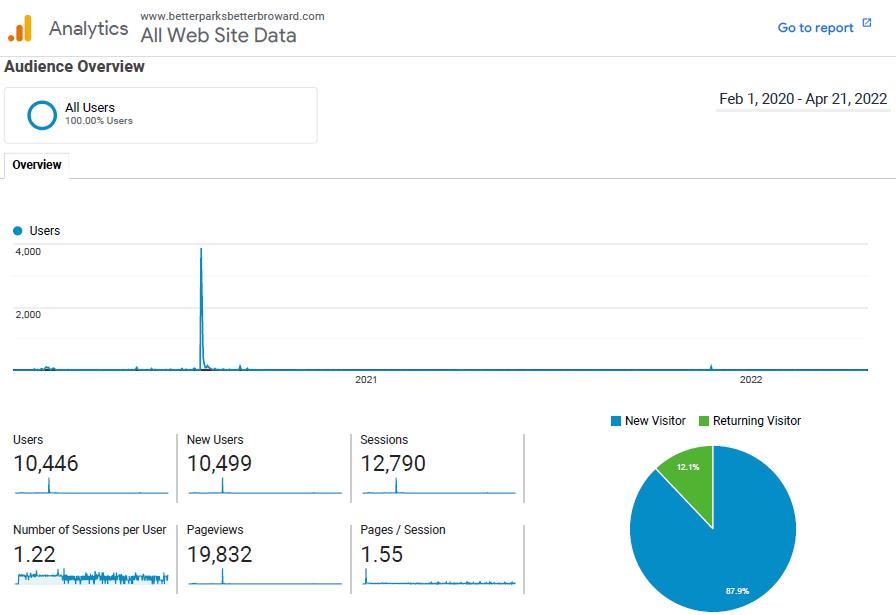
In order to ensure this was a collaborative and representative initiative, the consulting team and Division worked through multiple avenues including public forums, online and mail-in surveys, and open comments on www.BetterParksBetterBroward.com to capture valuable insights from residents to drive the development of the Plan.
1.5.3. Statistically Valid Survey
ETC Institute conducted a statistically valid survey via mail, phone, and online for Broward residents. The goal was to obtain 600 completed surveys, which was exceeded with a total of 652 completed surveys. The overall results have an accuracy of at least +/‐3.8% at the 95% level of confidence.
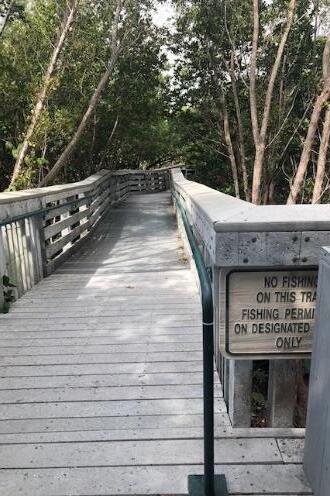
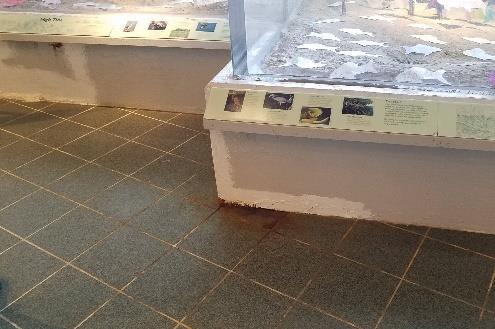
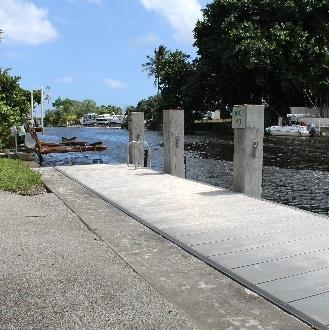
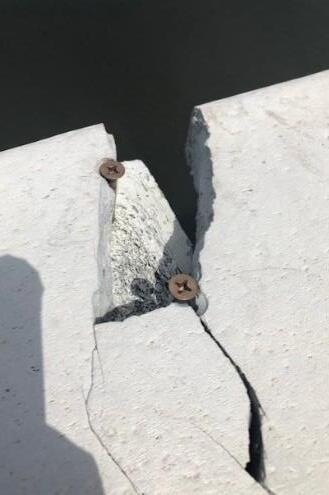
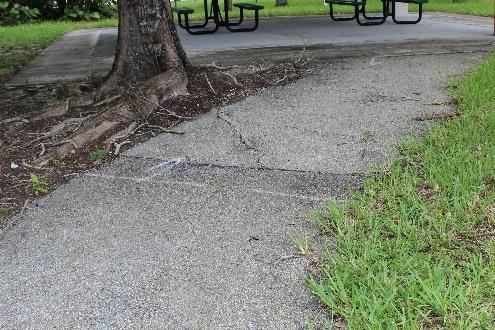
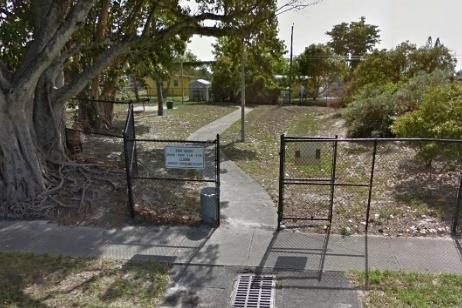
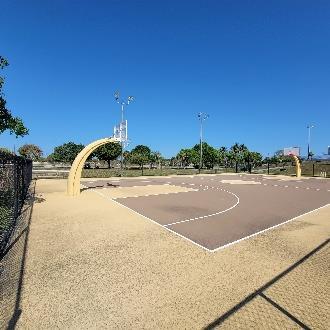
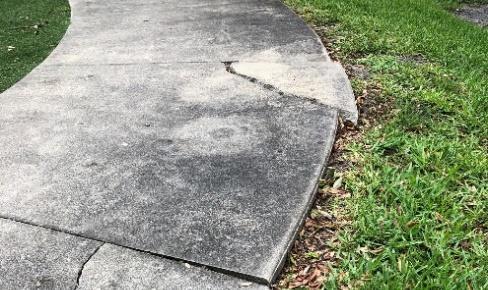
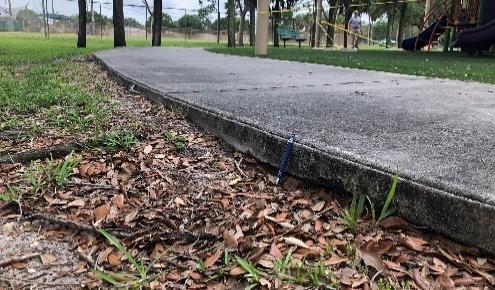
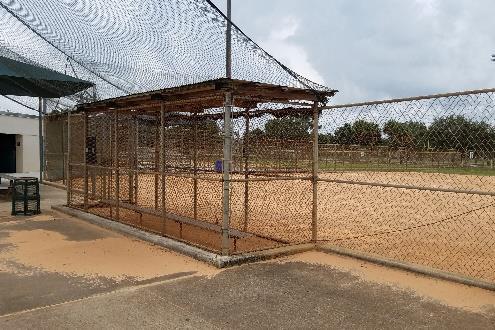
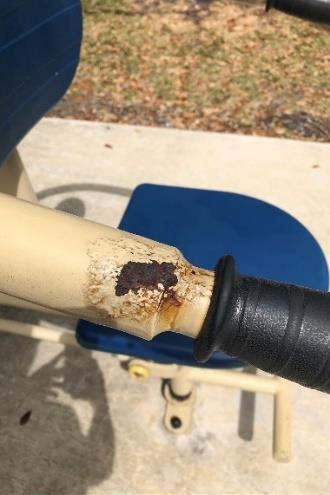
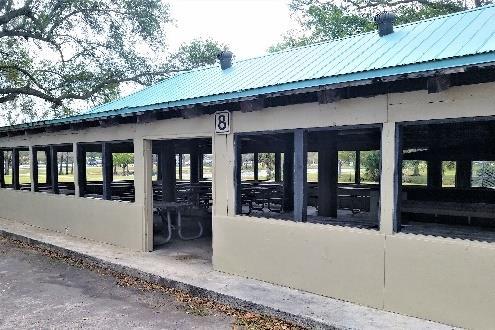
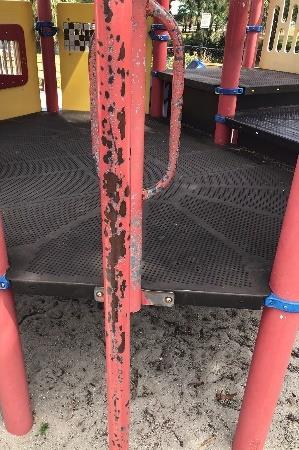
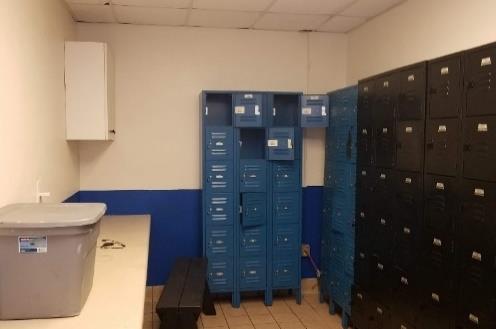
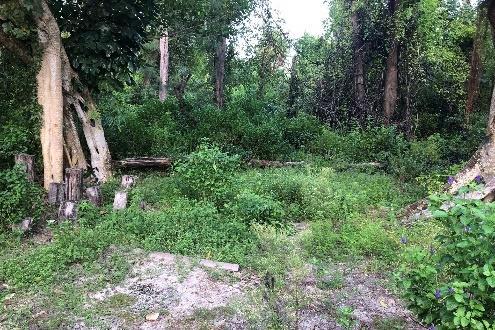
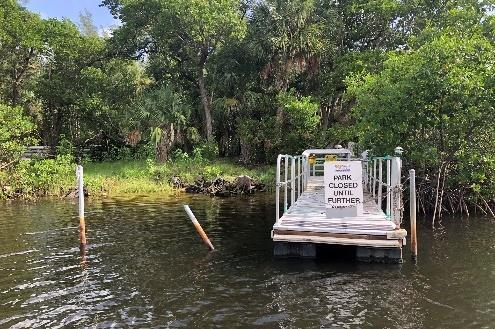
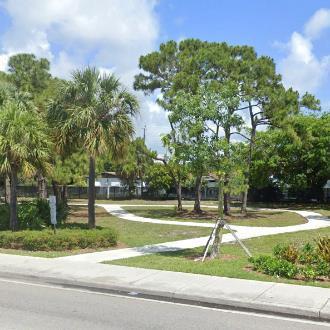
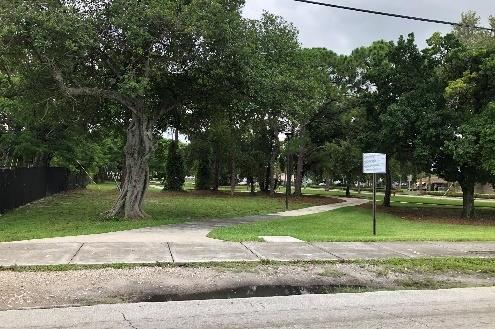
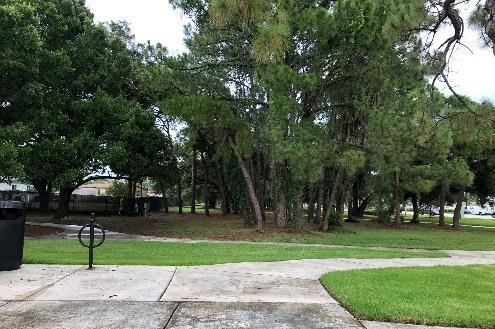
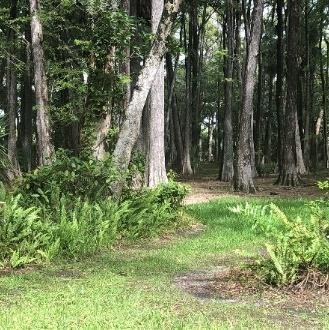
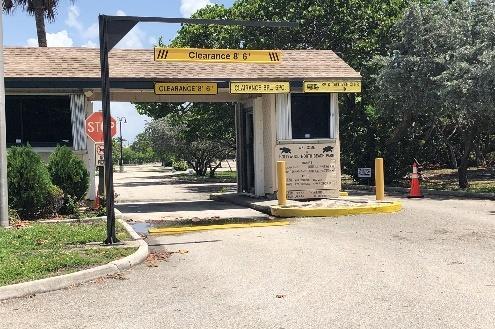
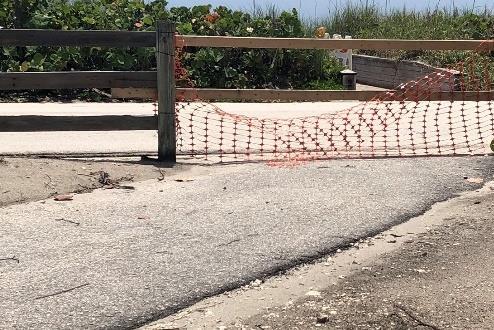
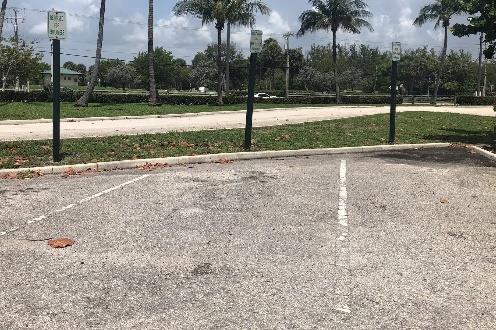
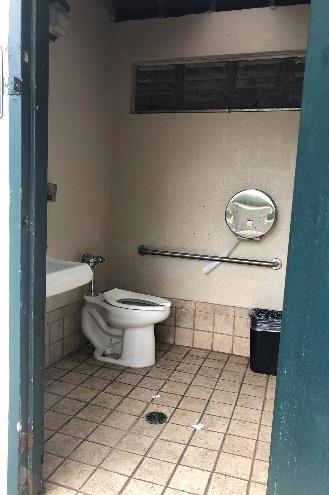
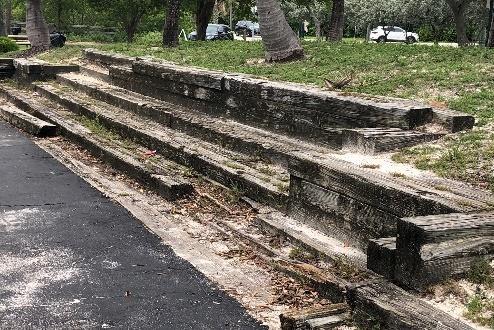
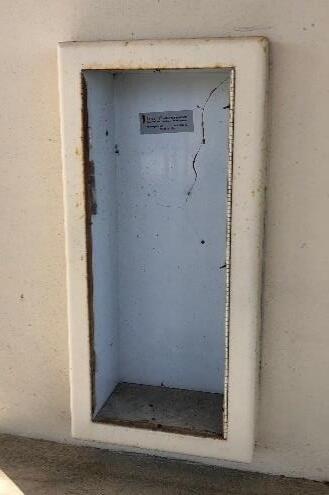
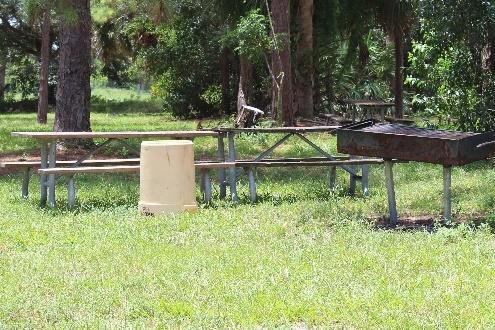
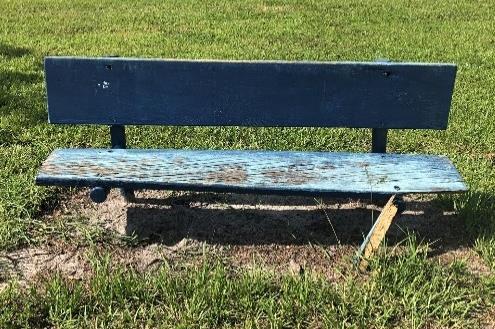
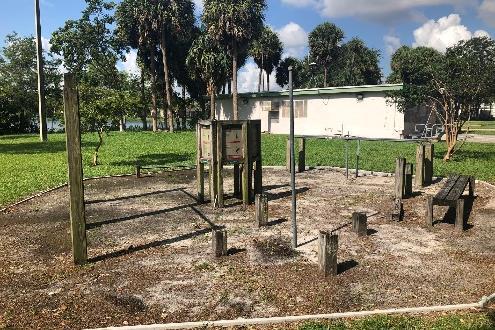
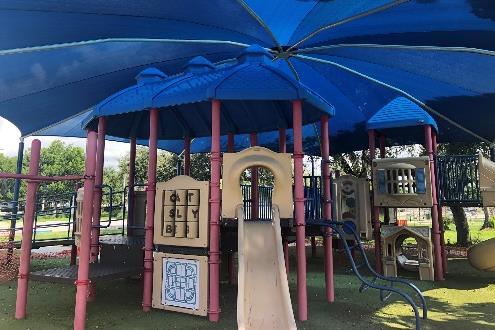
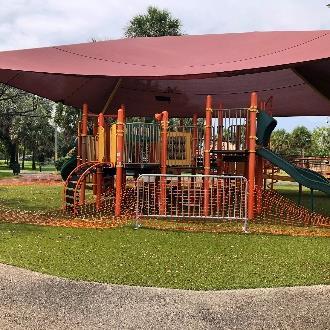
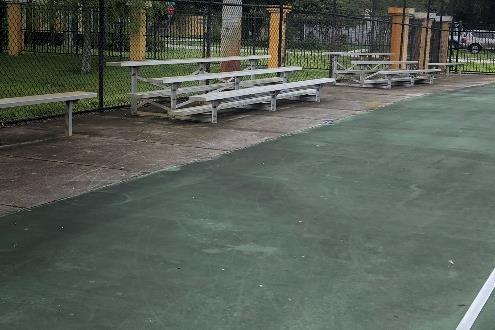
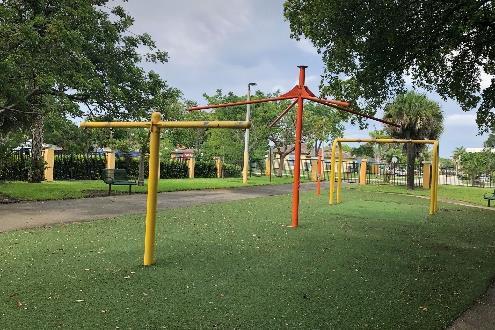
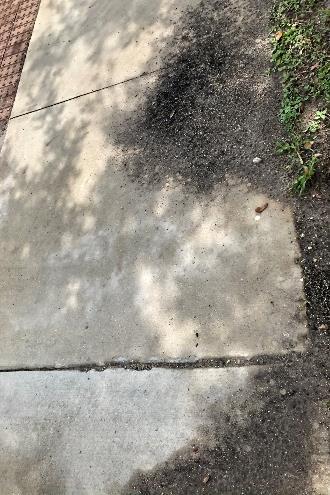
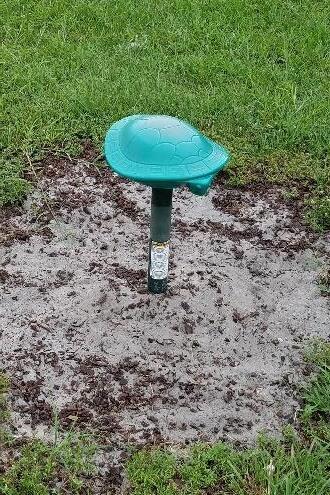
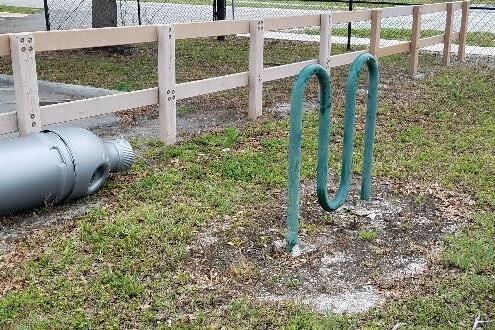
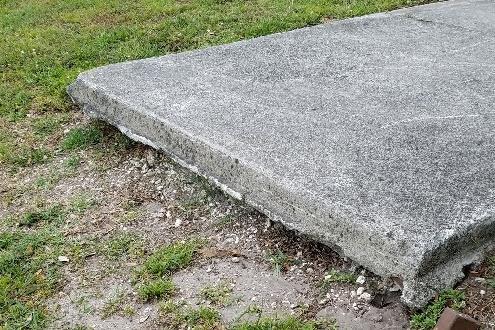
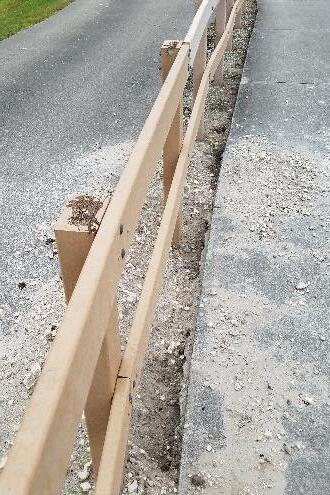
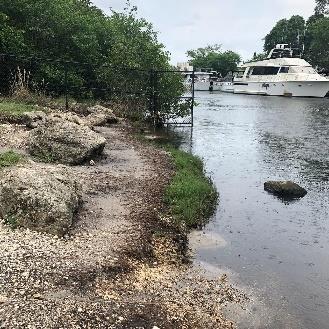
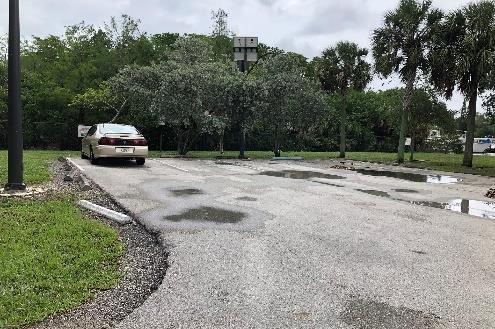
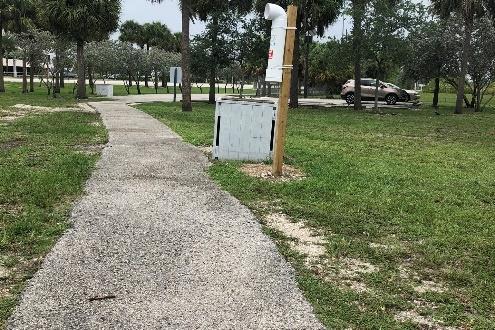
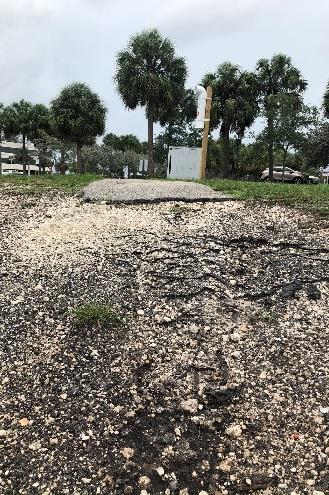
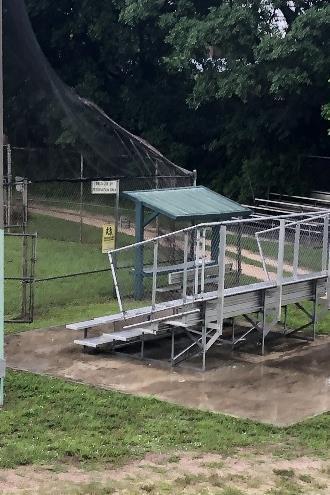
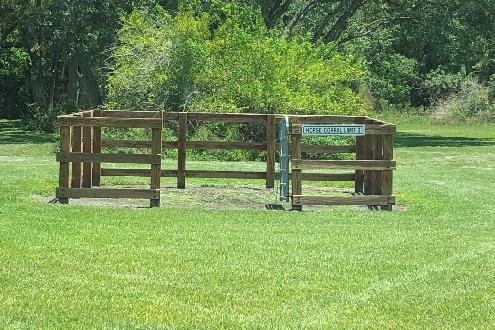
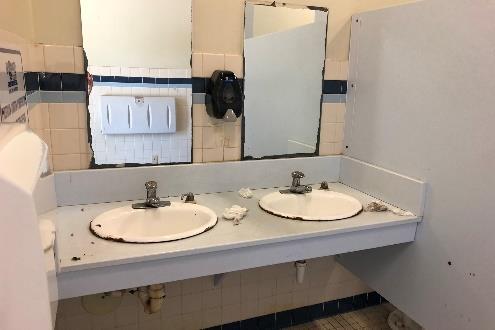
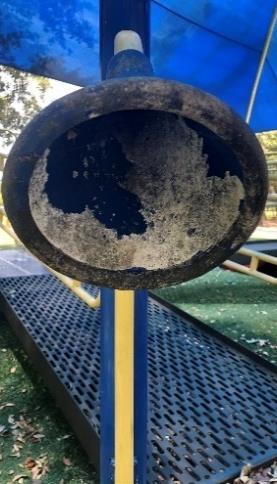
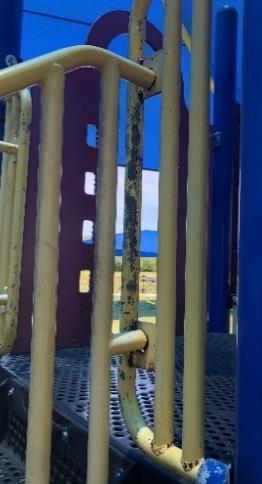
1.5.4. Park Assessment
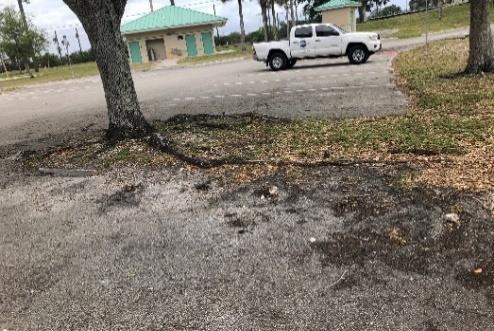
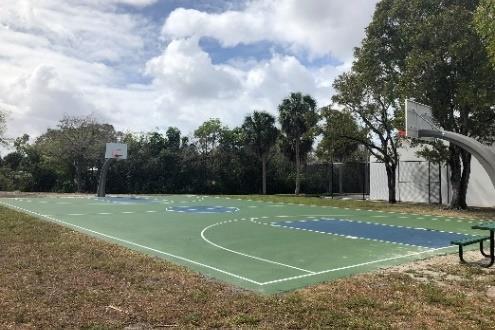
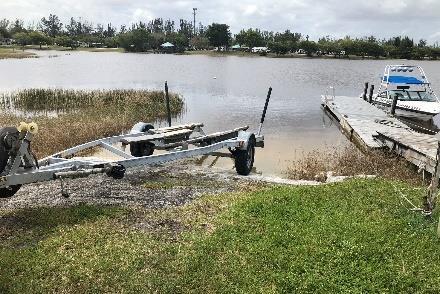
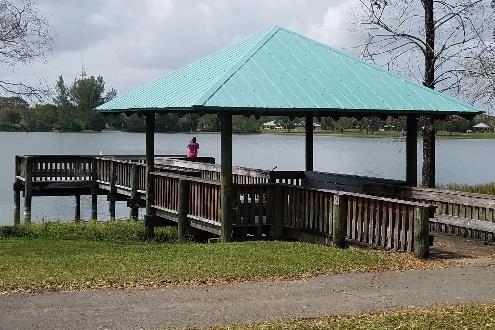
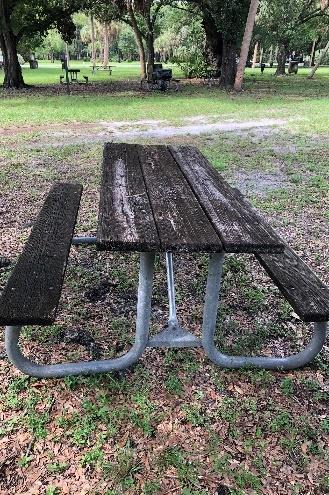
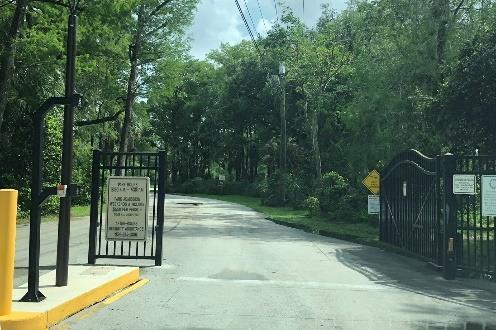
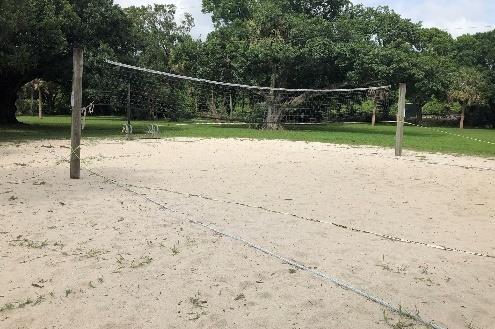
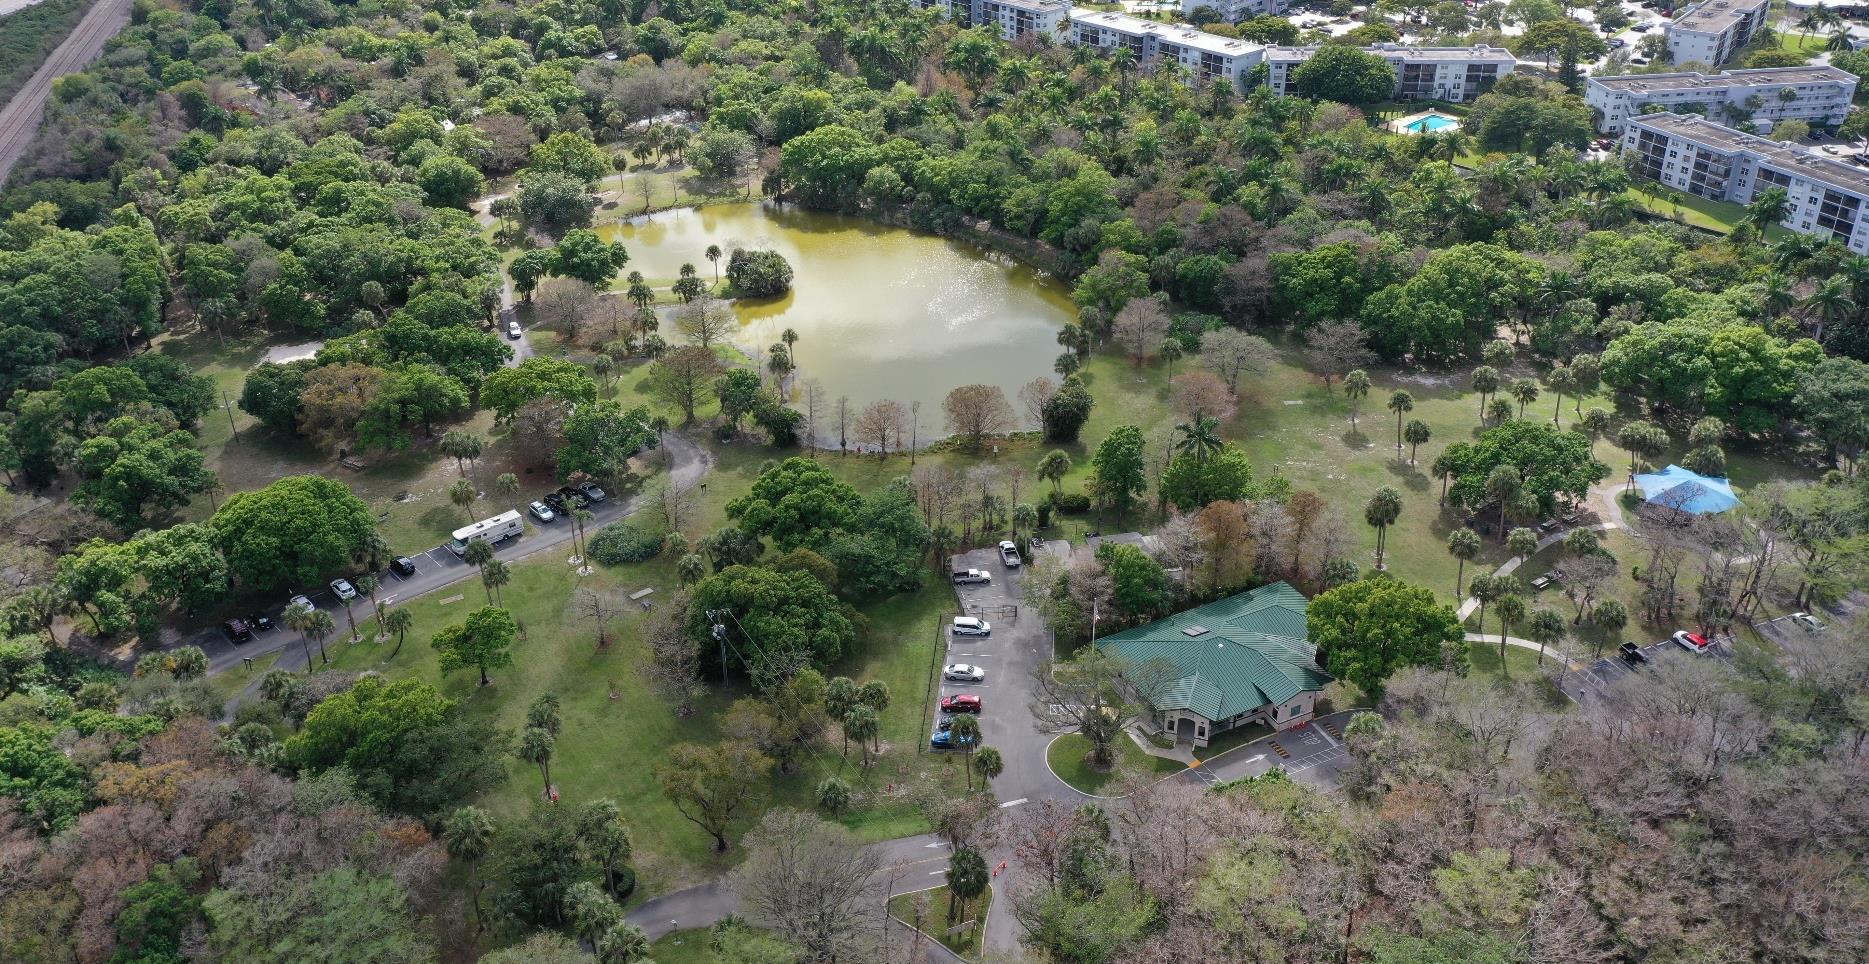
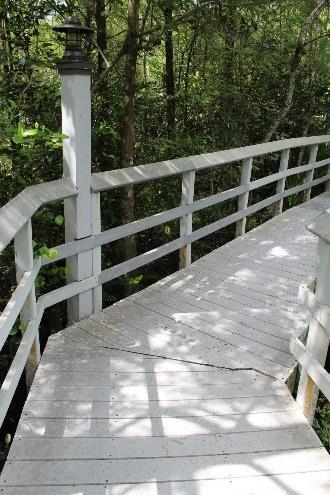
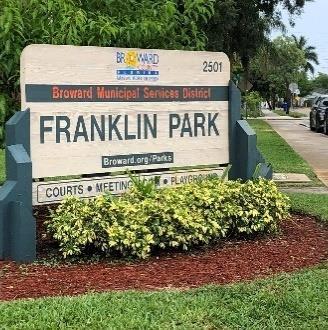
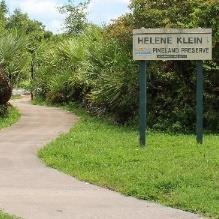
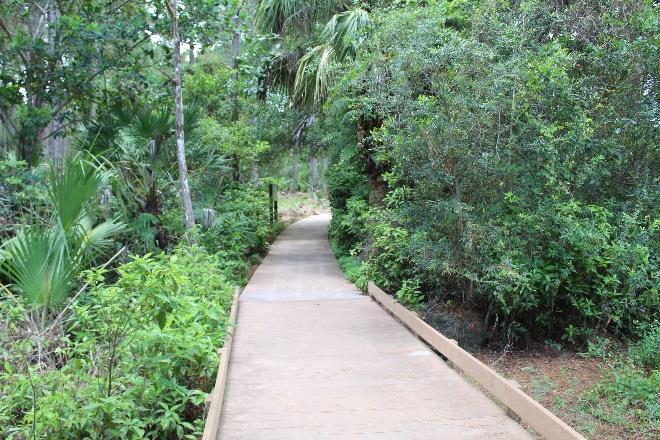
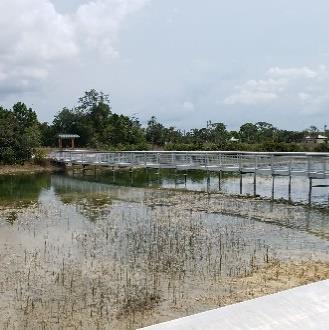
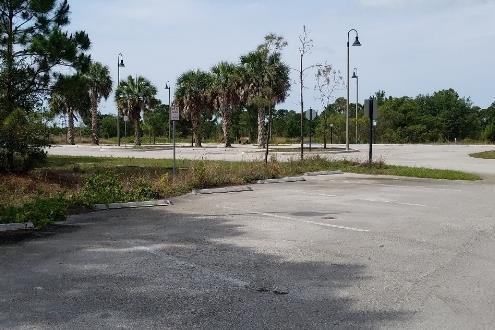
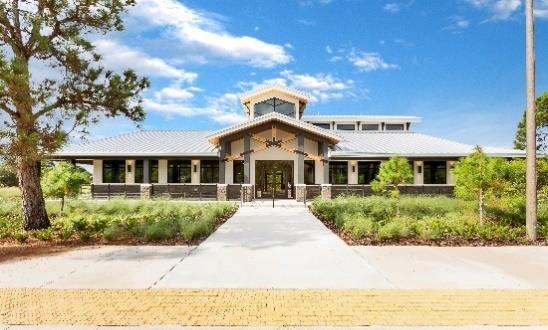
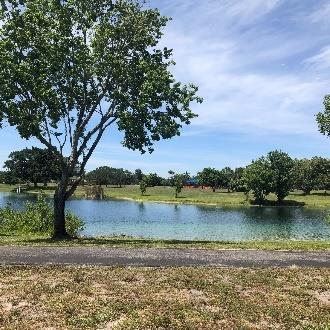
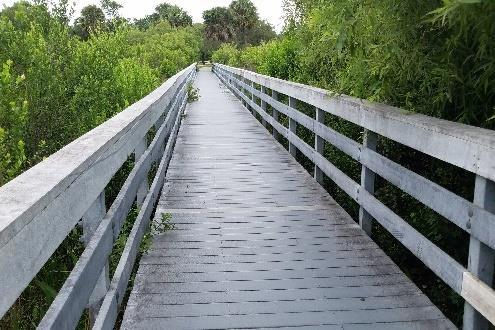
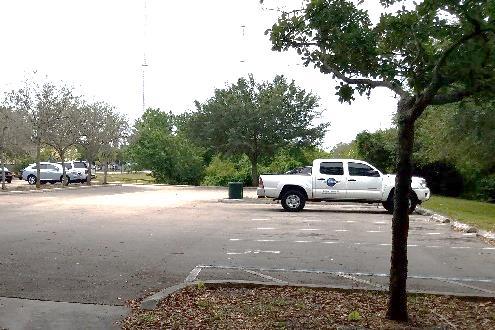
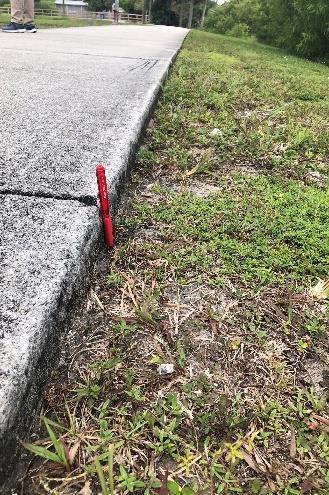
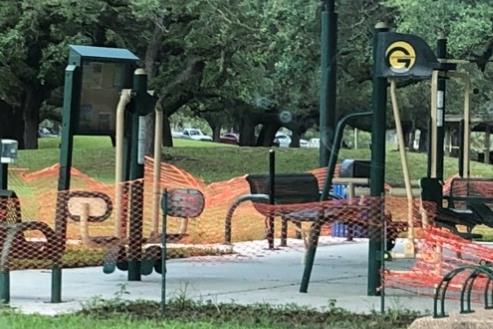
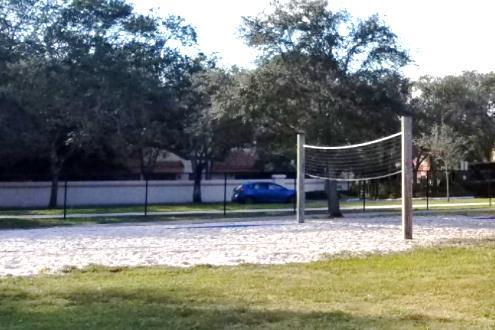
The consultant team conducted in-person site assessments of 47+ County properties with a range of unique and diverse assets. This assessment established a baseline understanding and “snapshot” of the system’s existing conditions and amenities and is used with other technical research reports to develop recommendations and action strategies.
The consultant team used a standard site assessment form to document observations. One form was completed for each park within the system and a questionnaire was sent to each park manager to incorporate their expertise and vision.
OPPORTUNITIES FOR PARK SYSTEM
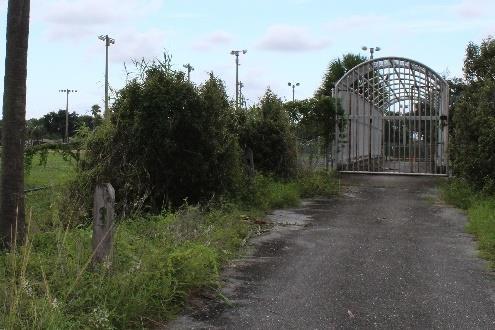
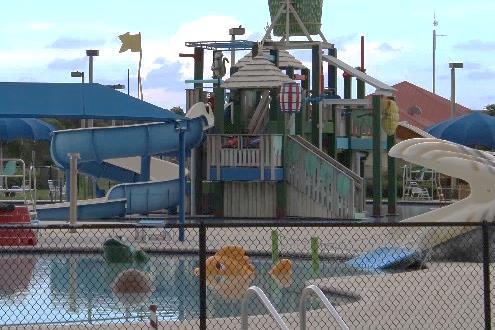
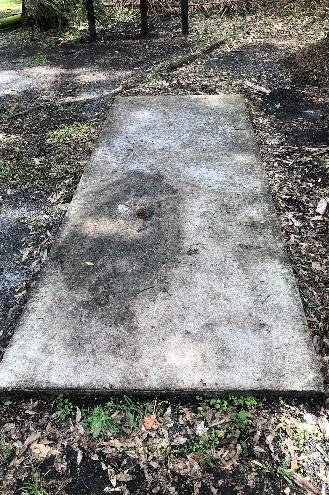
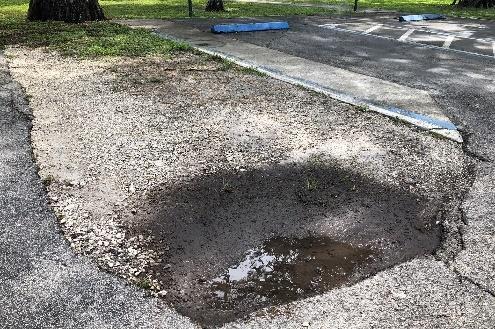
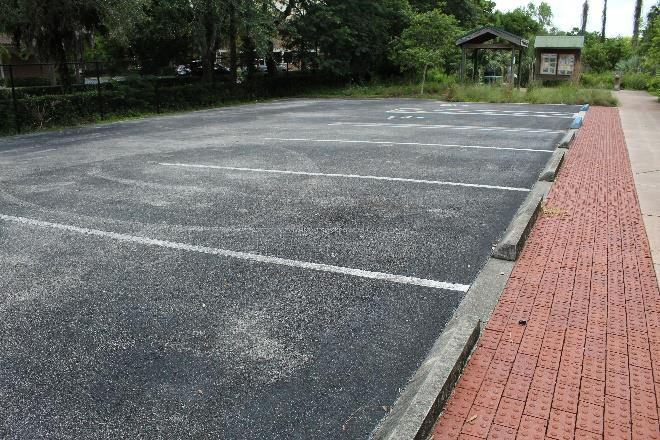
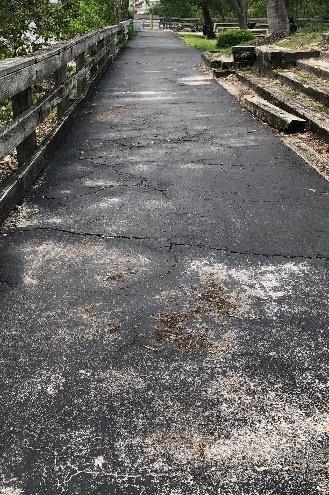
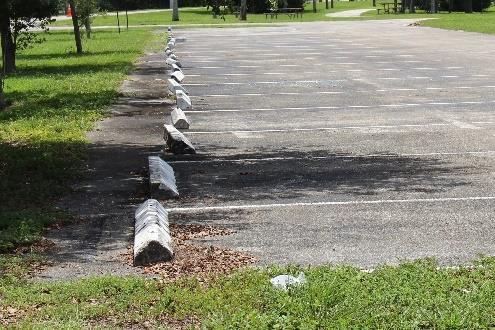
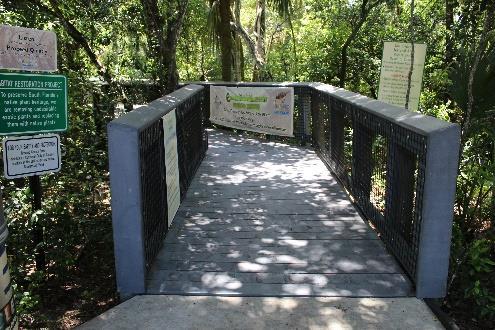
Develop site plans for parks dating from the 1990s that have amenities that are approaching the completion of their life cycles and incorporate new trends in recreation during the design phase for successful outcomes.
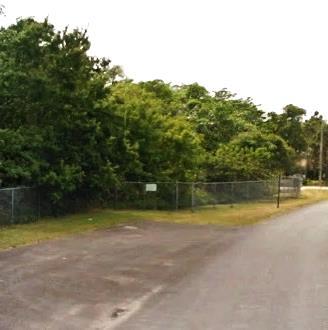
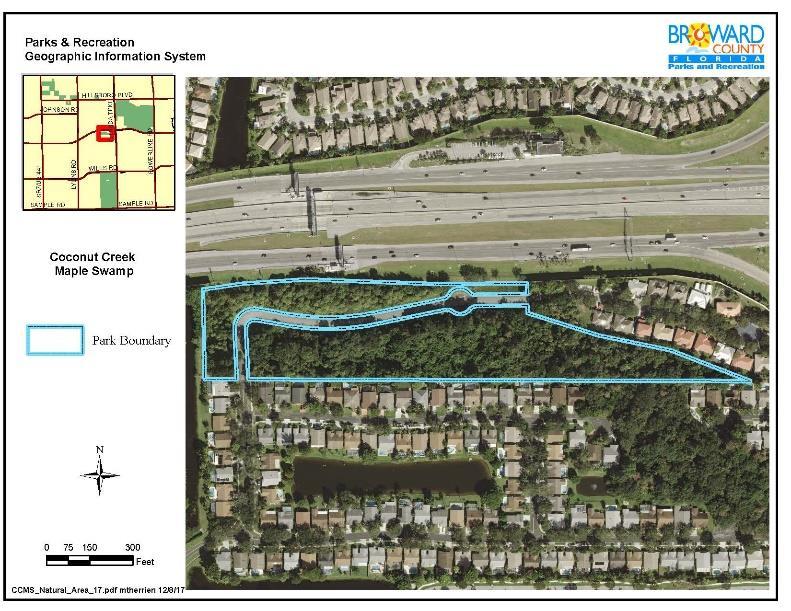
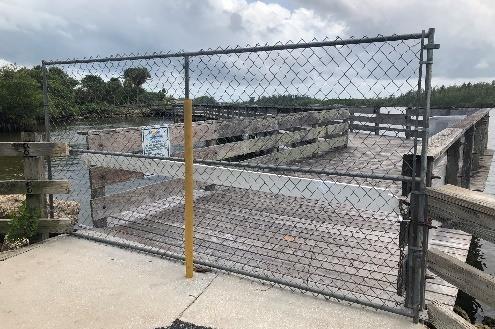
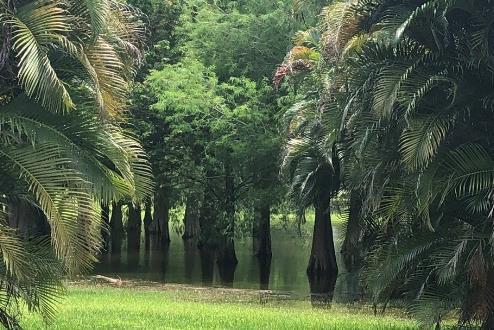
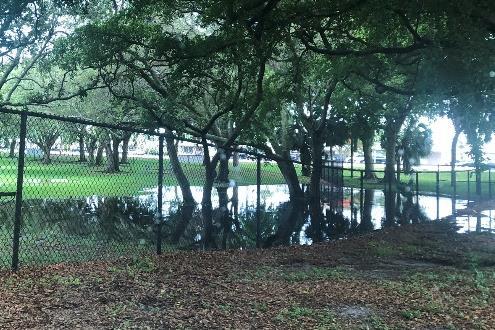
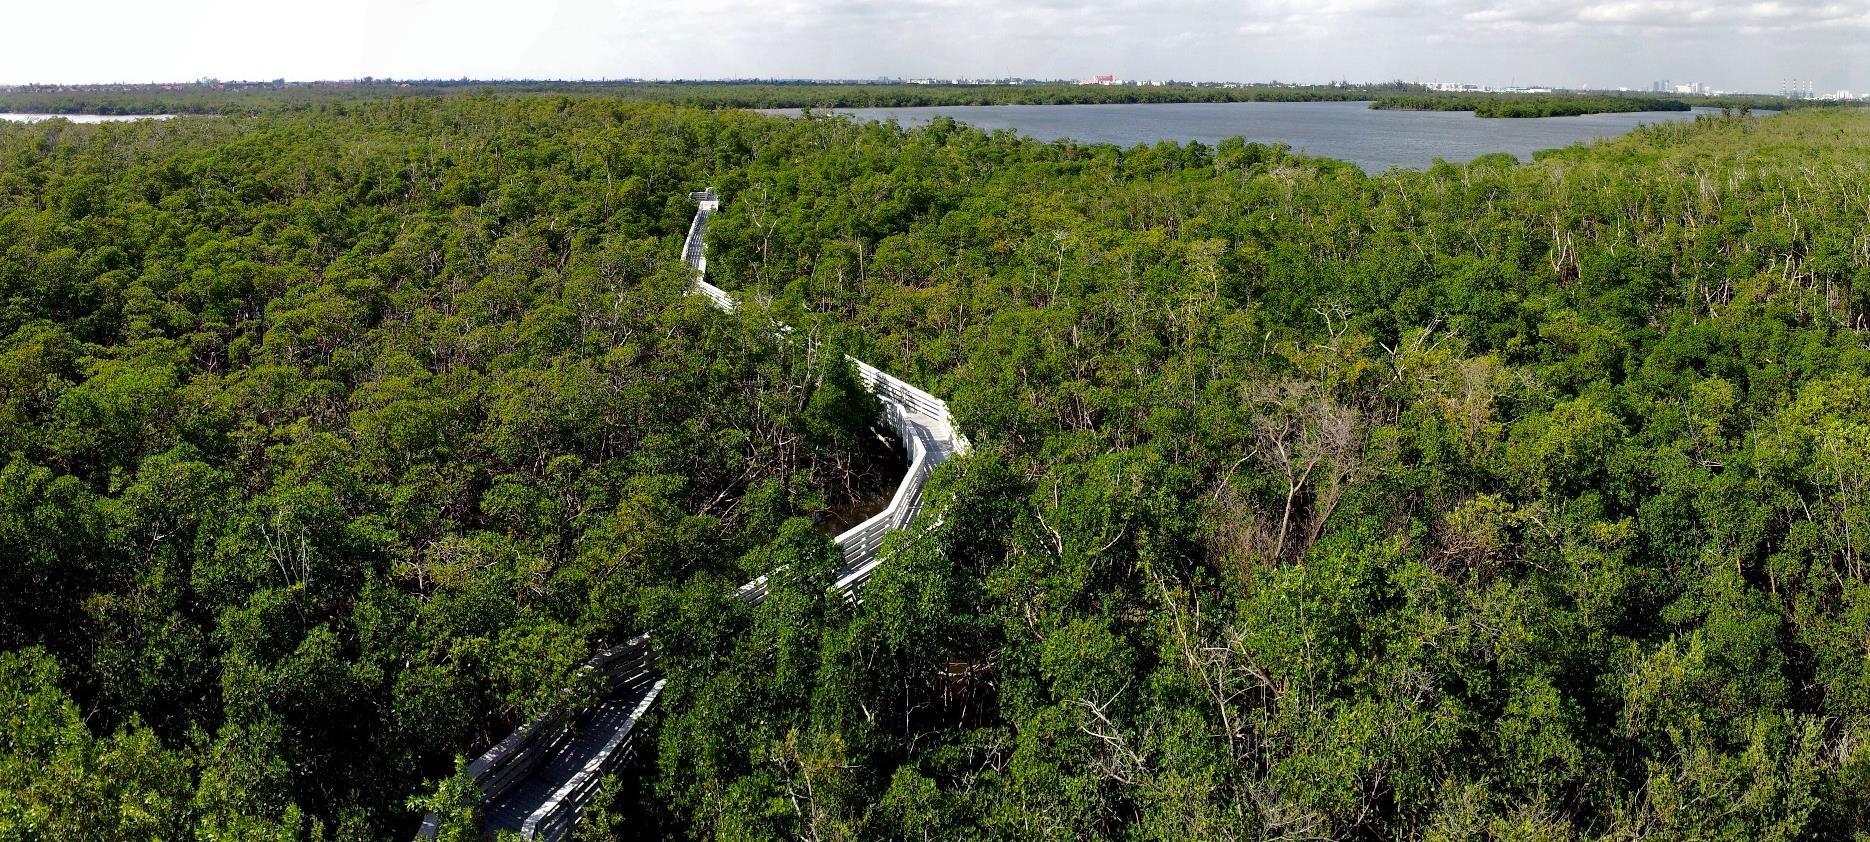
Work with federal, state, and local public/private partnerships to use wetland mitigation opportunities to restore wetlands and leverage funding for expanding accessible nature trails and passive recreation. Shared project opportunities exist for the Division to coordinate with other County agencies, such as the Engineering Division, Resiliency Division, and Water Management Division.
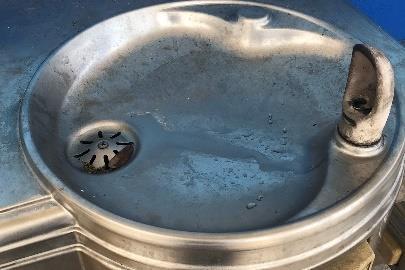
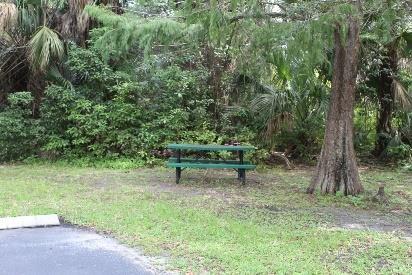
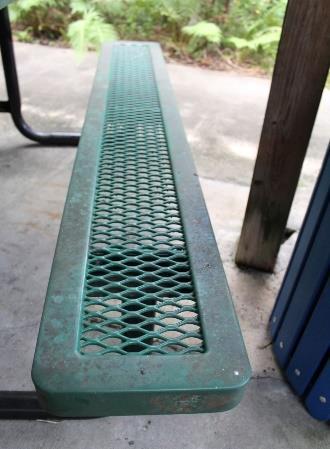
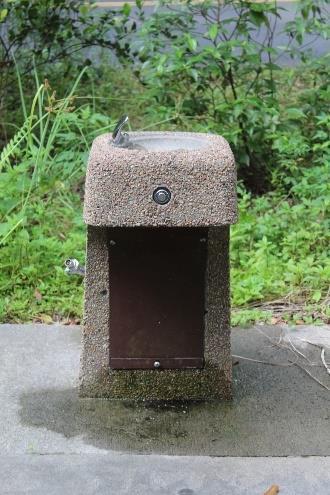
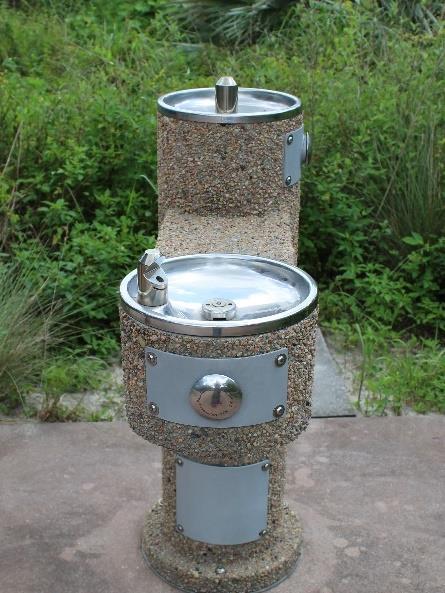
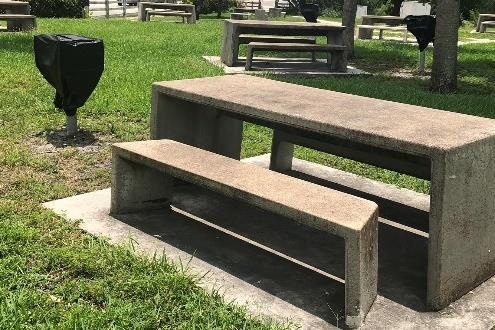
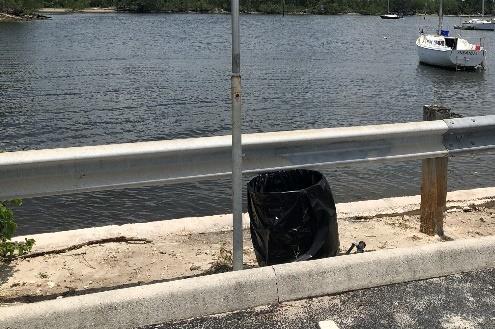
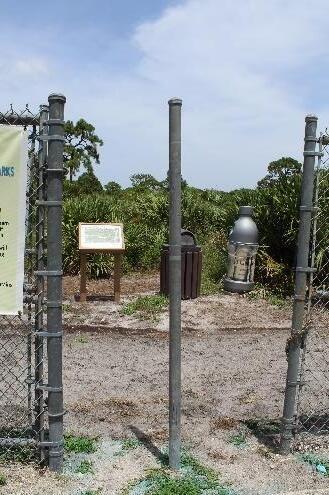
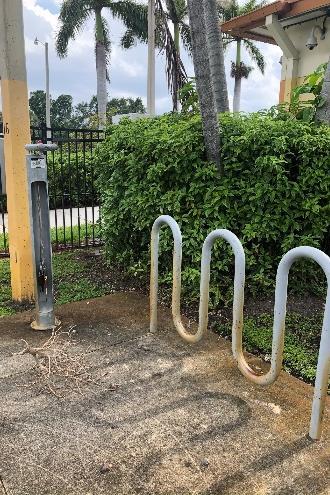
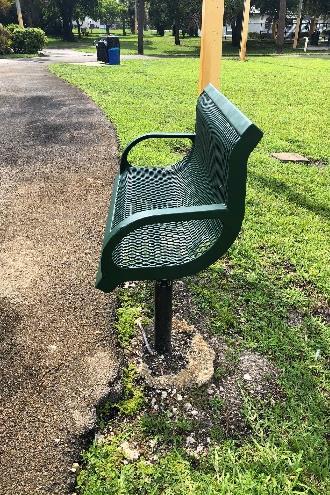
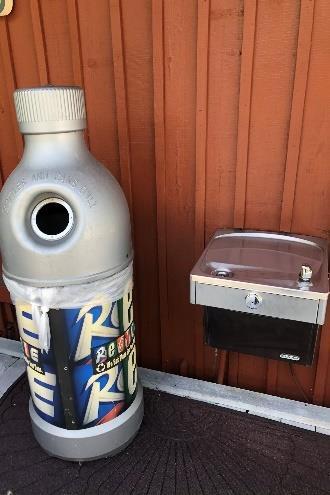
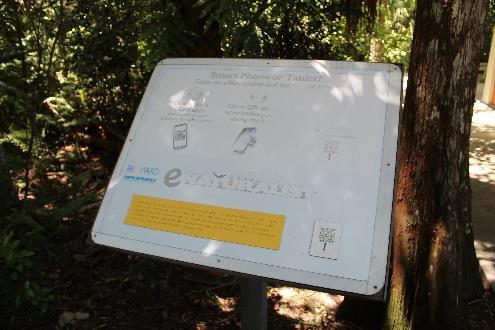
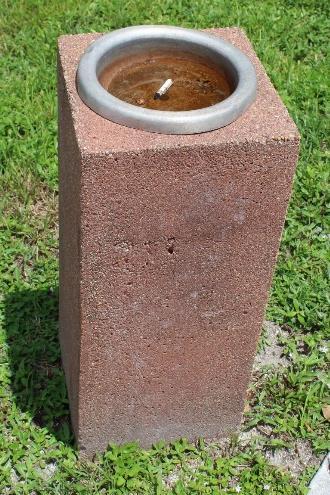
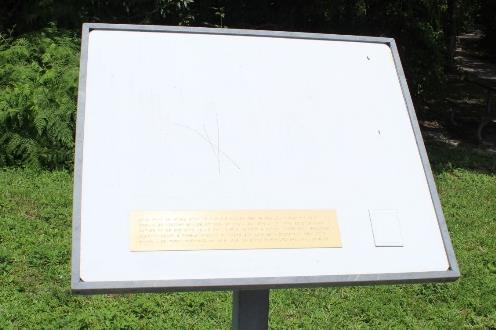
Refresh site furnishings to accommodate the ways people are using the parks today with technology that will enhance the customer experience.
o A few examples would be water bottle filling stations, bicycle repair stations along greenways, interpretive signage, and benches.
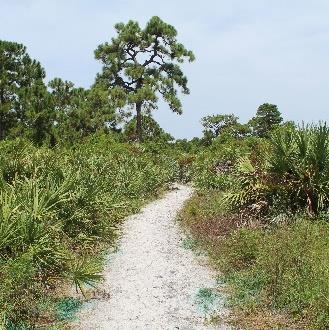
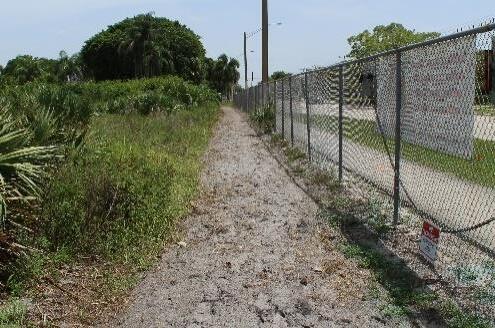
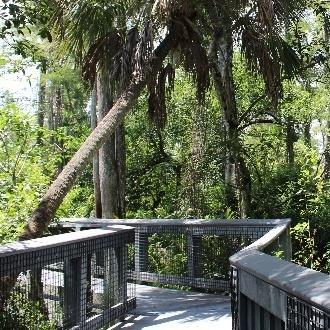
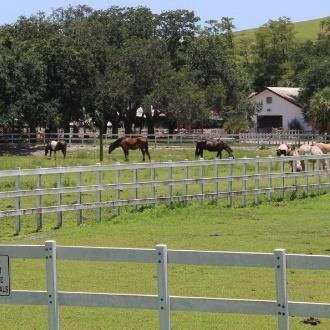
Connect the interior of parks and nature center properties via trails to enhance access and walkability. The County is currently providing connectivity with more than 80 miles of equestrian, nature, and paved trails.
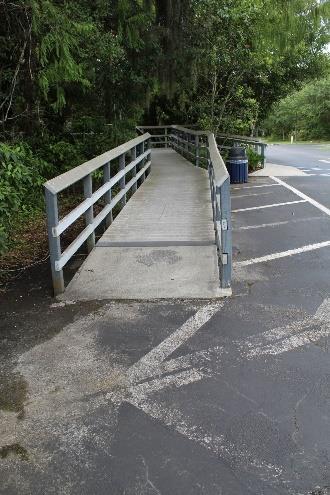
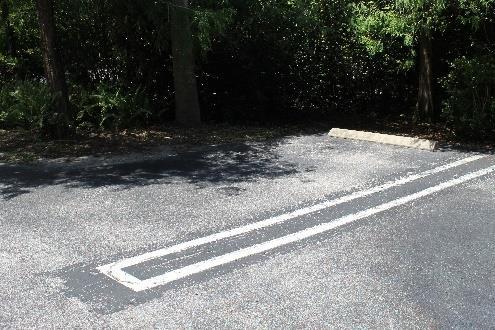
Assess parks for Americans with Disabilities Act compliance and address deficiencies.
Conduct more in-depth analysis of existing parks for compliance with Crime Prevention Through Environmental Design standards (CPTED).
Increase tree canopy for shade and aesthetics, and increase wildflower and native plantings for conservation efforts.
Establish a digital transformation strategy to incorporate Wi-Fi access, solar power charging stations, educational opportunities, asset management, gaming integration, and trail tracking.
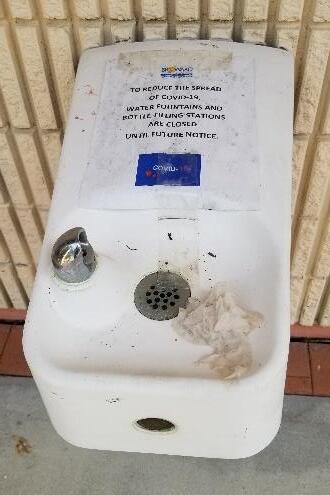
LESSONS FROM THE COVID-19 PANDEMIC
The community has turned to parks and recreation areas for healthy outdoor physical activity and relief from the worries and pressures of the pandemic.
National surveys have shown an increase in visitation, trail usage, and perceived value of local park systems.
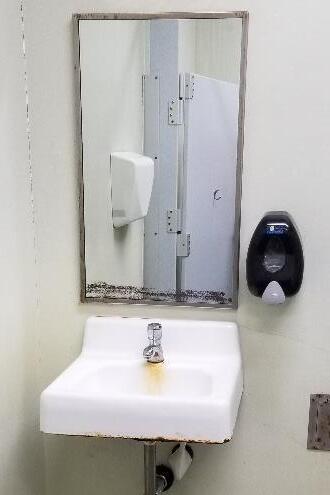
More users desire hands-free experiences to limit the spread of germs.
Hand-washing stations connected to bottle-refill stations outside restrooms would be of value.
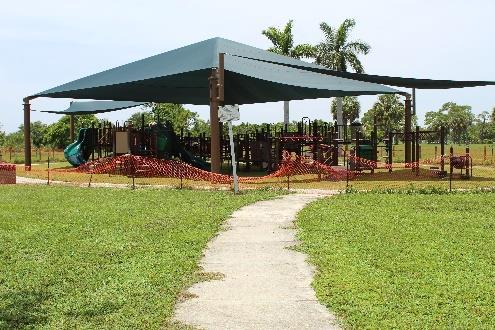
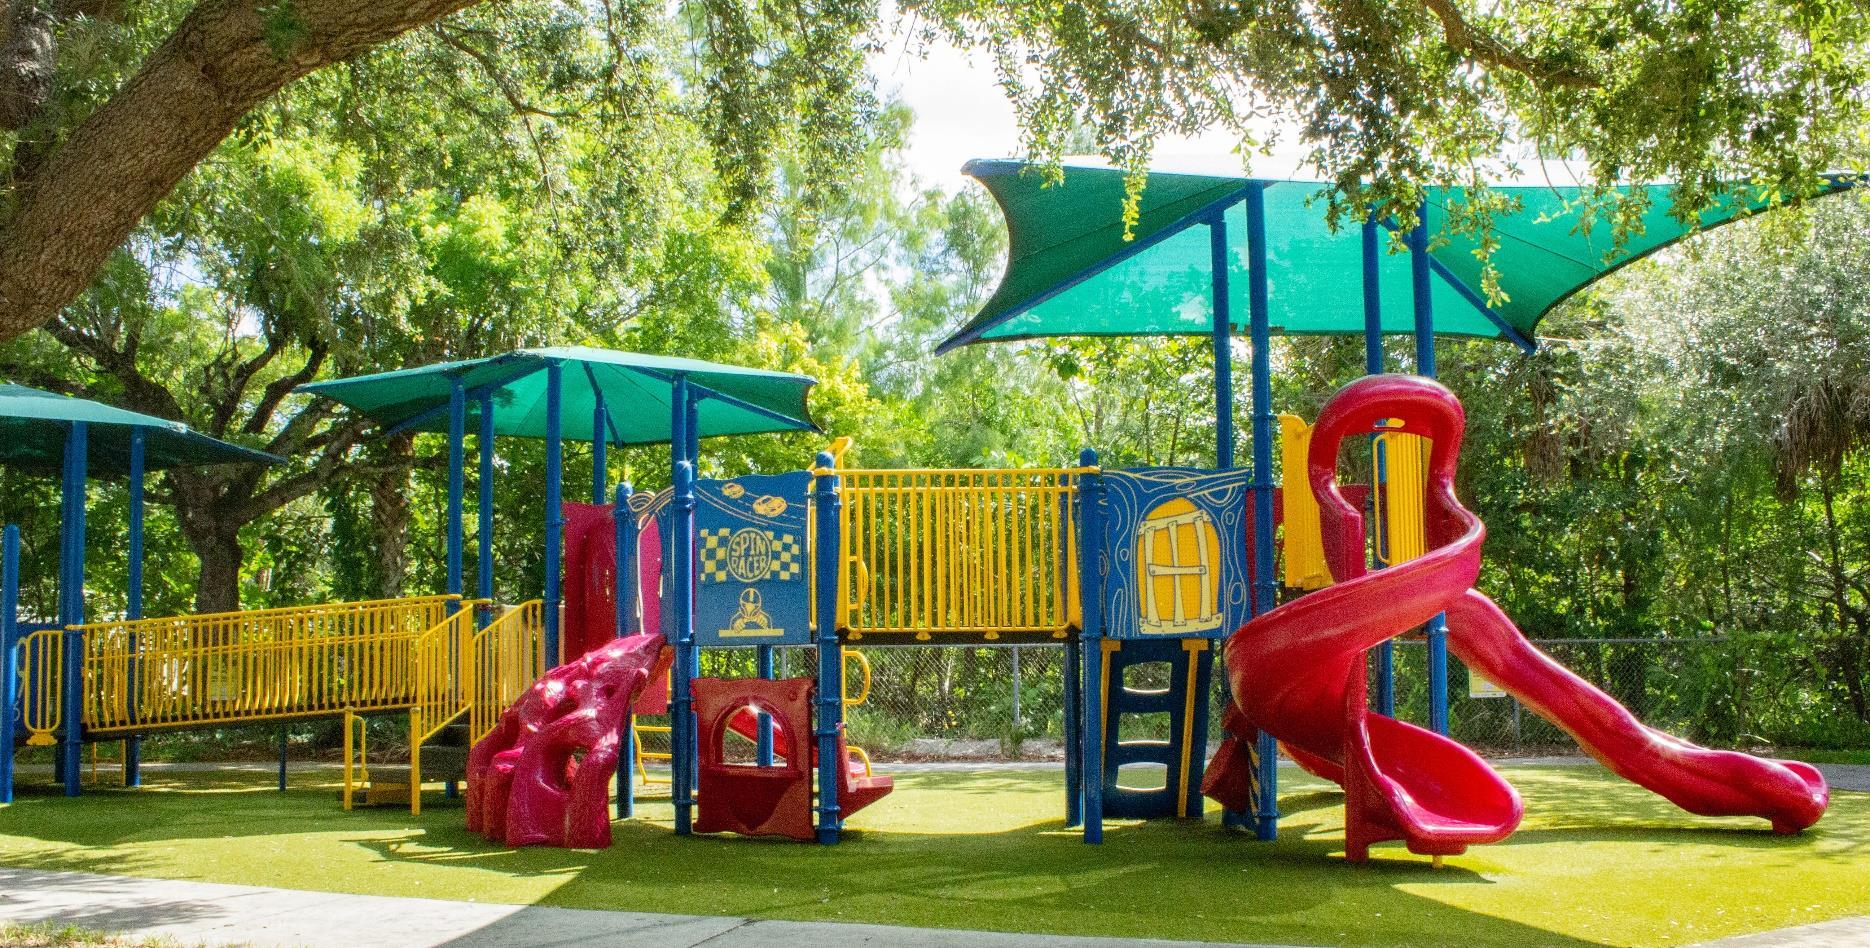
Include more natural play areas and be mindful of “small footprint, high occupancy” play equipment.
Develop regular cleaning schedules for park equipment, site furnishings, and play areas.
Test a model for self-cleaning restrooms and add sanitizing stations to outdoor exercise areas.
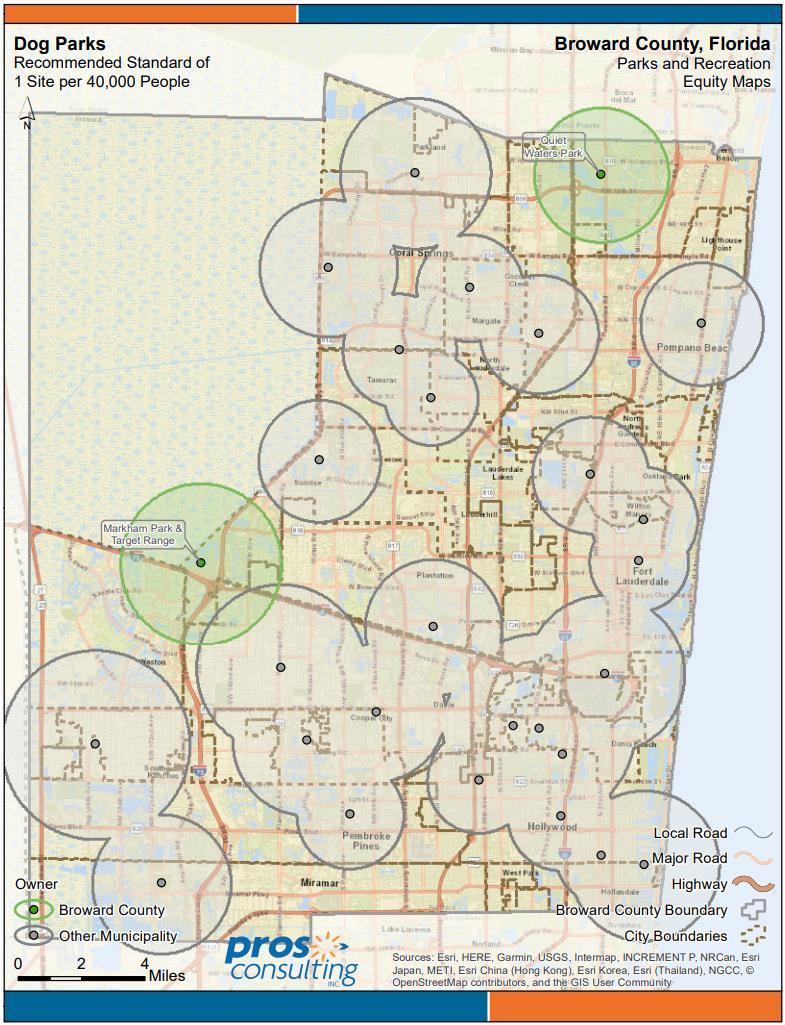
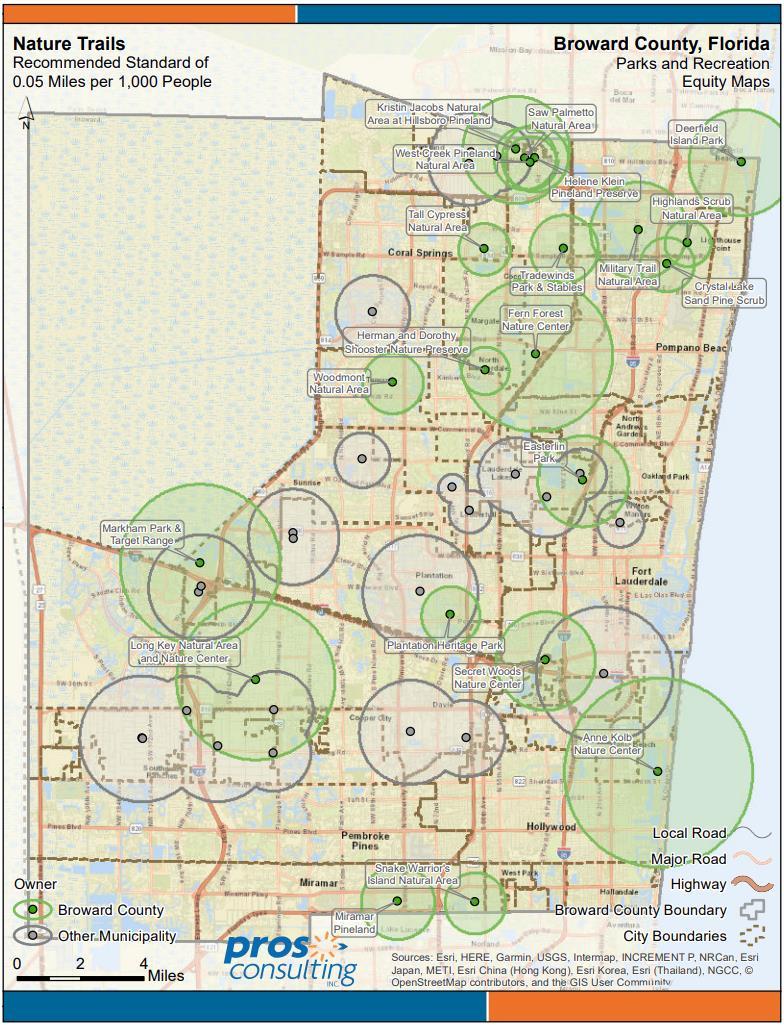
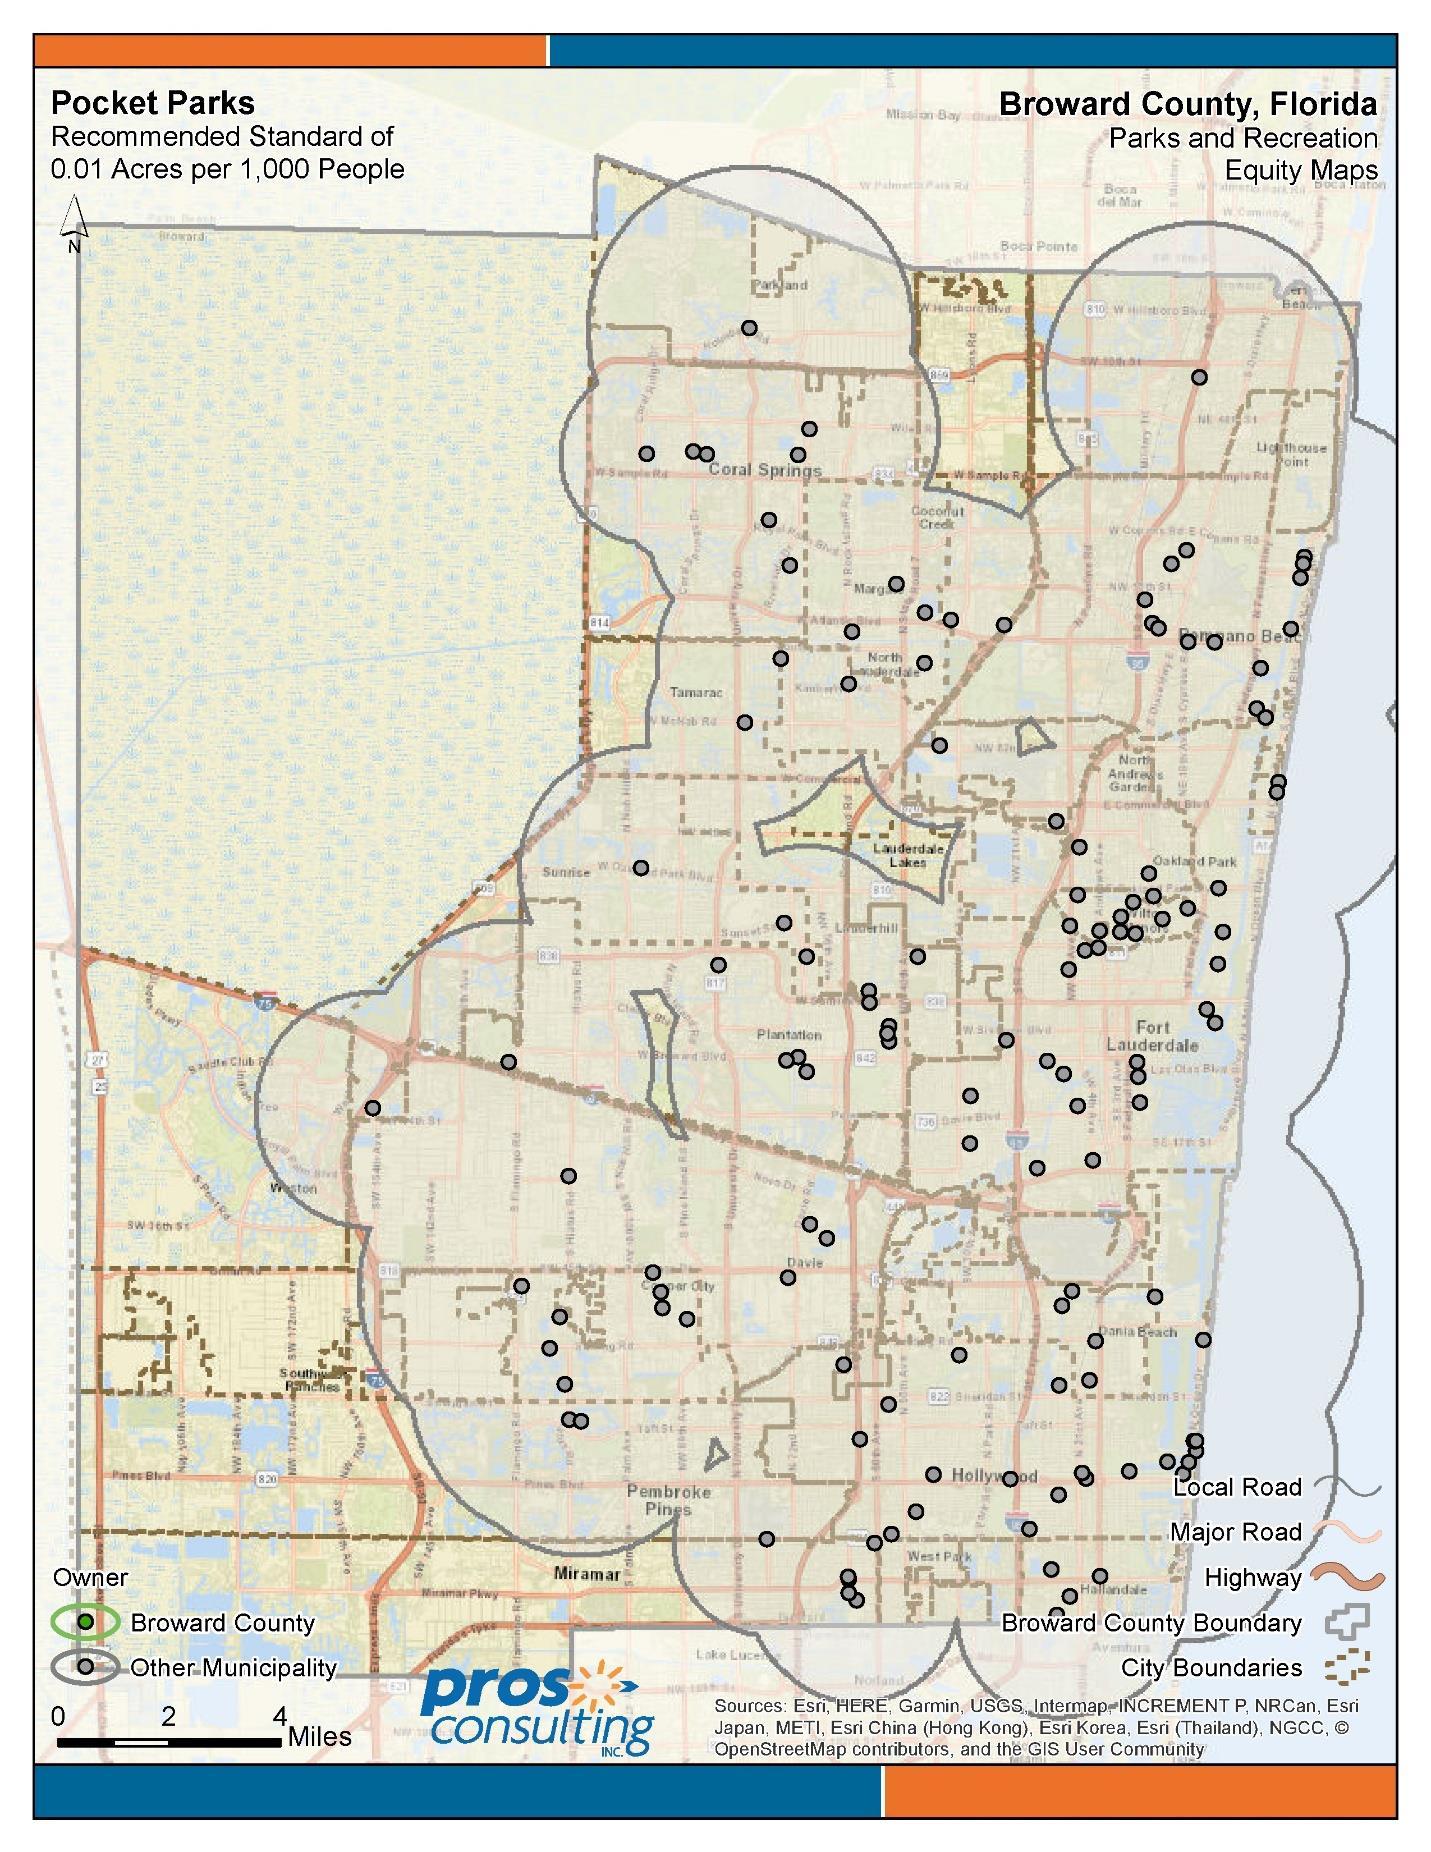
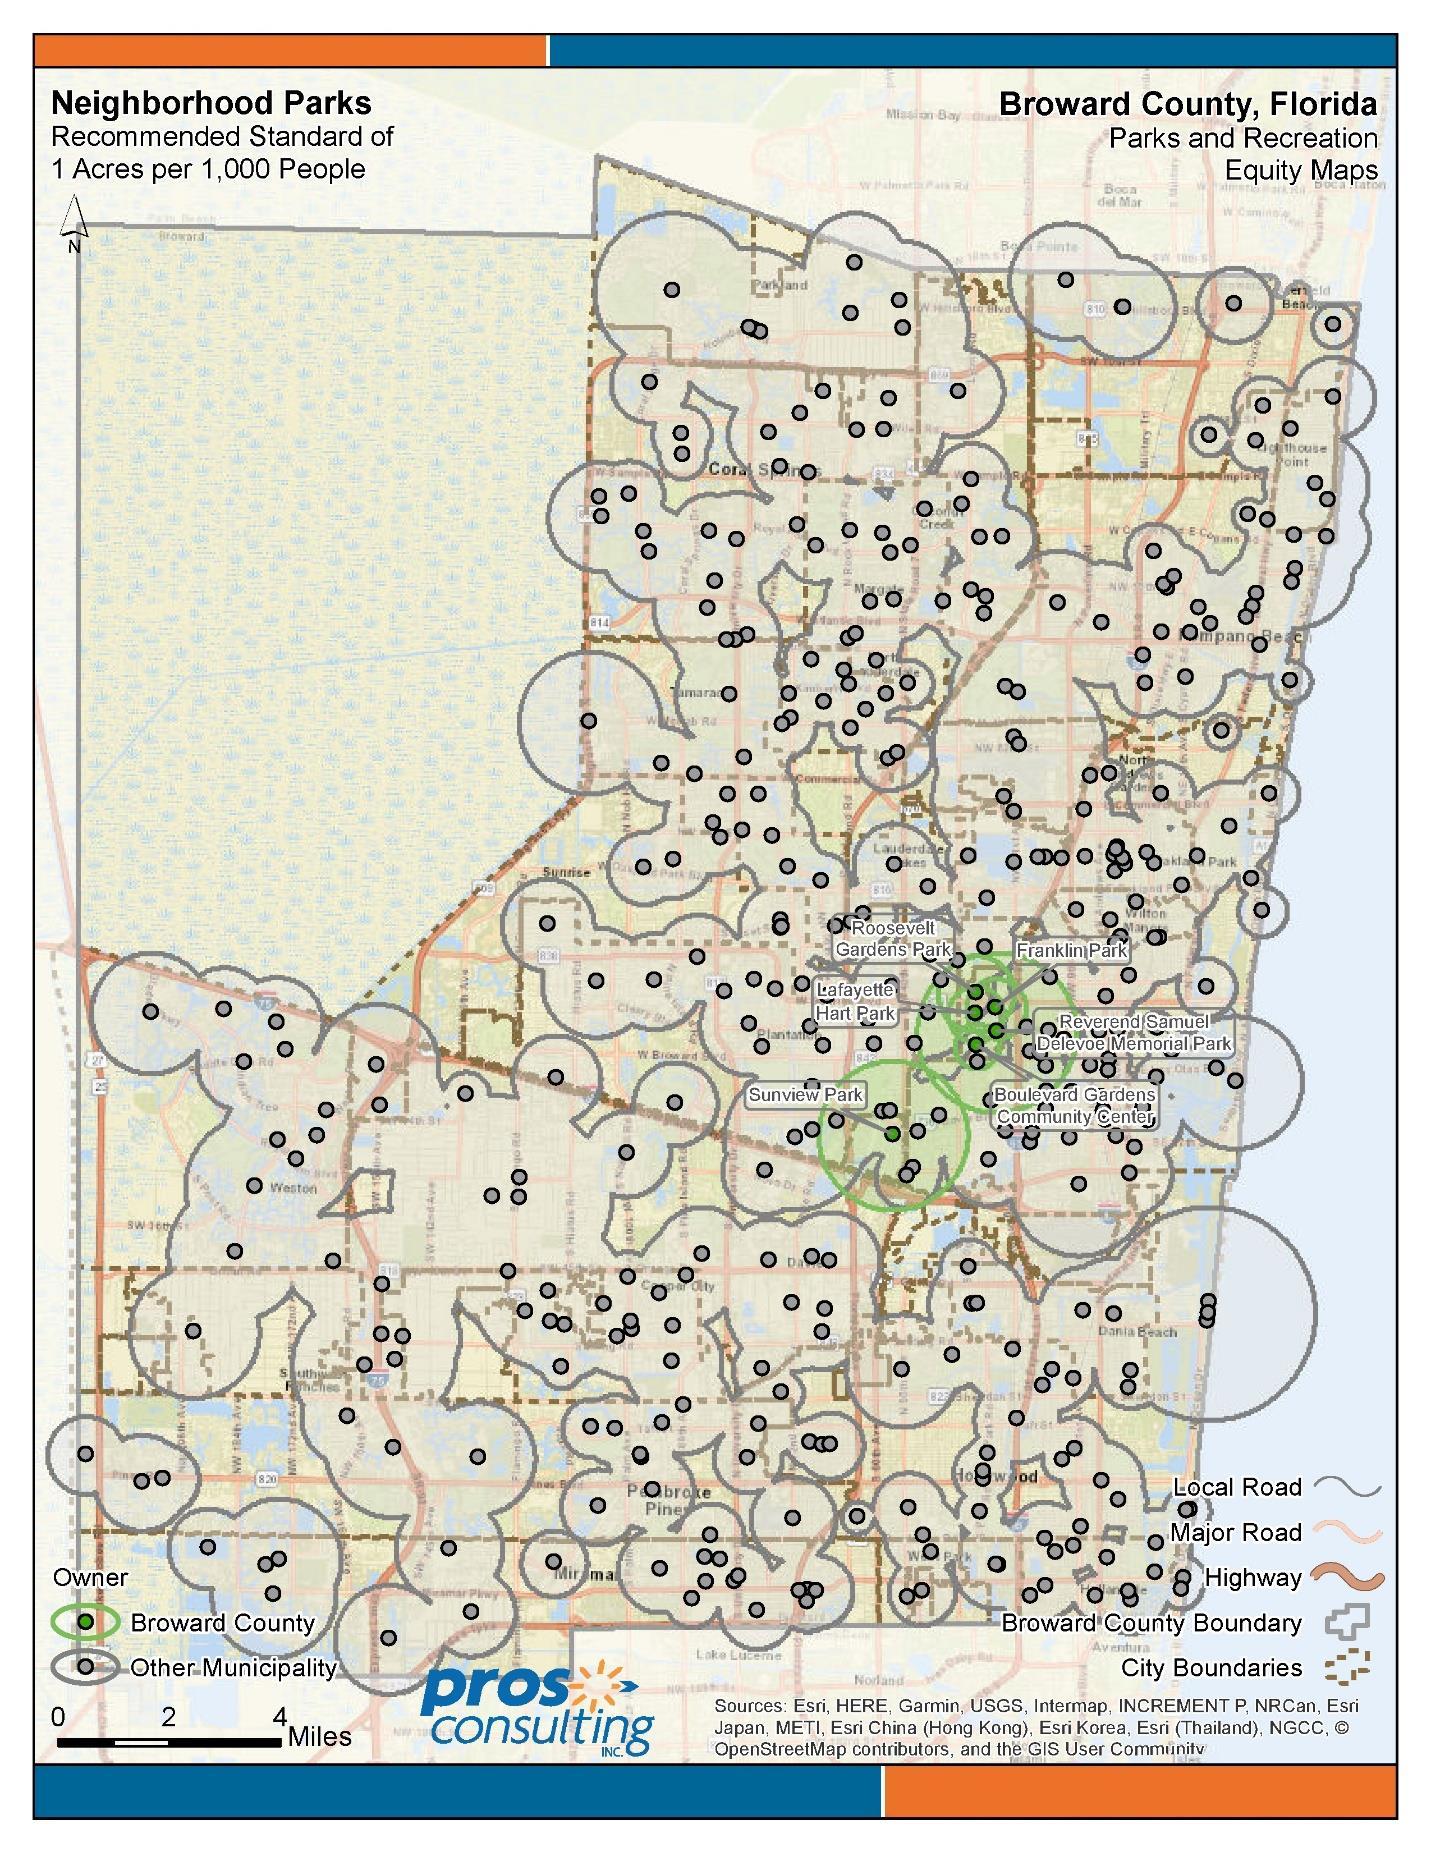
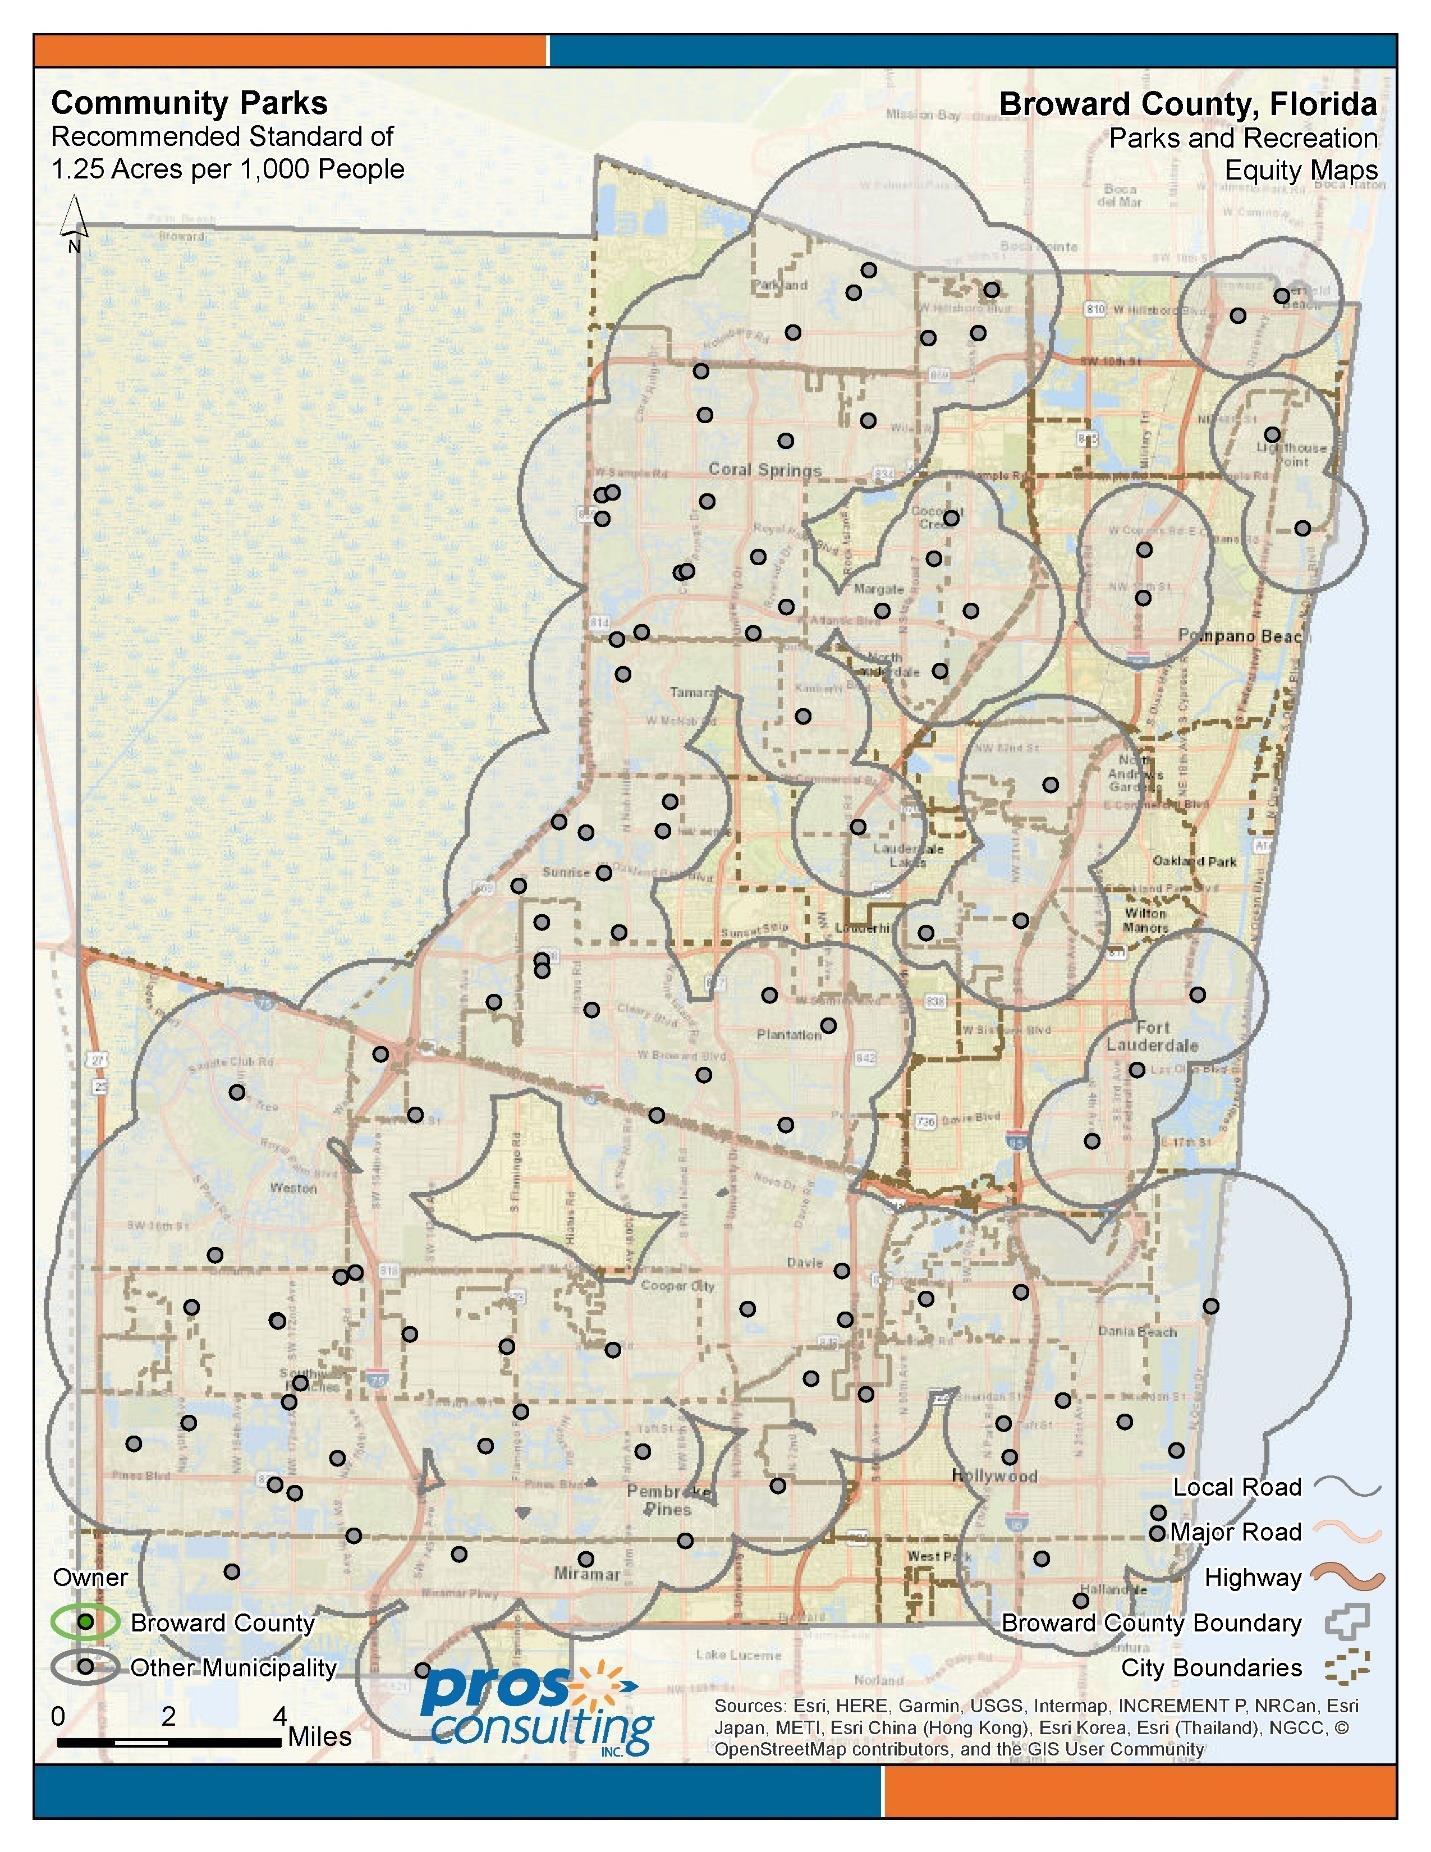
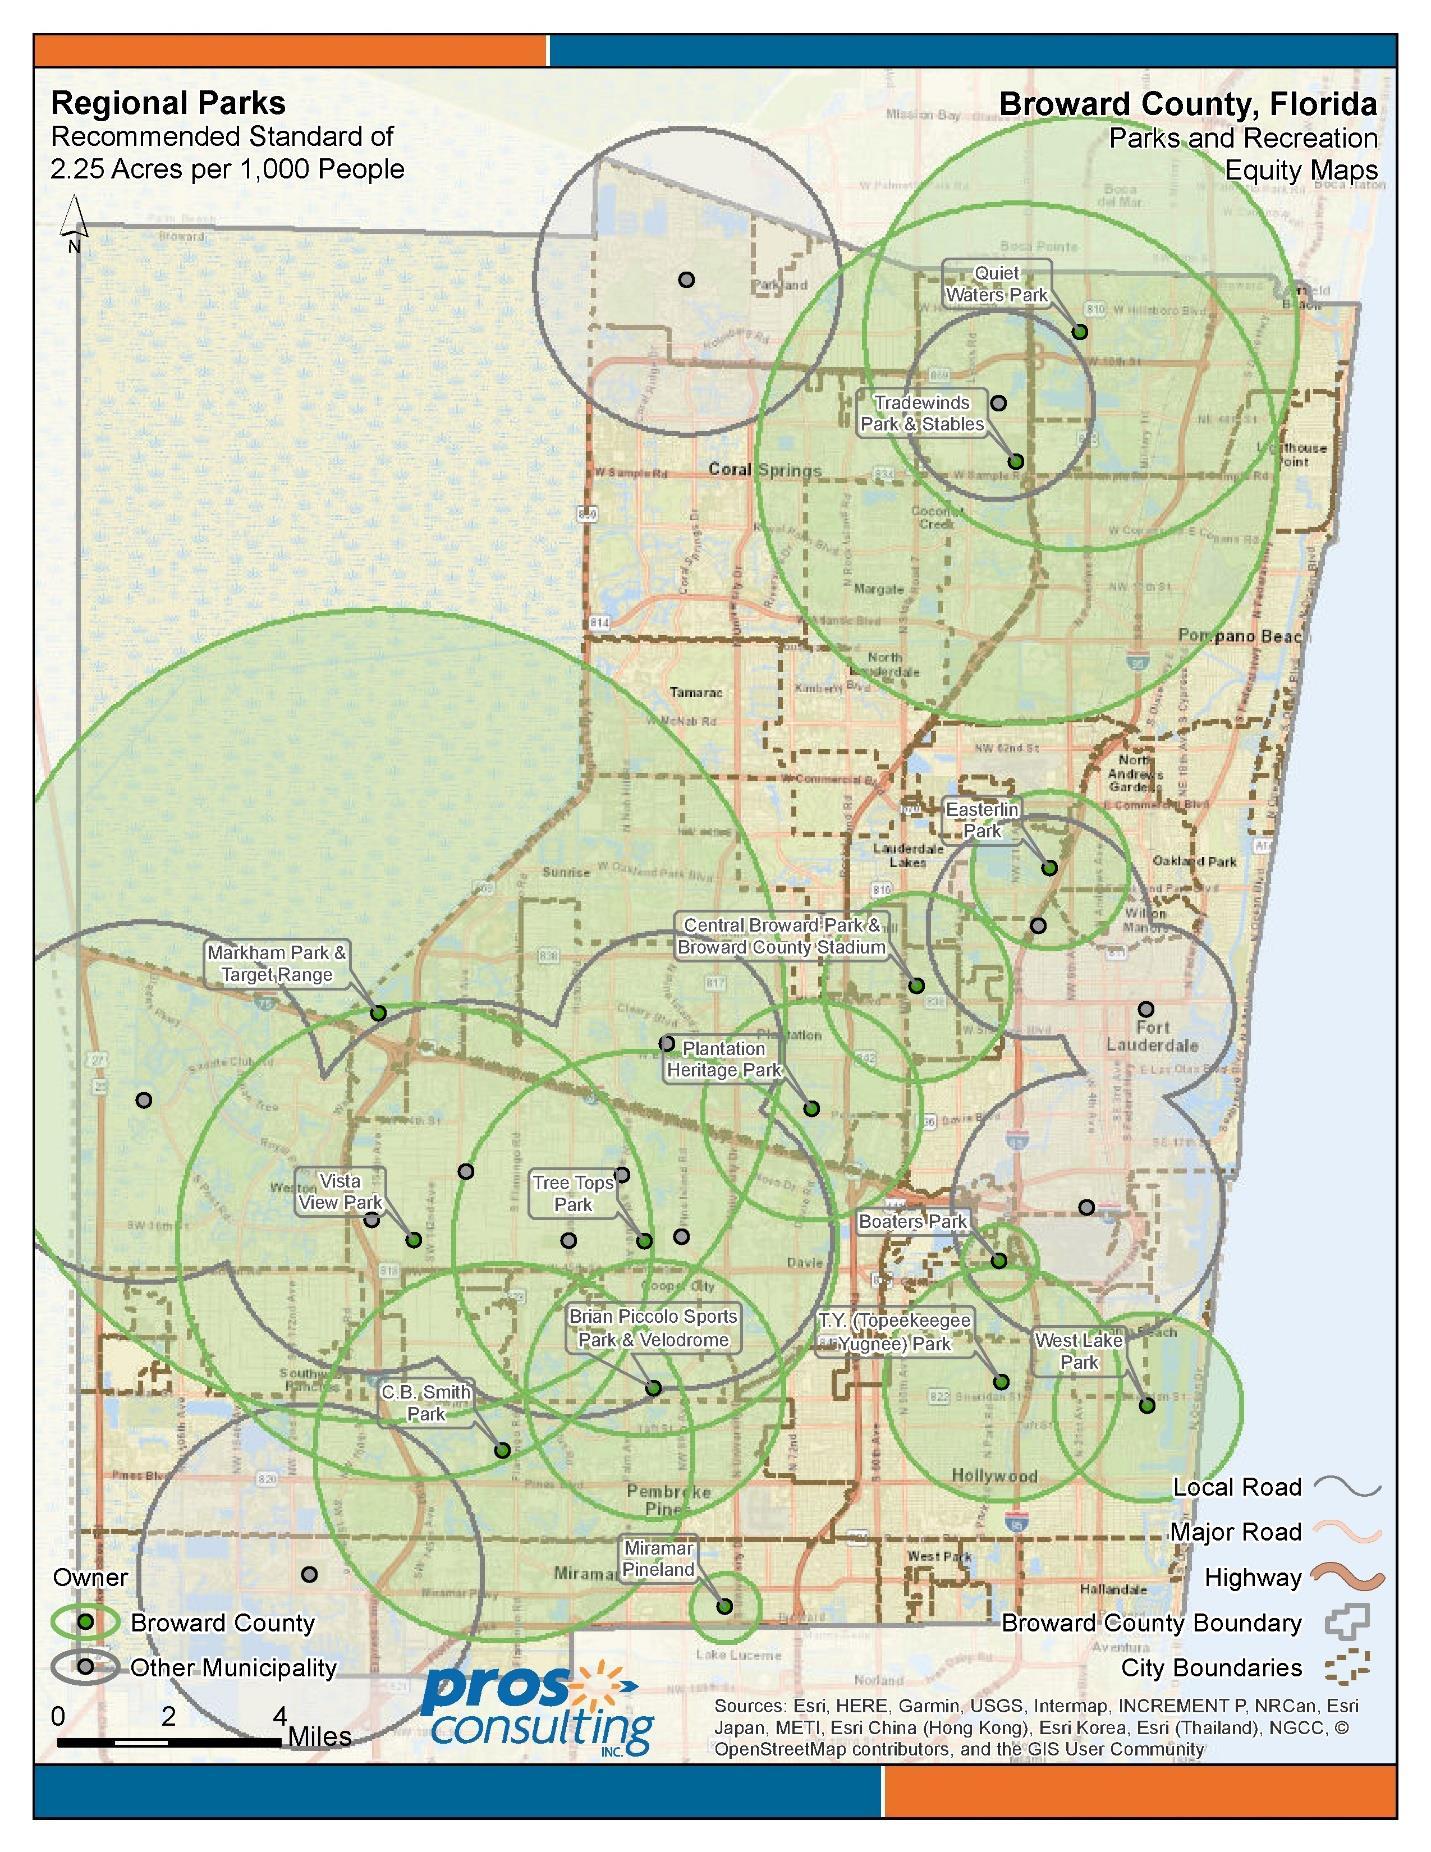
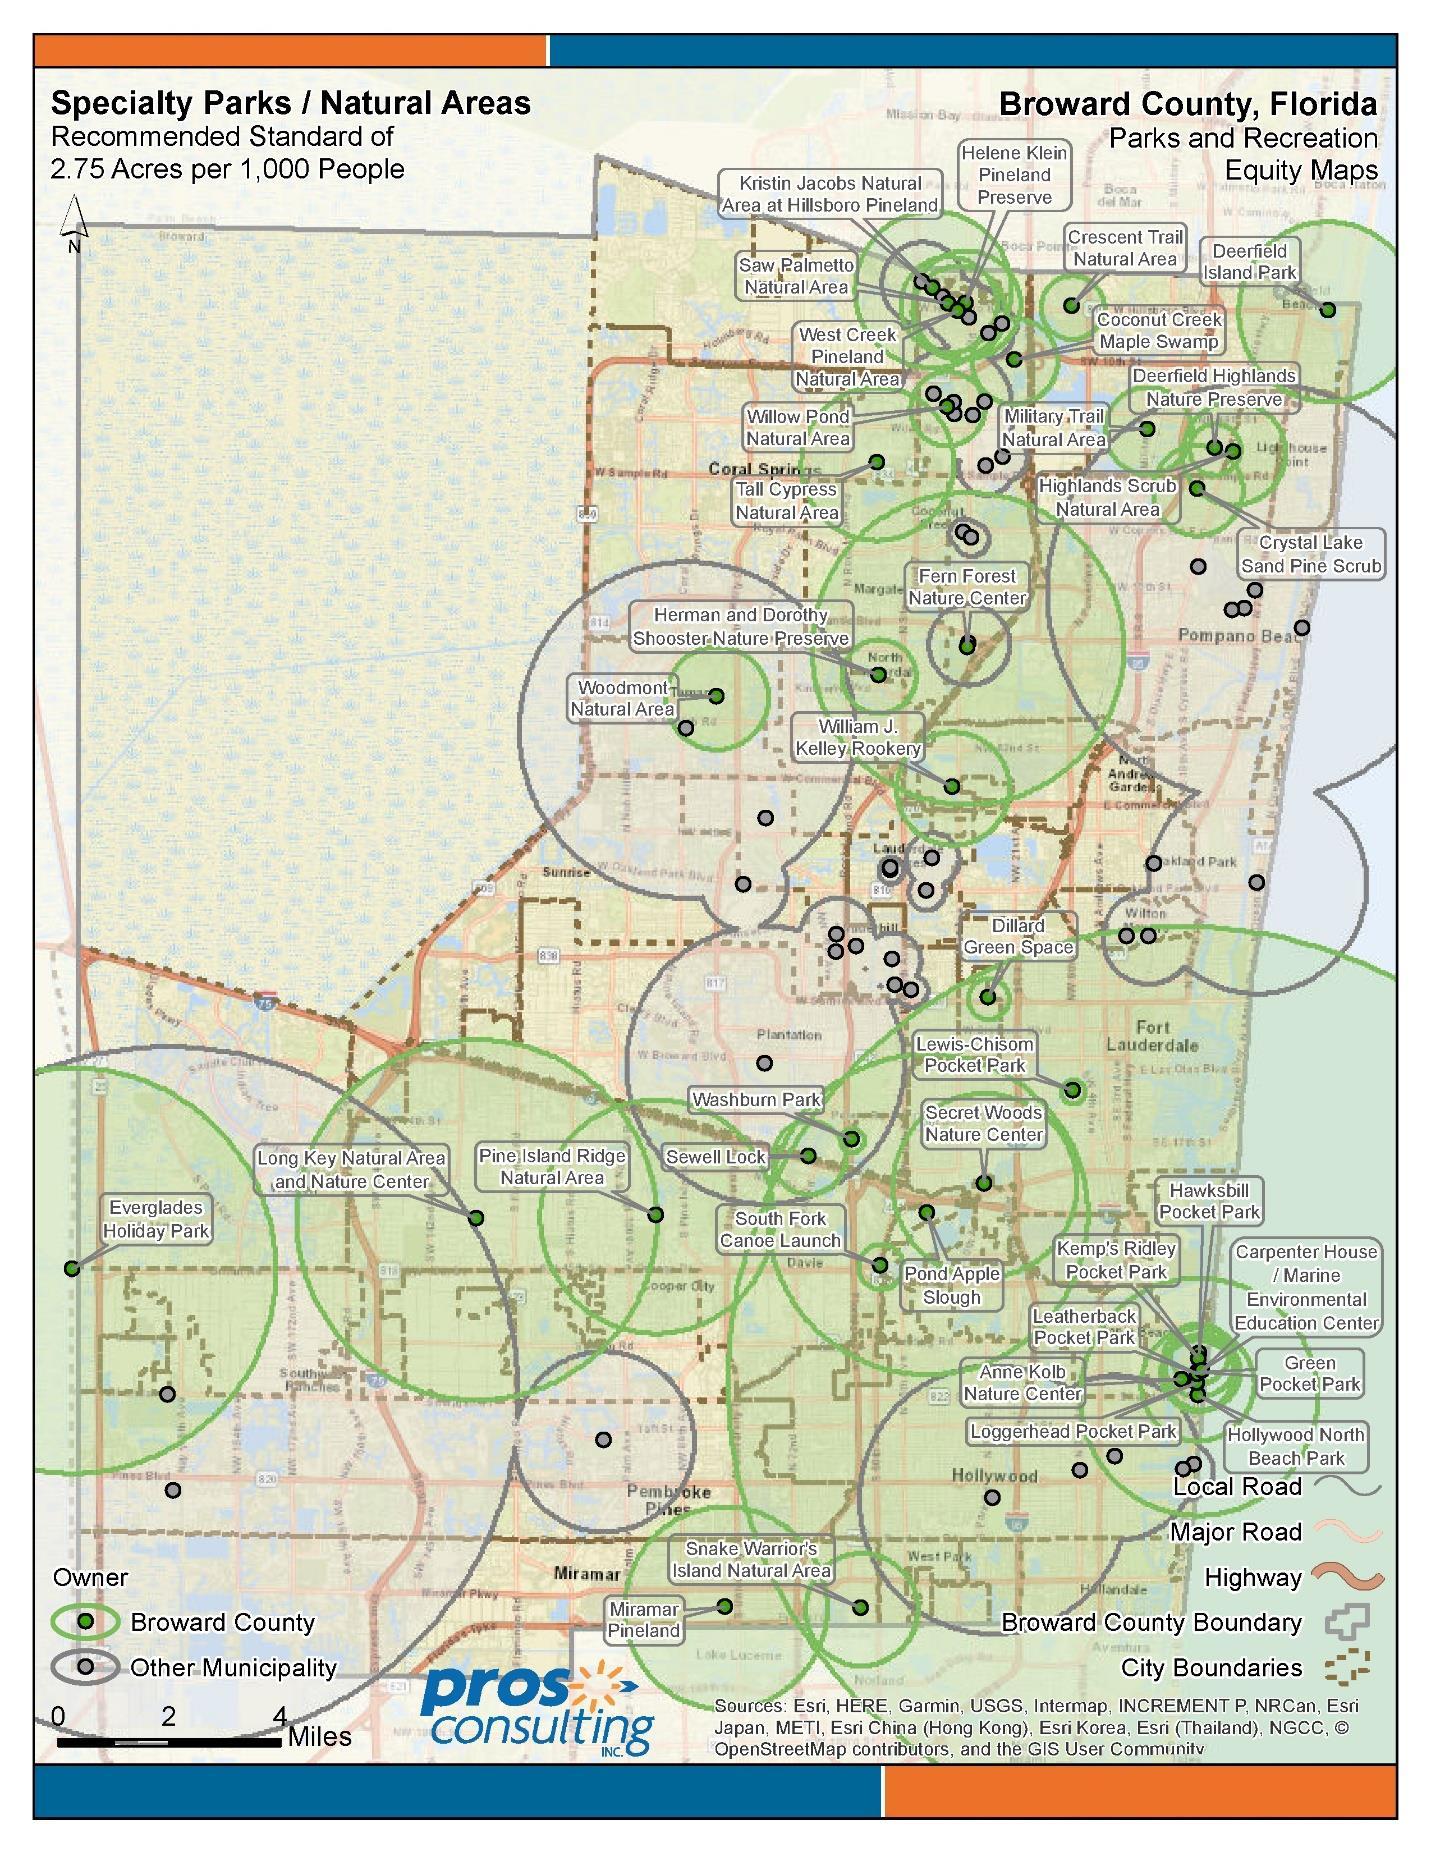
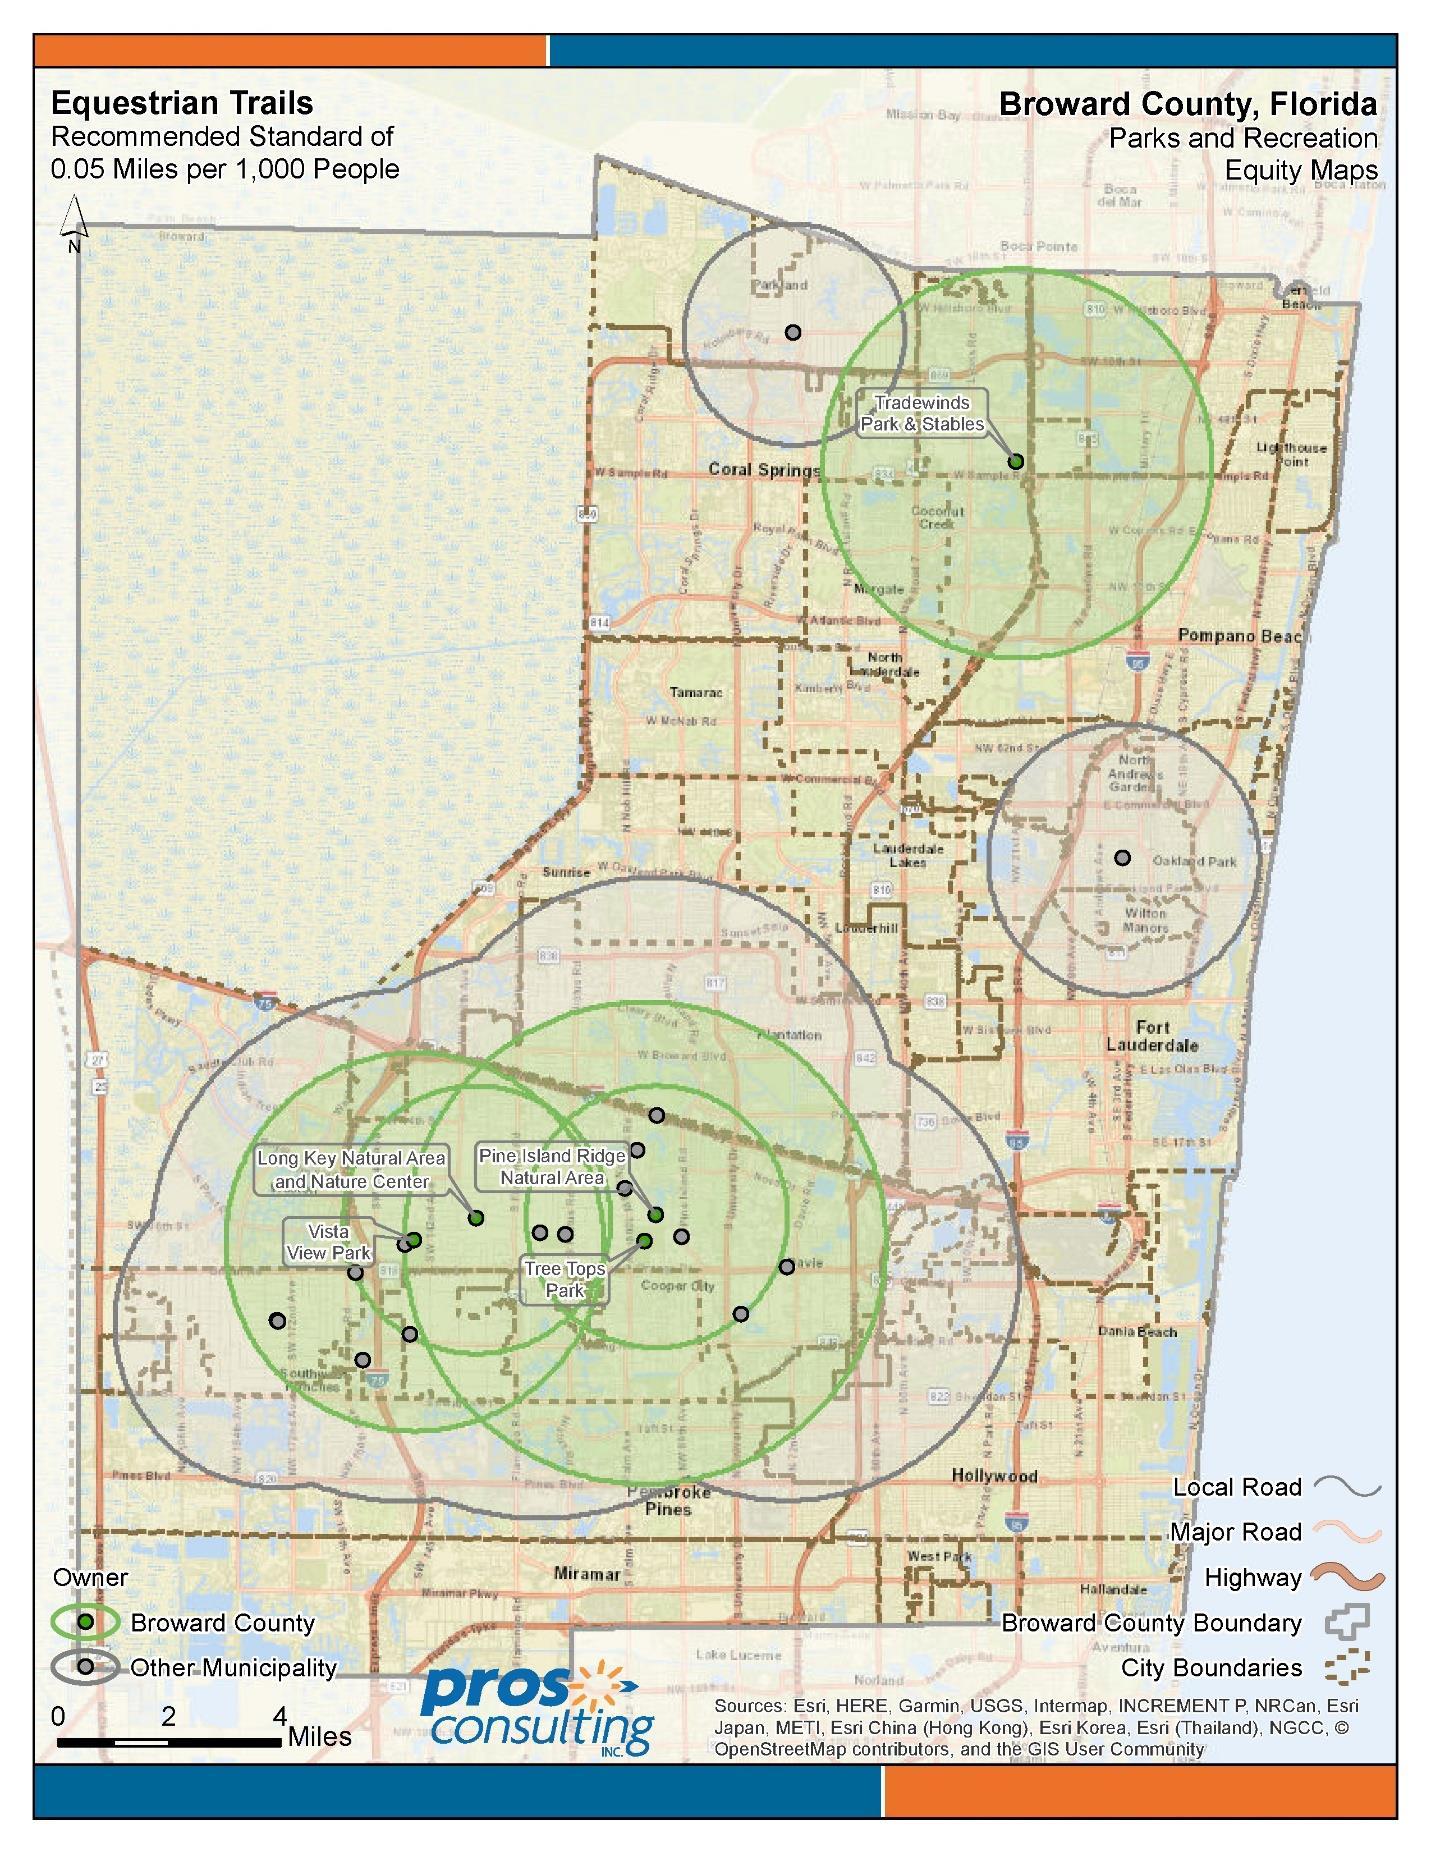
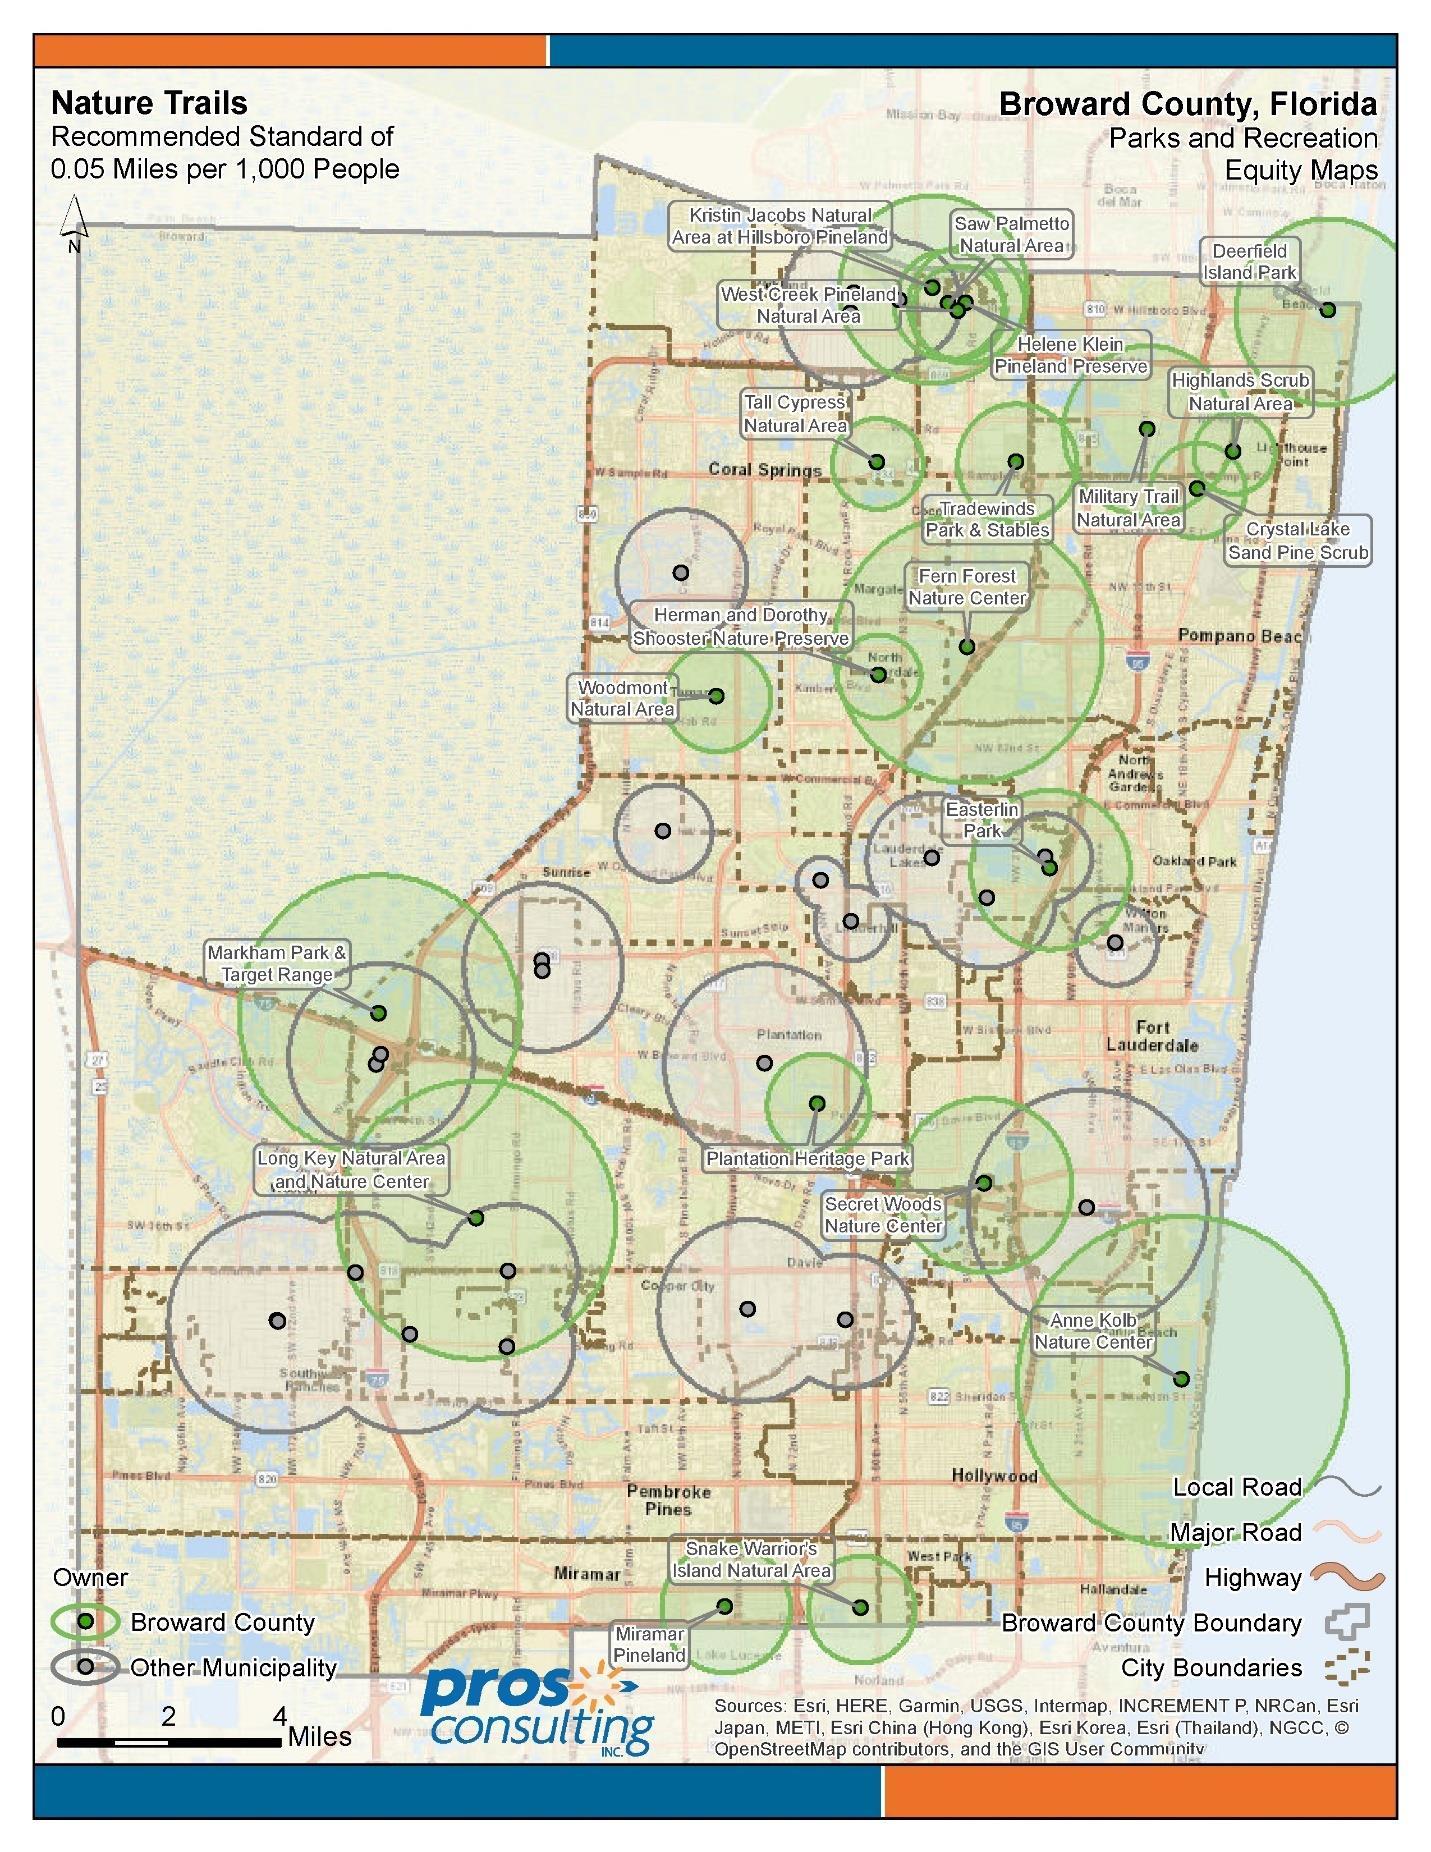
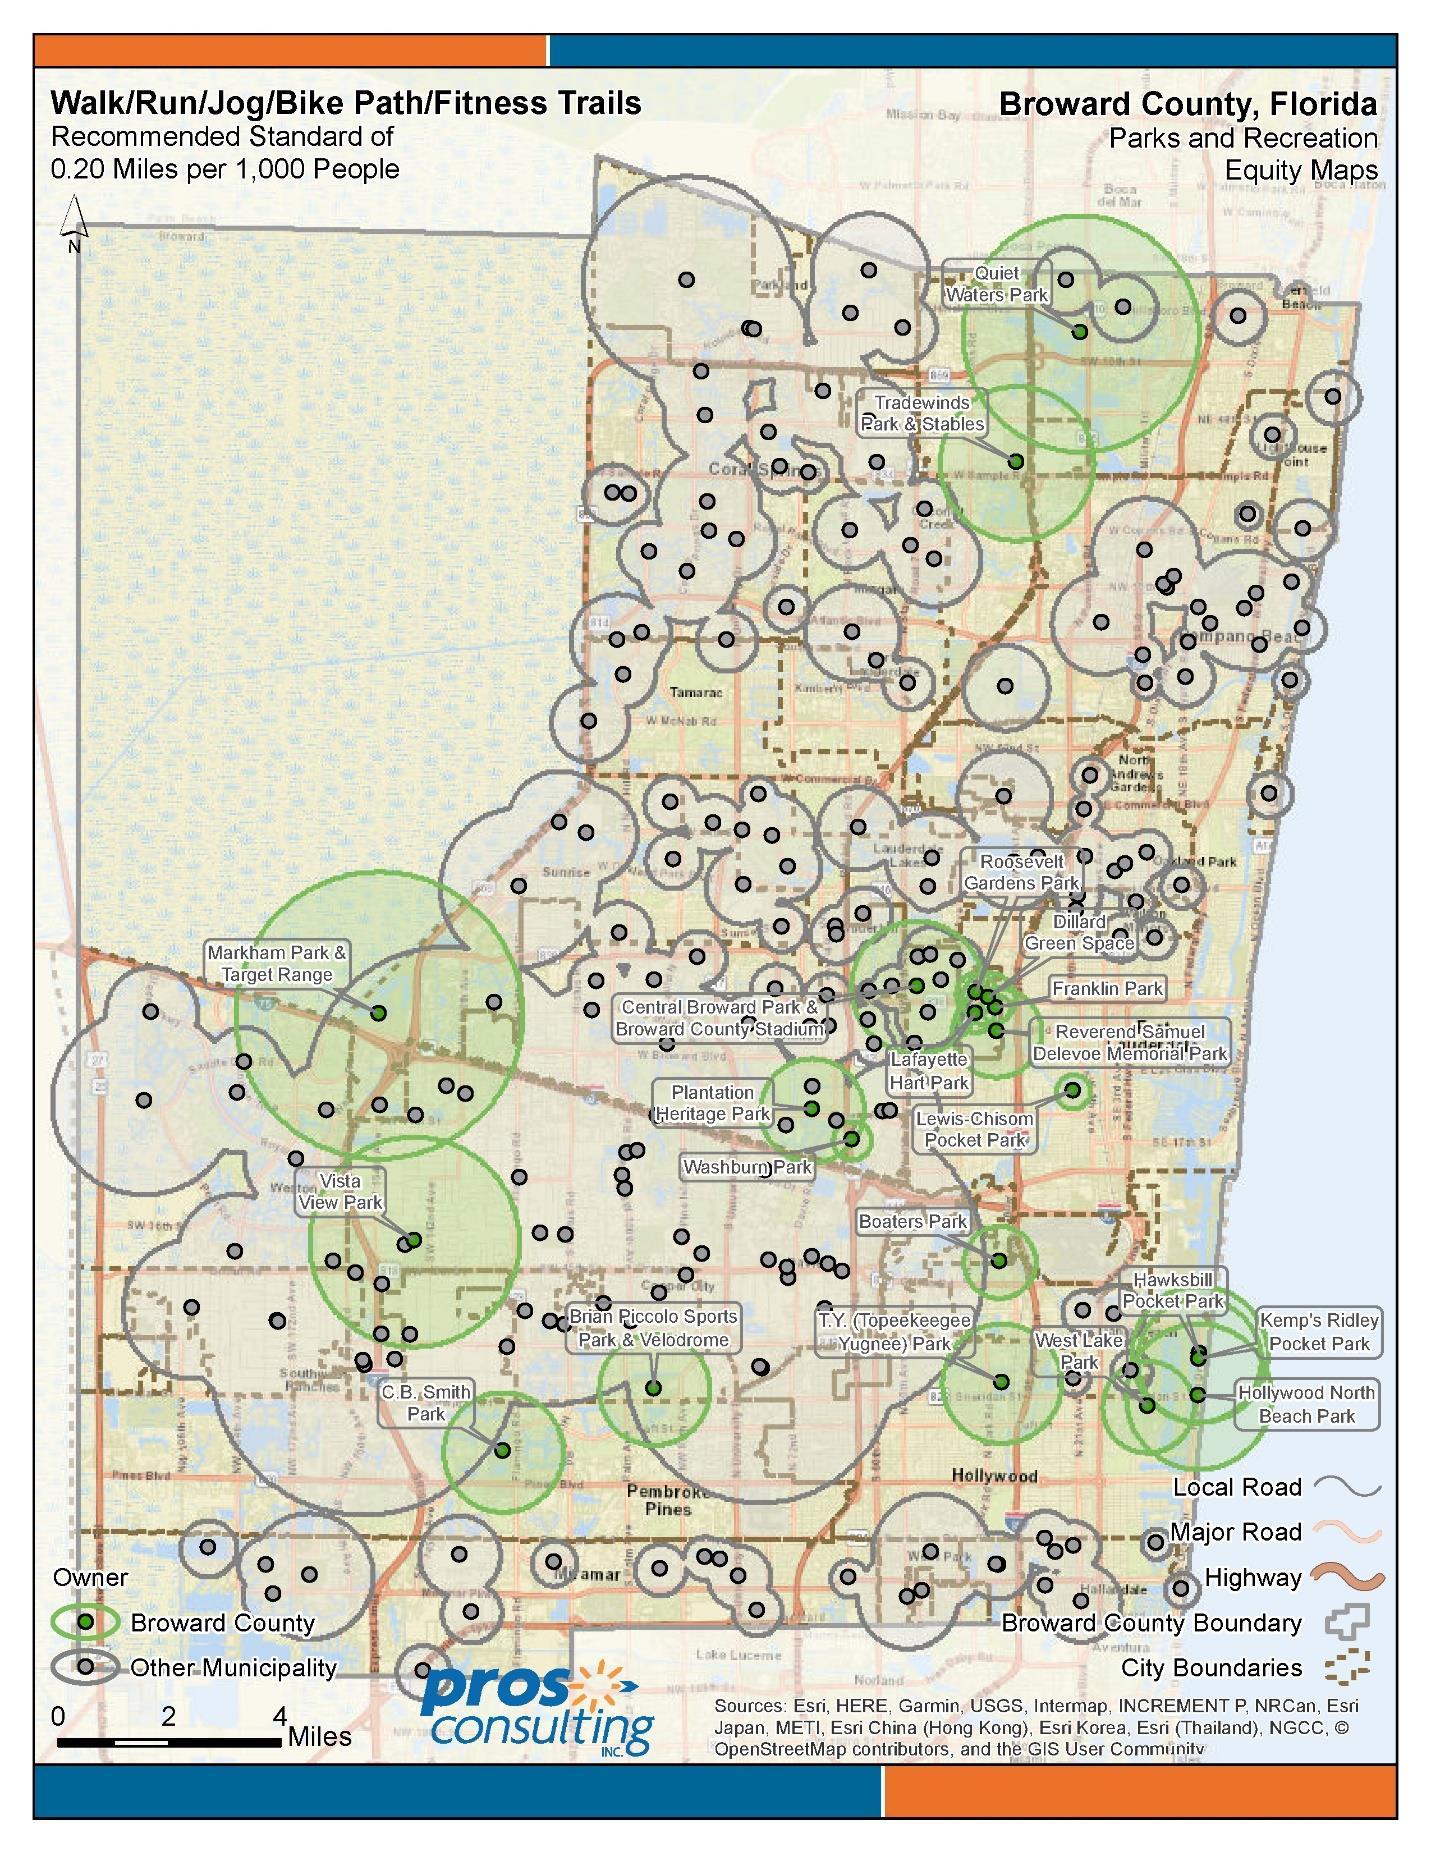
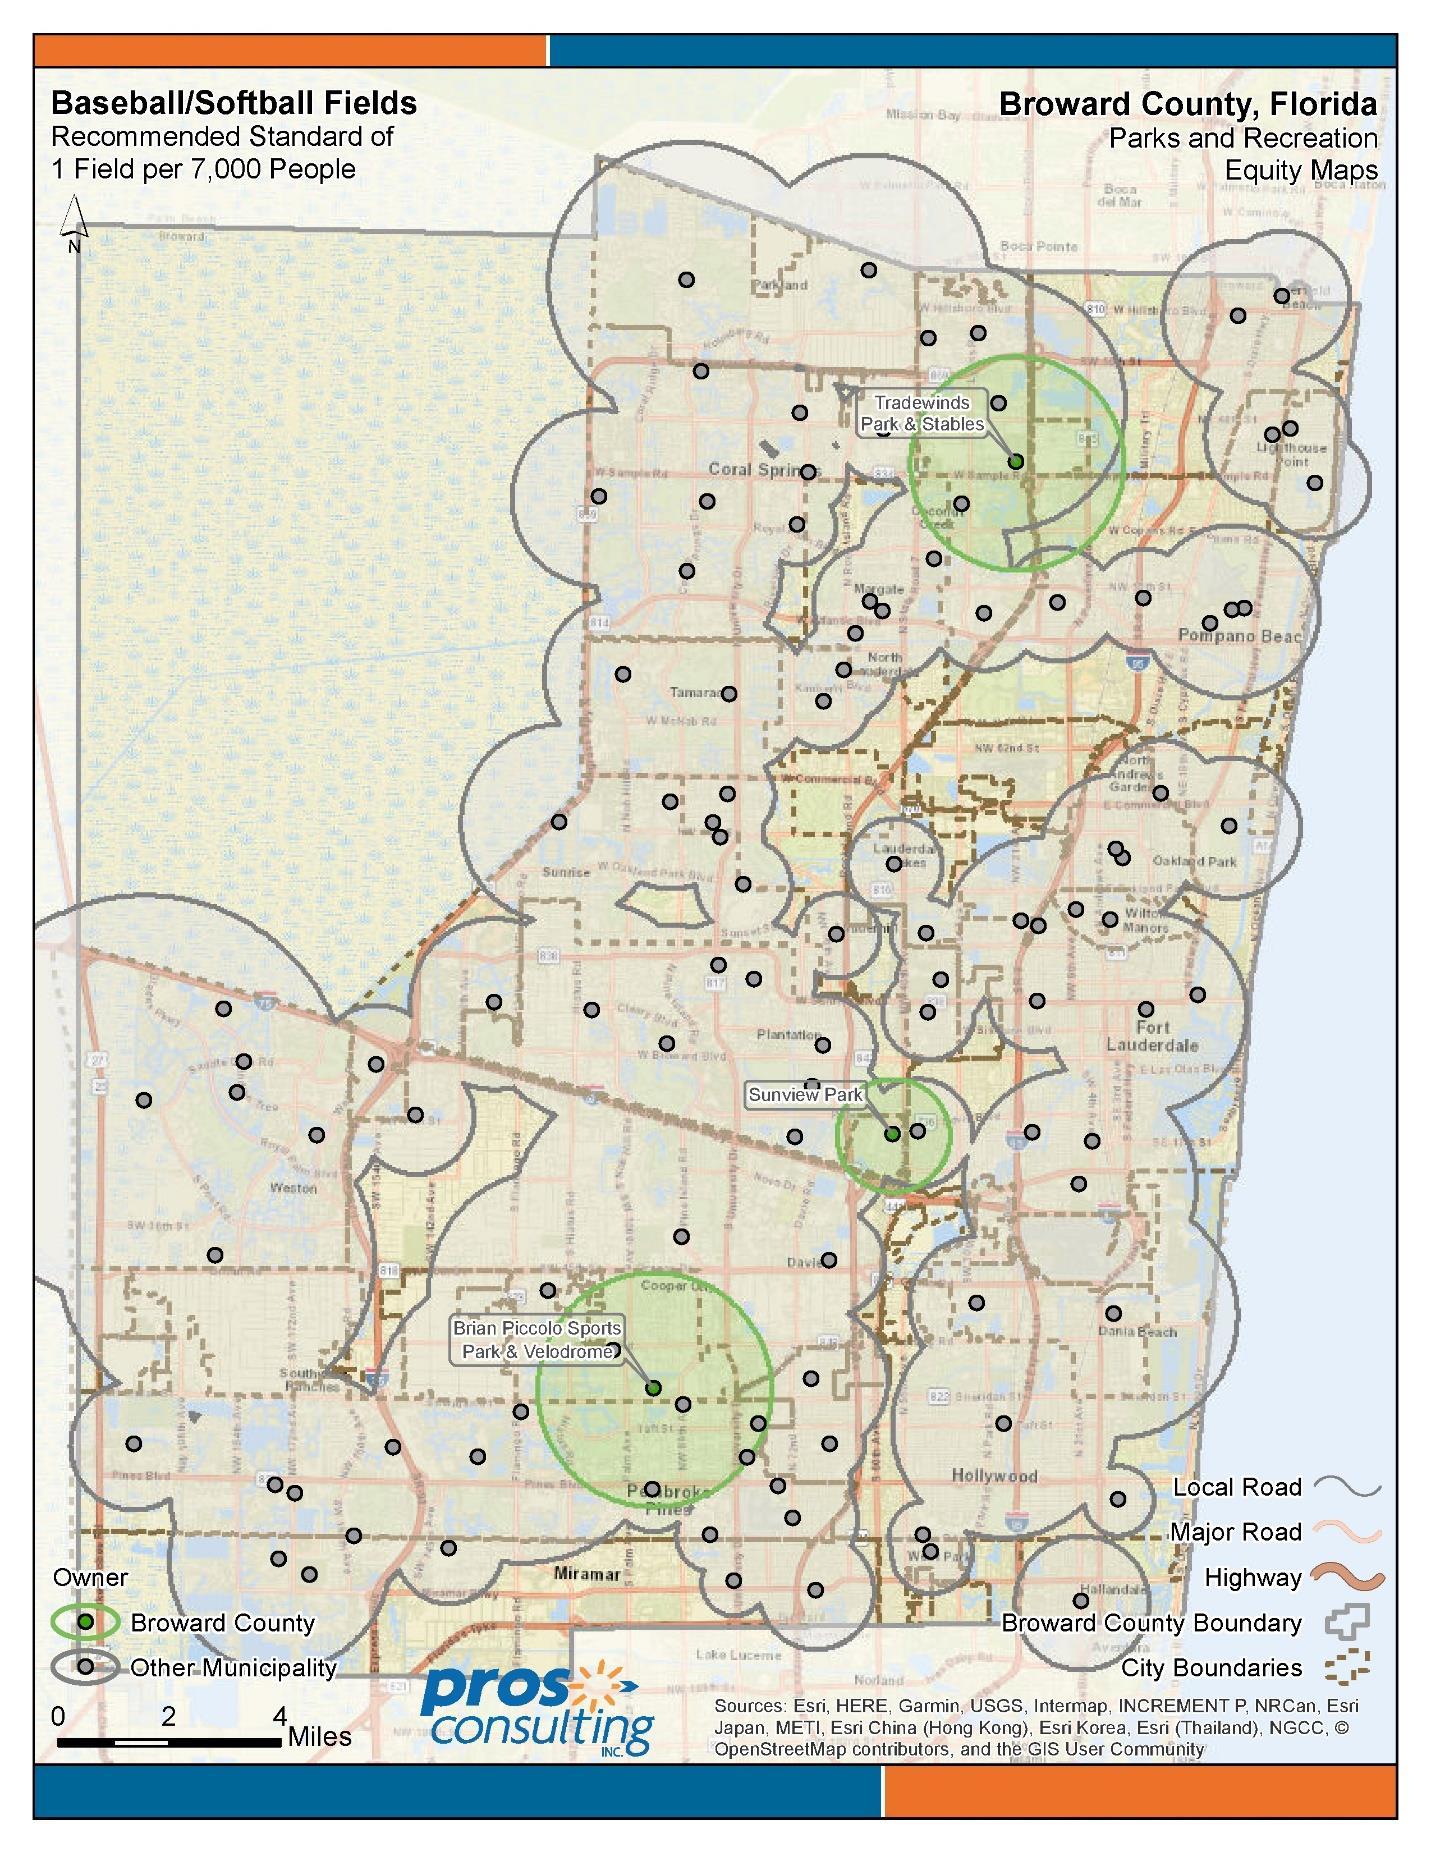
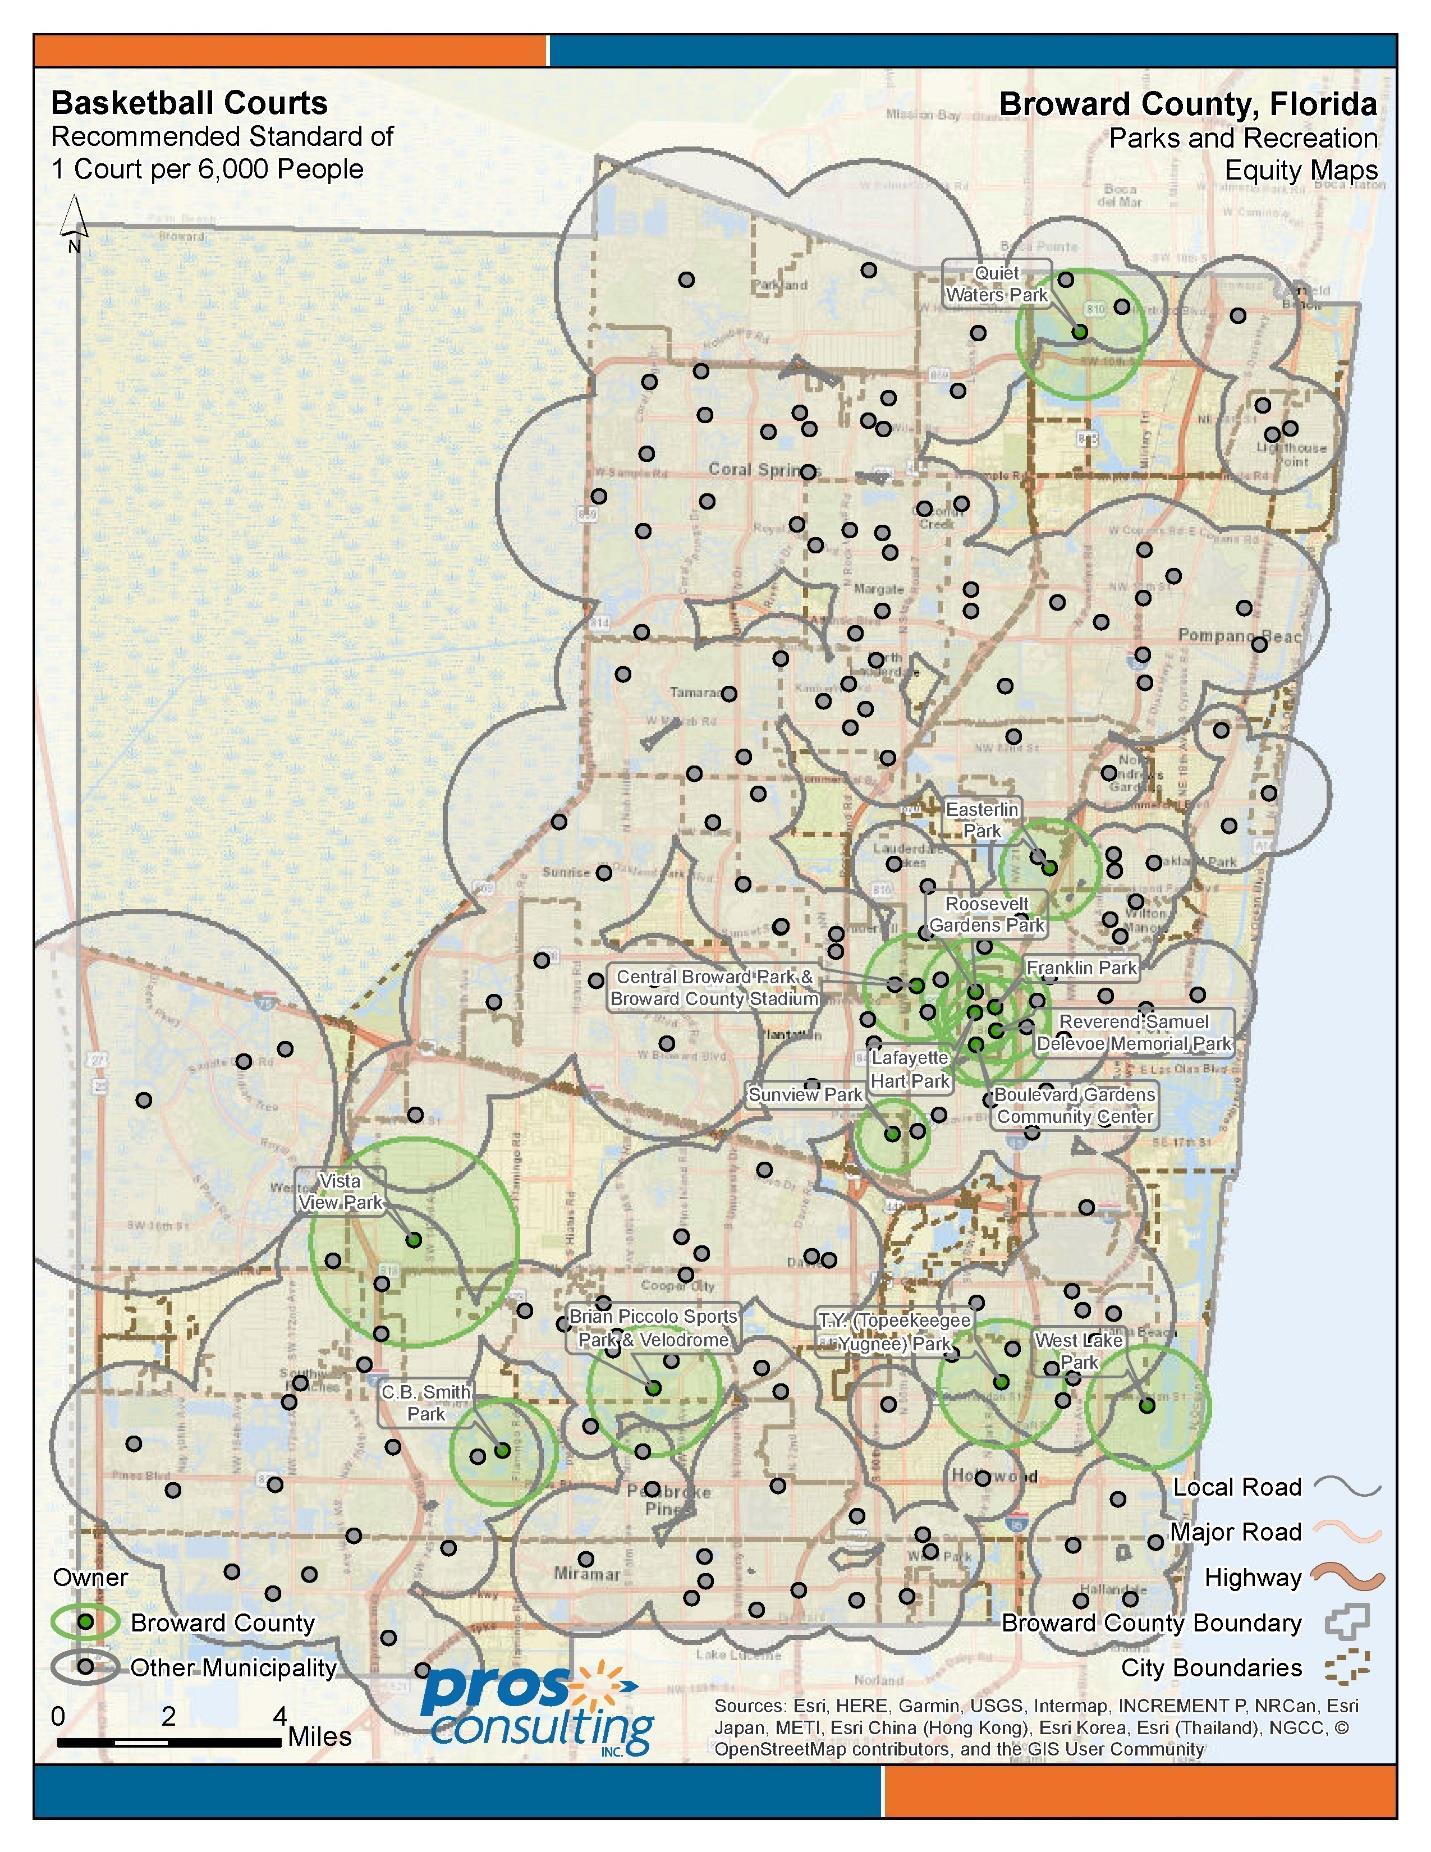
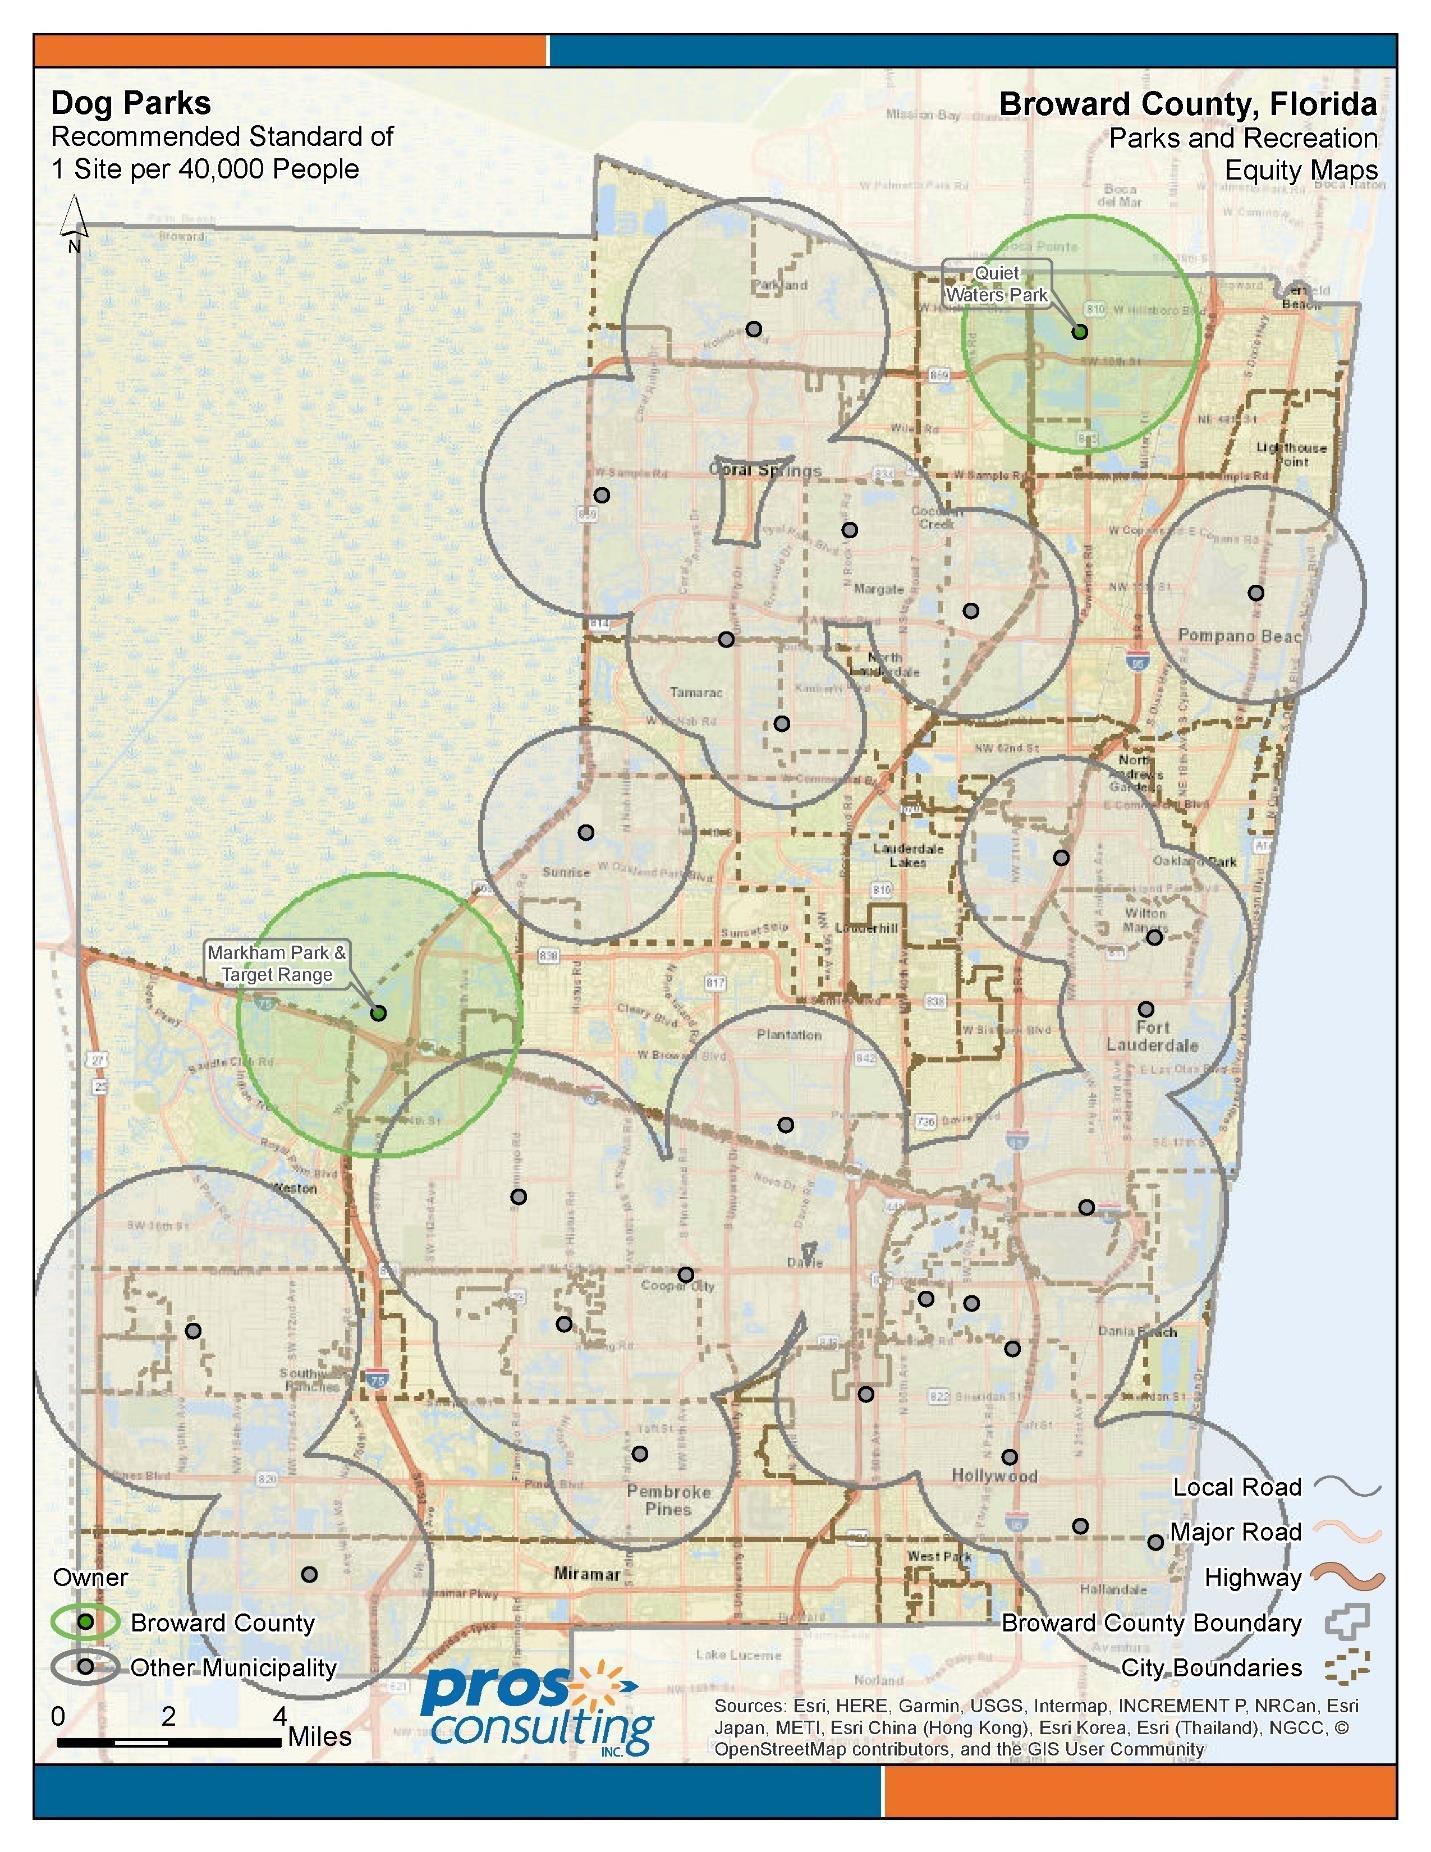
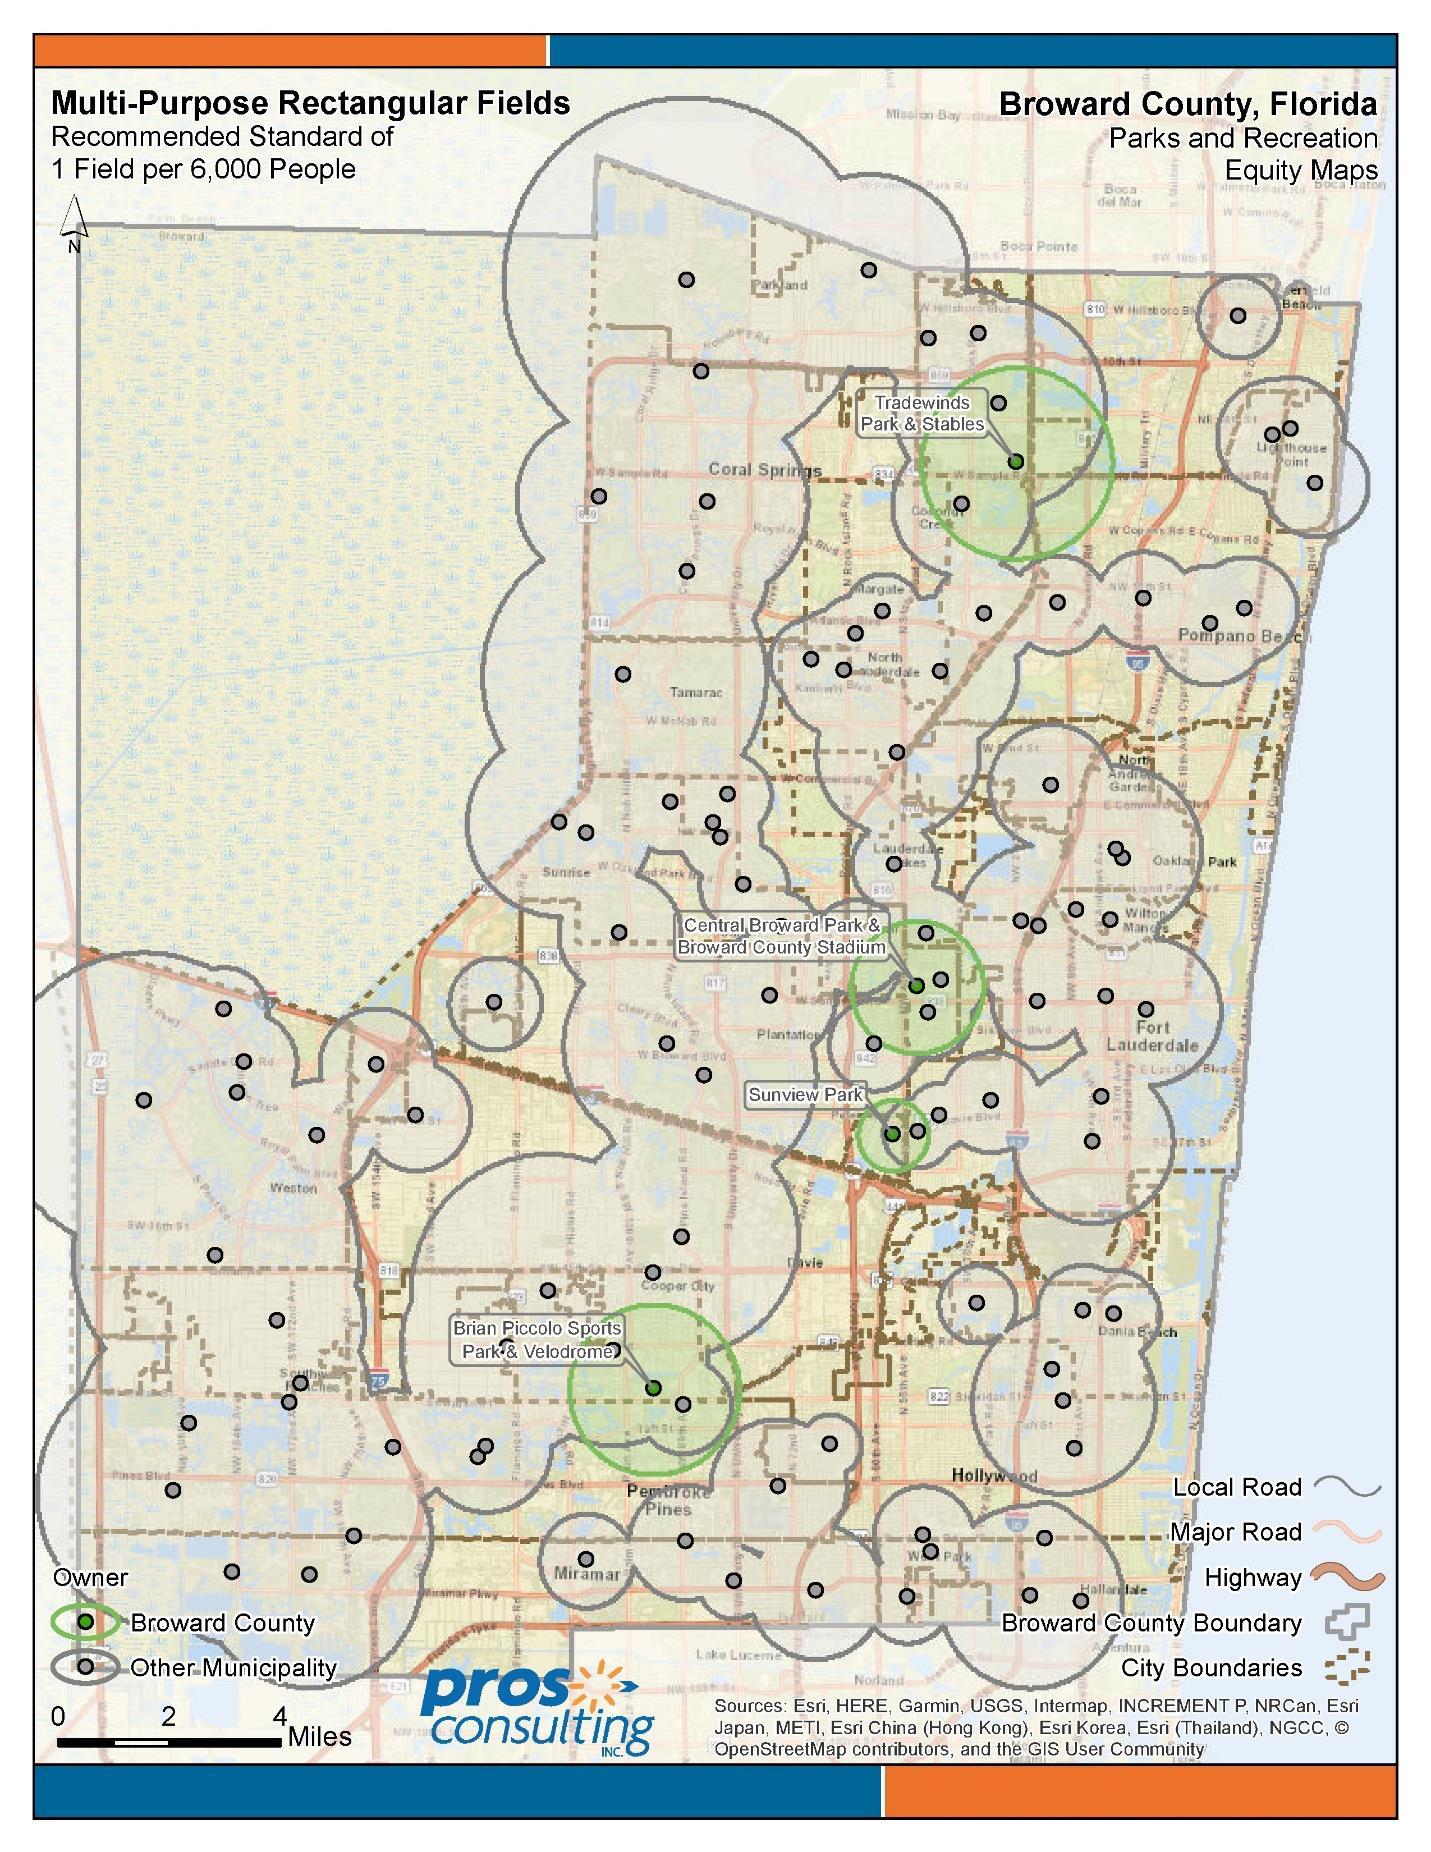
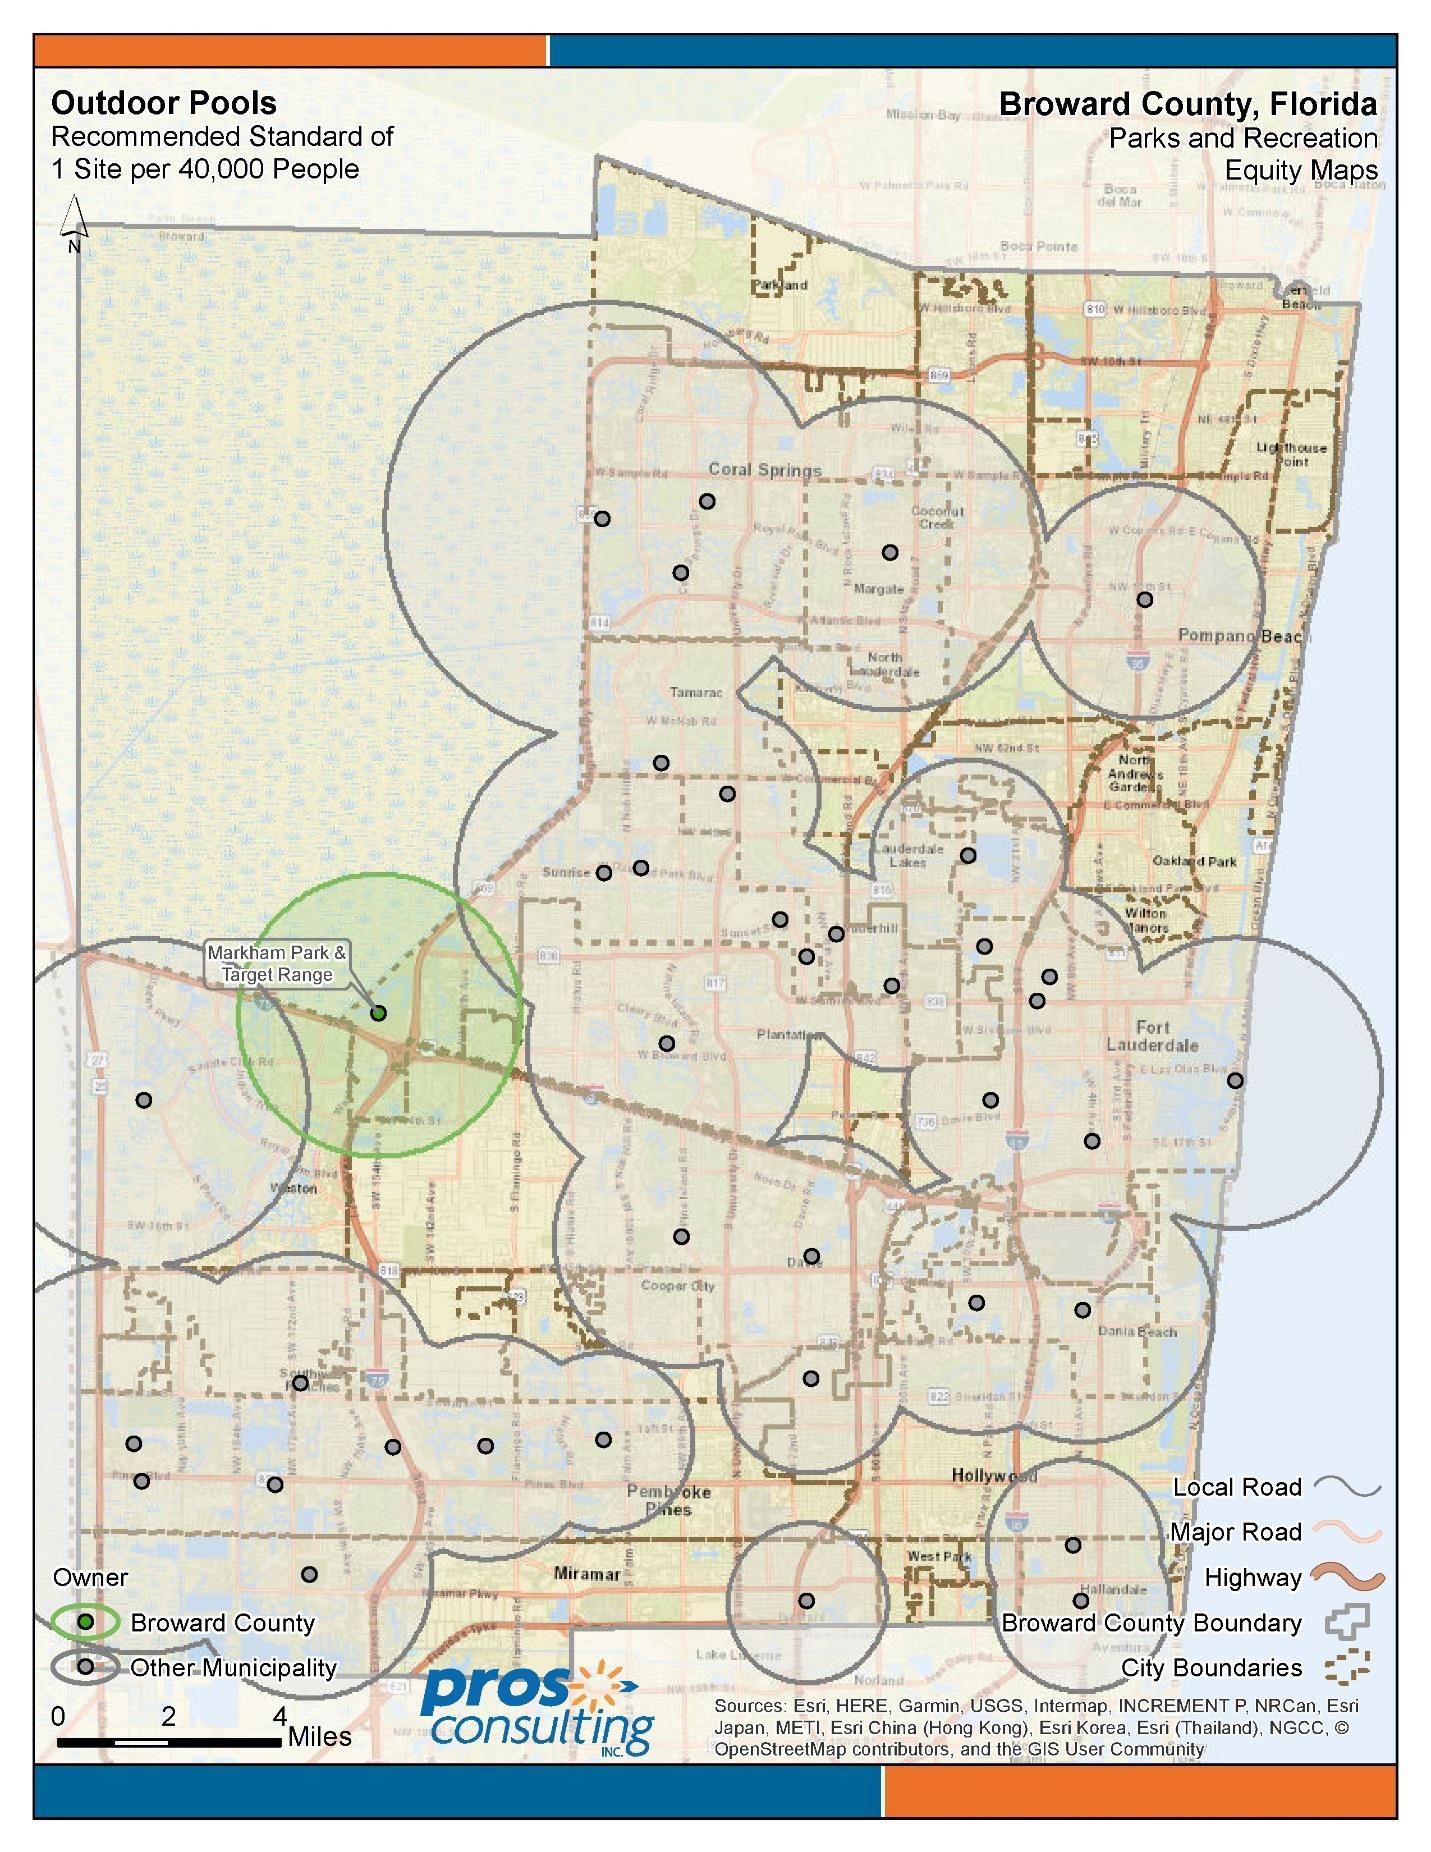
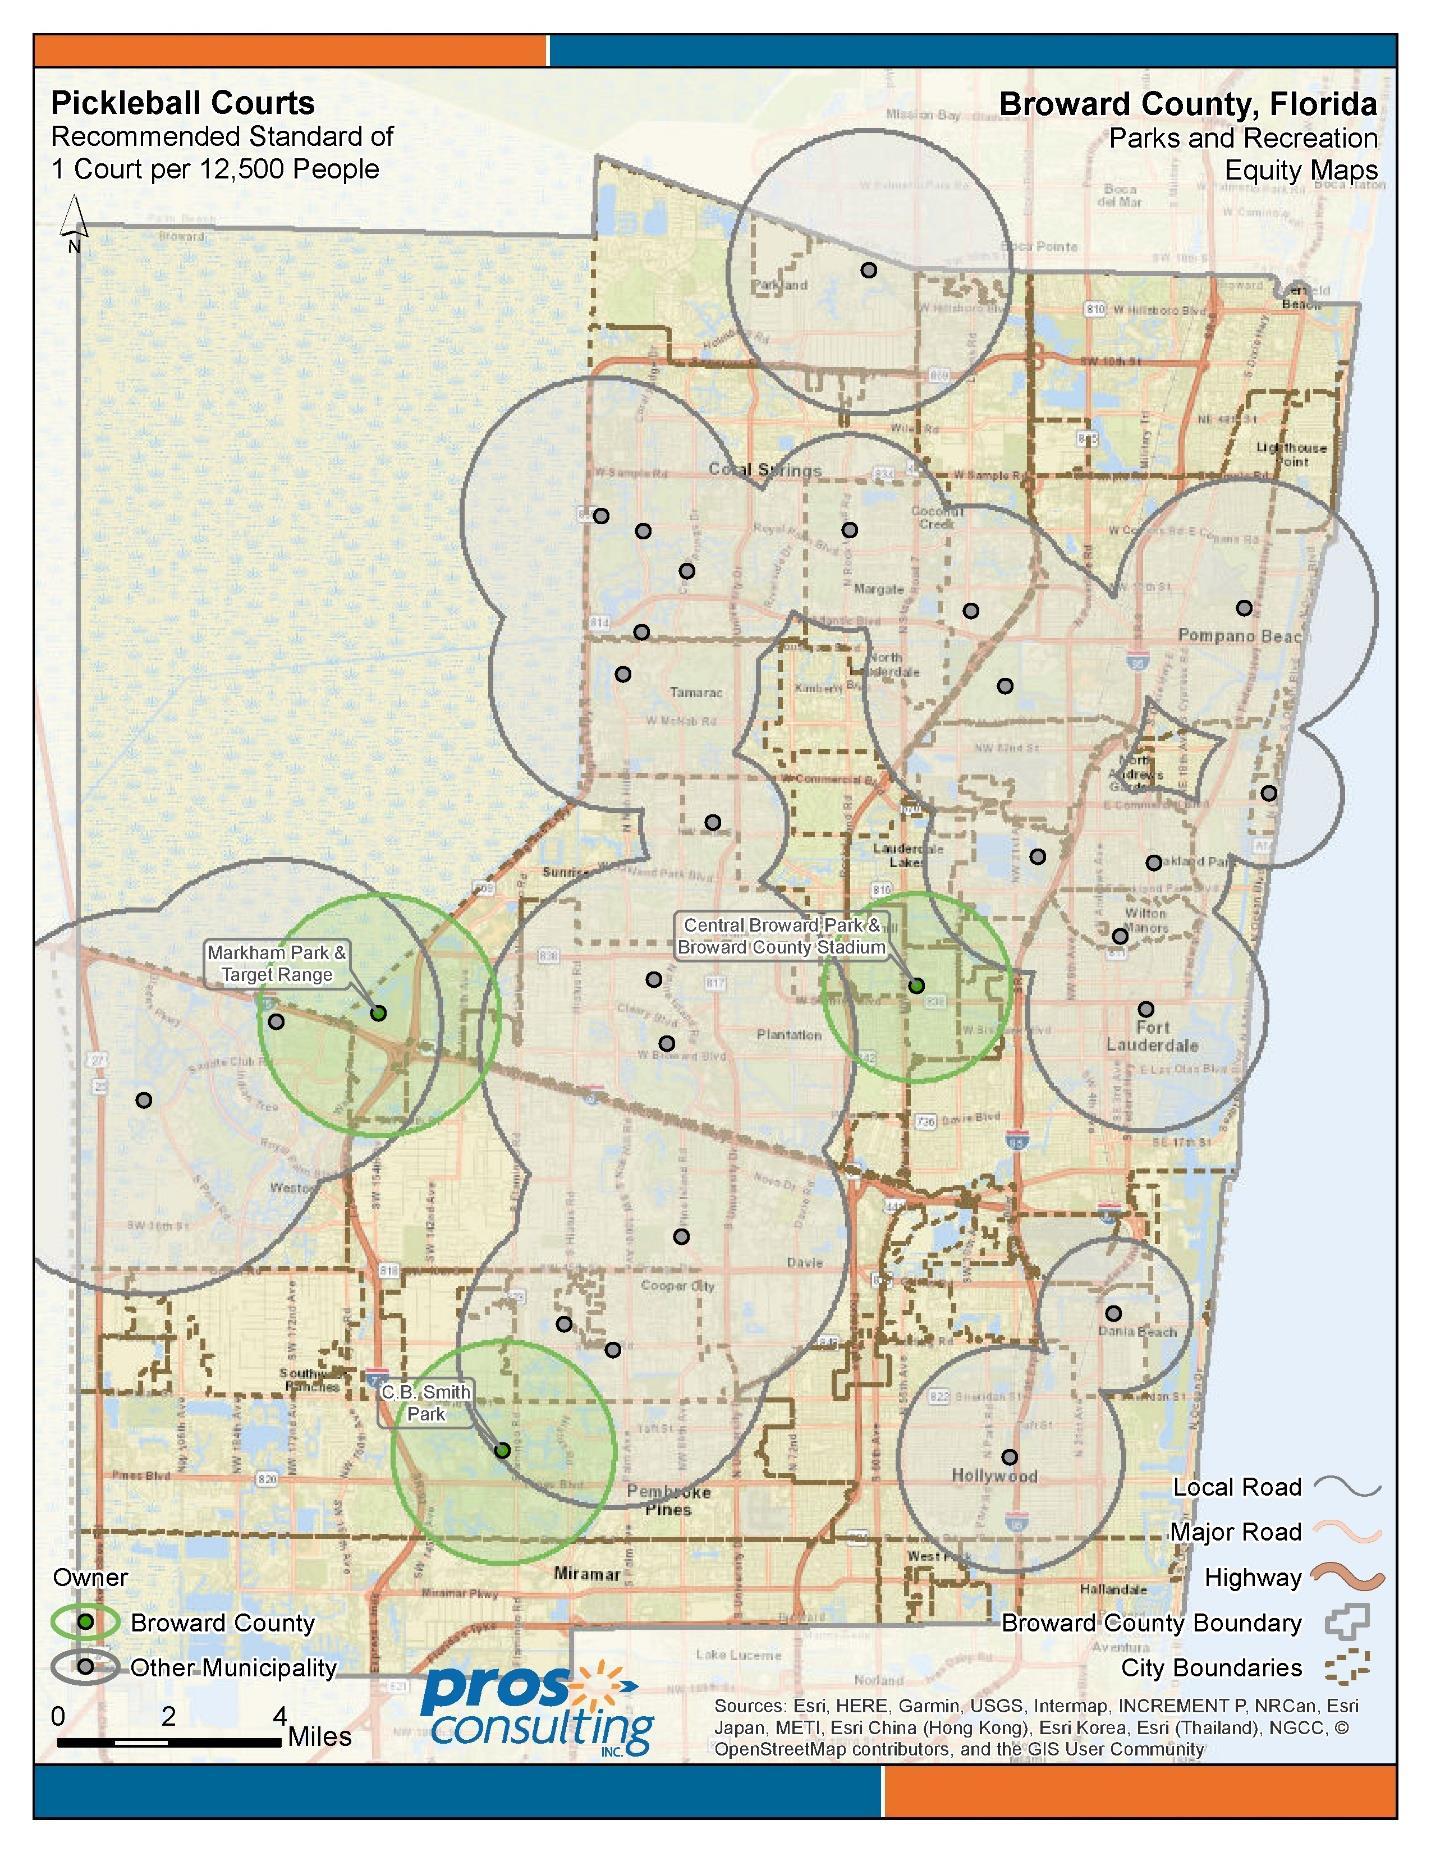
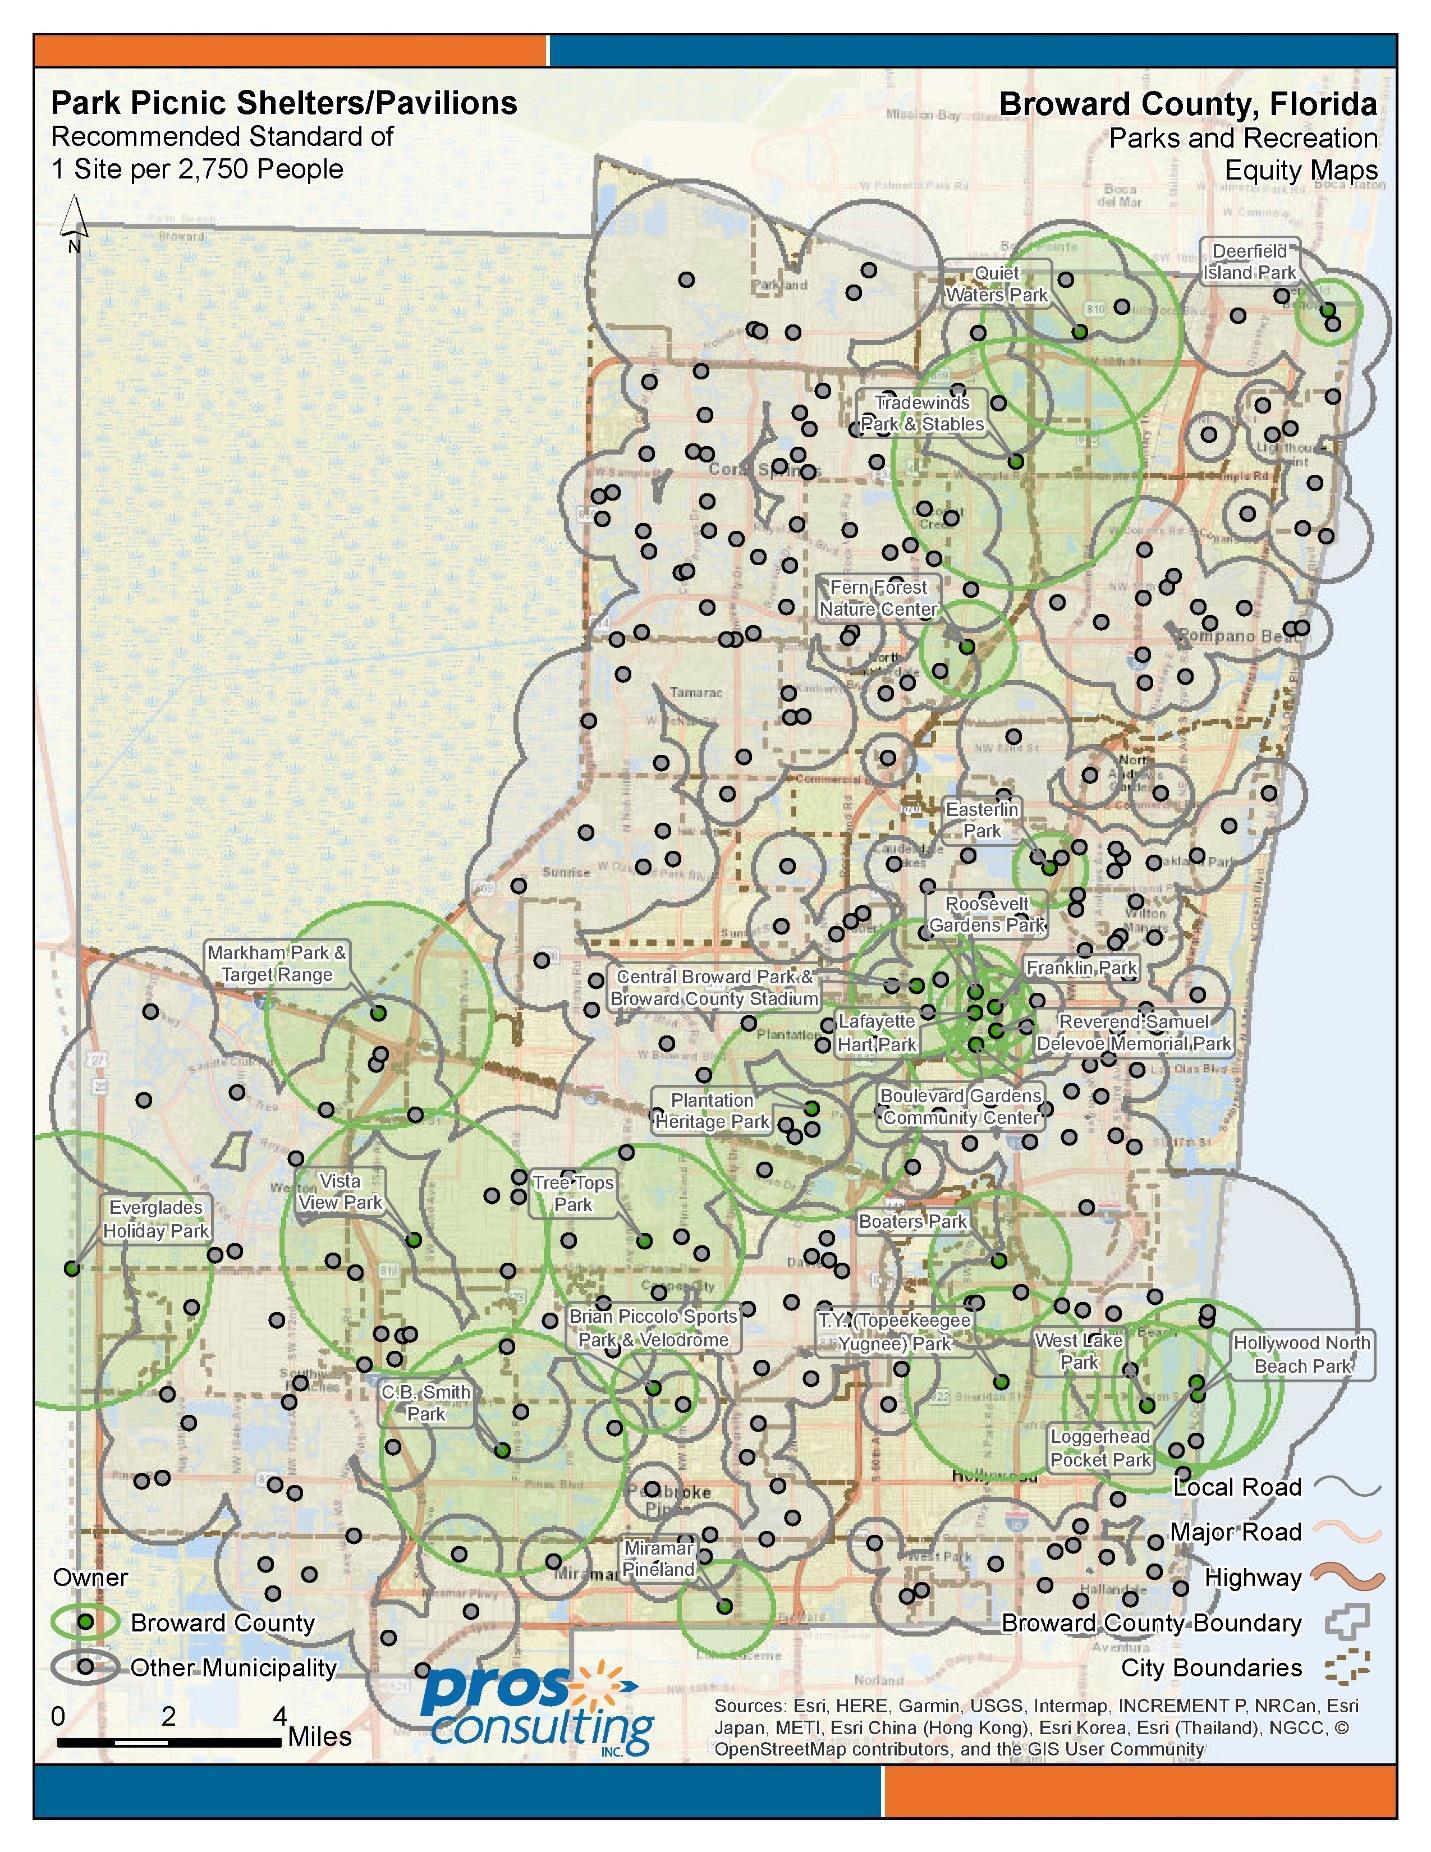
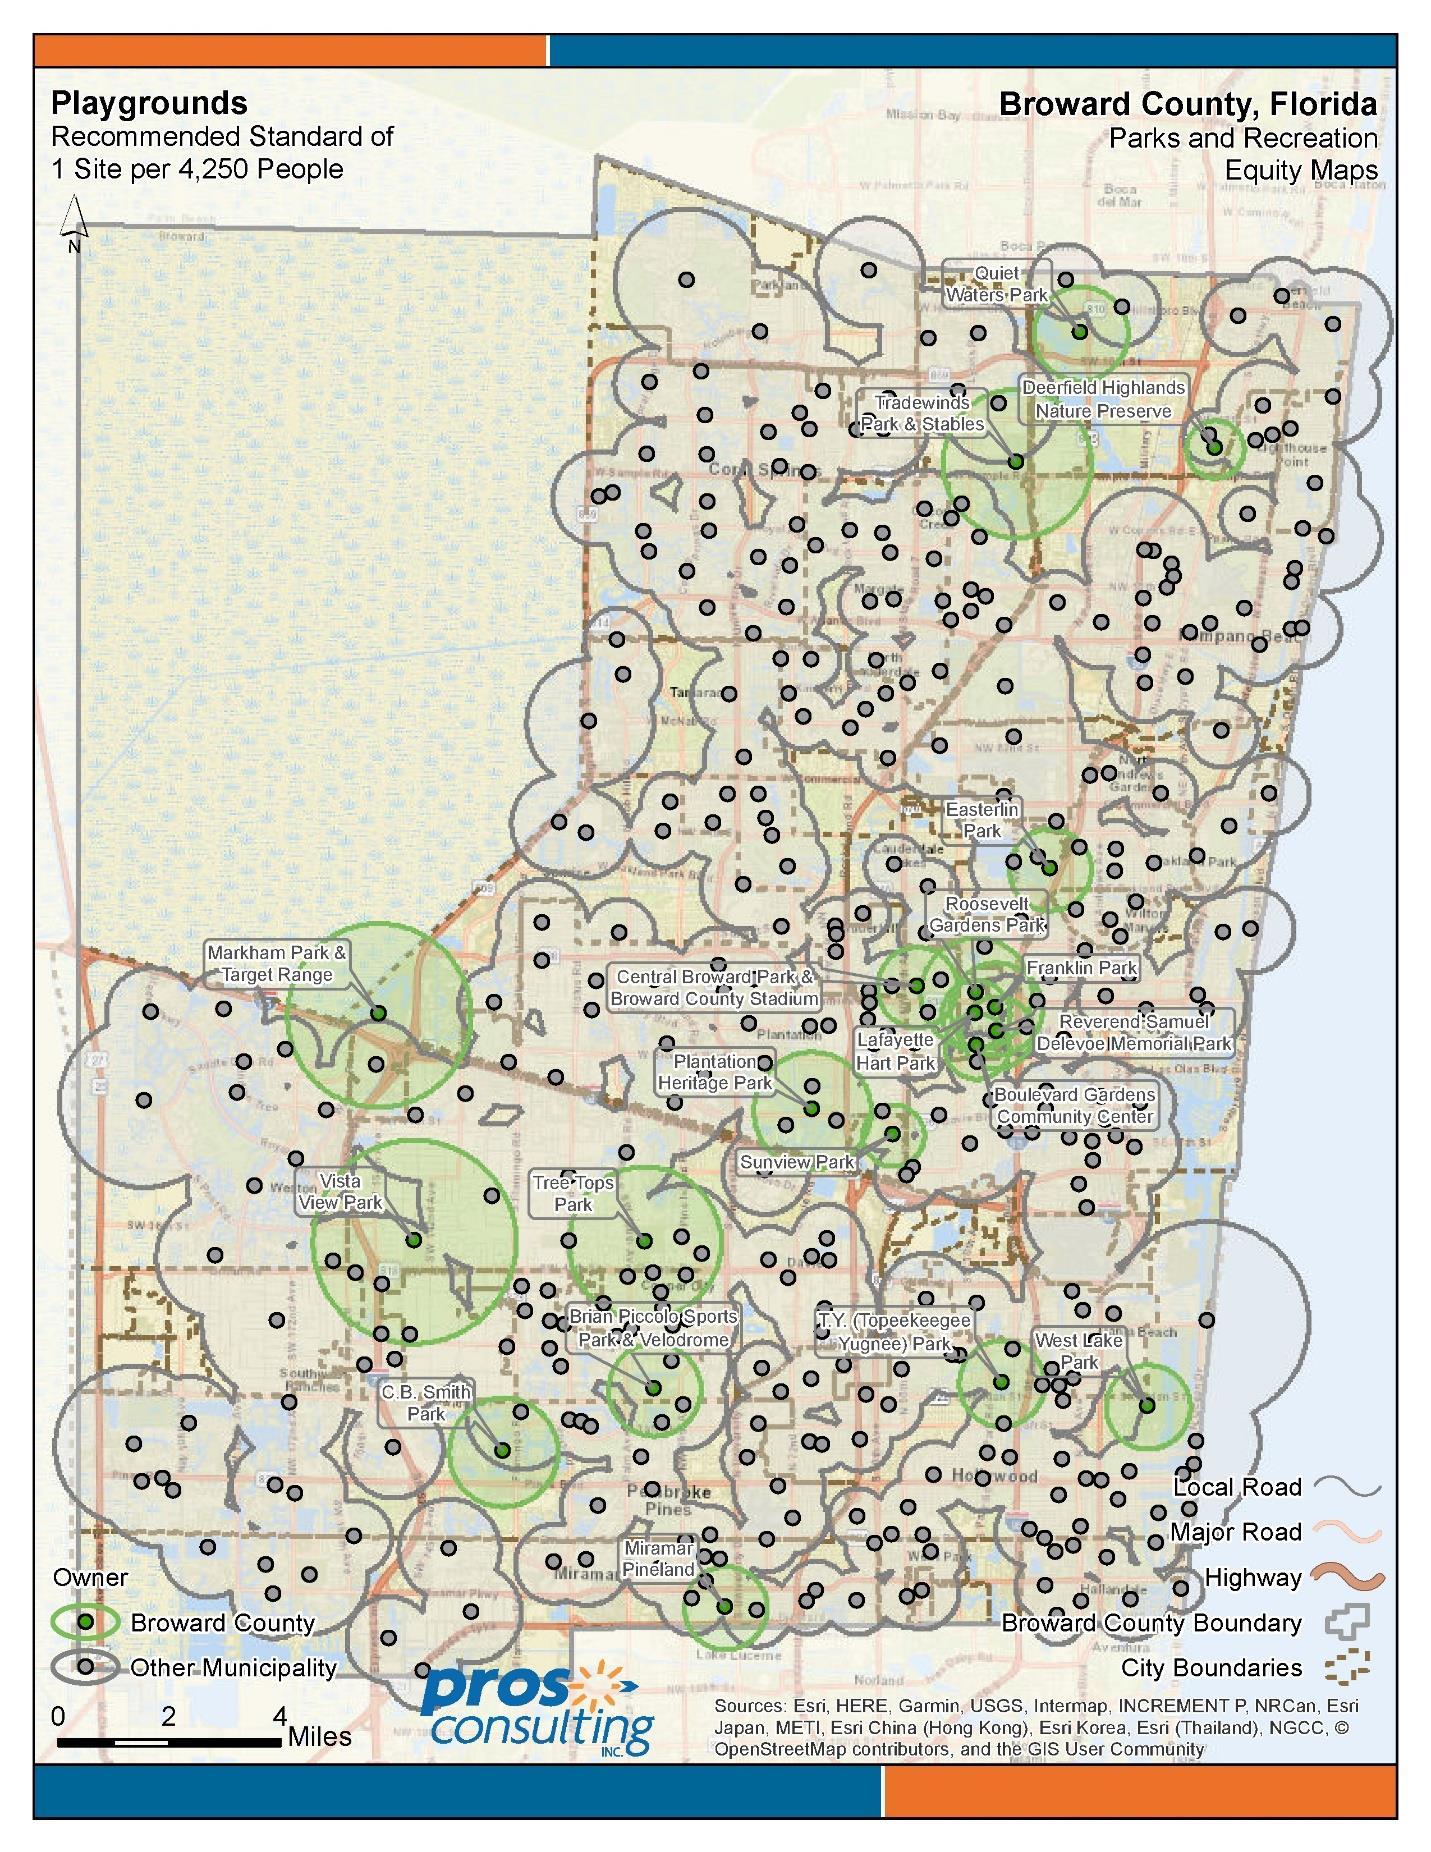
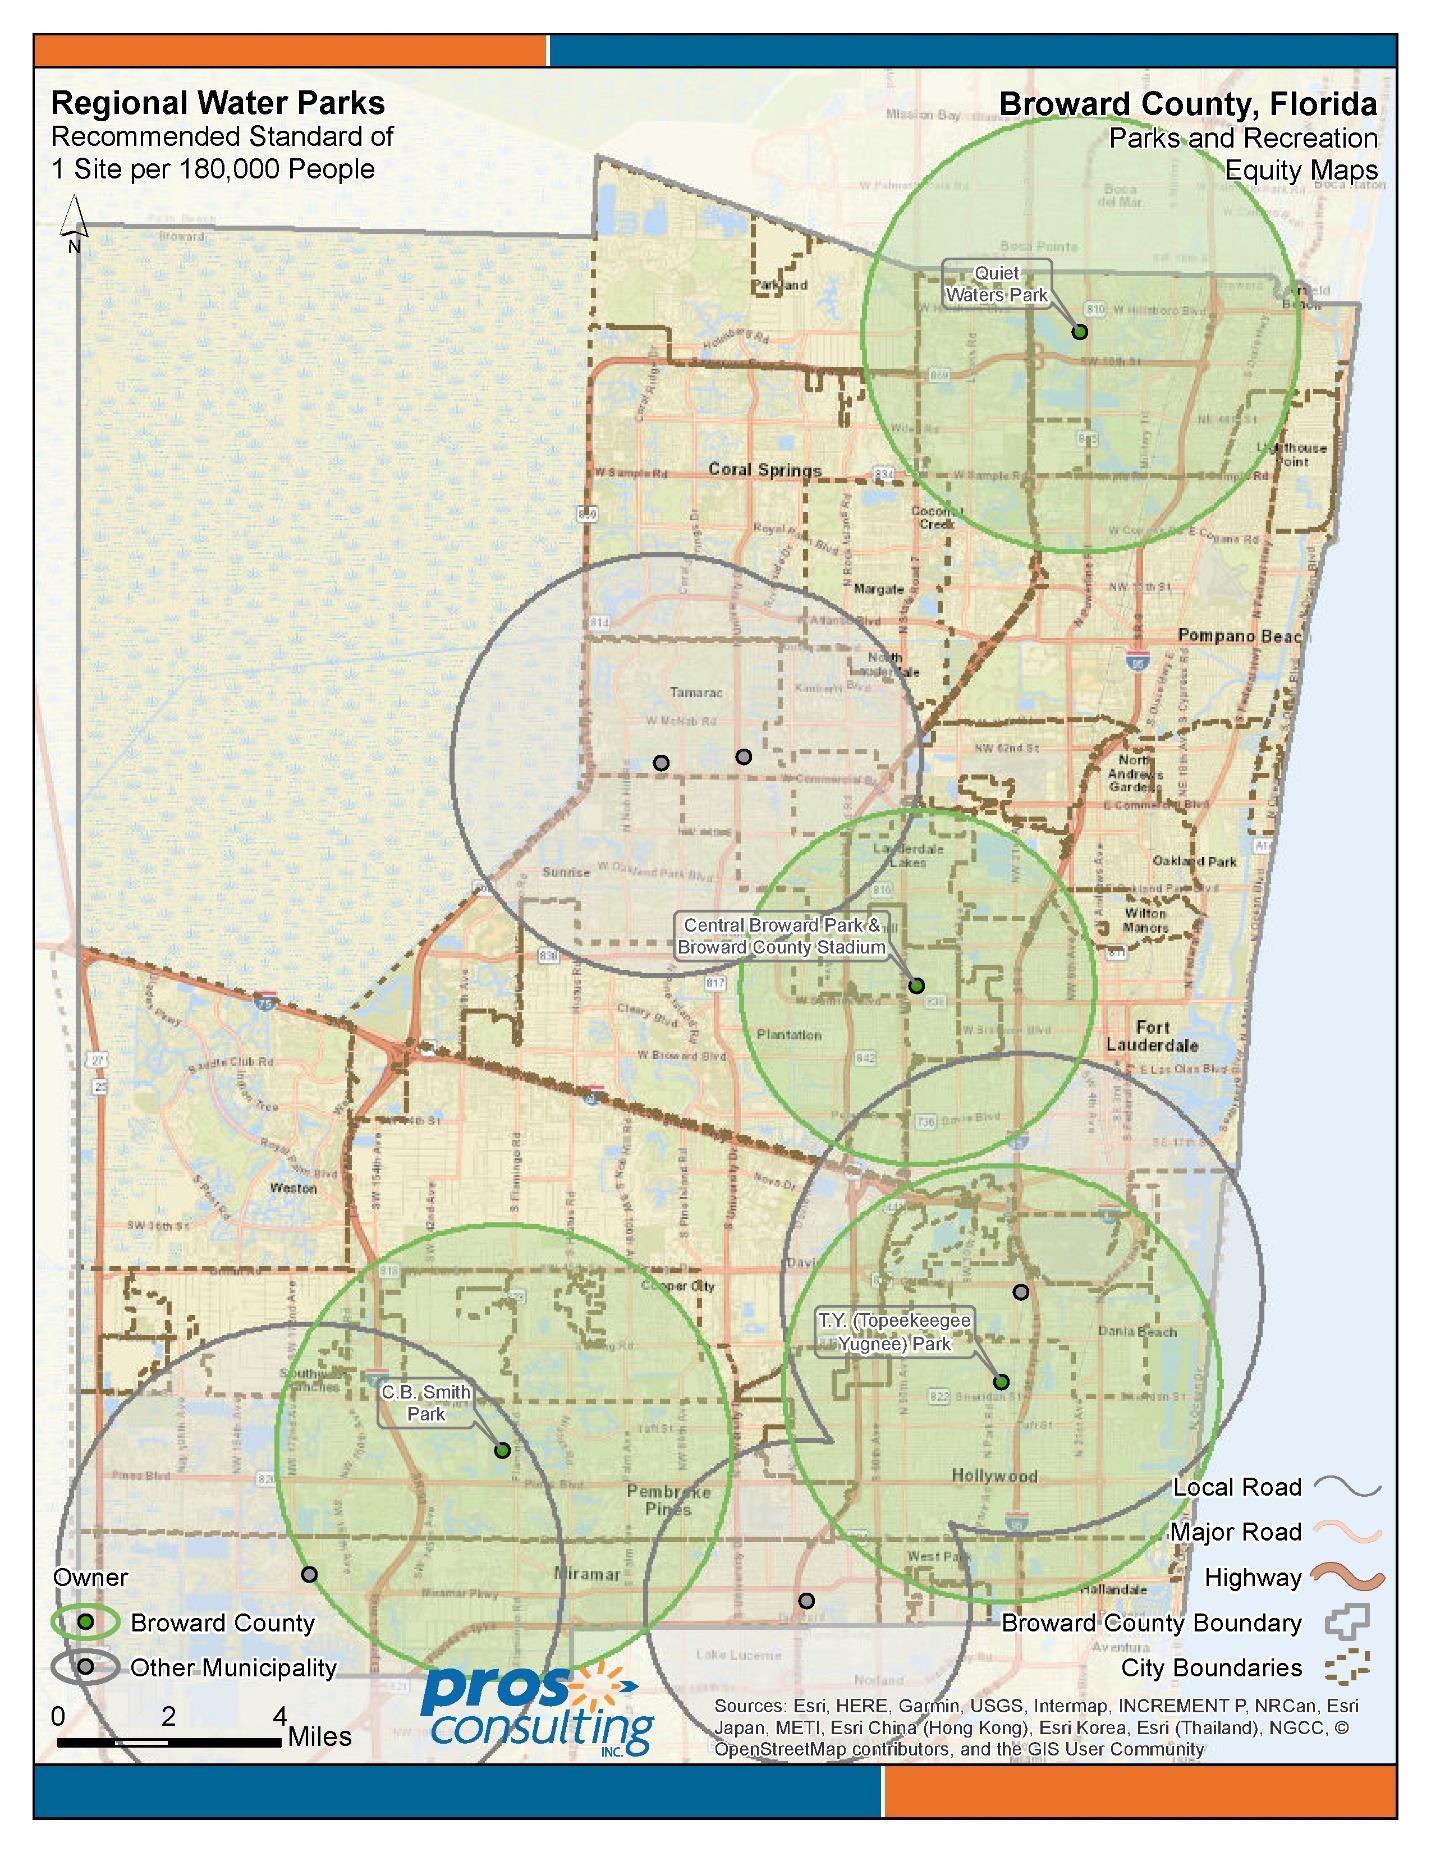
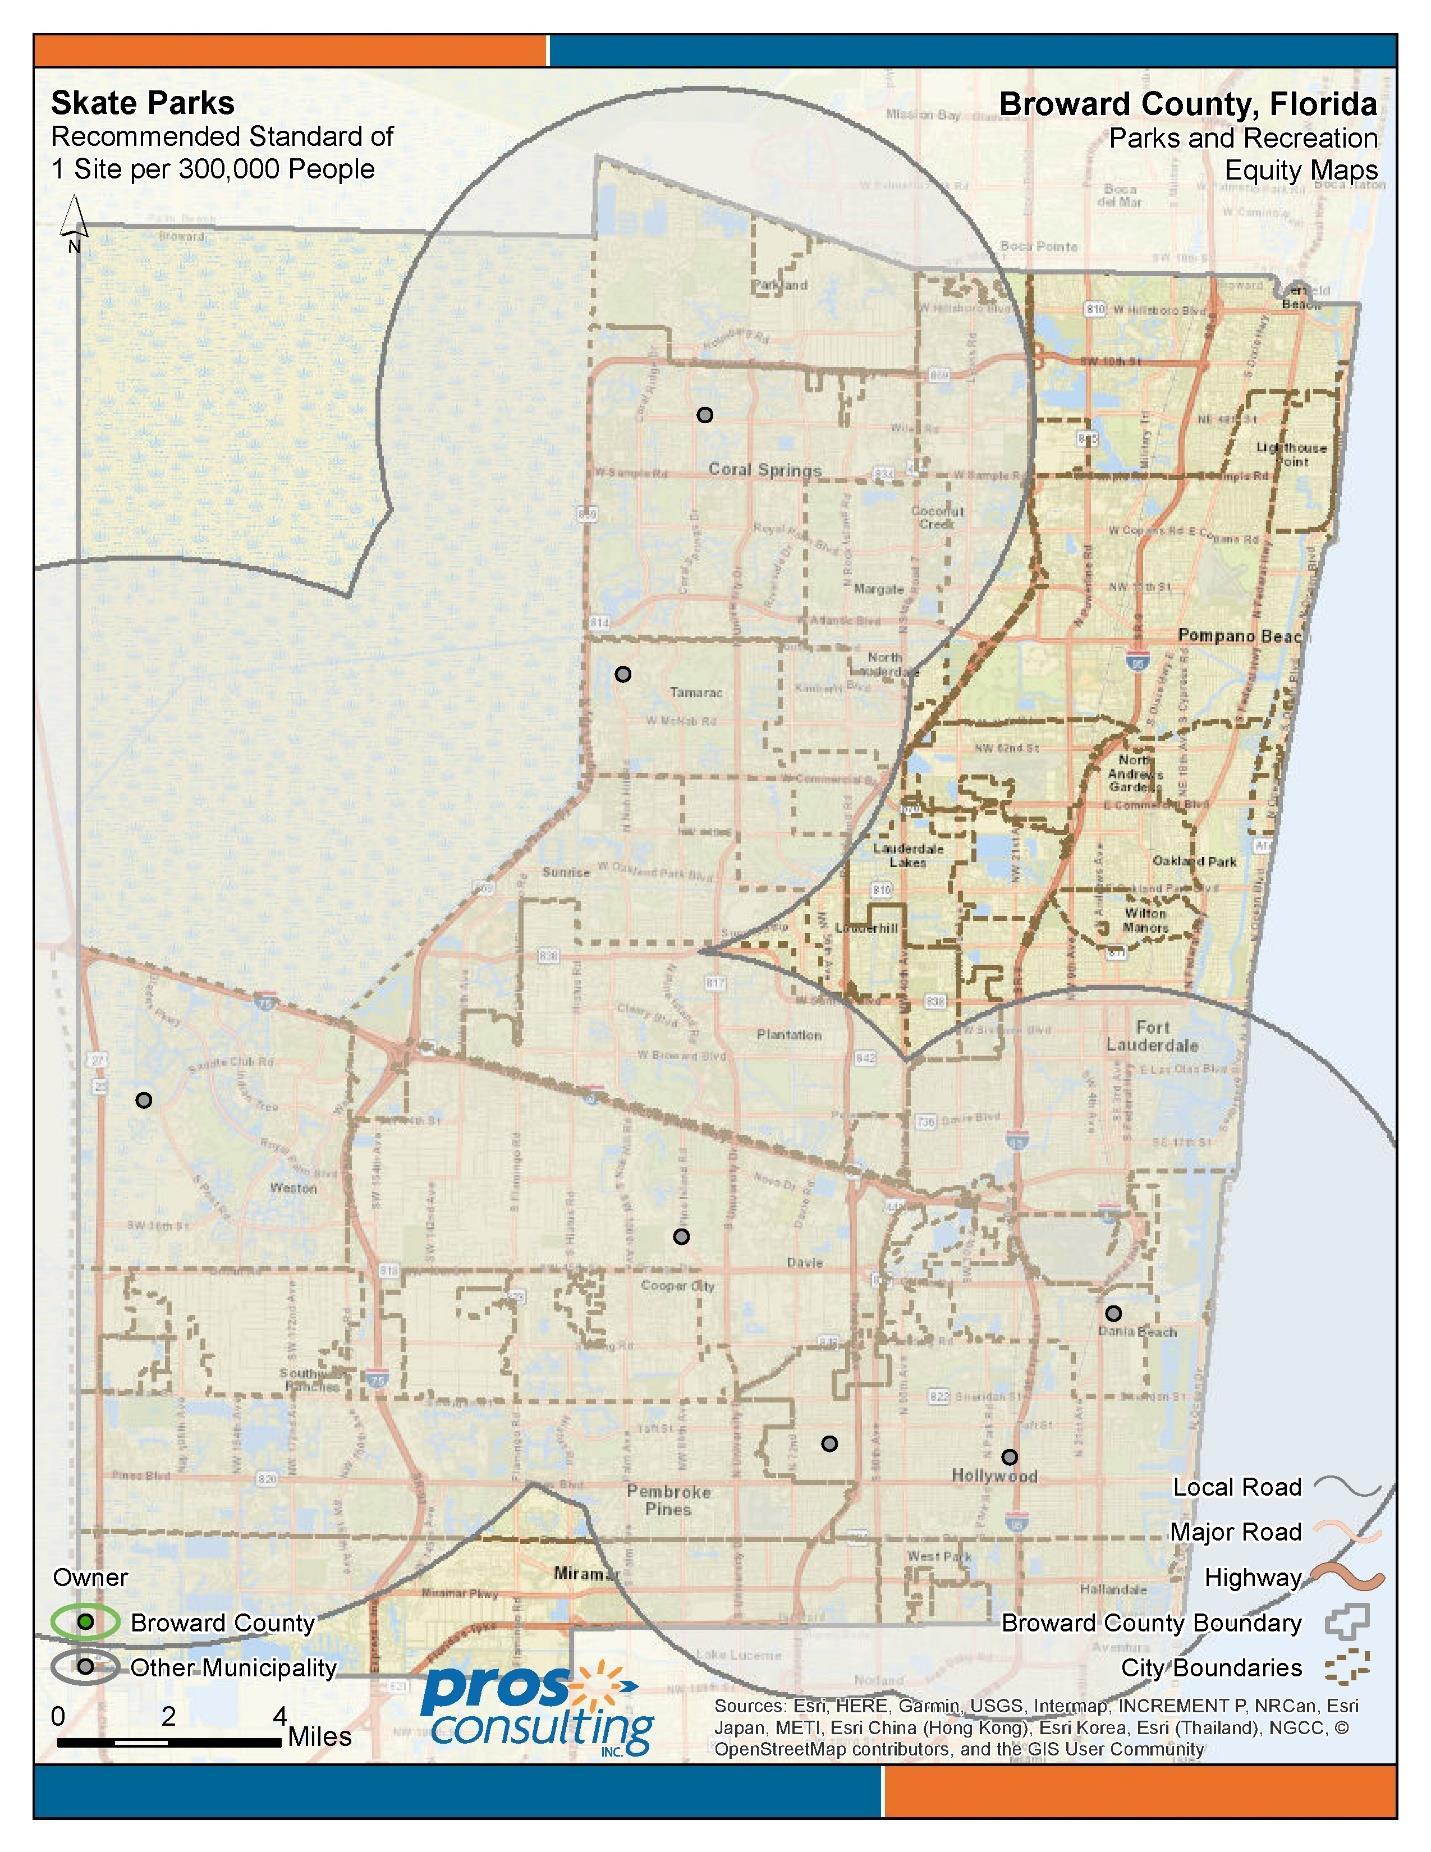
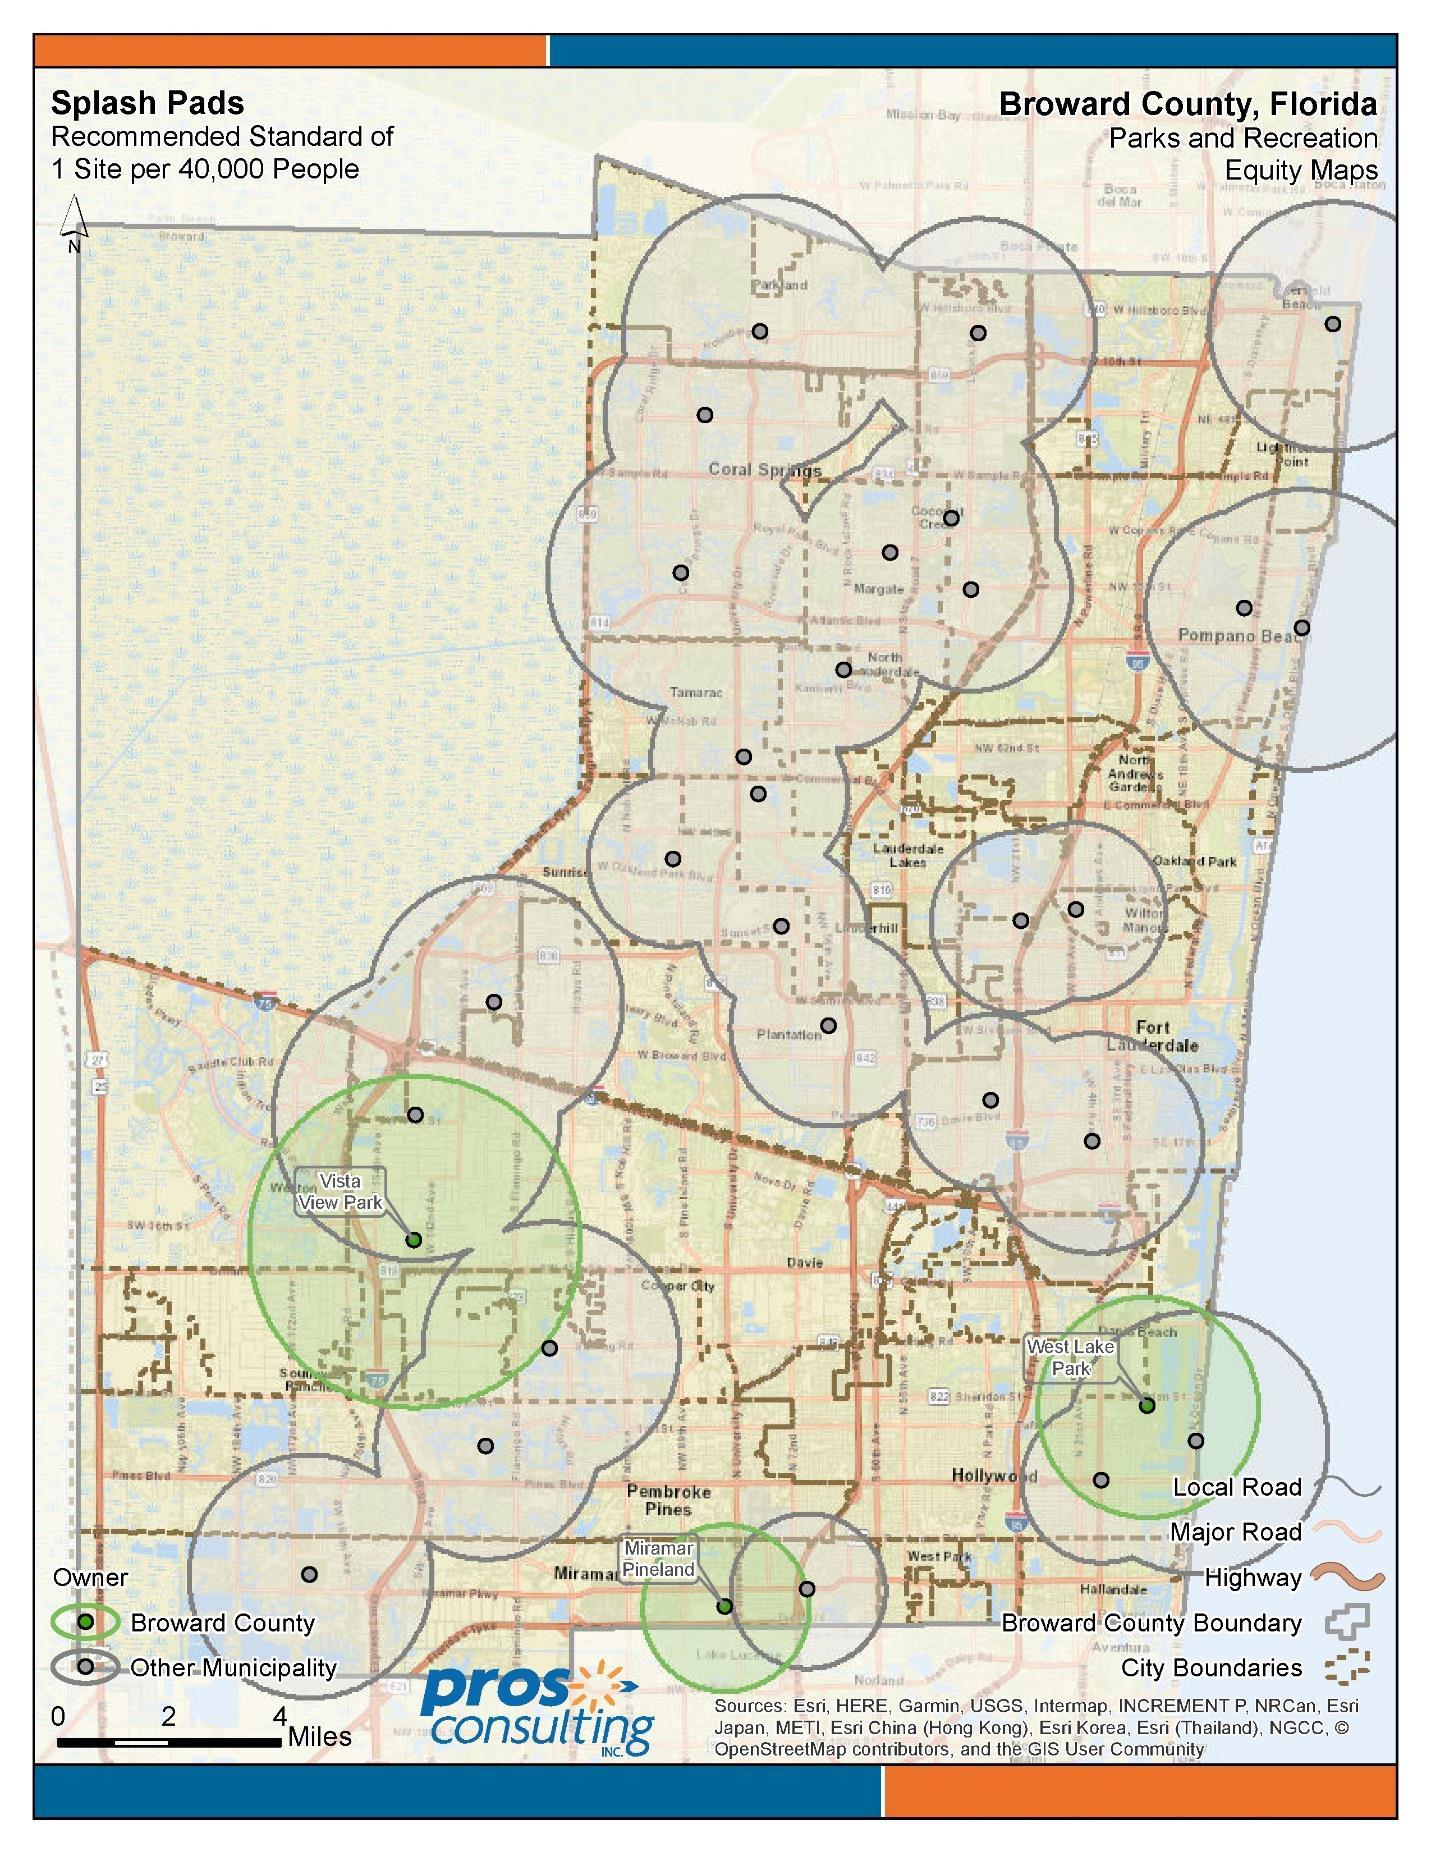
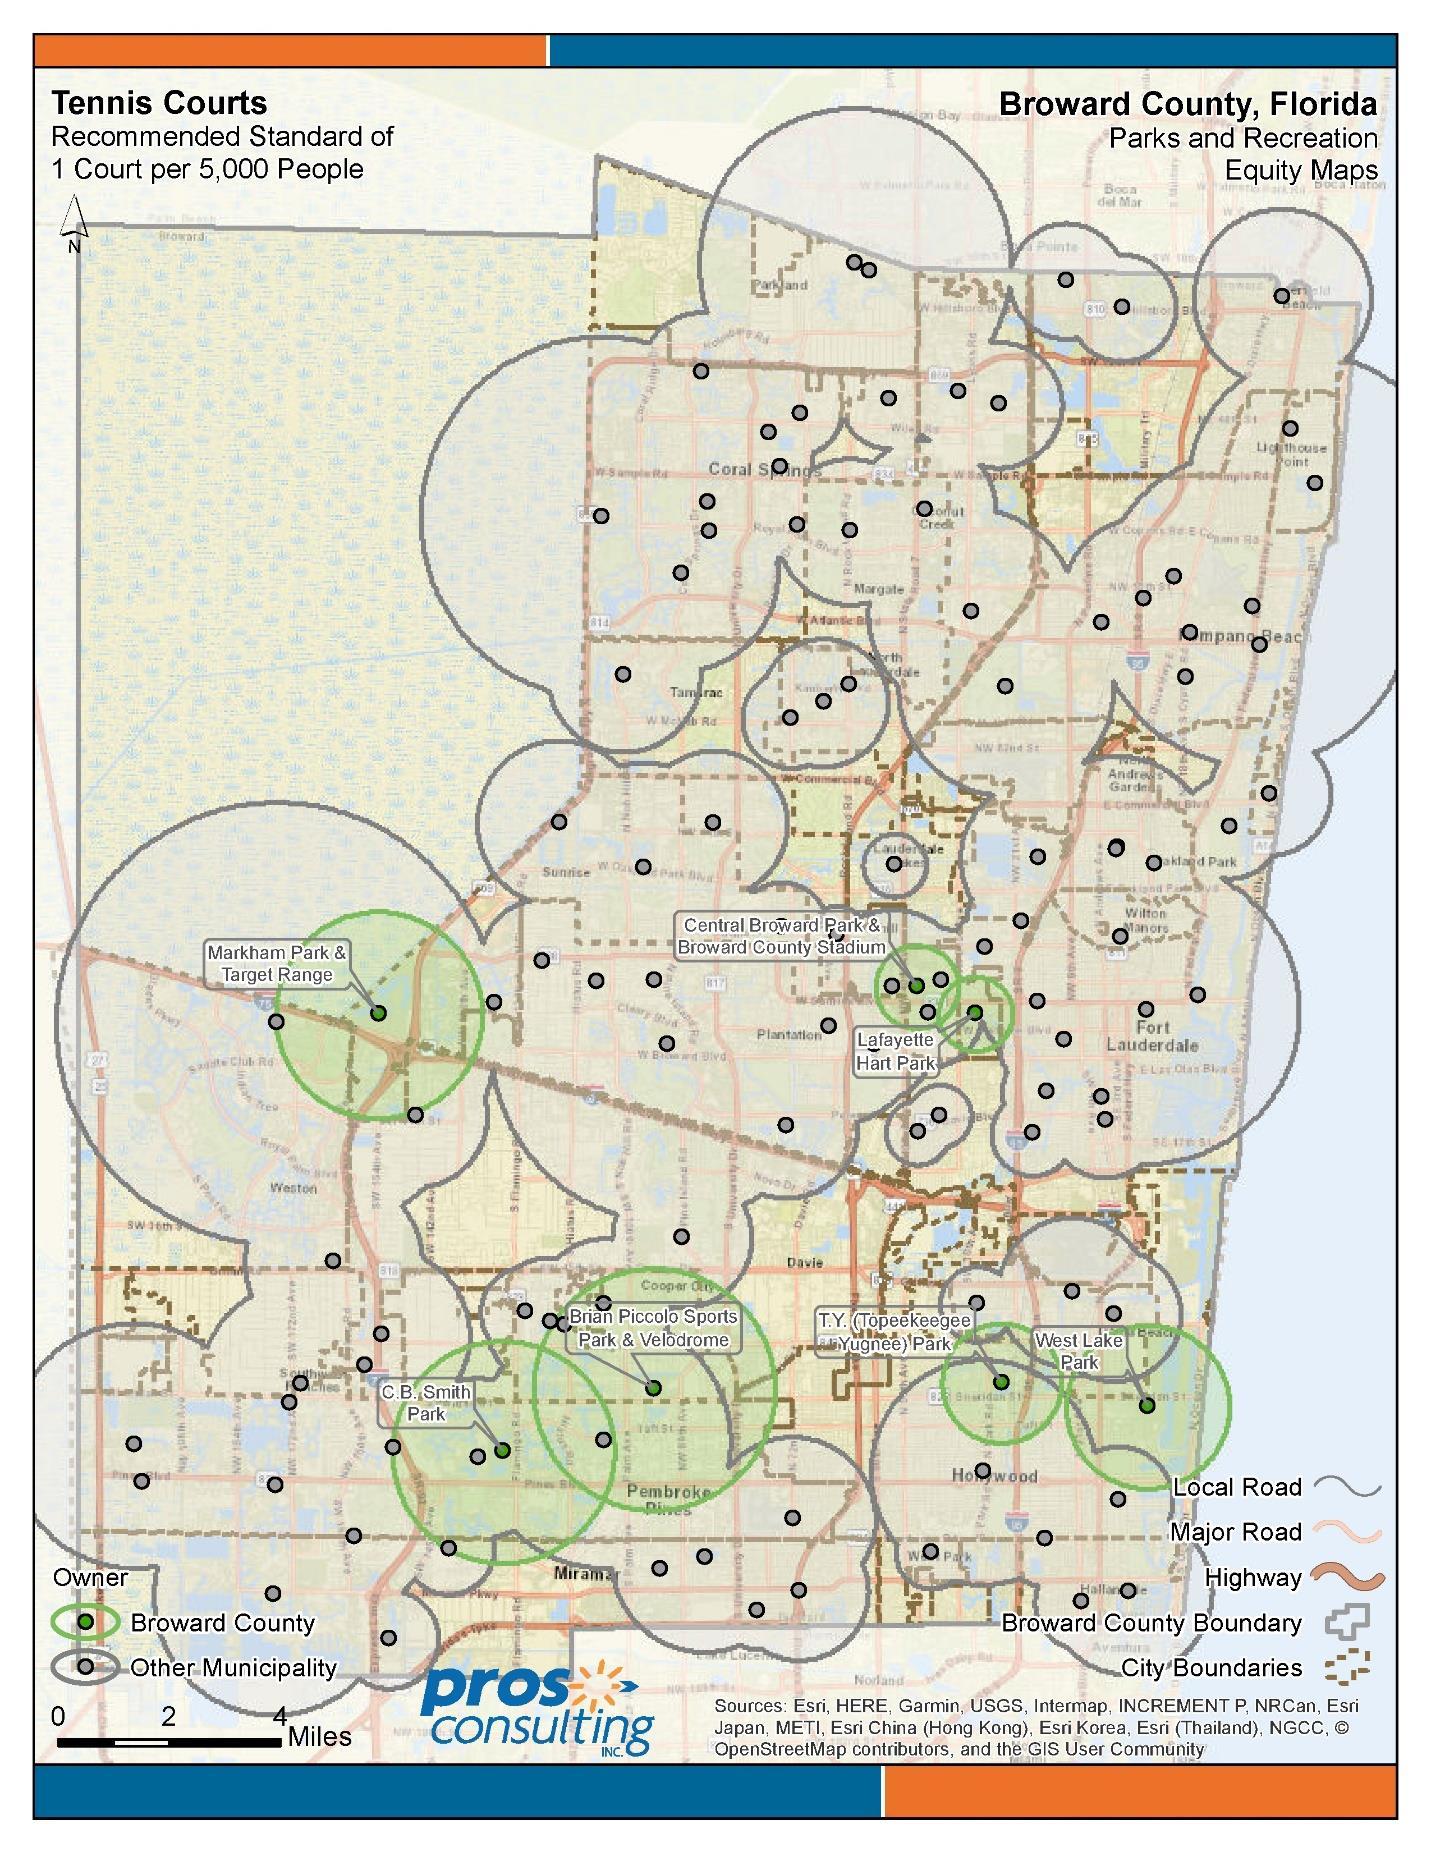
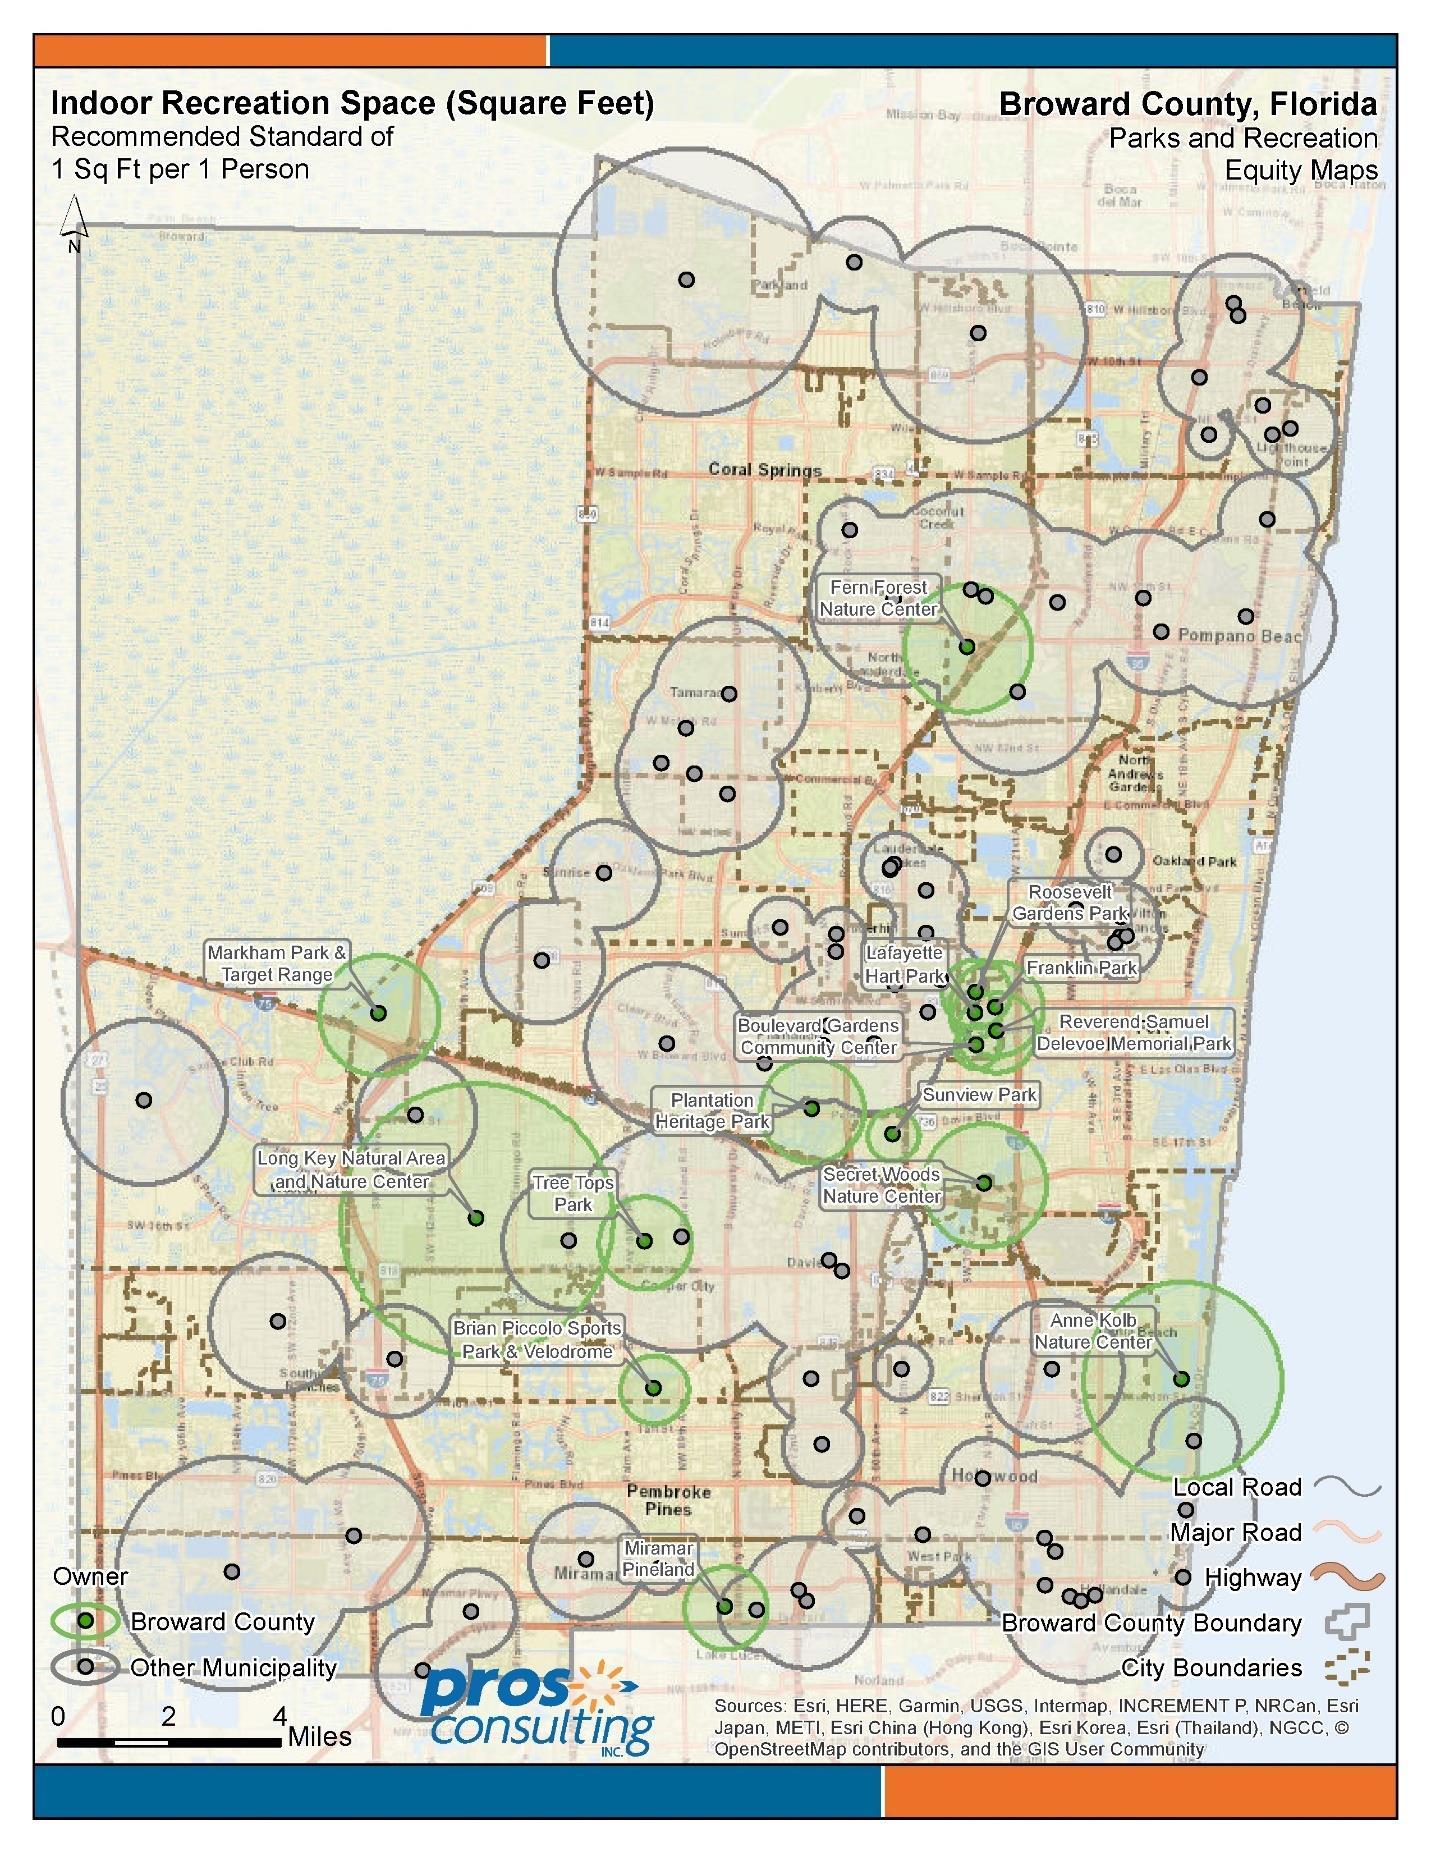
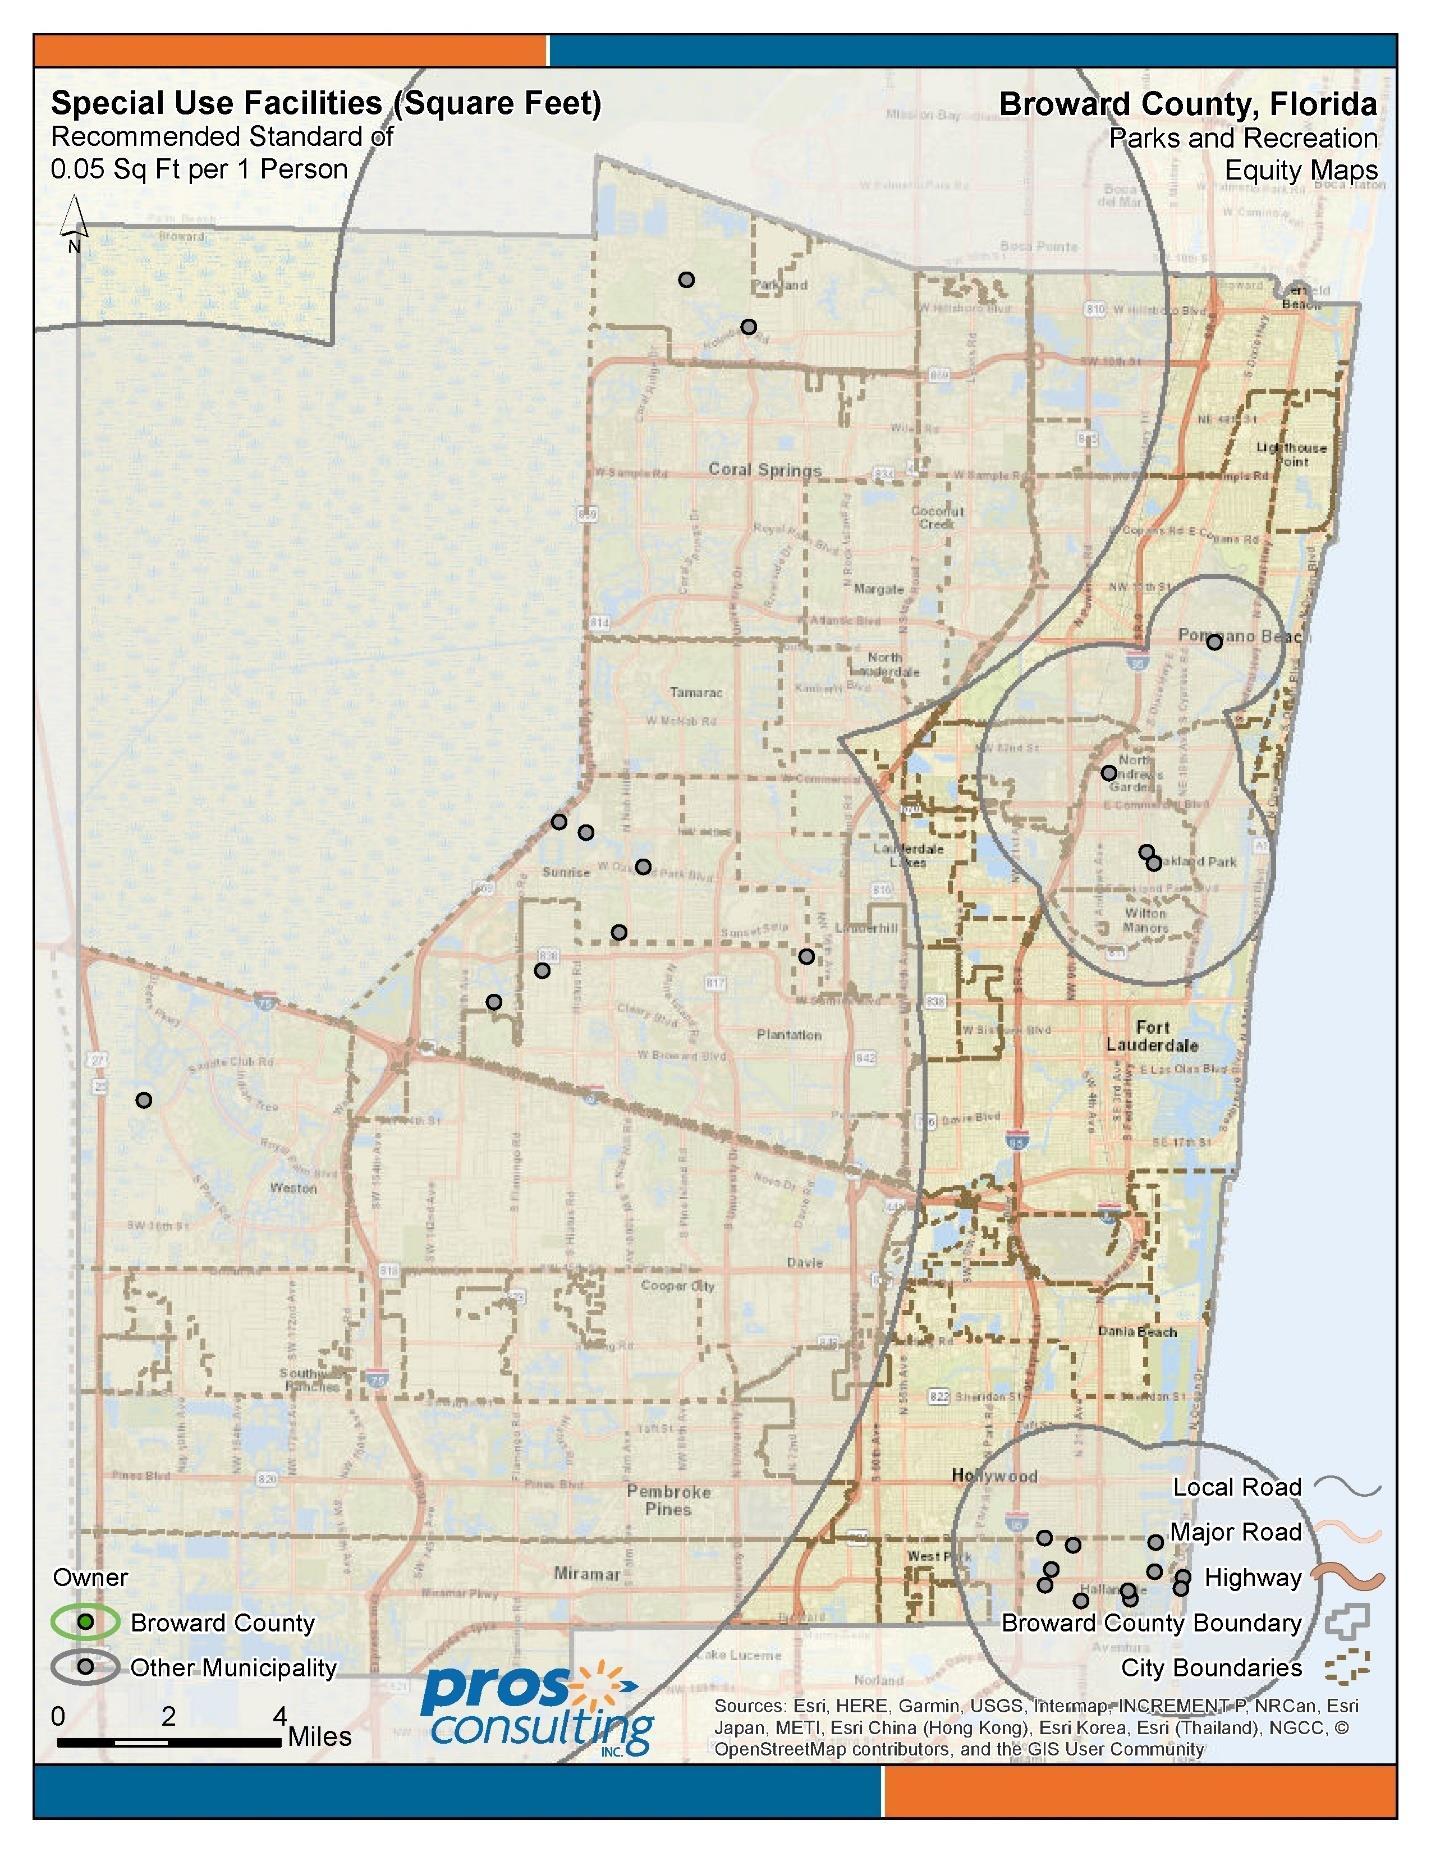
1.5.5. Equity Mapping
Level of Service Inventories assist staff and leadership to assess where services are offered, how equitable the service distribution and delivery is countywide, and identify gaps in service provided by the County and its municipalities. These maps allow the Division to assess where amenities/facilities are needed, or where an area is oversaturated. Based on this information, leadership can make appropriate capital improvement decisions and identify partnership opportunities with cities within the County to address these needs.
The source for the population is from the demographic data provided by Environmental Systems Research Institute Inc. (ESRI). The shaded areas in the Equity Maps indicate the service level (i.e., the population being served by that park type/amenity). The size of the circles varies by the quantity of a given amenity (or acre type) located at one site and the surrounding population density. Additionally, circles may be shaded differently to represent the “owner” of that particular amenity or park type. The areas of overlapping circles represent adequate service, or duplicated service, and the areas with no shading represents the areas not served by a given amenity or park type.
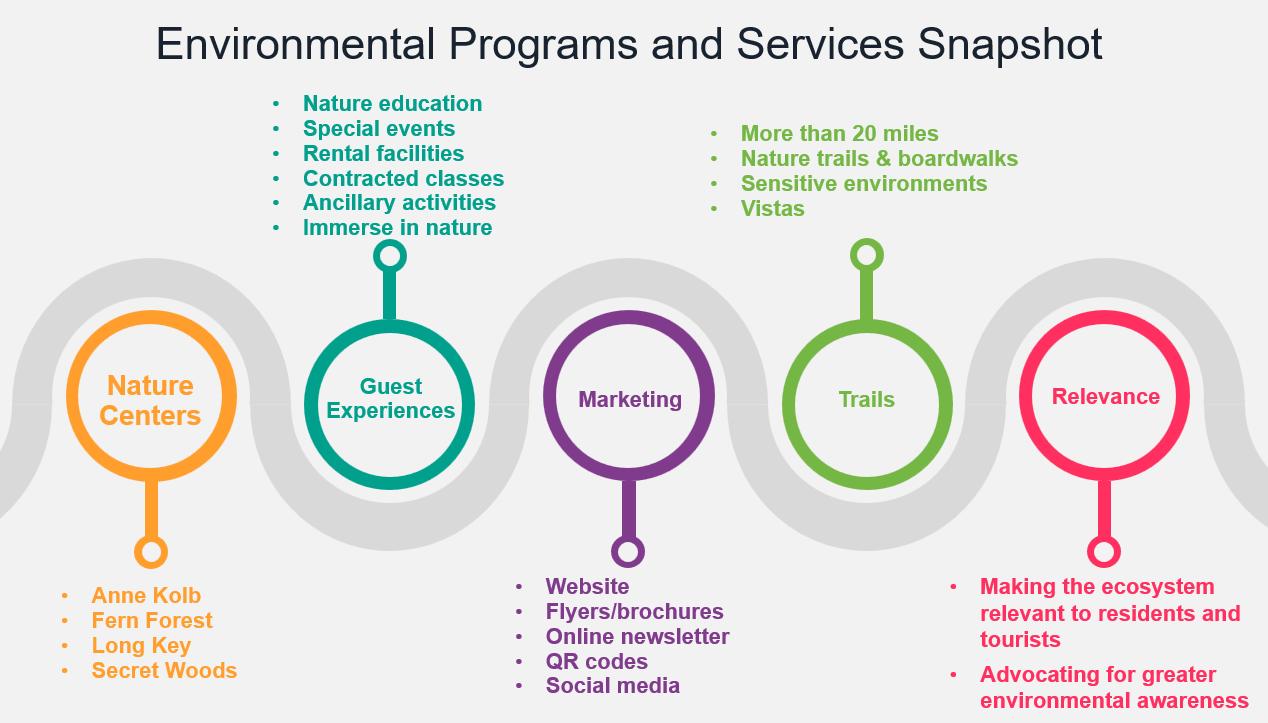
1.5.6. Environmental Programs & Service Assessment
The County has wisely seized the opportunity to not only educate residents, but to educate visitors through its hospitality. “SUNsational” service is the County’s commitment to create value for all customers. This is at the core of all services and more so, the ancillary services provided at each of the County’s nature centers.
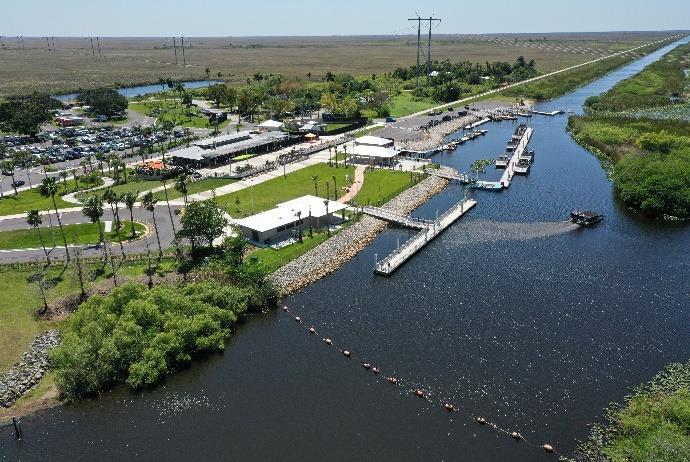
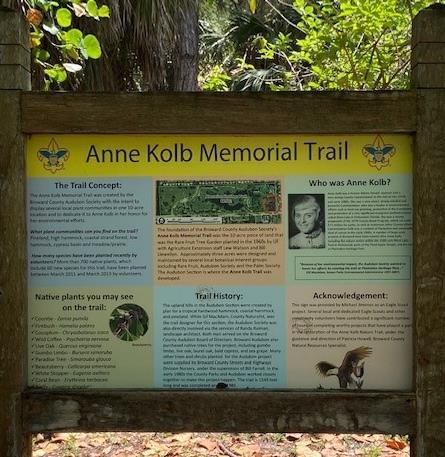
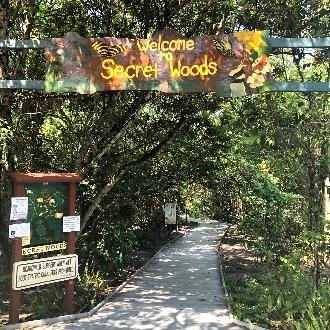
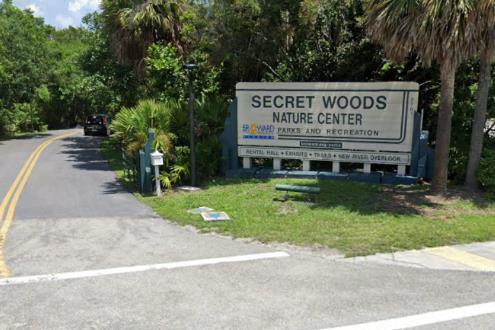
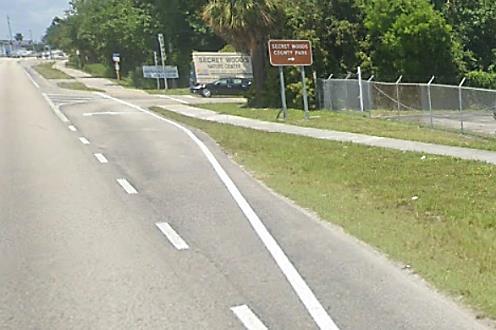
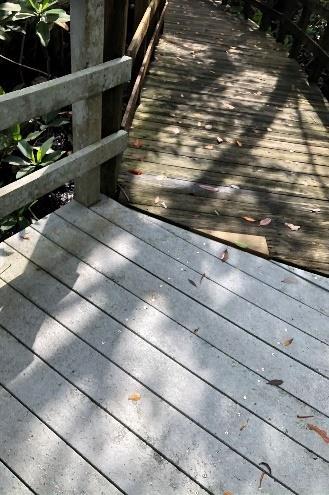
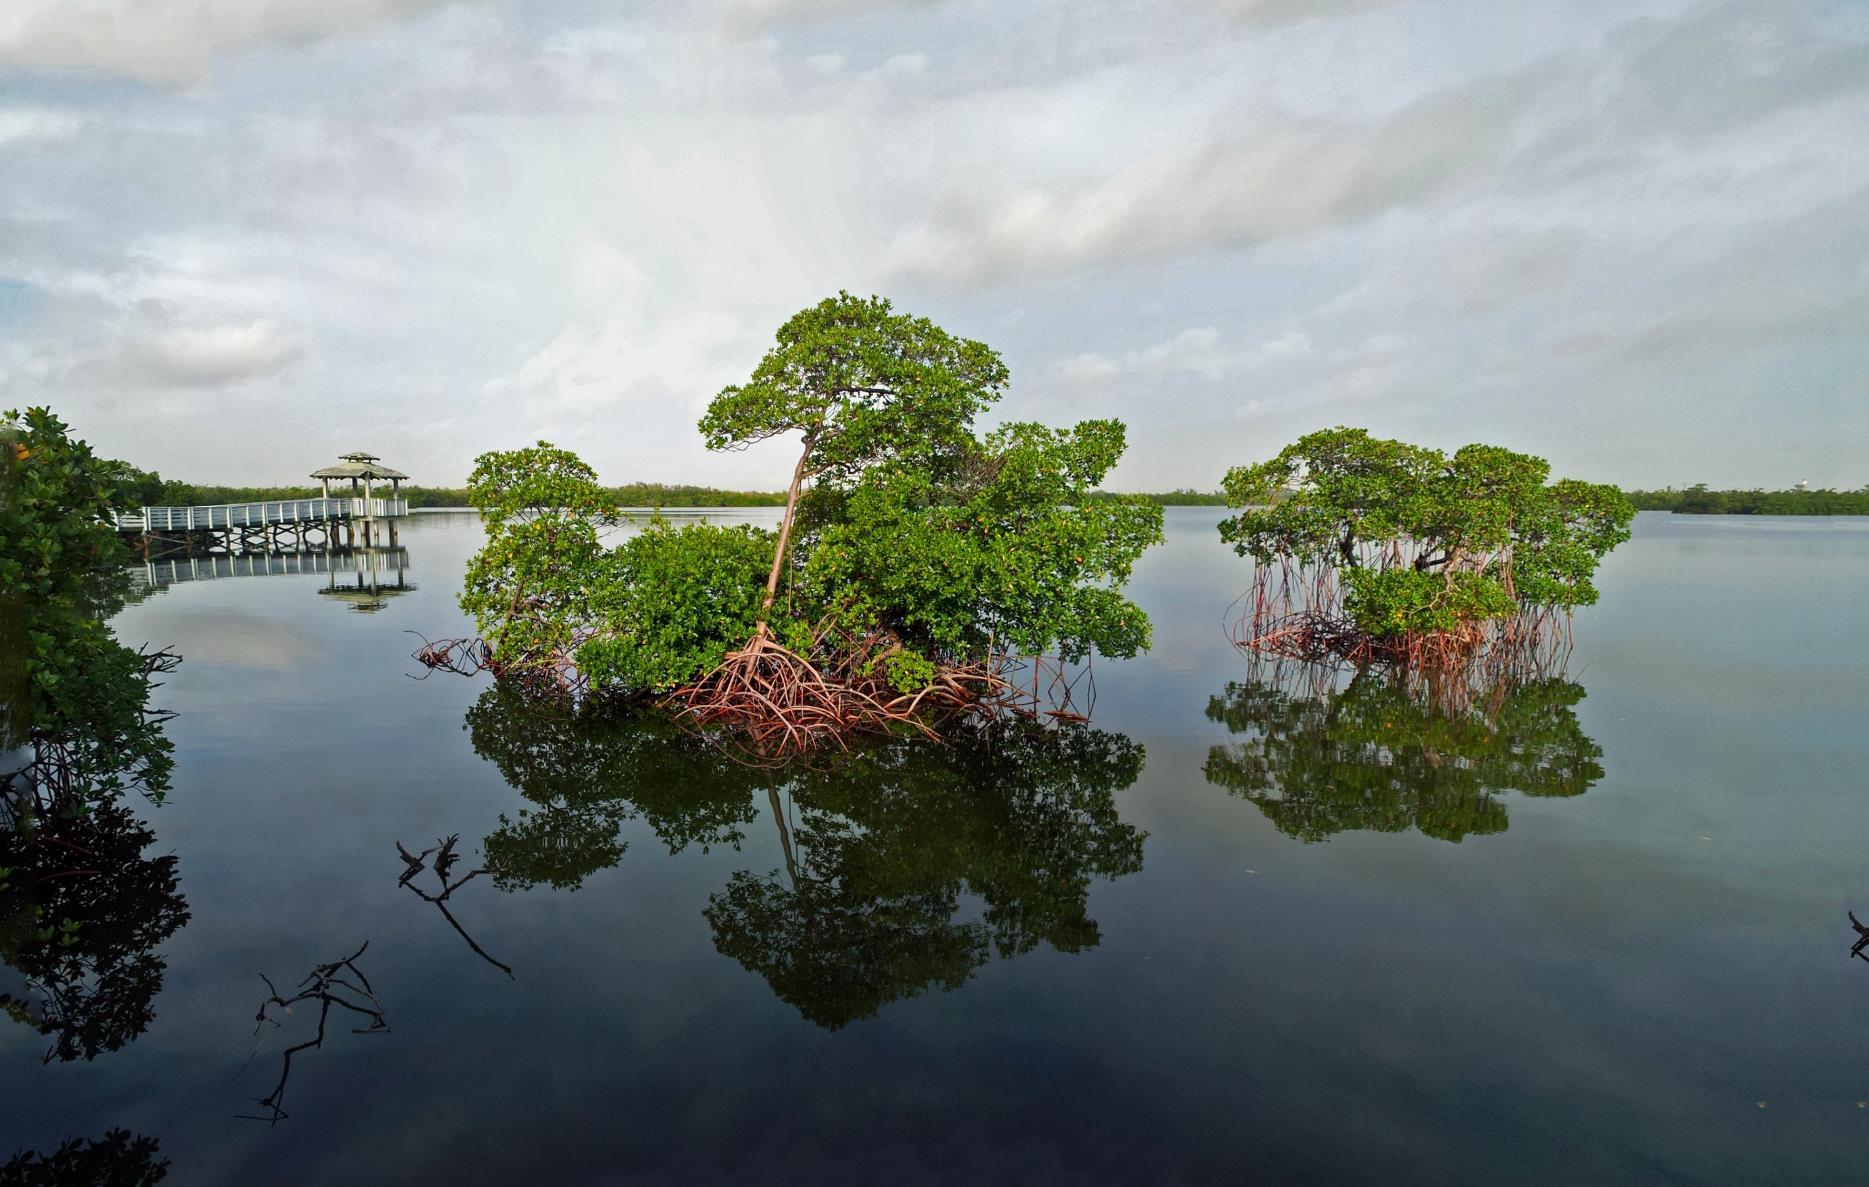
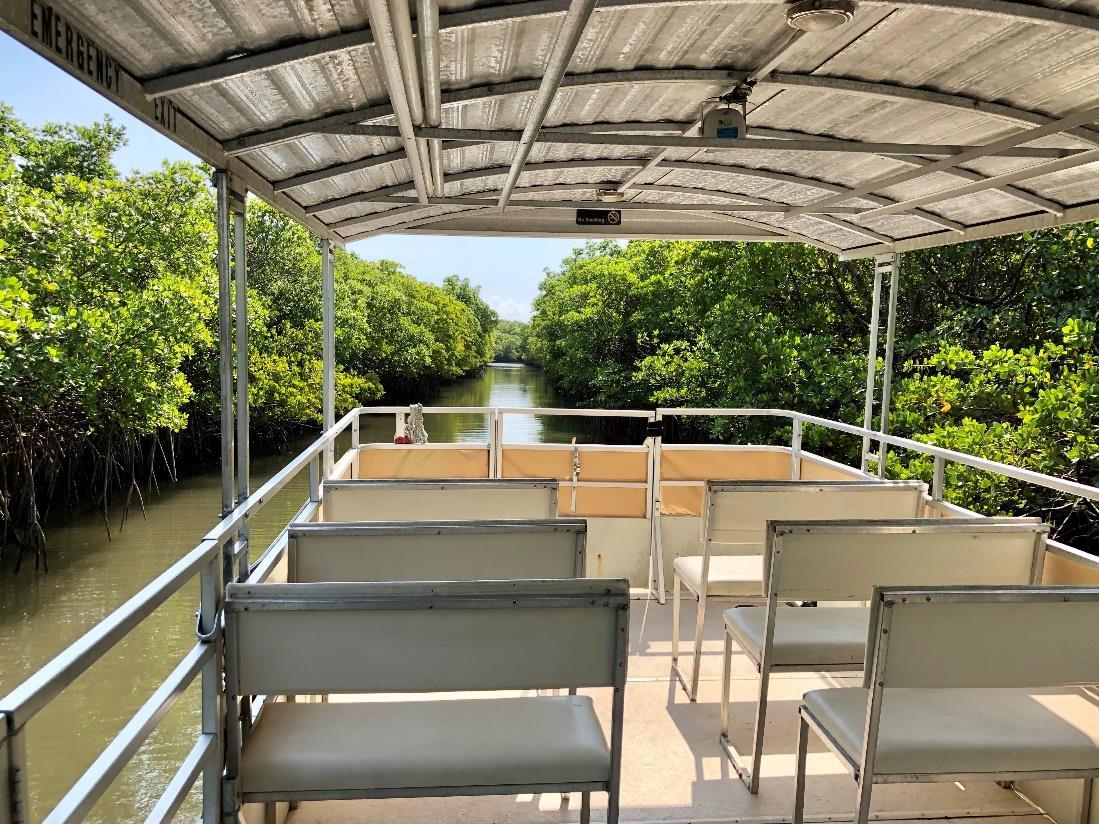
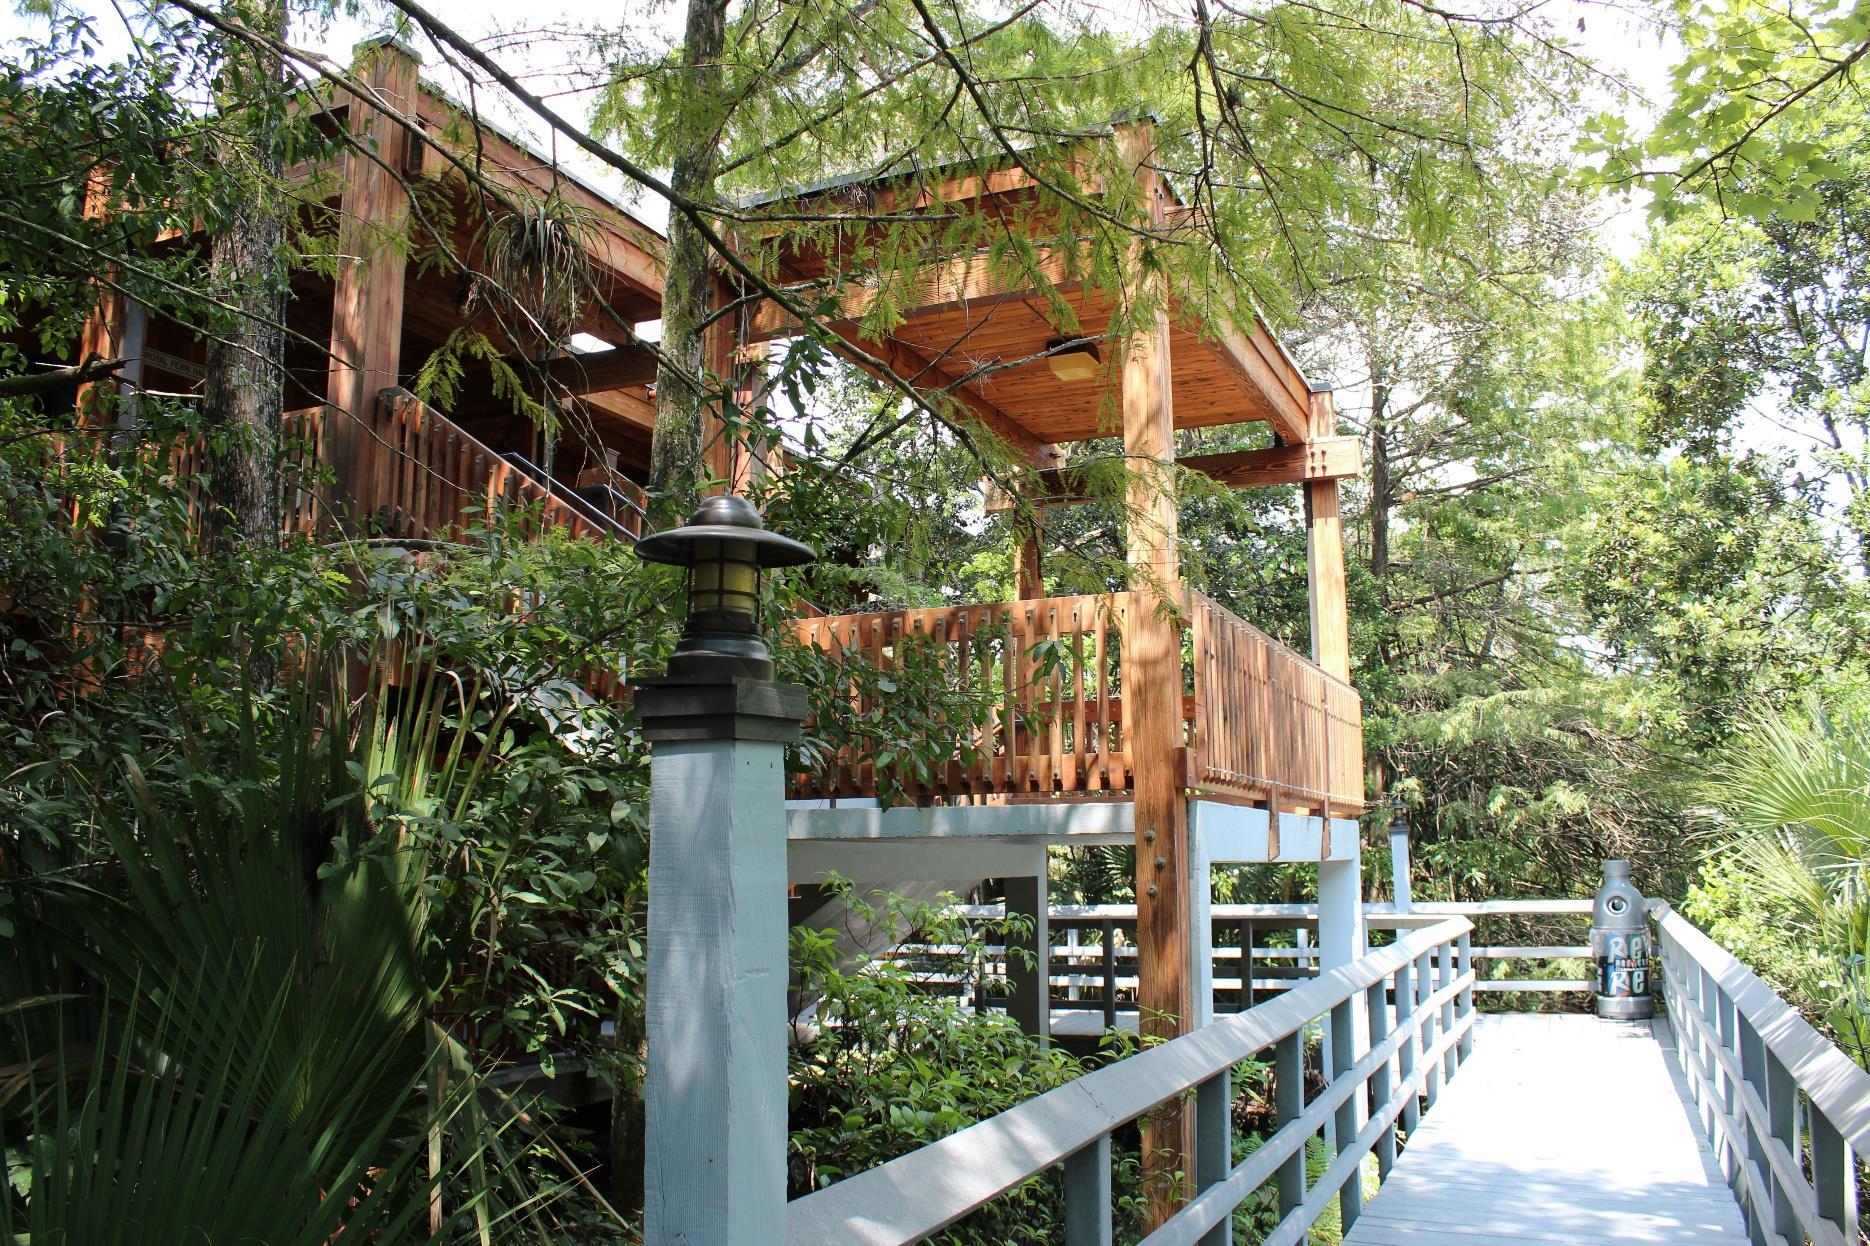
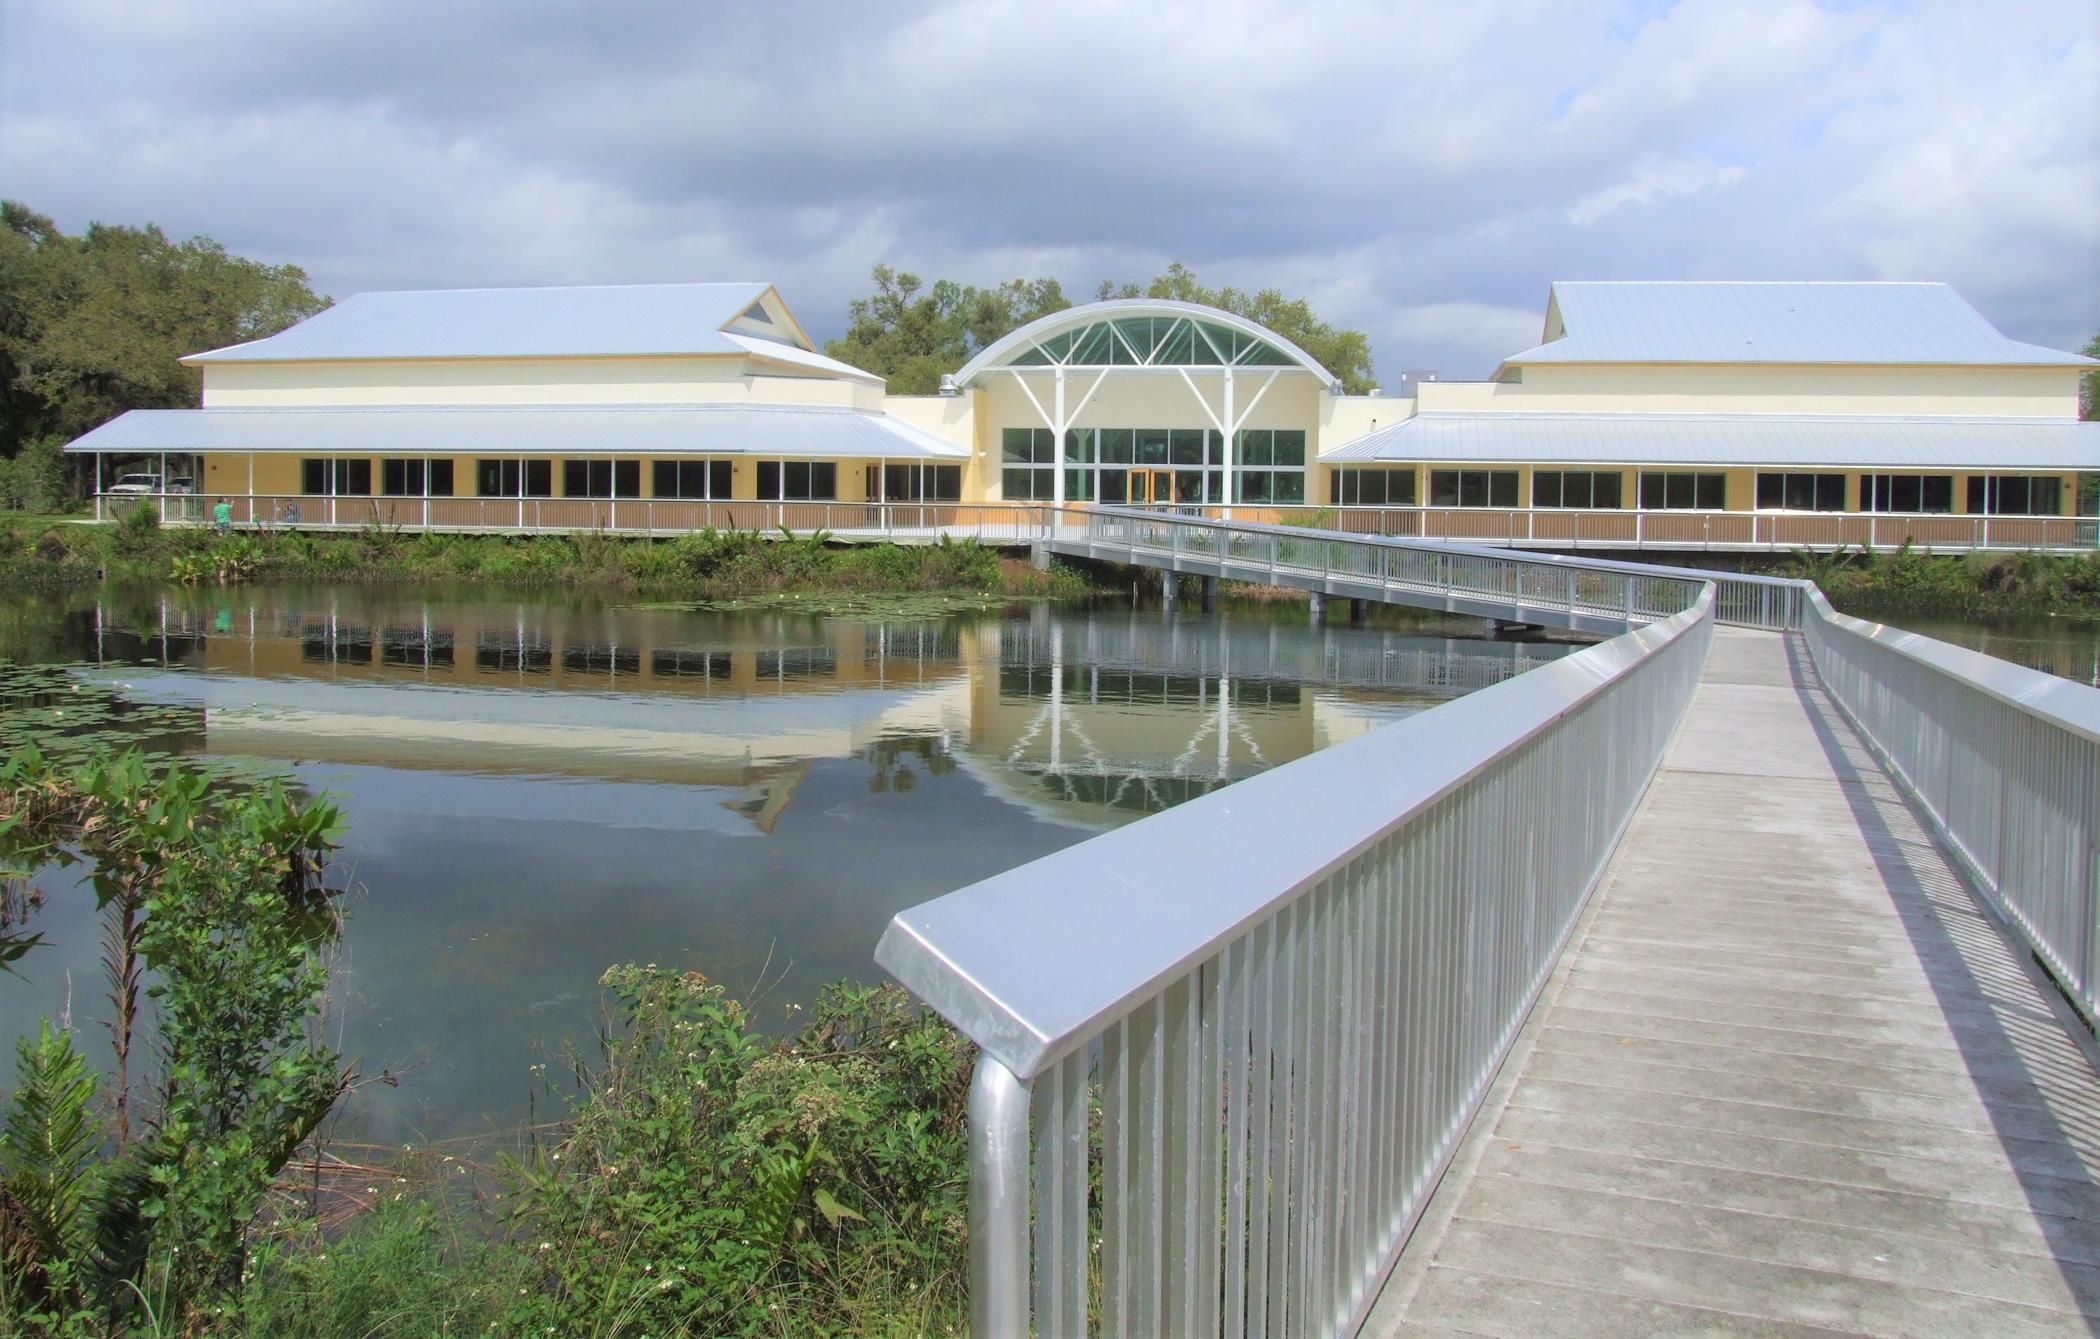
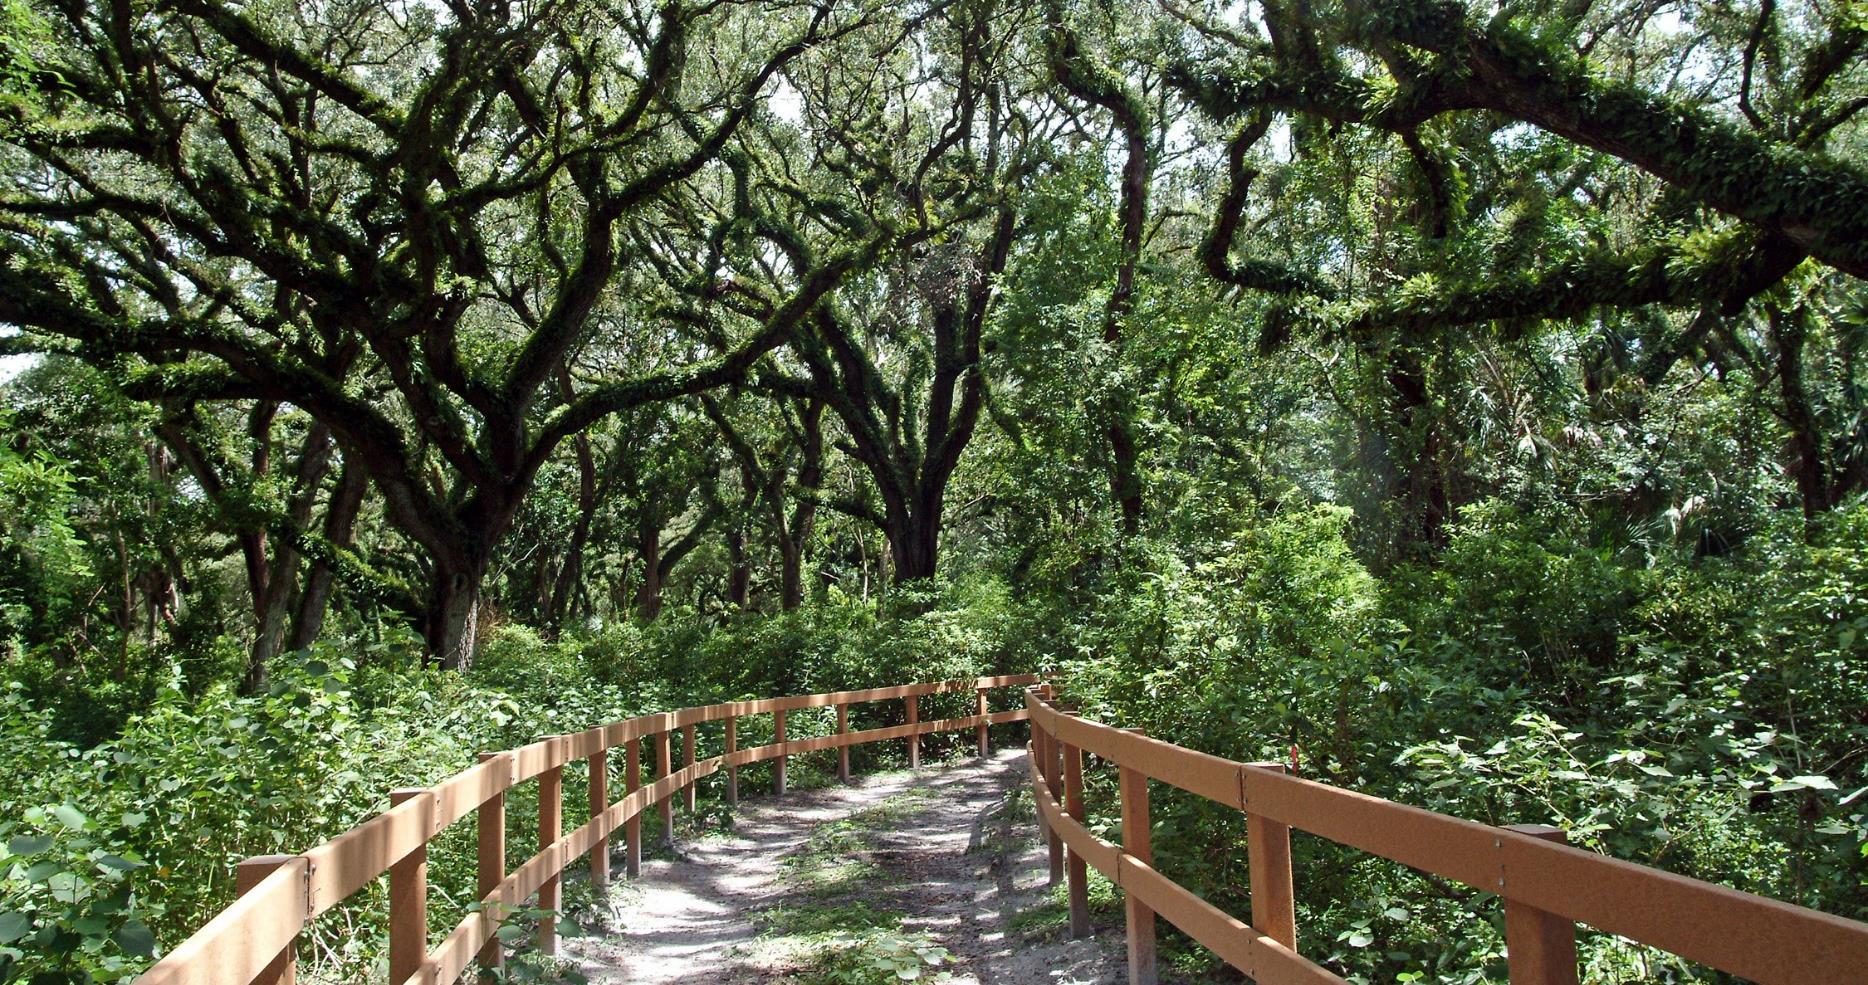
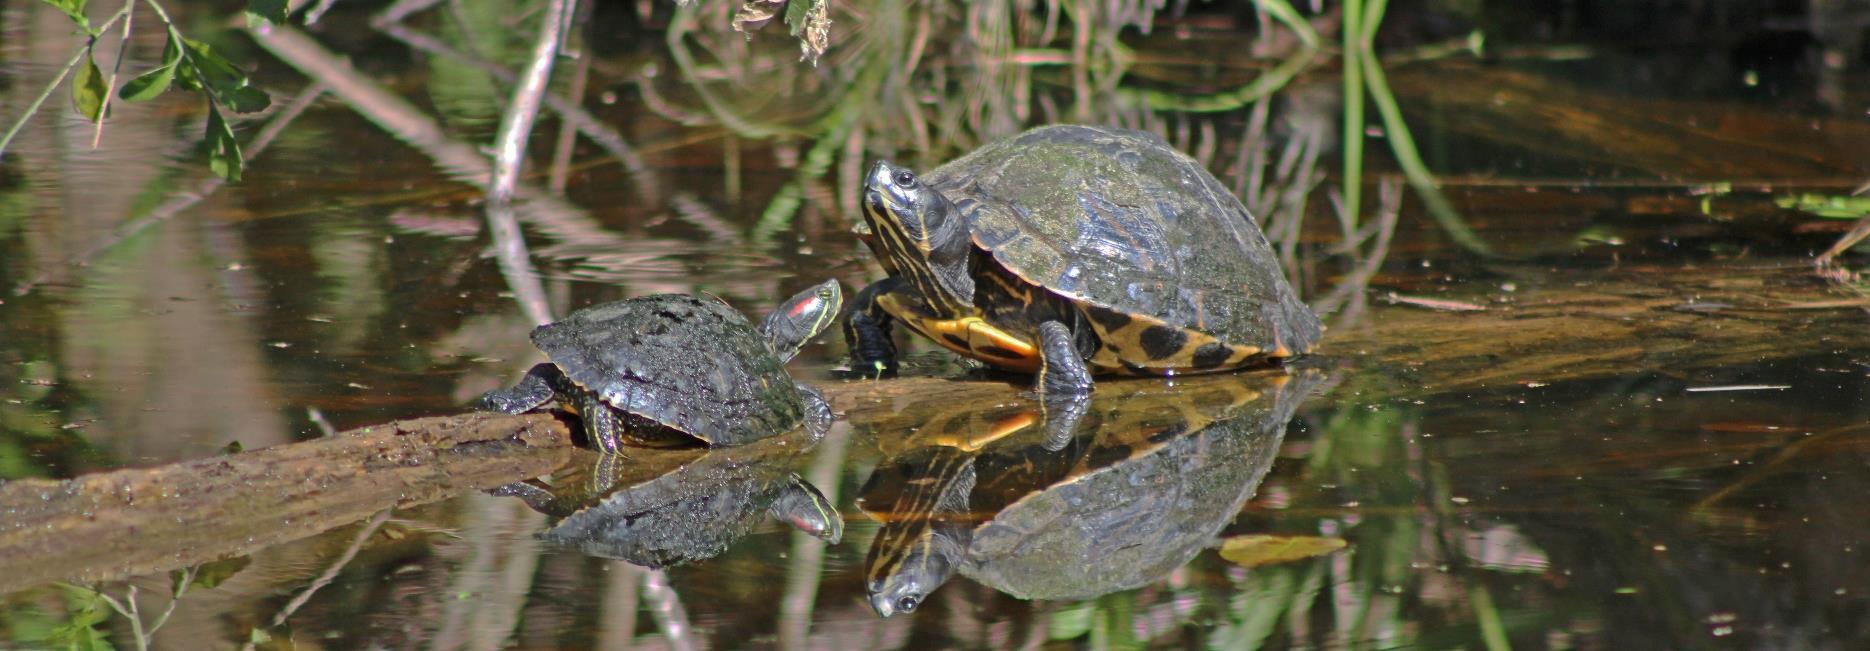
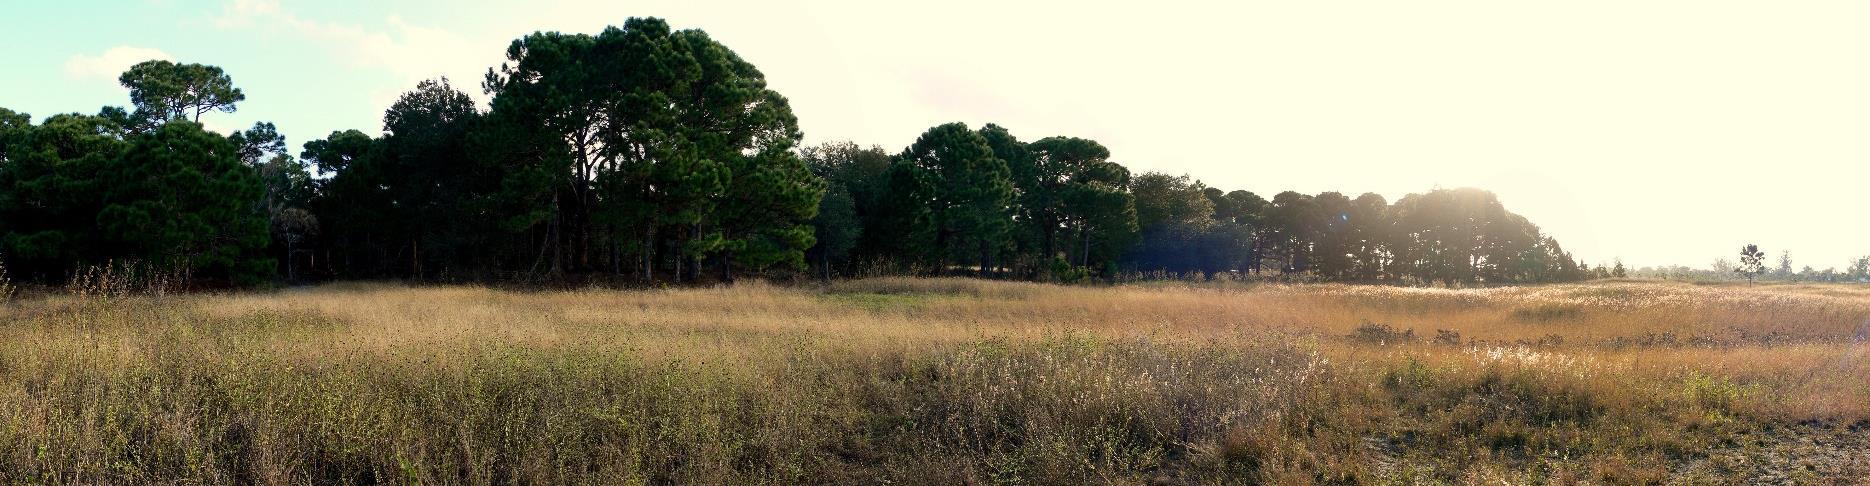
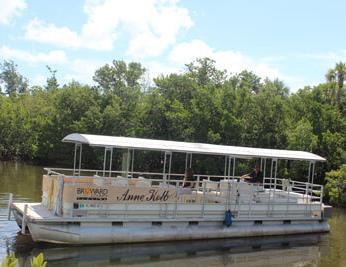
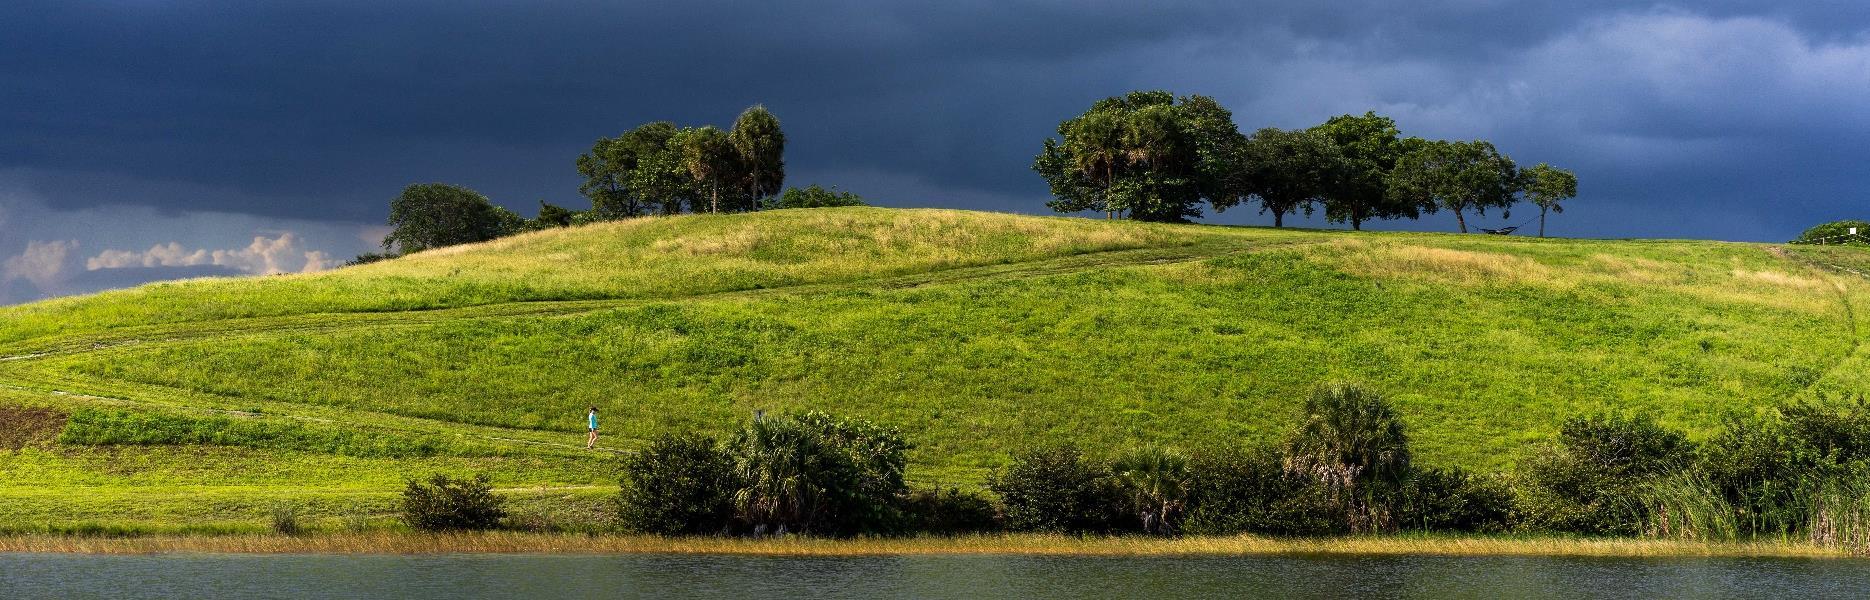
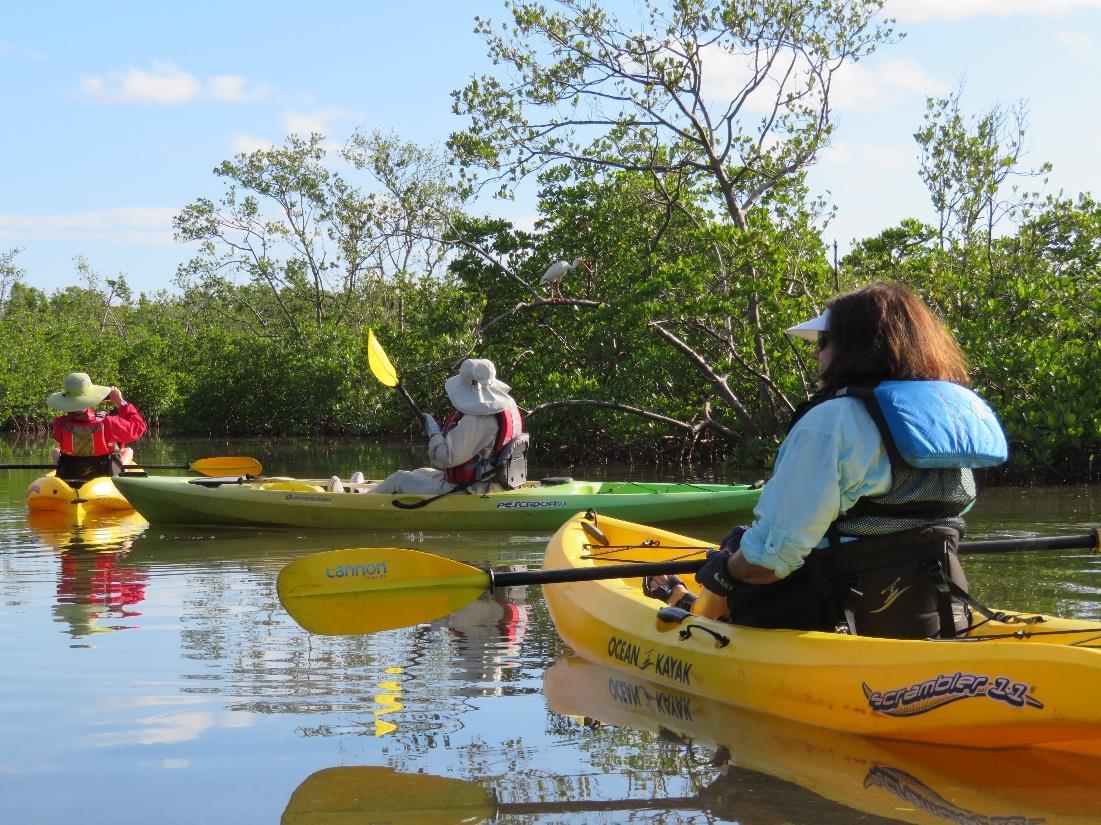
Anne Kolb, Fern Forest, Long Key, and Secret Woods are beautiful environments that give visitors an escape from the city. Whether one has half an hour or half a day, there is plenty to experience at each site.
The large number of programs, environmental education opportunities, and experiences within the nature centers and the properties where they are located is astounding. While there are special moments created at the nature centers and the parks, it is the special care by staff and volunteers that preserves and keeps these properties accessible during challenging circumstances. At various times any one of these unique properties or all of them can be impacted by an unexpected event, be it weather-related or people-related. Best practice protocols are in place for responses, and staff are well established in pivoting under these circumstances to change priorities based on needs.
The Environmental Programs & Services Assessment (“Assessment”) offers an in-depth perspective of program and service identifying core programs, program gaps within the community, key systemwide issues, areas of improvement, and future programs and services for residents and visitors.
1.5.7. Facility & Program Investment Ratings (PIR)
The purpose of these ratings is to provide a prioritized list of facility/amenity and recreation program needs for the County service area.
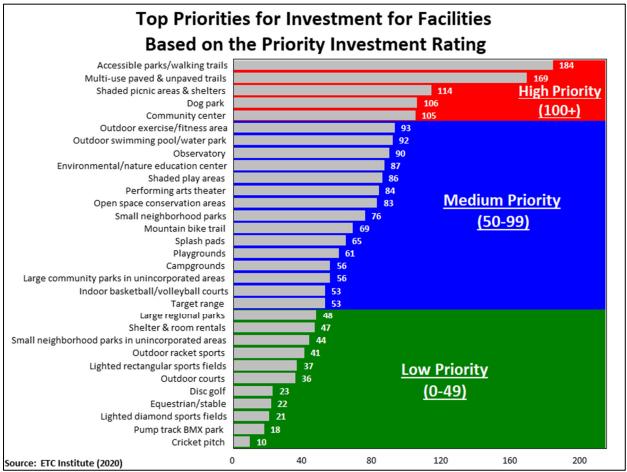
The PIR was developed by ETC Institute to provide organizations with an objective tool for evaluating the priority that should be placed on parks and recreation investments. The PIR equally weighs (1) the importance that residents place on facilities/programs, and (2) how many residents have unmet needs for facilities/programs. Based on the PIR, the following five facilities were rated as high priorities for investment:
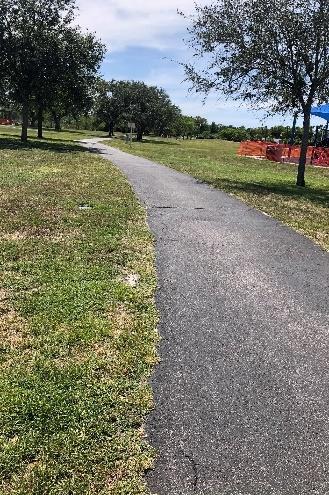
Accessible parks/walking trails (PIR=184)
Multiuse paved and unpaved trails (PIR=169)
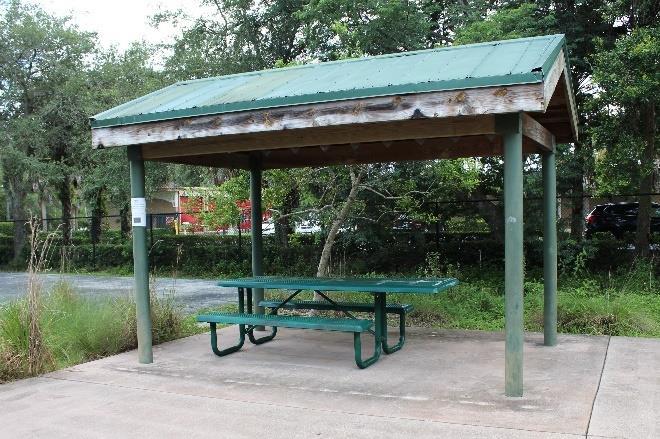
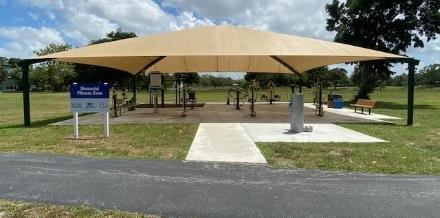
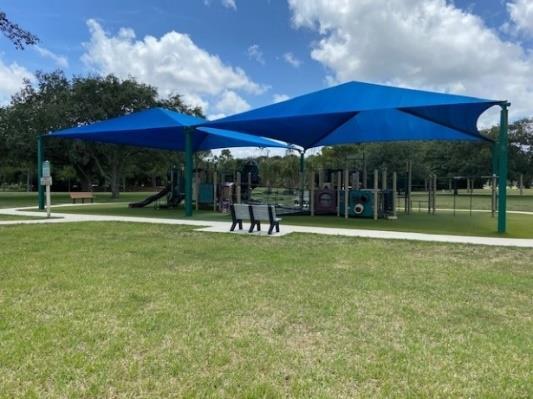
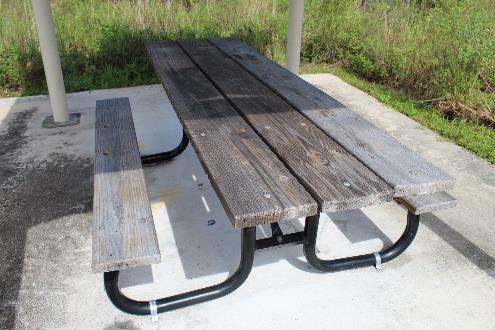
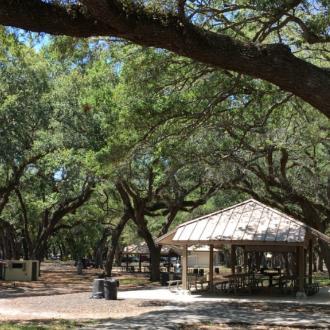
Shaded picnic areas and shelters (PIR=114)
Dog parks (PIR=106)
Community centers (PIR=105)
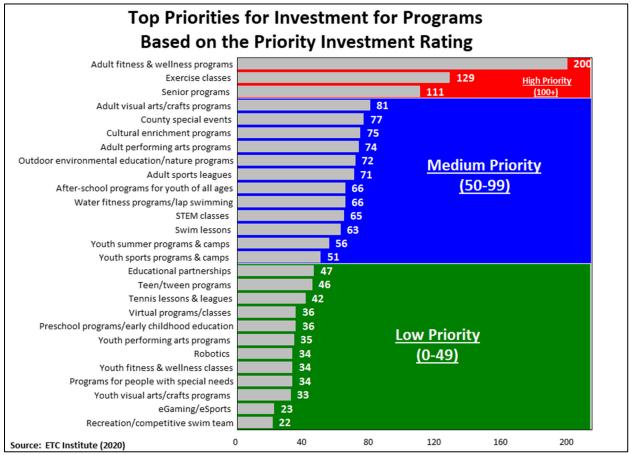
Based on the PIR, the following three programs were rated as “high priorities” for investment:
Adult fitness & wellness programs (PIR=200)
Exercise classes (PIR=129)
Senior programs (PIR=111)
1.5.8. Conclusion
Broward County continues to draw a diverse population who want to live, work, play, and enjoy year-round sunshine, beautiful beaches and parks, and no state income tax. Even as the cost of living increases, parks offer a wide range of free and low-cost programs, amenities, and facilities to engage visitors, and a passionate staff who want to provide a positive guest experience. COVID-19 highlighted the increased value of parks and recreation offerings. To support the community during the pandemic, the Division offered socially distanced programming and virtual offerings as well as COVID testing, vaccinations, and monoclonal treatment sites. By expanding training and skills of staff, they have become an essential agency that provides public safety and emergency services.
To demonstrate the ability to exceed high standards in the field of parks and recreation, the Division aspires to be the best system in the nation as a CAPRA-accredited agency and a Gold Medal recipient. To achieve this, the Division needs to continue focusing on green initiatives and climate change, building a connected system, creating equity of access, and designing world-class tourist destinations and inclusive guest experiences which can all be tremendous legacies from this Plan.
To do that, it will take a dedicated investment in the park system and more personnel to help address existing needs and plan for a world-class future emphasizing the County’s rare ecosystems, culture, and history. Input from a wide range of stakeholders was gathered in the development of this Plan, which highlights the need for significant further investment, including initiatives such as a bond referendum, additional capital allocations, and other creative funding options. At the time of this assessment, basic improvements and reconstruction/replacement of parks and facilities were estimated to cost at least $185 million and $543 million, respectively, as detailed in Chapter 3.1 Evaluation of Division Infrastructure and in Chapter 7.2 Capital Improvement Plan.
The Division’s greatest strength is its staff. They are committed and passionate about making a difference in people’s lives. They are instrumental in making Broward County the destination of choice, from sawgrass to seagrass, for residents and visitors alike.
Chapter Two Community Profile & Needs Assessment
2.1. Demographic & Recreation Trends Analysis
2.1.1. Introduction
A key component of the Plan process is a Demographic & Recreation Trends Analysis. This analysis helps provide a thorough understanding of the demographic makeup of residents within the County, health outcomes, and physical environmental factors, as well as national and local recreational trends. One key factor throughout the Plan process was the impact of the COVID-19 pandemic, which may have many lasting effects that are not yet fully understood.
METHODOLOGY
Demographic data used for the analysis was obtained from the U.S. Census Bureau and from Environmental Systems Research Institute Inc. (ESRI), the largest research and development organization dedicated to Geographical Information Systems (GIS) and specializing in population projections and market trends. All data was acquired in February 2020 and reflects actual numbers as reported in the 2010 Census.
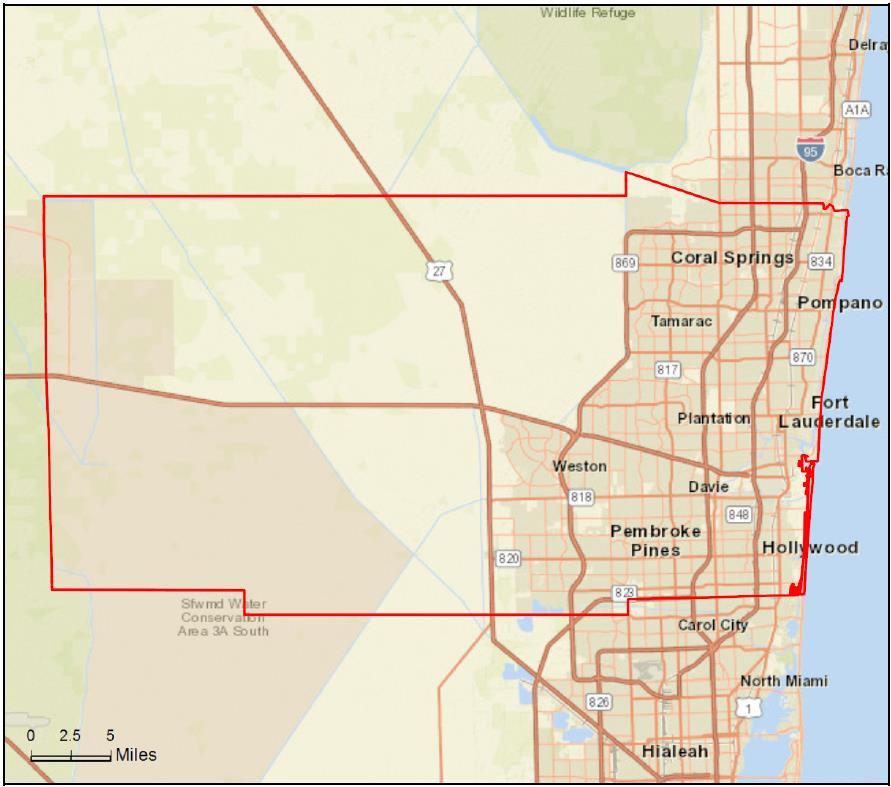
ESRI then estimated the current population (2019) as well as a five-year projection (2024). PROS used straight-line linear regression to forecast demographic characteristics for 2029 and 2034. The County boundaries shown below were used for the Demographic Analysis. (See Figure 1)
Figure 1: County Boundaries
RACE AND ETHNICITY DEFINITIONS
The minimum number of categories for data on race and ethnicity for federal statistics, program administrative reporting, and civil rights compliance reporting are as defined as below. The latest (2010 Census) definitions and nomenclature are used within this analysis.
American Indian – This includes a person having origins in any of the original peoples of North and South America (including Central America), and who maintains tribal affiliation or community attachment.
Asian – This includes a person having origins in any of the original peoples of the Far East, Southeast Asia, or the Indian subcontinent including, for example, Cambodia, China, India, Japan, Korea, Malaysia, Pakistan, the Philippine Islands, Thailand, and Vietnam.
Black Alone – This includes a person having origins in any of the Black racial groups of Africa.
Native Hawaiian or Other Pacific Islander – This includes a person having origins in any of the original peoples of Hawaii, Guam, Samoa, or other Pacific Islands.
White Alone – This includes a person having origins in any of the original peoples of Europe, the Middle East, or North Africa.
Hispanic or Latino – This is an ethnic distinction, a subset of a race as defined by the federal government; this includes a person of Mexican, Puerto Rican, Cuban, South or Central American, or other Spanish culture or origin, regardless of race.
Please note: The Census Bureau defines race as a person’s self-identification with one or more of the following social groups: White, Black or African-American, Asian, American Indian and Alaska Native, Native Hawaiian and Other Pacific Islander, some other race, or a combination of these. Ethnicity is defined as whether a person is of Hispanic/Latino origin. For this reason, the Hispanic/Latino ethnicity is viewed separate from race throughout this demographic analysis.
2.1.2. Demographic Analysis
The Demographic Analysis describes the population within the County. This assessment is reflective of the County’s total population and its key characteristics such as age segments, race, ethnicity, and income levels. It is important to note that future projections are based on historical patterns. Unforeseen circumstances during or after the time of the analysis could have a significant bearing on the validity of the projected figures.
DEMOGRAPHIC OVERVIEW (2019-2034)
Based on reported U.S. Census Bureau and ESRI data (per methodology outlined on the previous page), below are some key demographic points and how the County is expected to grow through 2034.
Population:
1,907,040 people live in Broward County
The County is expected to grow to an estimated 2,220,894 residents by 2034
Race & Ethnicity:
58% of the population is White Alone
29% of the population is Black Alone
31% of the population is of Hispanic/Latino origin
Age:
Median age: 41.2 years
By 2034, the 55+ age segment will encompass 38% of the population
Income:
Median household income: $57,848
Median household income is higher than the state 1average but lower than the national average
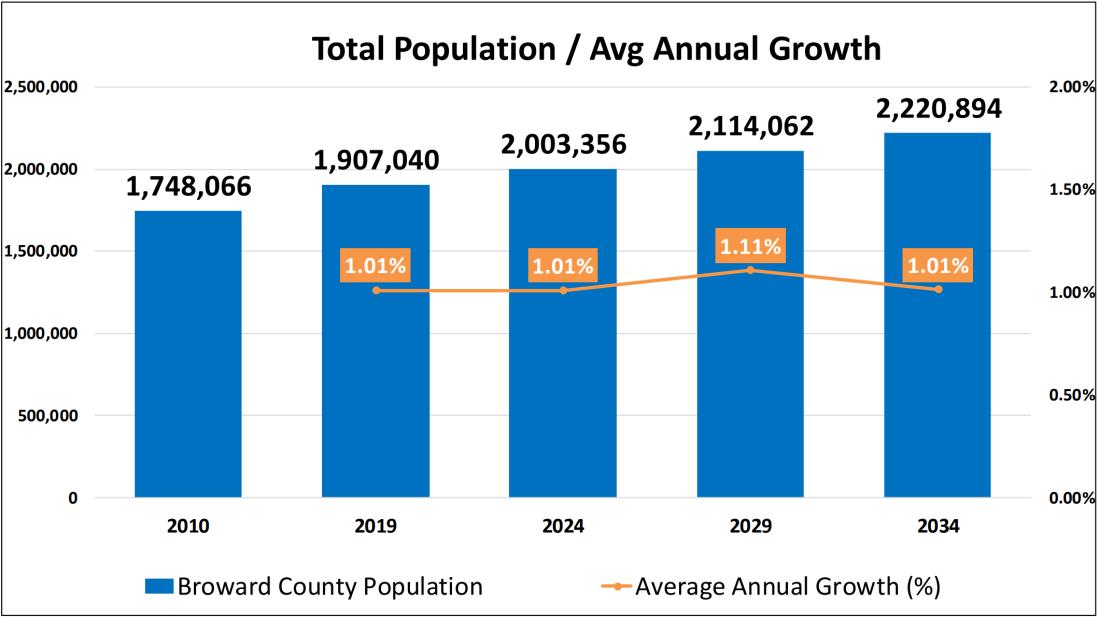
2.1.3. Broward County Populace POPULATION
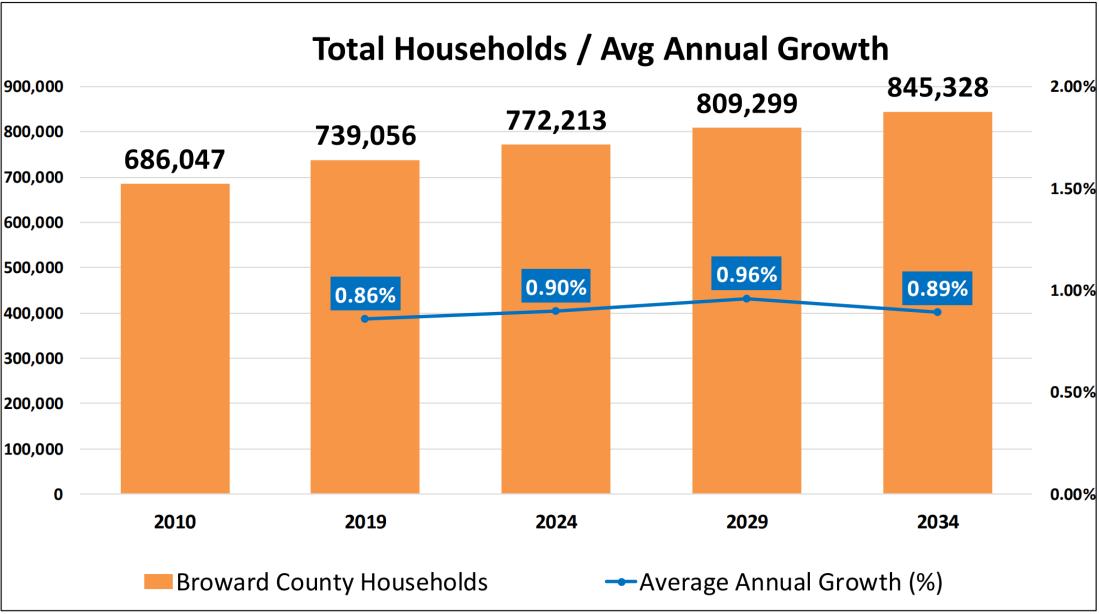
The County’s population has experienced a notable growing trend in recent years, increasing 9.09% from 2010 to 2019 (1.01% per year). This is well above the national annual growth rate of 0.85% (from 2010 to 2019). Similar to the population, the total number of households also experienced an increase in recent years (7.73% since 2010).
Currently, the population is estimated at 1,907,040 individuals living within 739,056 households. The total population and total number of households are both expected to continue growing at an above-average rate over the next 15 years. Based on 2034 predictions, the County’s population is expected to be 2,220,894 residents living within 845,328 households. (See Figures 2 & 3)
Figure 2: Total Population Projections
Figure 3: Total Household Projections
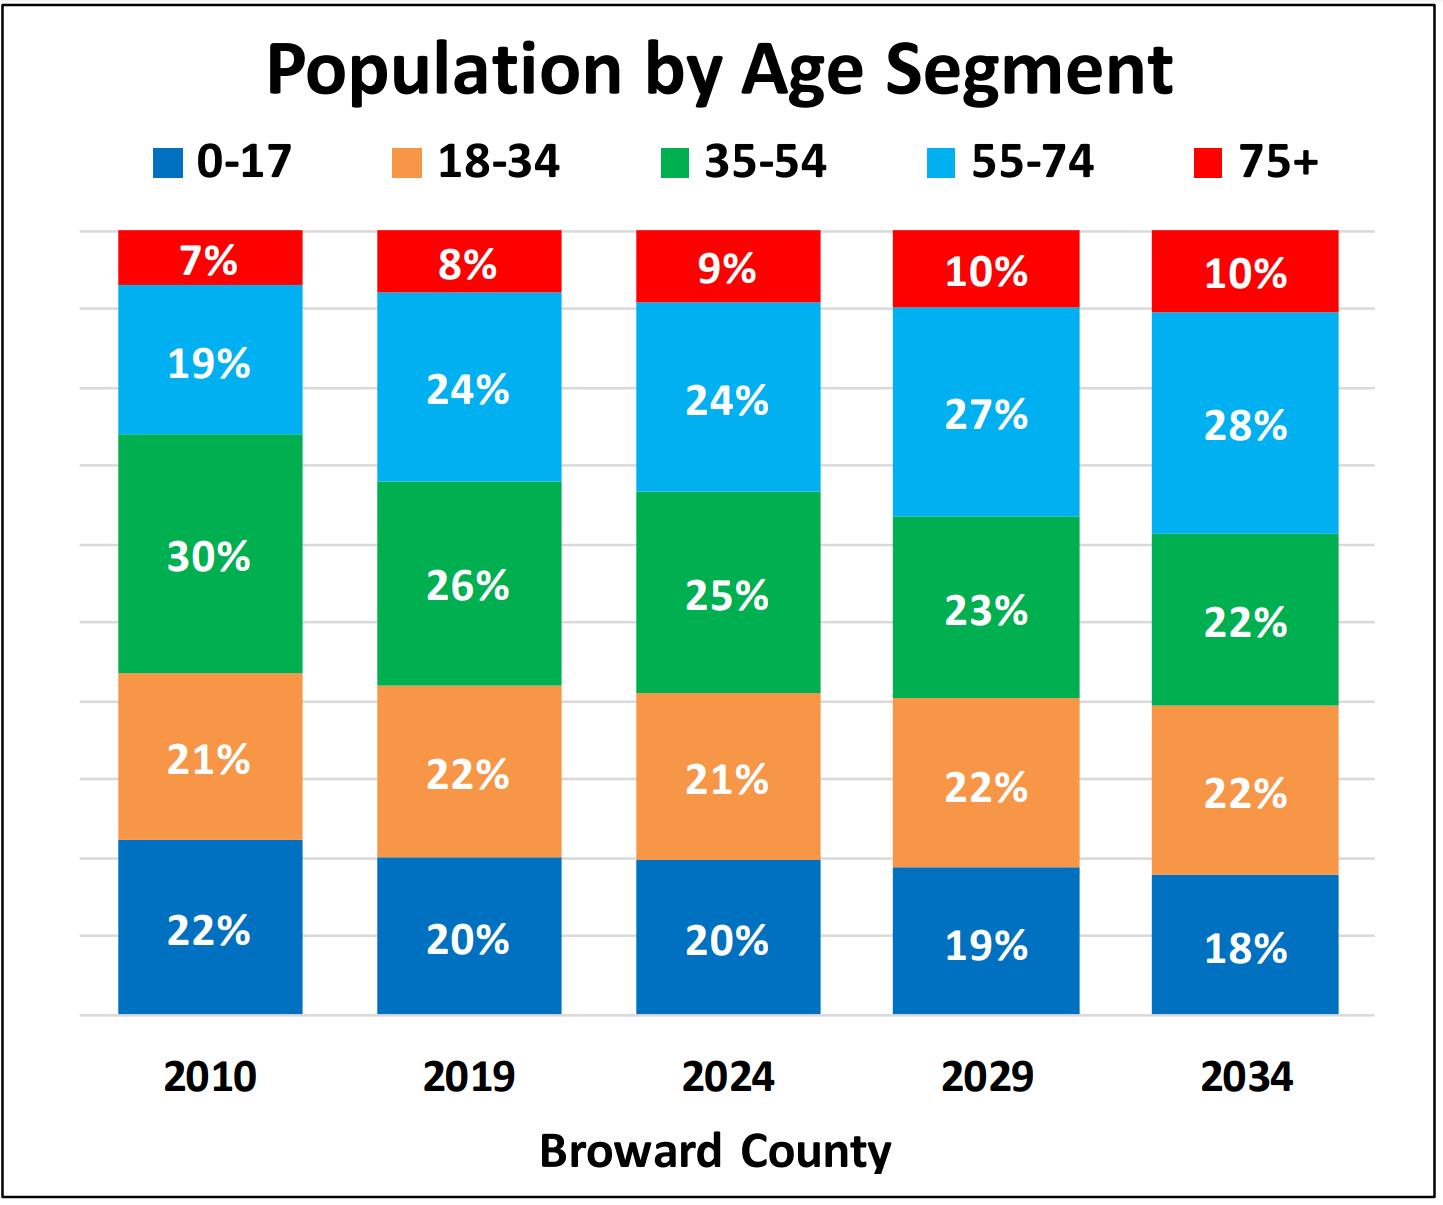
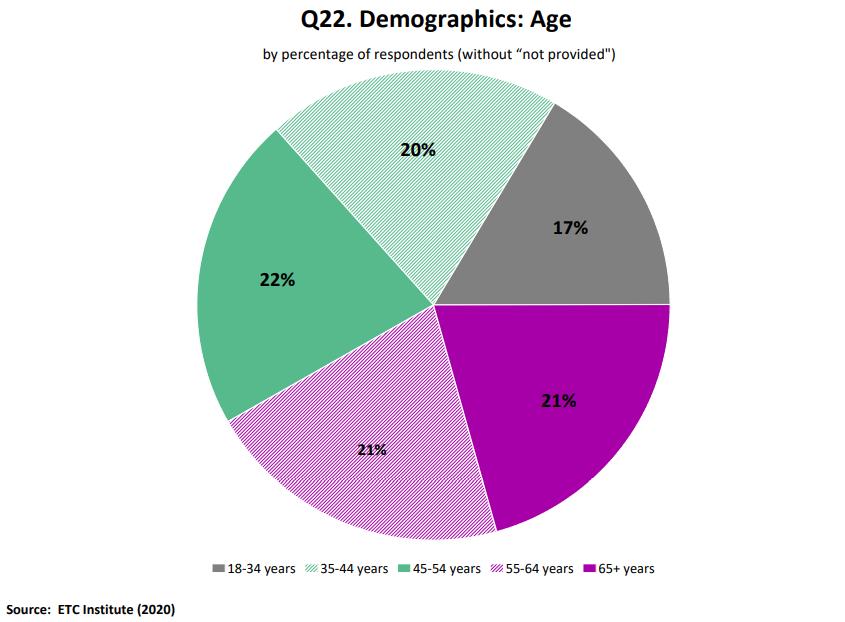
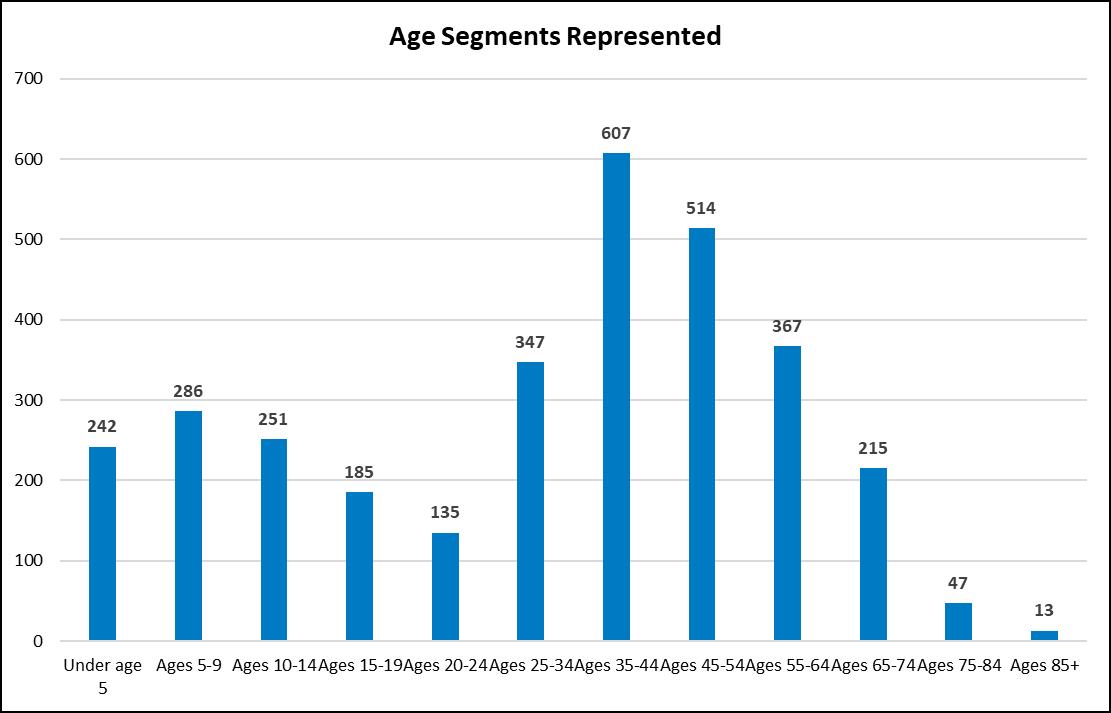
AGE SEGMENT
An evaluation of the County’s total population by age segments is shown in Figure 4 which exhibits an aging trend, with approximately 32% of its residents being older than 55. The population has a median age of 41.2 years, which is significantly older than the U.S. median age of 38.5 years. Assessing the population as a whole, the County is projected to continue aging for the foreseeable future. Over the next 15 years, the 55+ population is expected to grow an additional 6%, totaling 38% of the County’s population. This is largely due to the increase in life expectancy coinciding with the remainder of the baby-boomer generation shifting into the senior age groups. Adding to that is a trend of retirees from the north moving to warmer climates in Florida, Arizona, etc.
Due to the sustained growth of the older age segments, it is useful to further segment the senior population beyond the traditional 55+ designation. Within the field of parks and recreation, there are two commonly used ways to partition this age segment. One is to simply segment by age: 55-64, 65-74, and 75+. However, as these age segments are engaged in programming, the variability of health and wellness can be a more relevant factor. For example, a 55-year-old may suffer from rheumatoid arthritis and need different recreational opportunities from a healthy 65-year-old who is an active tennis player competing in senior tournaments. Therefore, it may be more useful to divide this age segment into Active, Low-Impact, and/or Social Seniors.
Figure 2: Population by Age Segments
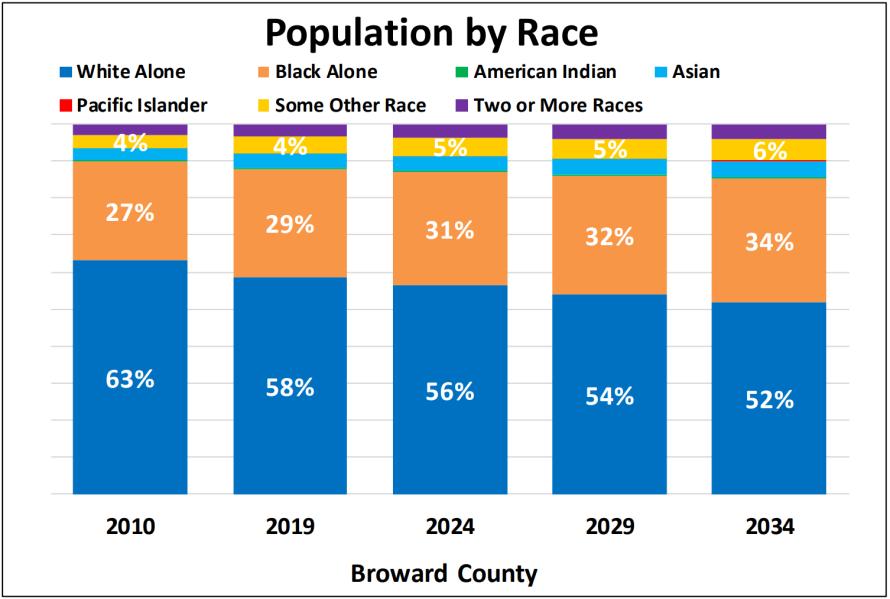
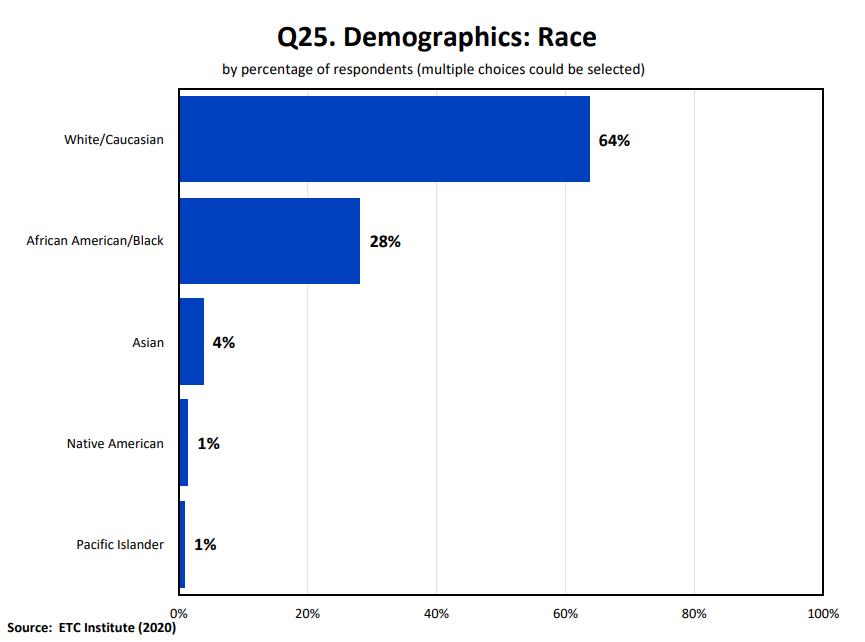
RACE
Analyzing race, as shown in Figure 5, the County’s current population is predominantly reported as White Alone. The 2019 estimate shows that 58% of the population falls into the White Alone category, with Black Alone at 29%, representing the largest minority. The racial diversification of the County is significantly more diverse than the national population, which is approximately 70% White Alone, 13% Black Alone, and 7% Some Other Race. The forecasted 2034 population is expected to continue diversifying with the White Alone population decreasing, accompanied by increases in all other race categories.
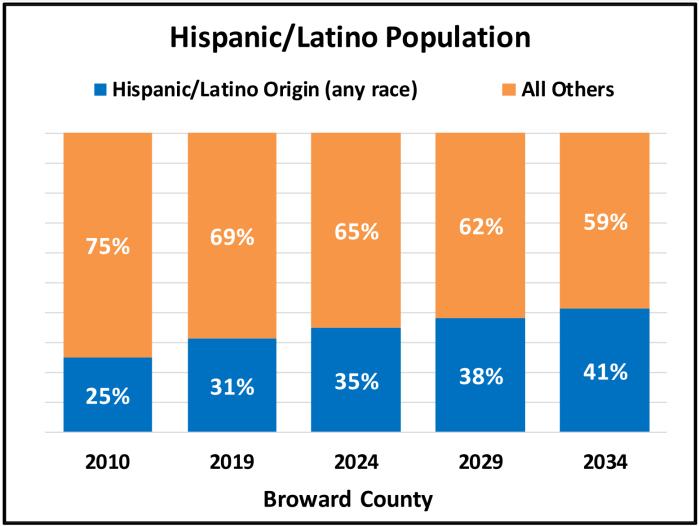
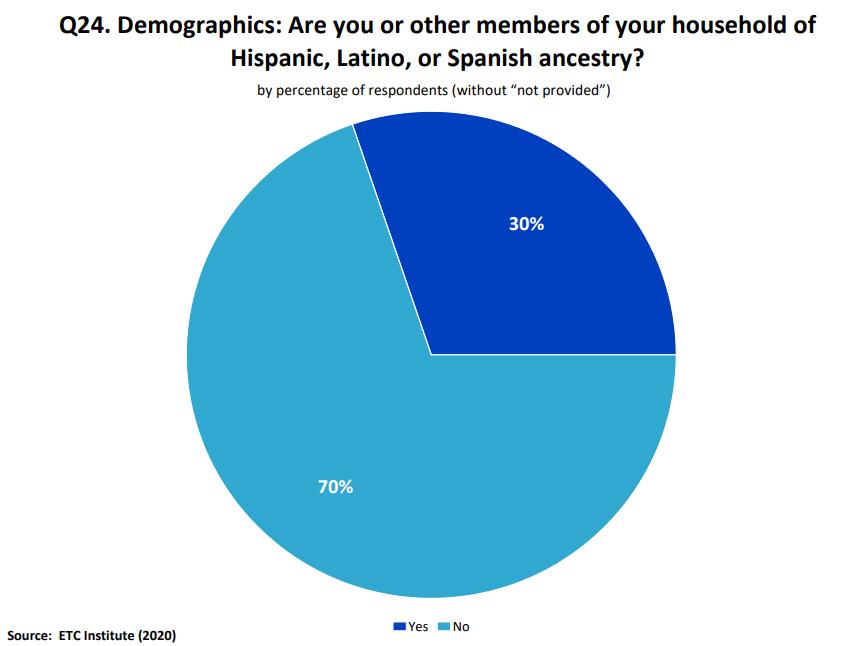
ETHNICITY
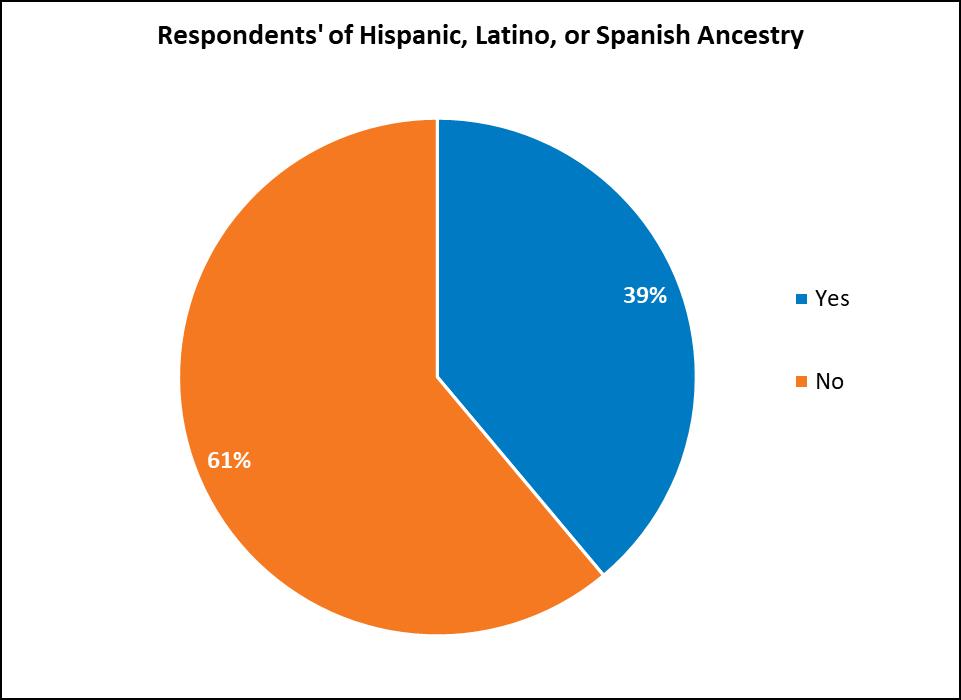
The County’s population was also assessed based on Hispanic/Latino ethnicity, which by the Census Bureau definition is viewed independently from race. It is important to note that individuals who are Hispanic/Latino in ethnicity can also identify with any of the racial categories from Figure 5.
Based on the 2010 Census and as shown in Figure 6, those of Hispanic/ Latino origin represent approximately 31% of the County’s current population, which is more than one and a half times the national average (19% Hispanic/Latino). The Hispanic/Latino population is expected to continue growing over the next 15 years, increasing to 41% of the County’s total population by 2034.
Figure 3: Population by Race
Figure 4: Population by Ethnicity
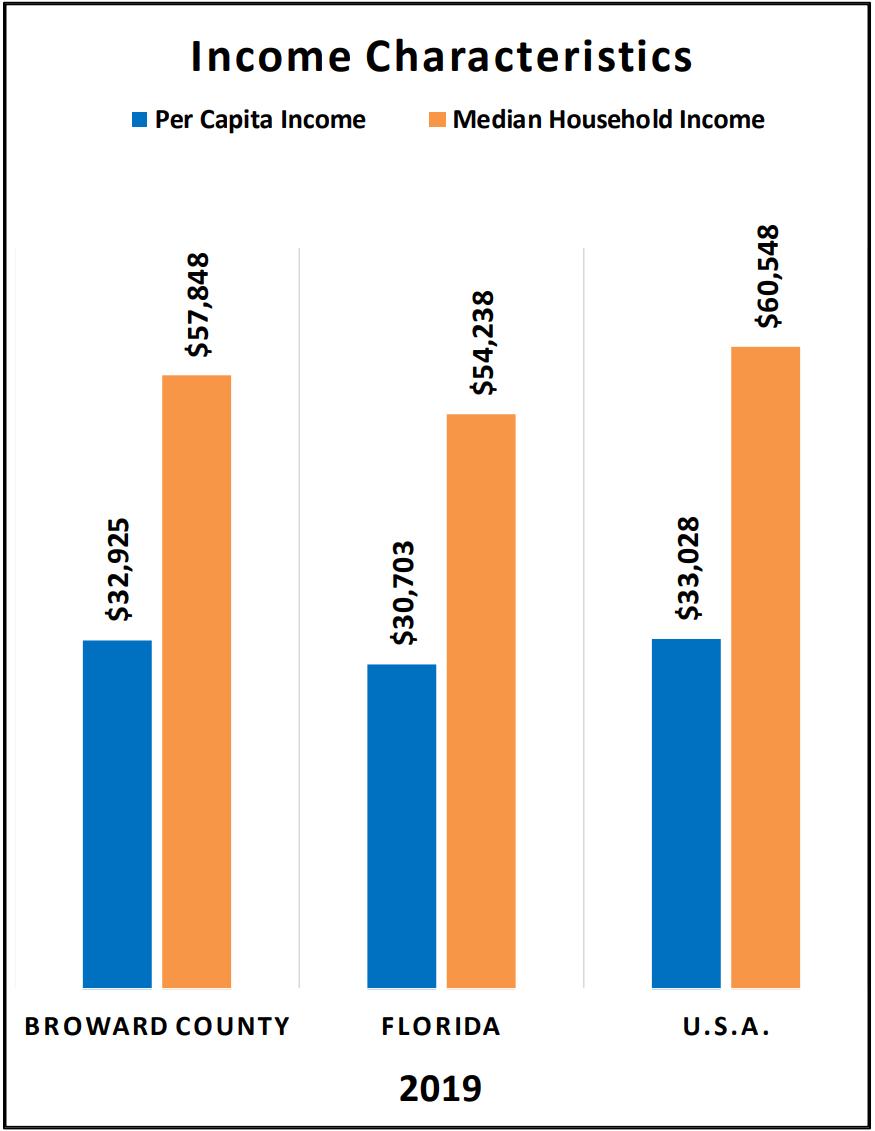
HOUSEHOLD INCOME
As seen in Figure 7, the County’s income characteristics ($32,925 and $57,848) are slightly above the state averages ($30,703 and $54,238). By contrast, the County’s per capita and median household incomes are both below the national averages ($33,028 and $60,548).
Figure 5: Income Characteristics
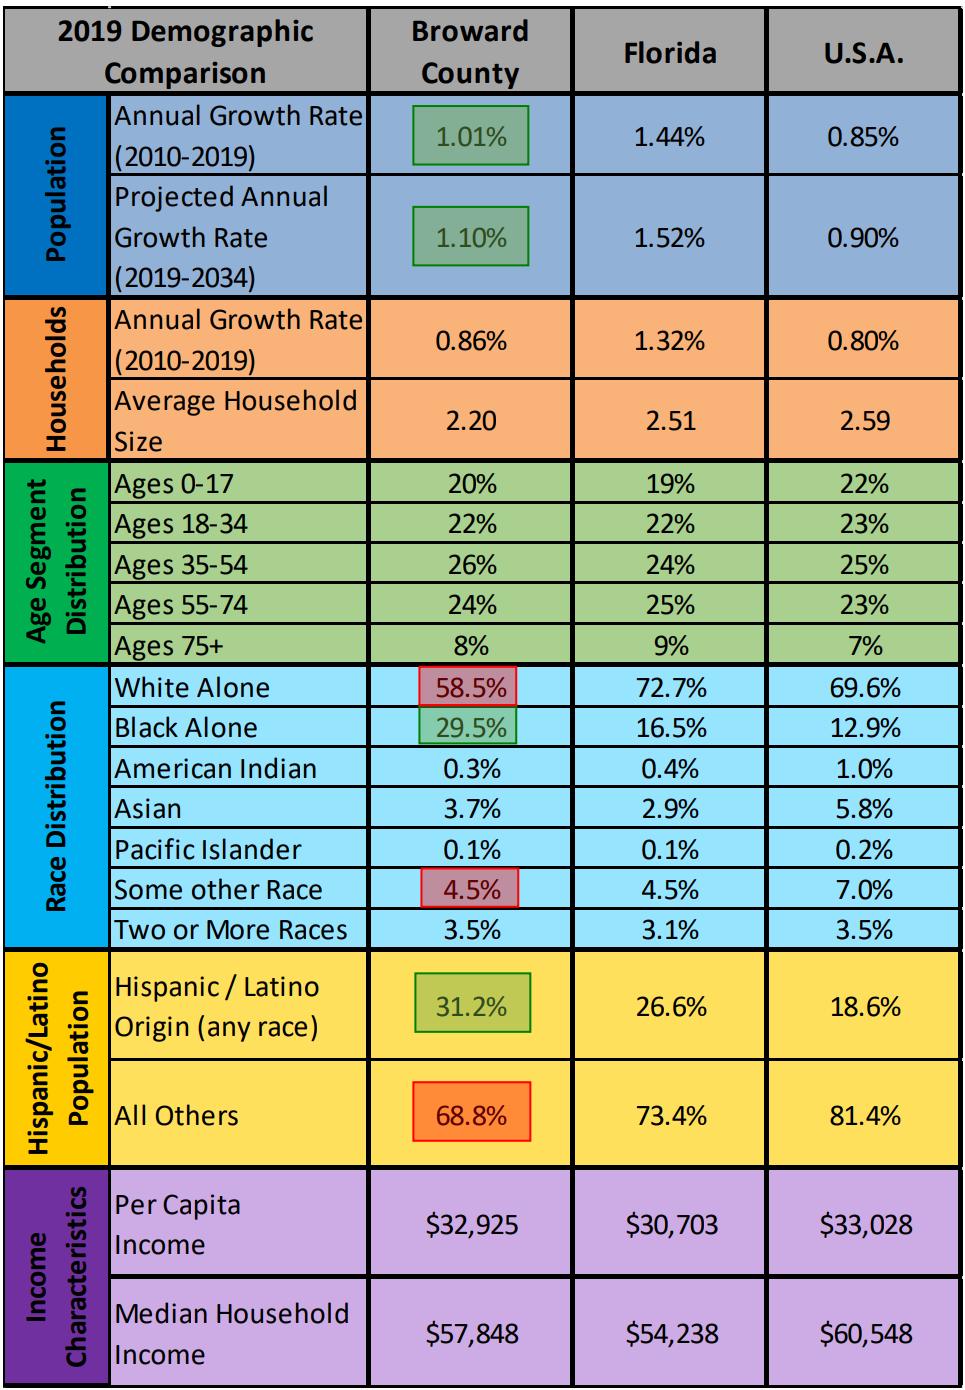
2.1.4. Demographic Comparative Summary
The table below is a summary of the County’s demographic figures. These figures are then compared to the state and U.S. populations. This type of analysis allows the County to see how its population compares on a local and national scale. The highlighted cells represent key takeaways from the comparison between the County and the national population.
= Significantly higher than the national average
= Significantly lower than the national average
Figure 6: Demographic Comparative Summary Table
DEMOGRAPHIC SUMMARY
The County’s recent population annual growth rate (1.01%) is significantly higher than the U.S. (0.85%) growth rate.
The County’s household annual growth rate (0.86%) is slightly higher than the national (0.80%) average.
When assessing age segments, the County exhibits an older population than the national age segment distribution.
The County’s racial distribution has a significantly higher Black Alone population and lower White Alone and Some Other Race populations, when compared to national percentage distribution.
Broward County’s percentage of Hispanic/Latino population (31.2%) is well above the national average (18.6%).
The County’s per capita income ($32,925) and median house income ($57,848) are both slightly below average, when compared to the U.S.’s income characteristics ($33,028 & $60,548).
2.1.5. Demographic Implications
While it is important not to generalize recreation needs and priorities based solely on demographics, the analysis suggests some potential implications for the County.
First, with the population expecting significant growth for the foreseeable future, it is suggested that the County ensure the upkeep of existing facilities. In addition, the County should plan to expand facility space and program offerings in order to accommodate the growing population. Rather than eliminating services or facilities that are deemed outdated or currently underutilized, consider repurposing these spaces to meet the needs of its users.
Second, the County’s aging trend may indicate the need to provide more programs and services for the 55+ population. Such a focus could attract more seasonal tourists and residents from Canada and northern states, as well as baby-boomer retirees. However, it will also be important to continue providing services for the 68% of residents who are currently under 55 years old.
Third, the County’s below national average income characteristics suggest the likelihood of limited disposable income. Given the geographical size of the County and the population, there are economically challenged areas within the County where fees should be minimal or free to increase access. The Division should be mindful of this when pricing programs, facility rentals, admissions, and events.
Finally, the County should ensure growing minority races and ethnicities are being reflected in marketing and communications outreach, program participation figures, and response rates when surveying the community. This will help ensure all community needs are being met.
2.1.6. Health Outcomes & Physical Environmental Factors
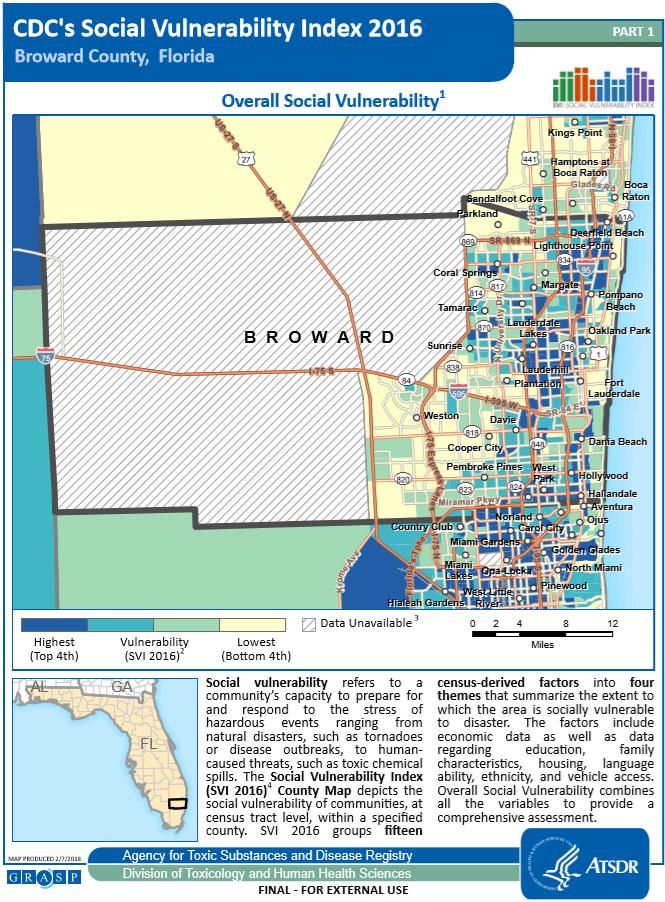
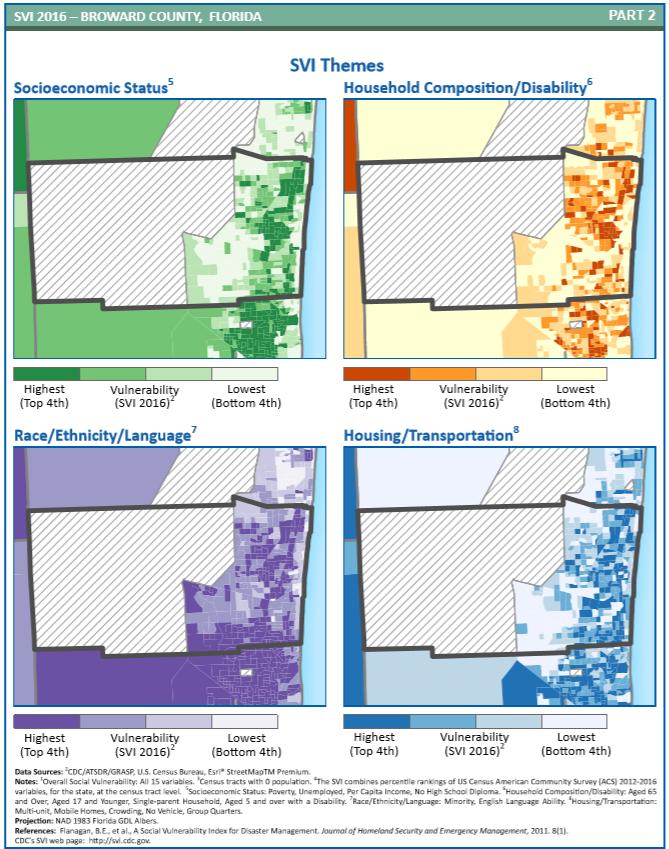
In addition to demographic characteristics, PROS utilized the County Health Rankings and the Agency for Toxic Substances and Disease Registry (ATSDR) to explore various public health outcomes of Broward County residents.
COUNTY HEALTH RANKINGS
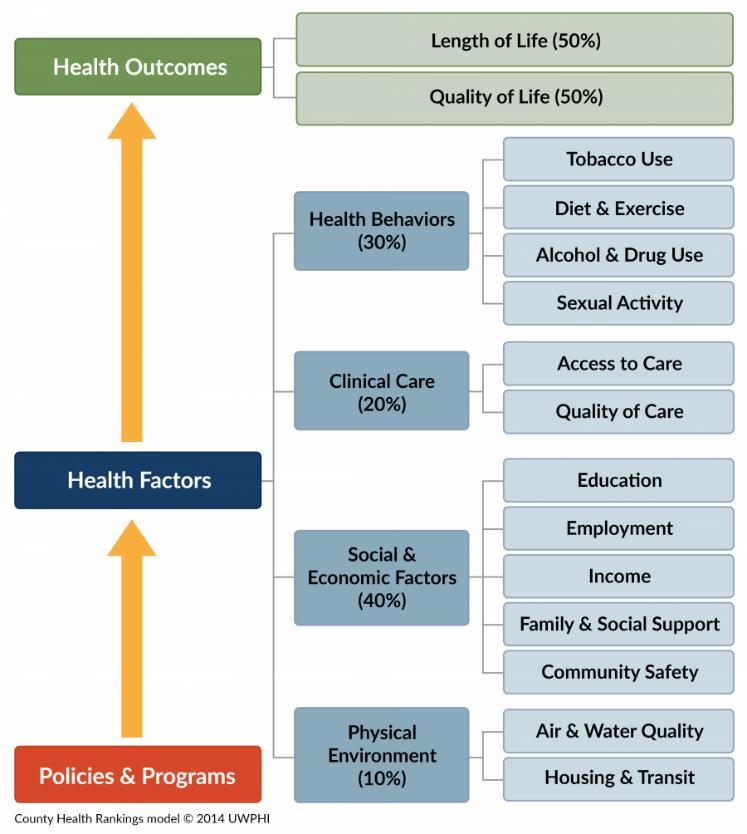
The County Health Rankings & Roadmaps Model provides an understanding of what influences the health of residents and expected life spans, at the County level and across the U.S. The overall health of a County is measured through two key health metrics – Health Outcomes and Health Factors. Health Outcomes are end results caused by an individual’s health; while Health Factors are circumstances that affect one’s health. Both core areas are comprised of several subcategories that are weighted to comprise the overall County rankings.
The following sections provide tables that detail the health metrics for Broward County, for both Health Outcomes and Health Factors, and provide rankings for the County relative to the 67 counties within Florida. Then, the County is further compared to the state of Florida as a whole, and to the top 10th percentile of all U.S. counties. Assessing Health Outcomes, where first is the County with the best Health Outcomes and 67th is the County with the worst, Broward County ranks 14th out of 67 counties in Florida. Similarly, the County ranks 17th out of 67 for Health Factors.
Health trend data was sourced from the 2020 County Health Rankings & Roadmaps, which is conducted by the University of Wisconsin Population Health Institute in collaboration with the Robert Wood Johnson Foundation. For more information, visit www.countyhealthrankings.org.
Figure 7: County Health Rankings Model
HEALTH OUTCOMES
The County ranked 14th among Florida counties for Health Outcomes. Analyzing sub-categories for Health Outcomes, reveals that the County ranks eighth for Length of Life and 27th for Quality of Life. Individual metrics from the study related to Health Outcomes have remained fairly consistent for the County; however, Premature Death was identified as an area of improvement for the County.
The County should focus efforts on spreading awareness of parks and facilities and how these amenities can have a positive impact on the physical and mental well-being of residents. If the broader population is made aware of the benefits of a daily walk in the park, many of these measured outcomes may improve over time.
Source: County Health Rankings & Roadmaps, www.countyhealthrankings.org
Figure 8: Health Outcome Rankings for Broward County
HEALTH FACTORS
The County ranks 17th among 67 counties for Health Factors. This ranking was based on the following sub-categories and ranks: Health Behaviors (eighth), Clinical Care (30th), Social & Economic Factors (14th), and Physical Environment (59th). The table below, Figure 11, highlights the health behaviors that have a strong correlation to parks and recreation including: Adult Obesity, Food Environment Index, Physical Inactivity, and Access to Exercise Opportunities
When compared to the Top 10th Percentile of U.S. Counties, Adult Obesity and Access to Exercise Opportunities were identified as strengths of the County. Indicators that were highlighted as opportunities for the County to improve upon include Food Environment Index and Physical Inactivity when compared to the Top 10th Percentile of U.S. Counties. Note: Food Environment Index measures access for County residents to healthy foods by considering the distance an individual lives from a grocery store or supermarket, locations for health food purchases in most communities, and the inability to access healthy food because of cost barriers.
Although parks are a small component of where and what a person might eat, they should be able to reinforce a healthy lifestyle. The County should implement healthy alternatives, where possible, throughout concession operations (whether directly or with concessionaires) and vending machines offered at their facilities. As an added measure, participants in other active recreation programs could be offered discounts or bundles with lower pricing on healthy food options.
Health Factors (ranked 17 out of 67 counties)
Source: County Health Rankings & Roadmaps, www.countyhealthrankings.org
Figure 9: Health Factor Rankings for Broward County
Health Outcomes (ranked 14 out of 67 counties)
2.1.7. Recreational Trends Analysis
The Trends Analysis provides an understanding of national and local recreational trends. Trend data used for this analysis was obtained from Sports & Fitness Industry Association (SFIA), National Recreation and Park Association (NRPA), and ESRI. All trend data is based on current and/or historical participation rates or statistically valid survey results. A full National Recreational Trends Analysis can be found in Appendix B
NATIONAL TRENDS IN RECREATION METHODOLOGY
The SFIA’s Sports, Fitness & Recreational Activities Topline Participation Report 2020 was utilized in evaluating the following trends:
National Recreation Participatory Trends
Core vs. Casual Participation Trends
The study is based on findings from surveys conducted in 2019 by the Physical Activity Council, resulting in a total of 18,000 online interviews. Surveys were administered to all genders, ages, income levels, regions, and ethnicities to allow for statistical accuracy of the national population. A sample size of 18,000 completed interviews is considered by SFIA to result in a high degree of statistical accuracy. A sport with a participation rate of 5% has a confidence interval of plus or minus 0.32 percentage points at a 95% confidence level. Using a weighting technique, survey results are applied to the total U.S. population figure of 302,756,603 people, ages six and older.
The purpose of the report is to establish levels of activity and identify key participatory trends in recreation across the U.S. This study looked at 122 different sports/activities and subdivided them into various categories including: sports, fitness, outdoor activities, aquatics, etc.
CORE VS. CASUAL PARTICIPATION
In addition to overall participation rates, SFIA further categorizes active participants as either core or casual participants based on frequency of participation. Core participants have higher participatory frequency than casual participants. The thresholds that define casual versus core participation may vary based on the nature of each individual activity. For instance, core participants engage in most fitness activities more than 50 times per year, while for sports, the threshold for core participation is typically 13 times per year.
In each activity, core participants are more committed than casual participants. They tend to be less likely to switch to other activities or become inactive (engage in no physical activity). This may also explain why activities with more core participants tend to experience less pattern shifts in participation rates than those with larger groups of casual participants.
2.1.8. Local Sport & Leisure Market Potential MARKET POTENTIAL INDEX (MPI)
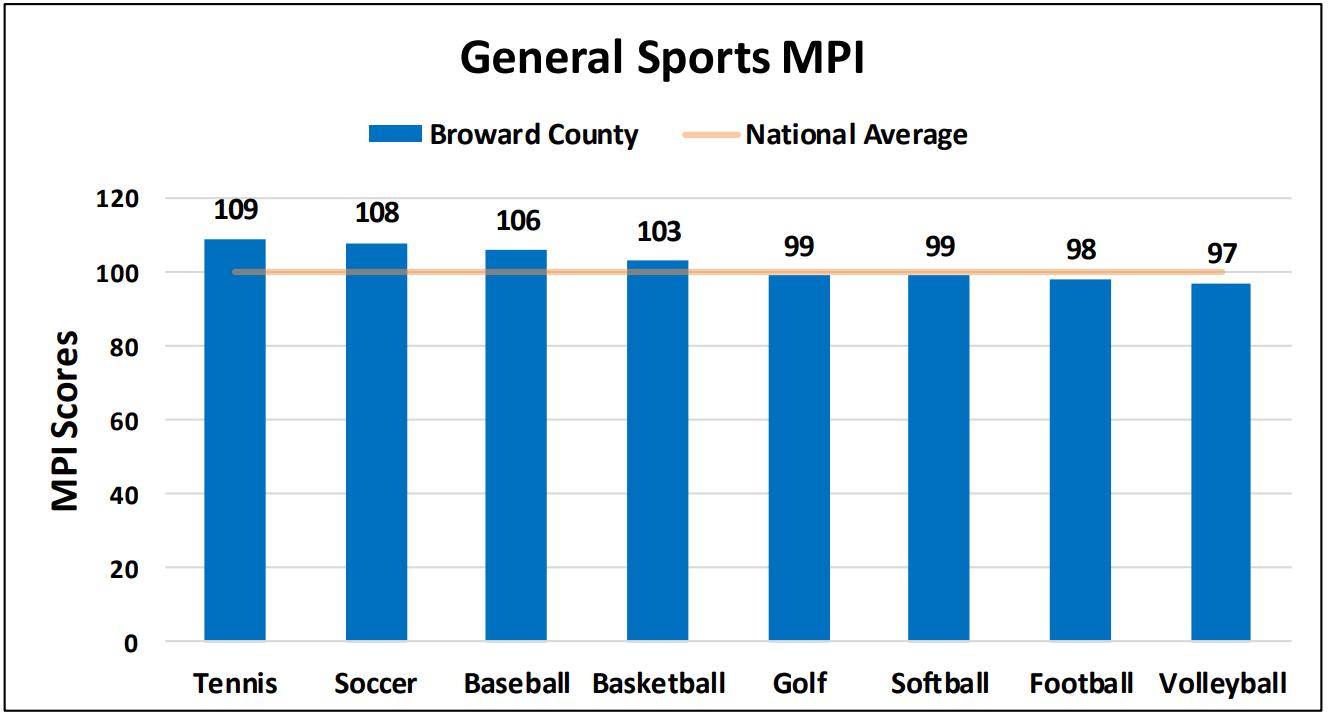
The following charts show sport and leisure market potential data for Broward County, as provided by ESRI. MPI measures the probable demand for a product or service within the defined service areas. MPI shows the likelihood that an adult resident living within the County will participate in certain activities when compared to the U.S. national average. The national average is 100; therefore, numbers below 100 would represent lower than average participation rates, and numbers above 100 would represent higher than average participation rates. The service area is compared to the national average in four categories: general sports, fitness, outdoor activity, and commercial recreation.
Note: MPI metrics are only one data point used to help determine community trends; thus, programmatic decisions should not be based solely on MPI metrics.
Overall, when analyzing the County’s MPIs, the data demonstrates slightly above average MPI numbers. This is particularly noticeable when analyzing the fitness market potential chart that shows only one activity, swimming, scoring below 100. This can potentially be due to a variety of factors including lower swimming rates traditionally among people of color as well as access to personal pools in people’s backyards, rendering the need to visit a public pool as unnecessary or less needed. When assessing the general sports, outdoor activity, and commercial recreation MPI charts, there is a solid range of activities scoring above and below the national average. The overall above average MPI scores show that County residents have a strong participation presence when it comes to recreational offerings, especially pertaining to fitness activities. When the Division considers implementing new programs or building new facilities, this data will become significant and provide for a powerful tool to estimate resident attendance and participation.
As seen in the charts below, the following sport and leisure trends are most prevalent for residents within the County. The activities are listed in descending order, from highest to lowest MPI score.
GENERAL SPORTS MARKET POTENTIAL
The general sports MPI chart reveals that, overall, the County’s residents are most likely to participate when it comes to tennis, soccer, and baseball when compared to the national average.
Figure 10: Broward County General Sports Participation Trends
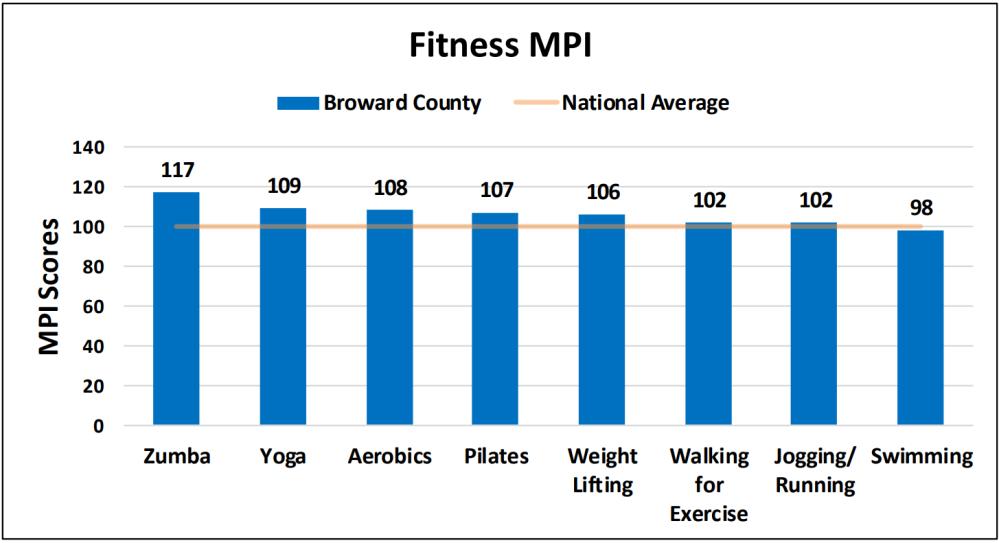
FITNESS MARKET POTENTIAL
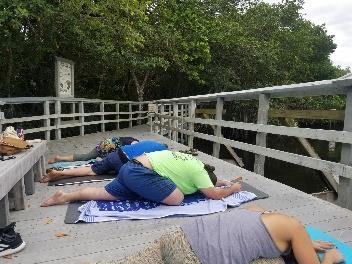
Overall, the fitness MPI chart reflects the highest collective MPI scores amongst the four assessed categories, with Zumba, yoga, and aerobics all scoring well above the national average.
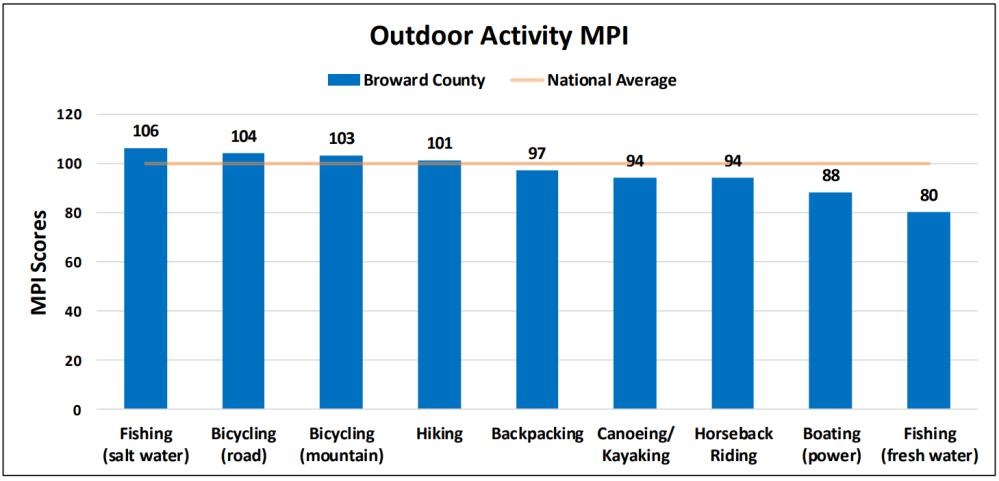
OUTDOOR ACTIVITY MARKET POTENTIAL
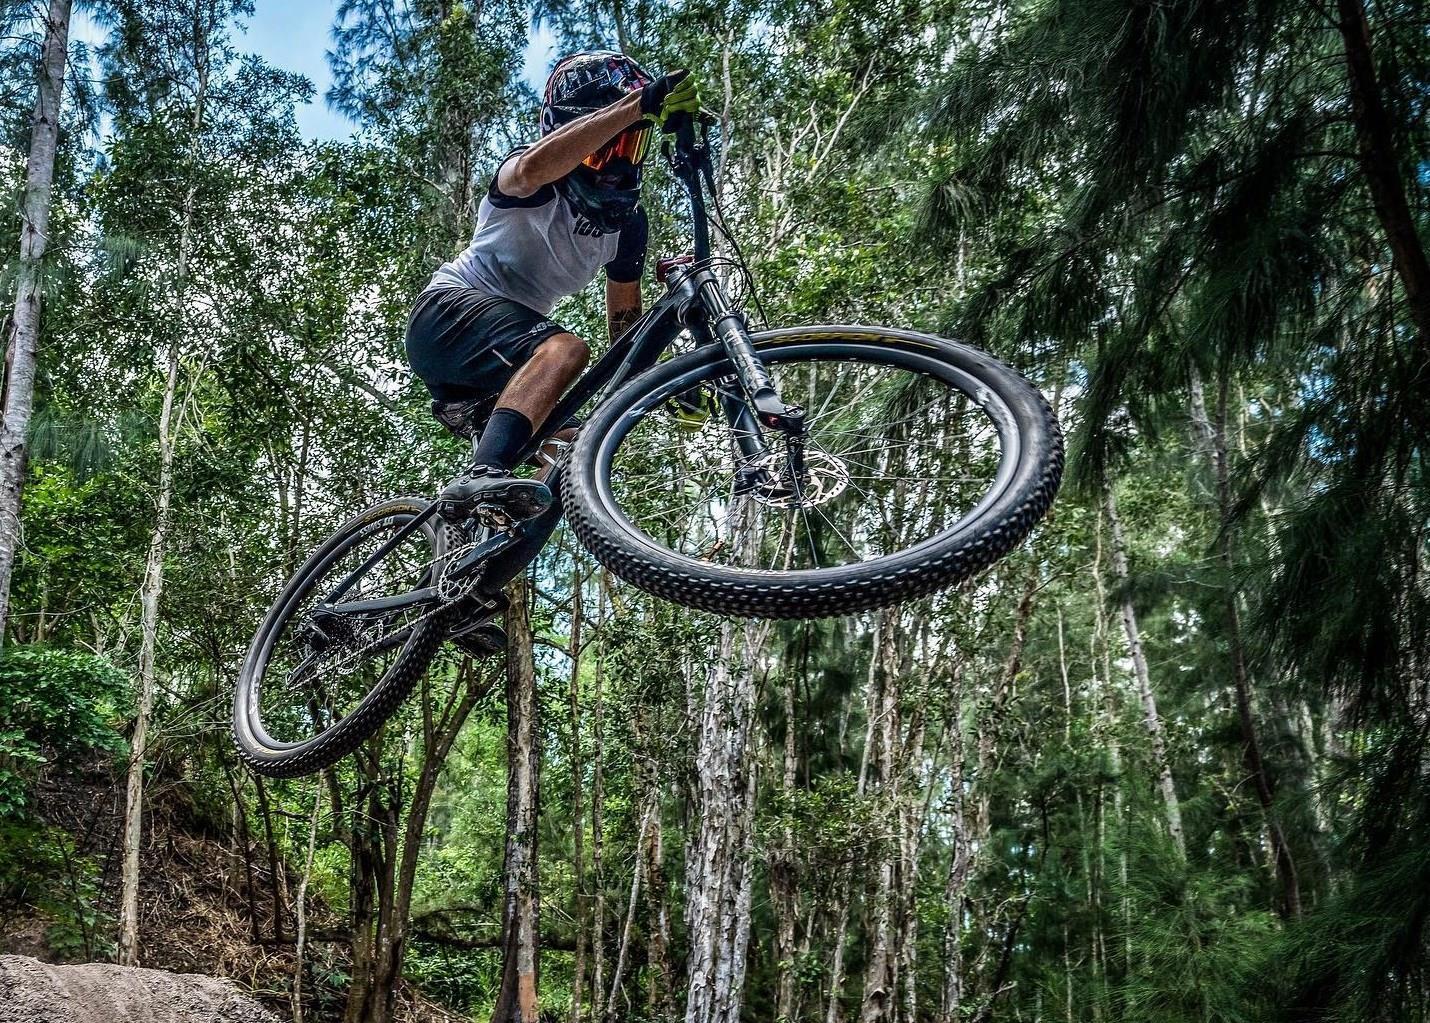
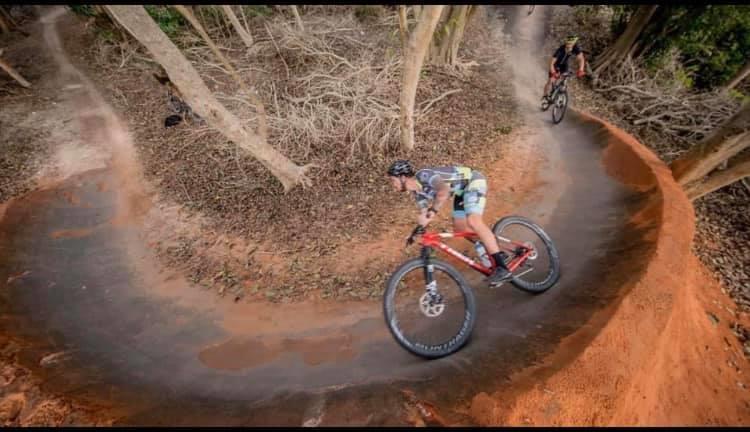
When analyzing Figure 14, saltwater fishing, road bicycling, and mountain biking scored the highest amongst all outdoor activities. While boating and freshwater fishing rounded out the least participated in activities, both significantly below the national average.
Figure 11: Broward County Fitness Participation Trends
Figure 12: Broward County Outdoor Activity Participation Trends
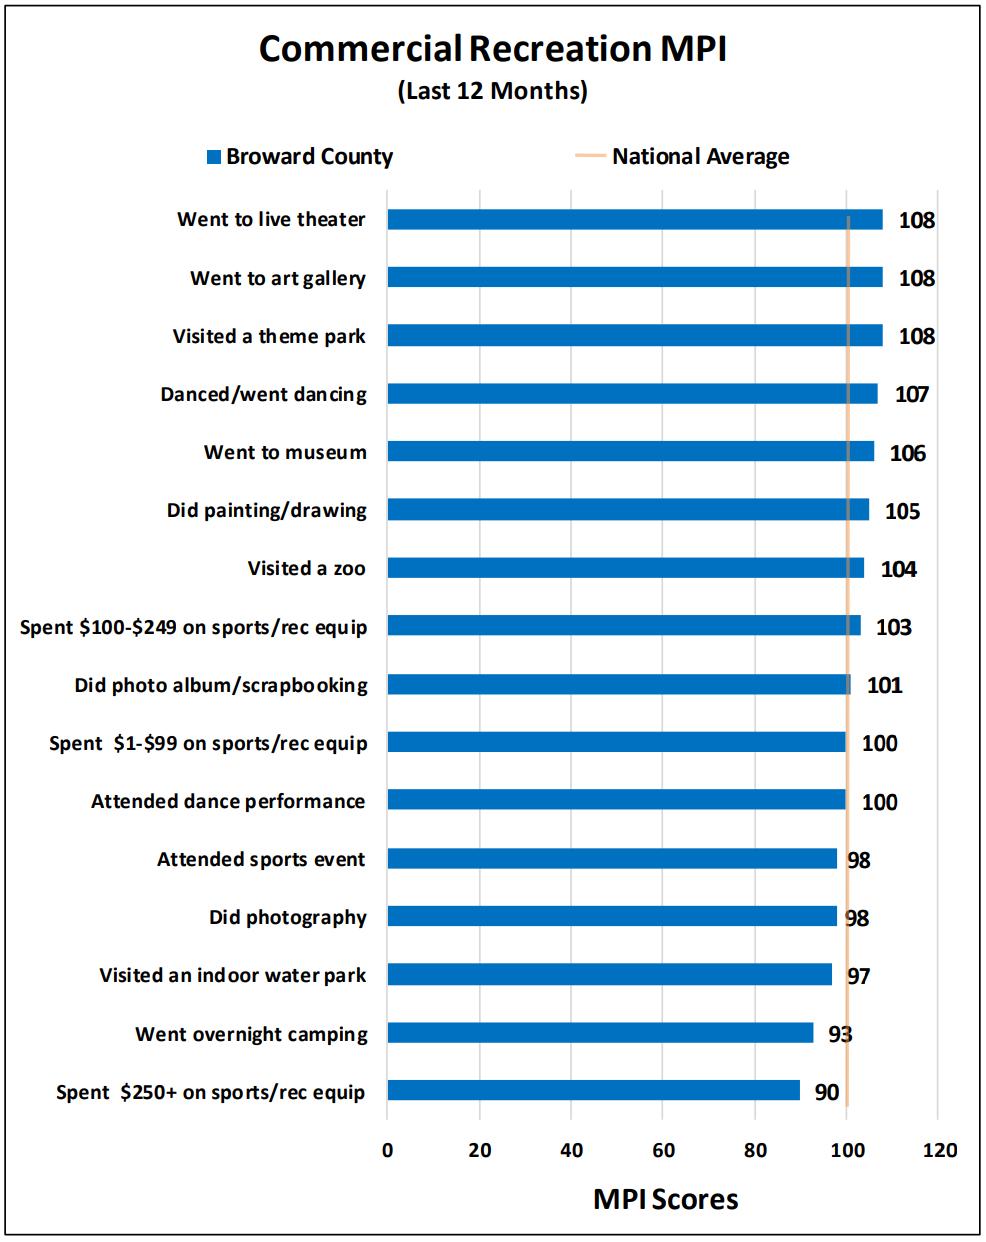
COMMERCIAL RECREATION MARKET POTENTIAL
The commercial recreation MPI chart shows that attending live theater, art galleries, and theme parks are the top three activities among County residents when compared with the national average.
Figure 13: Broward County Commercial Recreation Participation Trends
LOCAL RECREATION TRENDS SUMMARY
Overall, the County’s residents demonstrate participation trends that have above-average MPI numbers in three of the four categories analyzed (general sports, fitness, and commercial recreation). Recreation of particular interest includes:
Participation in sports such as tennis, soccer, and baseball.
Outdoor fitness equipment and fitness-related programming in Zumba, yoga, and aerobics classes.
Money spent on attending live theater as well as visiting art galleries and theme parks. The County could capture people participating in commercial recreation while blending nature and art into design components, such as with a sculpture park.
The County has already established programs or partnerships for a variety of the sports and has been seeing a surge in the number of registered recreational instructors offering fitness-related programming as well. It will be important for the Division to continue offering these recreational opportunities for its residents and/or foster partnerships to ensure resident needs are being met. The above-average activities of the commercial recreation segment may seem to be outside the scope of a parks and recreation agency, but creative partnerships with local artists or an expansion of the Parks Foundation of Broward County’s Park Fest live music events could be considered within the commercial recreation segment.
2.2. Community Needs Assessment
2.2.1.
Public Input Summary
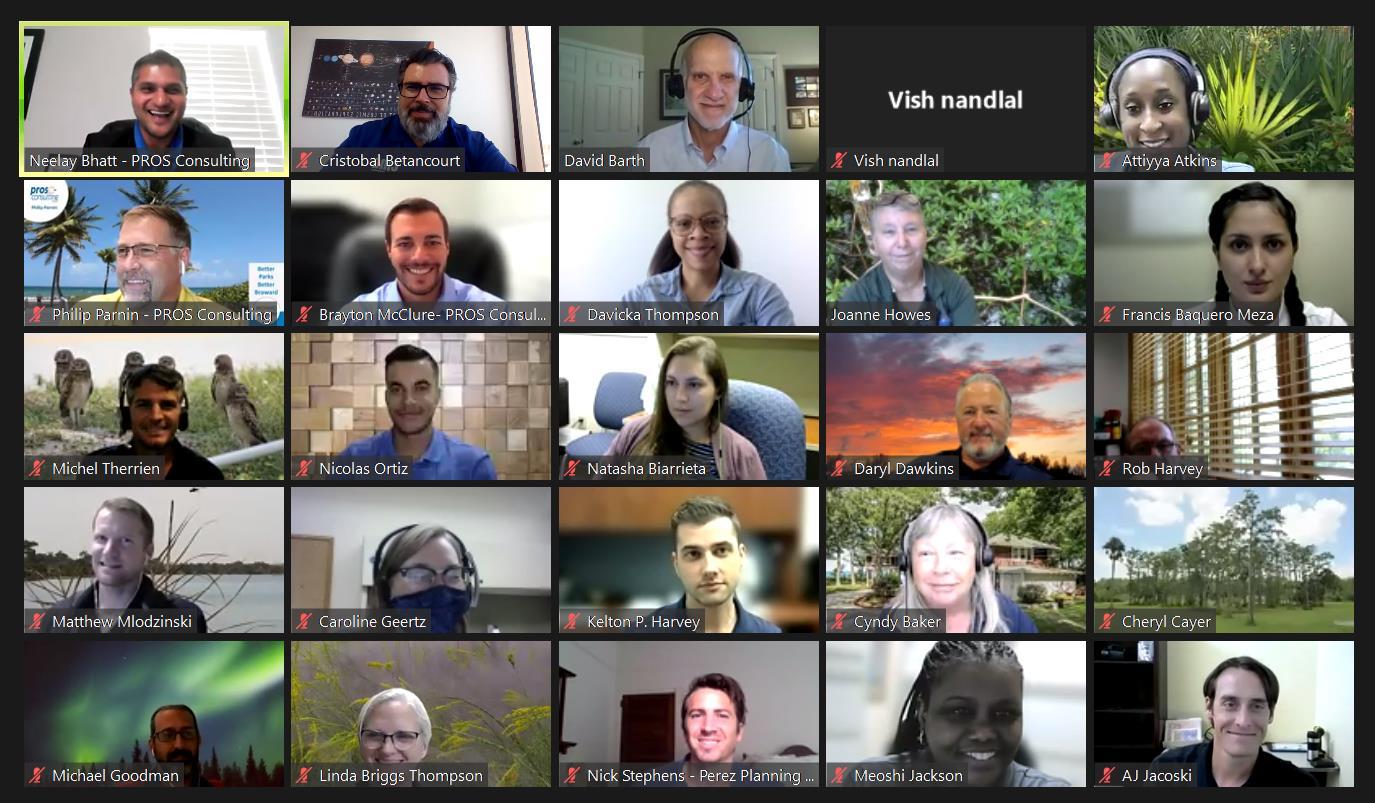
In order to establish a better understanding of the current state of the Division and to help determine the needs and priorities for the future, the planning process incorporated a variety of input from Broward County residents. This included a series of key stakeholder interviews, focus group discussions, five public forums, a statistically valid survey, an online survey, community pop-up outreach, and the crowdsourcing website. The following sections summarize and highlight the key findings from each stage of the extensive public input process.
2.2.2. Key Stakeholder & Focus Groups Summary
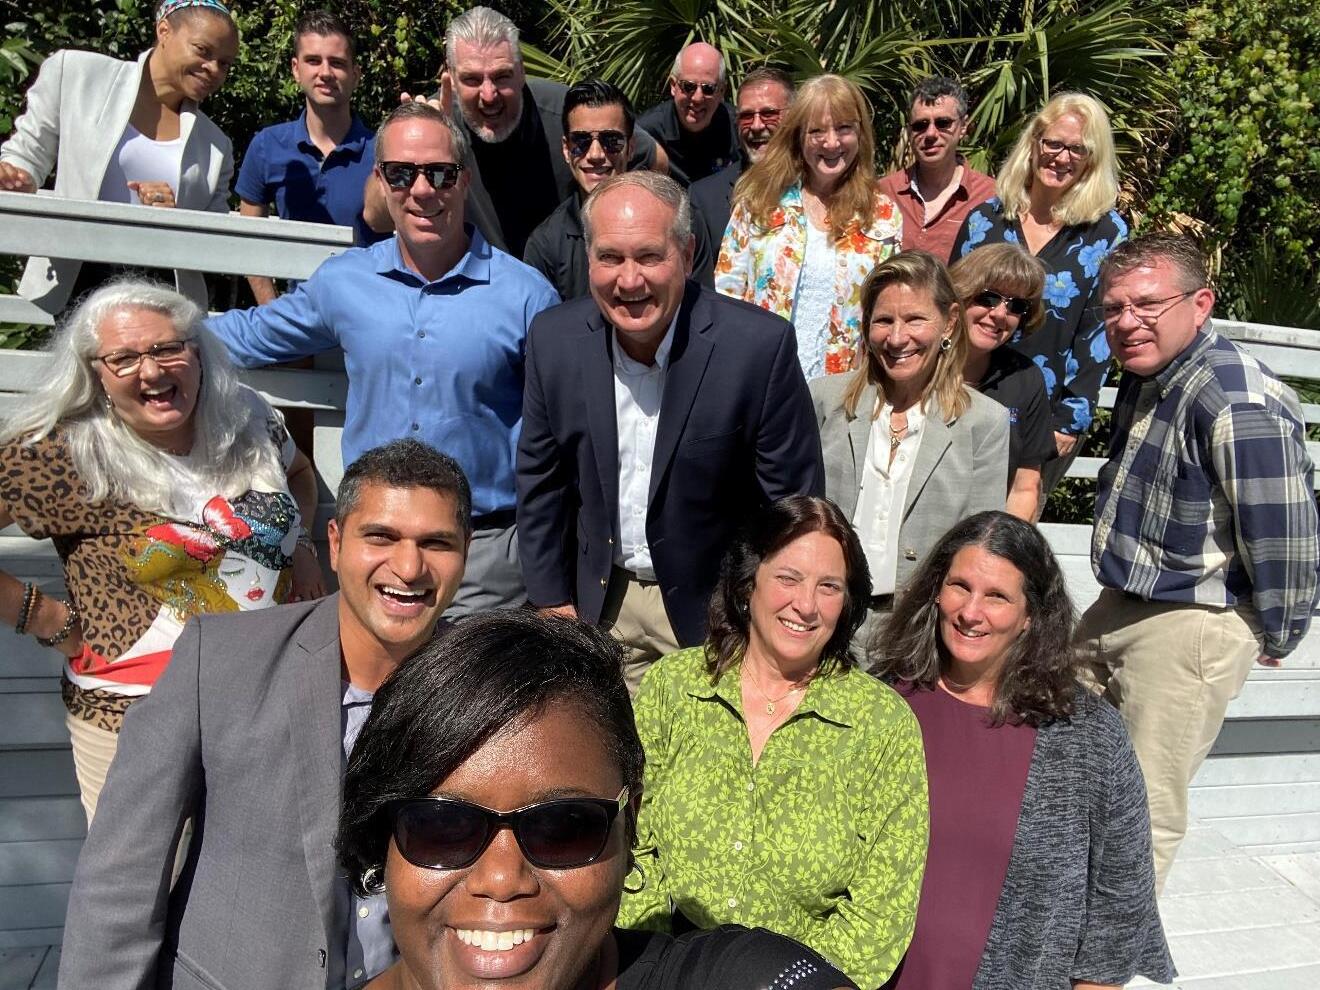
A fundamental part of the Parks and Recreation System Master Plan process included conducting a robust outreach effort to solicit critical input from key stakeholders and focus groups. Over the course of three days in March 2020, the consulting team convened with these groups to better assess the needs of constituents across the County. The purpose of these meetings was to gain insight into the current strengths, opportunities, and priorities for the park system, and to better understand future recreational needs of the County. Representatives from the following groups provided input:
Stakeholders and User Groups
Broward County Board of County Commissioners
Broward County Administrators
Broward County Directors
Broward County Marine Advisory Committee
Quad-County Park Directors
Broward County Parks Advisory Board
Broward County Urban Wilderness Advisory Board
Broward County Parks Senior Managers
Broward County Parks Managers
Broward County Parks Associate Managers & Supervisors
Broward County Parks First-Line Staff
Municipal Park Directors in Broward County
Parks Foundation of Broward County
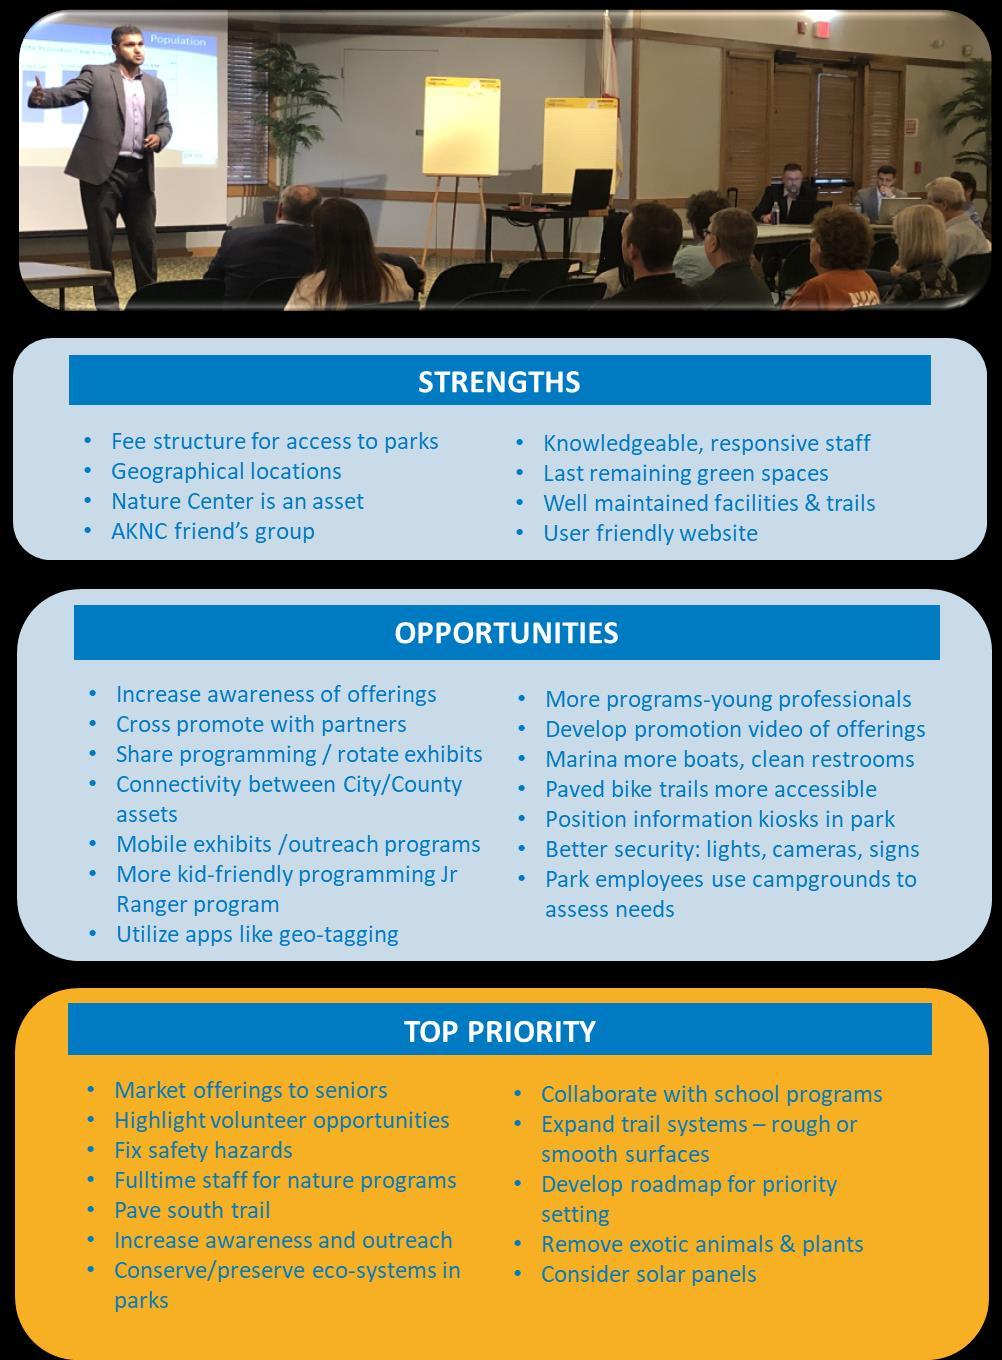
STRENGTHS
Based on feedback from key stakeholder interviews, common themes arose in many conversations. These themes included preservation of natural habitats, diverse/multigenerational programming, staff growth and development, an active volunteer base, collaborative community partnerships, and facilities.
NATURAL AREAS & OPEN SPACES
Many stakeholders communicated that the Division’s park system provides an abundance of natural resources, pristine beauty, and educational opportunities. The nature offerings provide residents with an opportunity to connect with nature and an unparalleled educational experience. Stakeholders agree that the variety of nature programming is a great strength of the Division’s park system. Comments regarding the Division’s natural resources and nature programming included:
Abundance of greenway trails
Commitment to environmental education and conservation
Excellent naturalist programming
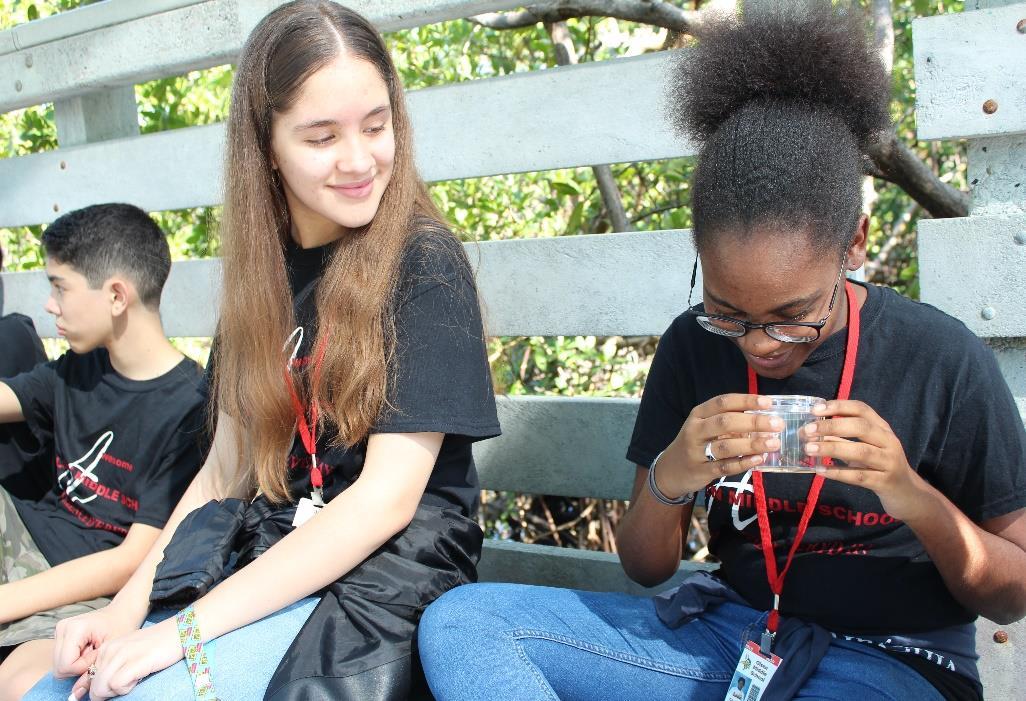
Family access to learning about nature in the park
Focus on natural area preservation
Great nature areas, open spaces
Maintenance of greenspaces
Natural resources, including greenway trails and canal banks
Quality of 4H programs
Variety of natural ecosystems
ADMINISTRATION & STAFF
Stakeholders noted that the knowledge and expertise of park staff contribute greatly to providing an exceptional experience for visitors. Division staff stay abreast of industry trends and work to incorporate innovative best practices into park programming. Several stakeholders highlighted the resourcefulness of staff and administration to provide exemplary service, even when funding challenges are present. Many stated that quality leadership played a key role in high employee morale, noting a high rate of employee retention. Sentiments shared regarding the strengths of the Division’s administration and staff include:
Improved relations with the Division’s Human Resources
Top-notch leadership team, responsive to constituents
Reliable systems that help staff efficiency, i.e., RecTrac software
Robust use of part-time seasonal workers and interns
Skilled set of maintenance workers
Supportive upper management
Staff has a “SUNsational” attitude
PROGRAMMING AND ACTIVITIES
The Division provides a plethora of diverse activities and programs at their park locations. Offerings cater to the young and old, creating a great opportunity for visits with the whole family, and appeal to a wide variety of users. From sports to arts and crafts to special events and naturalist programming, the diversity of programming is a great benefit. Many programs and activities are free or low-cost affording access to residents with marginal income. Recreation centers also provide many community services like tax preparation, access to computers, and out-of-school care to help meet residents’ needs.
Stakeholders praised the Division for their ingenuity and innovation in diverse programming. Highlights of their comments include:
Diverse activities for health & wellness, i.e., mountain biking, walking/jogging paths, exercise equipment
Dog parks, campgrounds, water parks, and marinas appeal to vast demographic
The internal Parks Futures program, which is designed to help with employee advancement, is noteworthy
Great focus on programming for age segments and special populations
Stellar educational programs, i.e., science learning (such as STEAM) and nature education
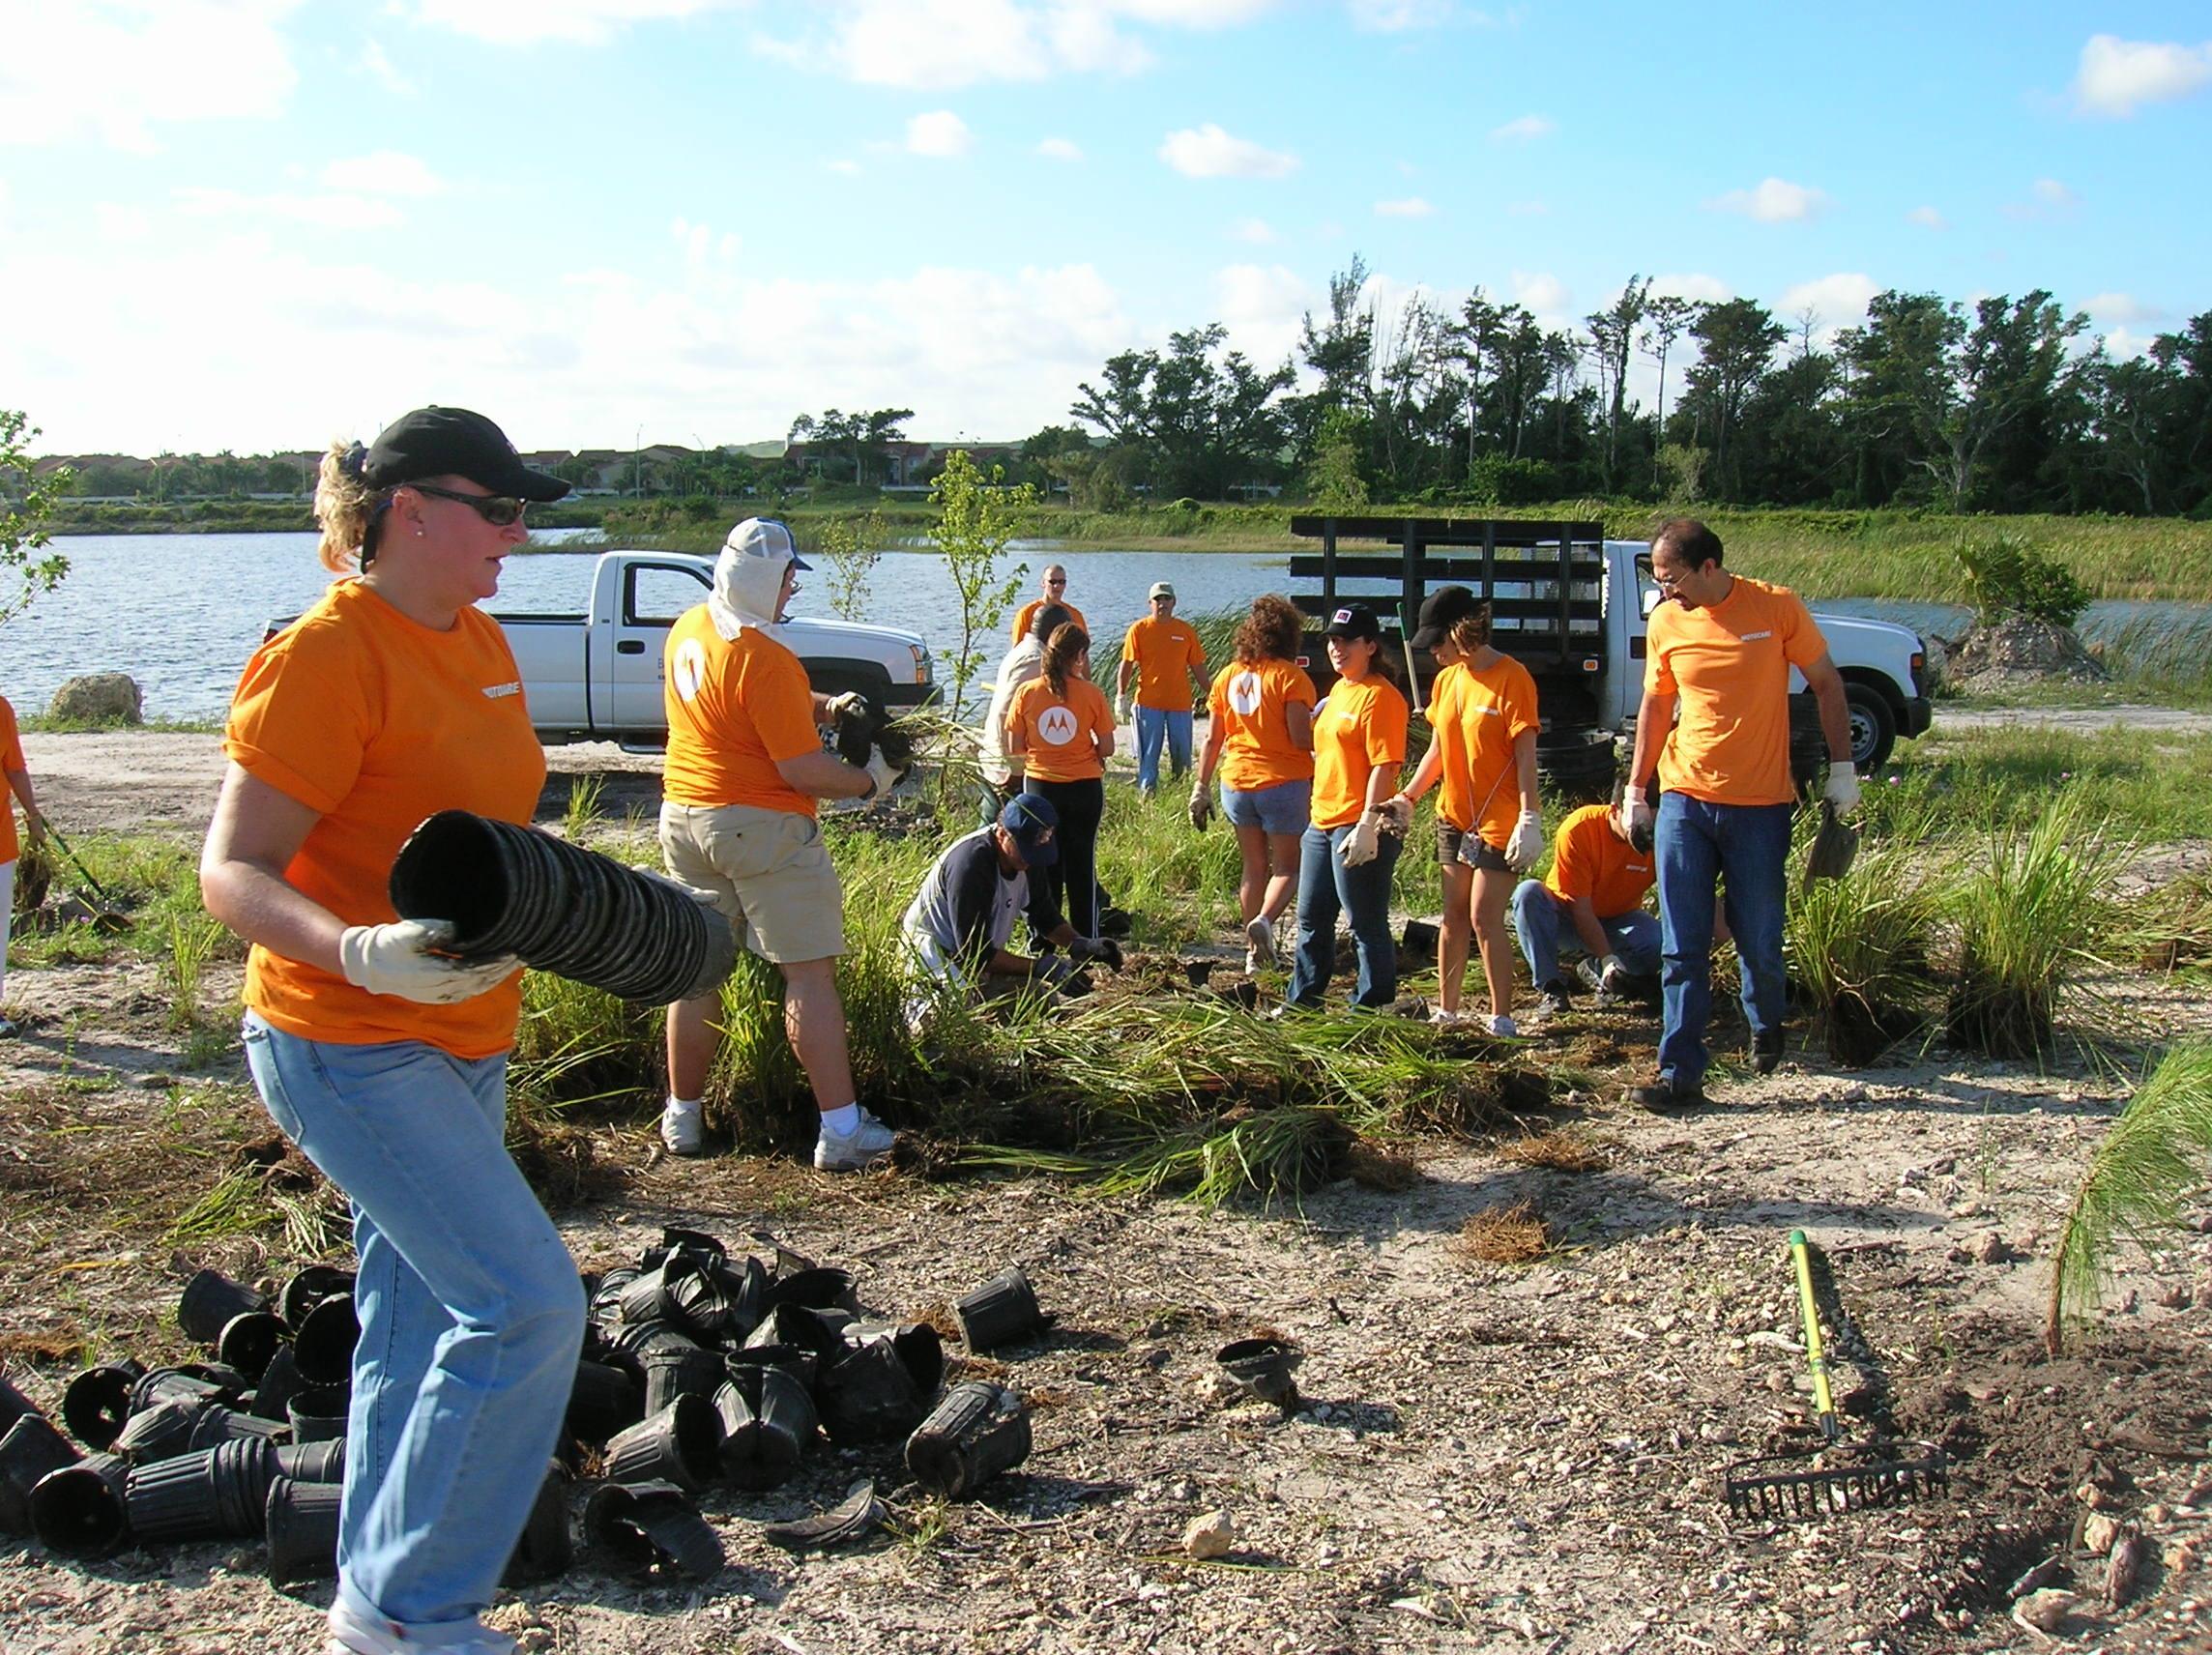
VOLUNTEER NETWORK
Stakeholders identified strong participation from the Division’s volunteer base, Parks Foundation of Broward County, and friends groups as a productive resource to capitalize on generating awareness for the Division and its needs in the community. They work diligently to help preserve park habitats, to raise funds, and to educate the community about park offerings.
COLLABORATIVE PARTNERSHIPS
The Division has been successful in developing and sustaining partnerships that benefit the community and increase visibility. The Division collaborates with other County divisions, neighboring counties, the school district, the city park systems, Nova Southeastern University, University of Florida/Institute of Food and Agricultural Sciences, and other programs to leverage and create opportunities to cross promote and to share resources. Stakeholders agree that existing partnerships must continue to be nurtured, while also seeking new opportunities for synergy.
While there are many opportunities to increase partnerships and sponsorships, stakeholders noted that the Division adequately made use of current collaborations:
Good intergovernmental relationships and cooperation
Good internal and external community partners
Law enforcement
Partnerships with Memorial Healthcare System, friends groups, Parks Foundation of Broward County, the Marine Advisory Committee, Equine-Assisted Therapies of South Florida, STEAM education, Urban Wilderness Advisory Board, and Parks Advisory Board
FACILITIES
The Division offers an array of recreation facilities with programming for children, youth, adults, and seniors. Users currently enjoy a variety of amenities at 51 parks across the County. Many see these facilities as an equitable and inclusive resource that reflects a sense of community for both internal and external users.
Stakeholders are generally supportive of facilities and offered the following comments about what makes the Division’s facilities distinctive:
Affordability
Best in state
Clean and well maintained
Diversity and quality of facilities
Safety and security
Well-staffed
Year-round accessibility
OPPORTUNITIES
A primary goal for the Division is to have a sustainable and accessible system of facilities with programs reflective of all it serves. Suggestions for opportunities to bolster the Parks and Recreation Division include infrastructure improvements, unique programming, and enhanced marketing, administration, and funding. Stakeholders shared a number of perspectives for the future of the Division. However, all stakeholders voiced concerns with the facilities and aging infrastructure of the system, and how to responsibly fund necessary improvements to enhance the overall experience for parkgoers.
INFRASTRUCTURE IMPROVEMENTS
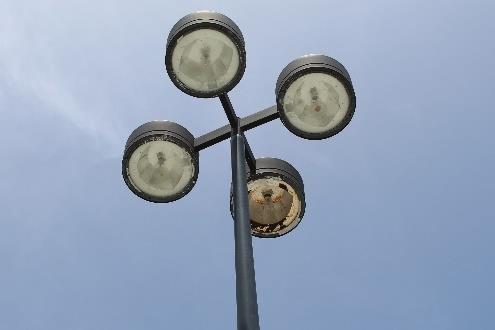
Infrastructure improvements, from paved roads and better lighting to renovated facilities and equipment, were constant themes throughout discussions. Stakeholders would like more indoor sports fields/courts, aquatics, adventure amenities, biking, event space, and parks/facilities that accommodate the growing population of the County.
As provided by stakeholders, recommendations to improve and maintain existing recreation facilities include:
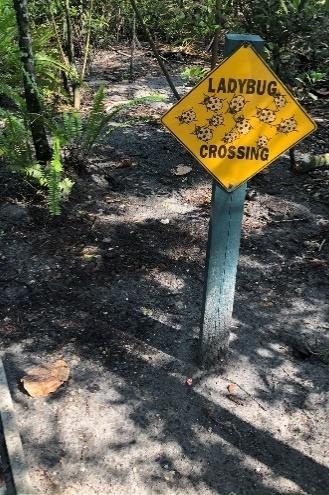
Add signage in parks identifying flora, fauna, native species
Add additional water amenities such as splash pads and aquatics areas throughout the County
Address current aging facilities, equipment, and infrastructure
Continue to prepare for climate resiliency
Connect countywide trail plan to master plan
Create pedestrian and bicycle access to parks
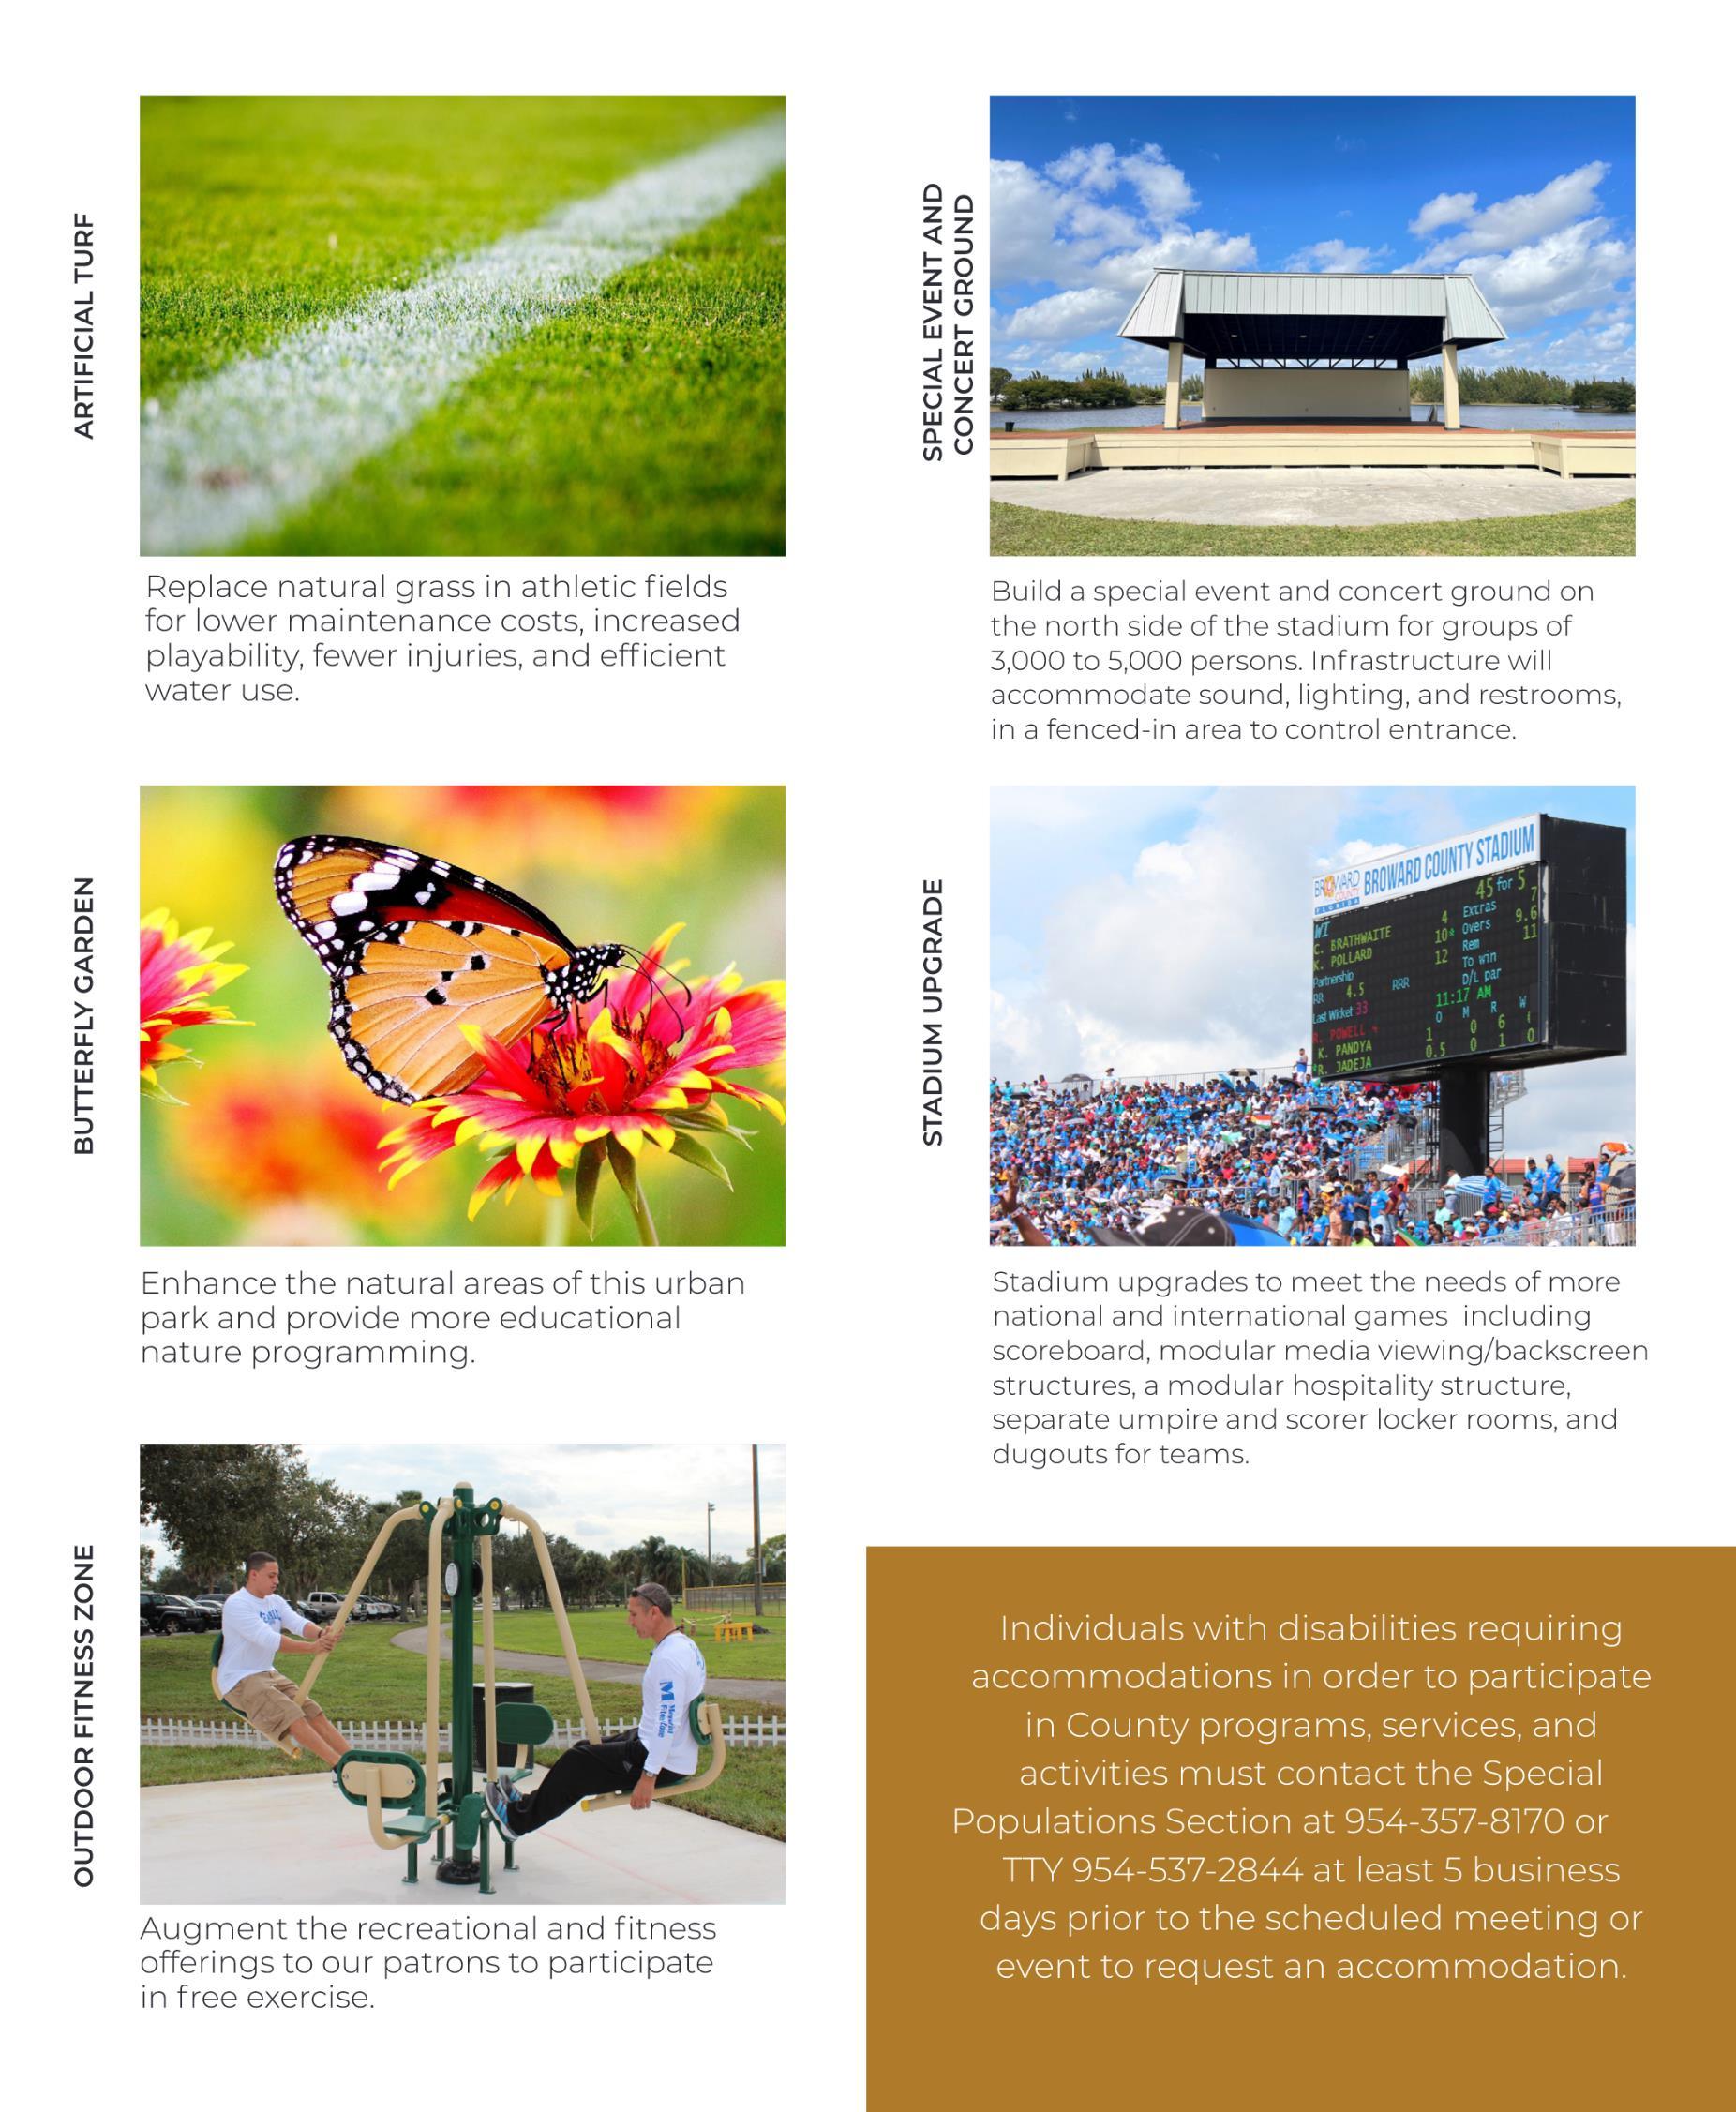
Enhance sports fields with artificial turf and LED lighting
Establish more Americans with Disabilities Act (ADA) access to all park facilities and amenities
Establish more dog parks, especially in southeast area of the County
Identify solutions to address the issues associated with homelessness at park facilities
Improve connectivity between parks and communities with trails, greenways, walkways, etc
Improve traffic congestion at large parks and coordinate transit access
Improve Wi-Fi connectivity throughout the park/campground areas
Introduce energy efficiencies in park facilities through use of solar panels
Invest in maintenance/removal of exotic plants and animal species
Need for indoor facilities, fields, and courts to drive youth sports and sports tourism
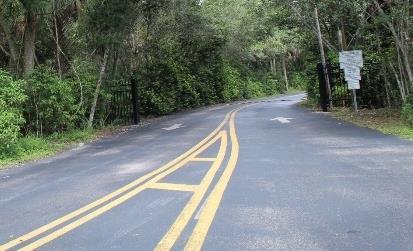
Pave roads, pathways, and bike trails
Perform wetland mitigation at park properties
Provide better connectivity of whiteways (walking corridors with lighting and gardens), greenways (multiuse corridors with vegetation or trees), and blueways (water trails/routes)
Upgrade playgrounds, dog parks, aquatic areas, and campgrounds
PROGRAMS AND SERVICES
Although unique programming and activities were consistently identified as a strength of the County, many stakeholders believe opportunities exist in the growth of trending recreation programs. Many believe new ideas can focus on nontraditional opportunities for teens and senior populations to better attract, engage, and serve these segments in new ways. There was a call for more educational programs focused on the naturalist enthusiast, e-sports, branded special events, and tailored programs for specific needs in various parts of the County. The Division should also expand their Special Populations Section to develop additional offerings and provide adequate inclusive programs for their participants.
Suggestions to enhance and improve the Division’s offerings included:
Accommodate for increase in population, especially preschool and school-age children
Astro tourism at the Fox Observatory in Markham Park
Develop and implement health, mental, and physical wellness programs across all ability levels and age groups
Consider neighborhood parks to house more social service programs
Create more branded special events
Create a variety of offerings for residents, more than traditional park amenities
Develop a dedicated e-sports space
Develop curriculum for scouting badges
Expand SWIM Central to other models, i.e., Teen Central
Extend marketing outreach through both longand short-form video series
Host nature camps at nature centers
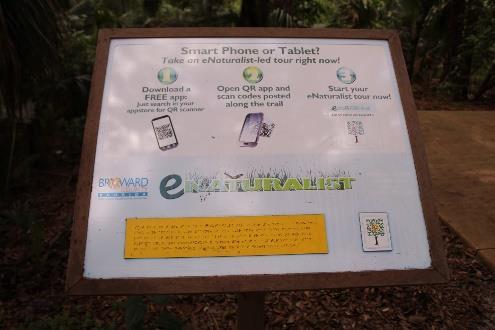
Include technology in programming and throughout park areas – QR codes, scavenger hunts, mobile gaming, geocaching
Increase senior activities
Increase organized teen, young adult, and young professional activities
Increase sports programs
Increase services designed to benefit community, i.e., out-of-school-time programs, computer lab learning
Indoor facilities such as gyms and courts
Partner with Transit to offer discounted rides to parks
Residents in the Municipal Services District require more services and believe the level of services is inferior to that of regional parks
MARKETING
The County currently advertises internally through Port Everglades, VISIT Lauderdale, Libraries, and Cultural, as well as additional external digital and print publications. However, the general consensus among stakeholders is that the Division needs to improve its outreach and awareness campaigns. These campaigns are intended to tell the story of the Division and its efforts to provide consistent access to services. Many attendees value the system and want others to be aware of and support the Division’s efforts. Several offered the following ideas to increase visibility of the Division’s parks and facilities resources through a strategic marketing and public relations effort:
Create behind-the-scenes video documentary on park maintenance
Educate elected officials and leadership on the needs of nature centers
Expand marketing outreach to diverse communities, especially those with neighborhood parks
Increase focus on social media outreach, including new media such as TikTok to link social media accounts with other city and County divisions to share park content
More outreach to non-English-speaking populations with multilingual communications and signage
Simplified process for marketing and promotions
Stand-alone public relations effort, without adhering to restrictive oversight and regulations
Stronger tie-in and co-branding with tourism/VISIT Lauderdale marketing efforts
User-friendly website with updated features including park maps, virtual tours, etc.
Work more closely with County’s Office of Public Communications to have a better understanding of the needs of the Division and its users to improve marketing and outreach
FUNDING
Interviews with Division administration focused on investing in a sound strategic and fiscal plan to address staffing, training, employee retention, and more efficient operations. Limited funding is an issue that will continue to present a challenge for the Division. Stakeholders agree that ongoing financial sustainability is paramount, and many are interested in what dedicated funding resources are available, i.e., bonds, grants, private funding. This funding could help offset the cost of infrastructure needs, further development of the system, and additional programming opportunities.
The most common funding concerns and opportunities identified by stakeholders were:
Access to additional funding for the Municipal Services District
Consider public/private partnership land development and acquisition
Equitable fee structures applicable to all facilities and programs
Explore capital funding and bond issue
Explore opportunities to become fiscally sustainable, i.e., capital improvement programs, bond issues, GO Bonds
Financial aid, grants, sponsorships, and bonds for more youth programming
Identify more efficient operating procedures
Evaluate impact fees and consider increasing
Implement direct impact fees to build capital and maintenance funds for fee-supported offerings
Review budget allocation process with the County
Revisit economies of scale with increase of PCard spending limits
Streamline purchasing processes
OPERATIONS
The Division’s executive team and staff are highly praised for their efforts to maximize opportunities in the midst of funding shortfalls, for their commitment to collaboration with fellow parks staff, and for their dedication to providing exemplary customer service.
Many concerns centered around additional staff support, streamlining processes for more efficiency, and implementing policies that will ensure success at every level:
Add dedicated staff for Public Communications and social media, IT, Maintenance, Tree Crew, Grant Writer, Data & Analytics, GIS, Volunteer Coordinator
Allocate staff more efficiently to understaffed parks; seasonal rotations of staff
Database management training
Employee incentive program
Expand successful pilot programs such as appbased scheduling of staff throughout the Division
Fully fund part-time (19 hours per week) positions across the agency
Increase funding for employee training and development
Increase management and supervisory staff at some parks
Organize and update policies & procedures
Promote cross-training, the Parks Futures development program, and a mentoring program
TOP PRIORITY
Stakeholders shared many priorities to enhance the Division’s parks and recreation system. The future of the Division is contingent upon identifying a funding source(s) to address shortcomings related to aging infrastructure, staffing operations, improved visibility, and unique programming. This initial phase of the Master Plan process helps clearly identify the recreational needs of the community and the desire to work collaboratively to create a world-class parks and recreation system.
Top priorities for the Division that were most frequently mentioned include:
Improve existing facilities, infrastructure, and equipment
Consistent capital improvements program and dedicated funding source
Explore all available funding sources
Increase marketing to communicate parks’ unique offerings and increase visibility
Increase outreach to garner more international visitors
Focus on innovative programming for diverse segments of users
Improve collaboration with other County agencies and city park systems to expand programming and activities for users, such as the Libraries Division, Cultural Division, Transit, VISIT Lauderdale, and the 31 municipalities
Continued intergovernmental support
Partner with schools, libraries for shared use of facilities/co-programming
Create more public transportation access, network of non-automotive (multimodal) connections regionally
Better use of data to plan programming and activities
Develop emergency management/security budget
Streamline purchasing process, policy, and procedures
Provide recreational opportunities and facilities meet the needs of every phase of a patron’s life
More outdoor offerings, including those amenities/programs that currently exist as well as new amenities/programs based on recreational trends as identified by SFIA (Appendix B) and by the PIR (Chapter 7.1)
Well-defined master plans for each facility
Division should serve as a best practices model for other park systems
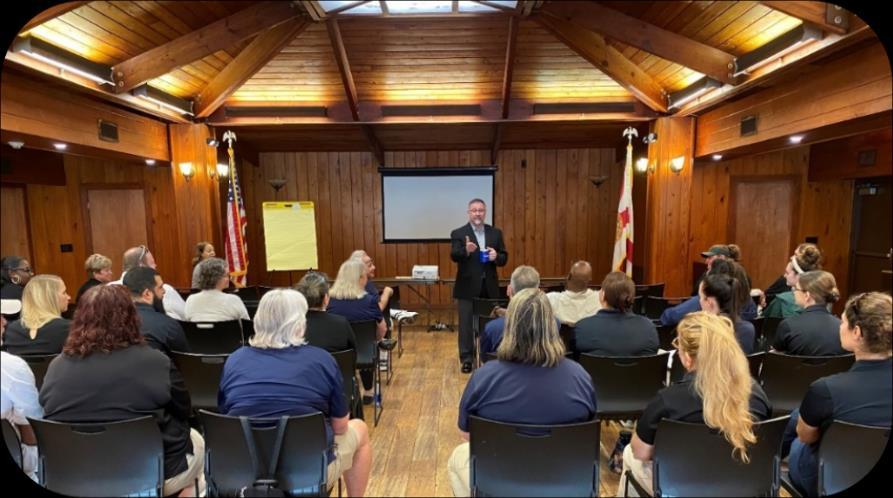
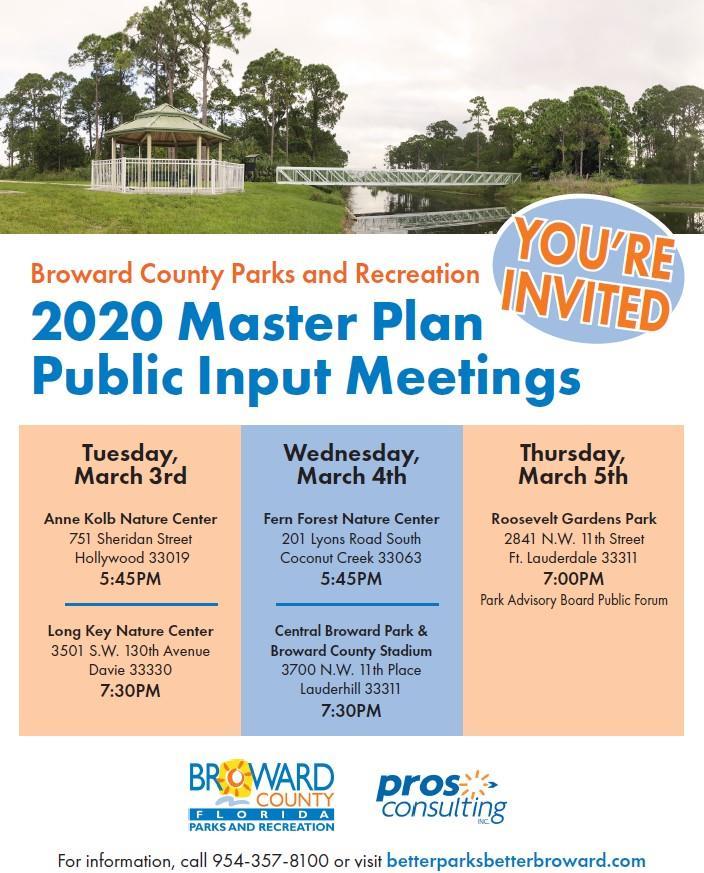
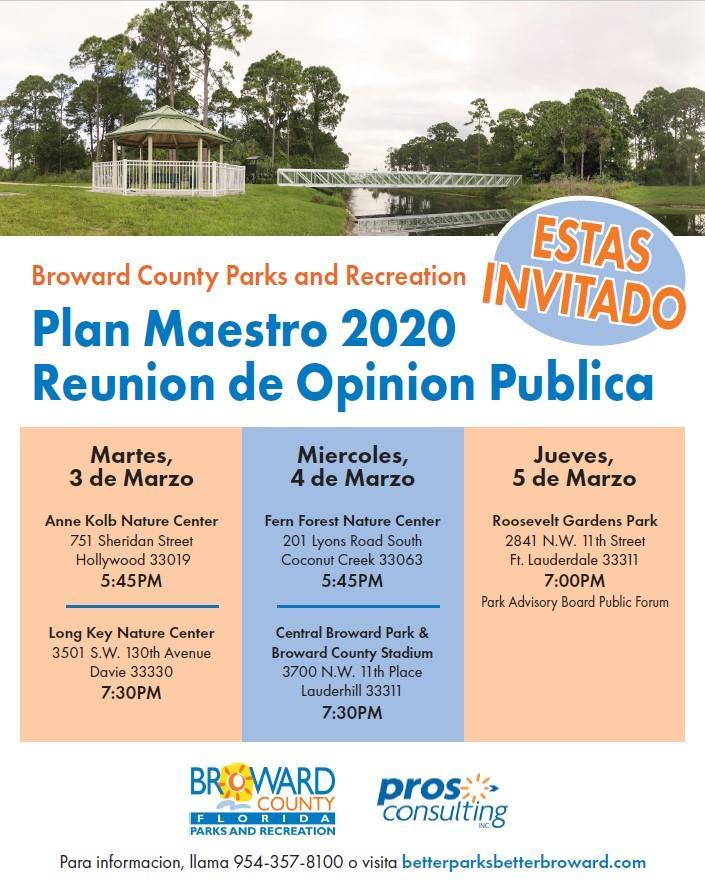
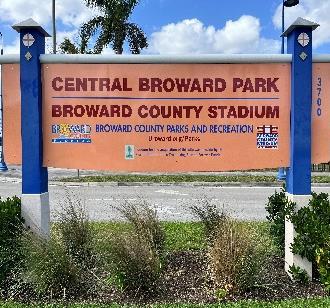
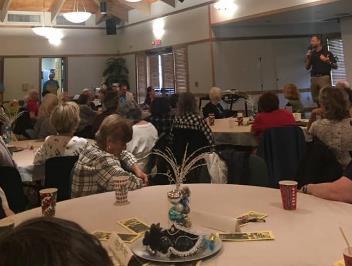
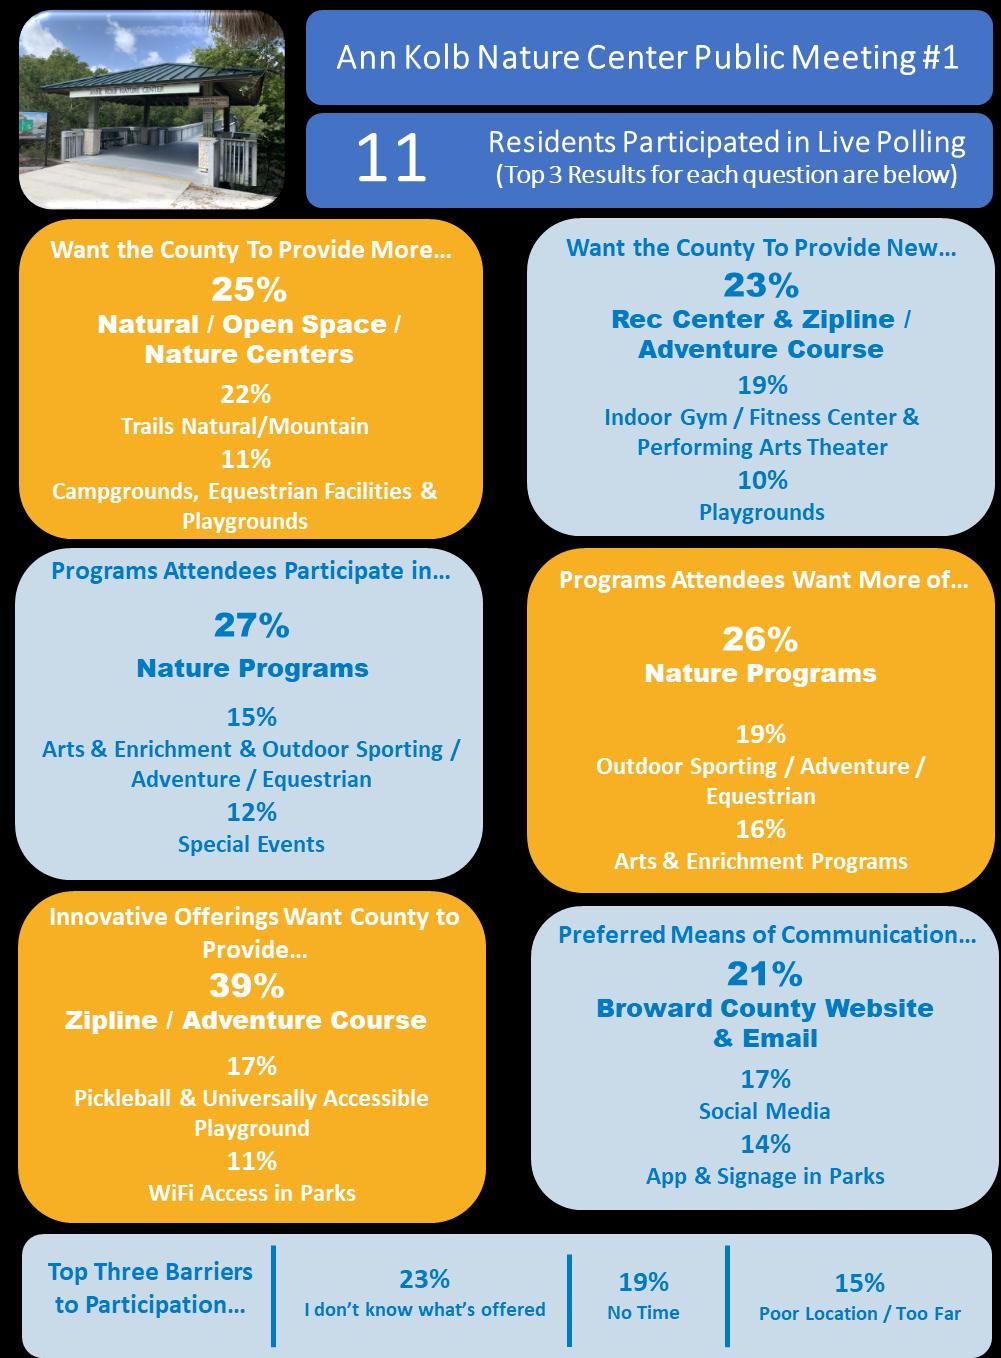
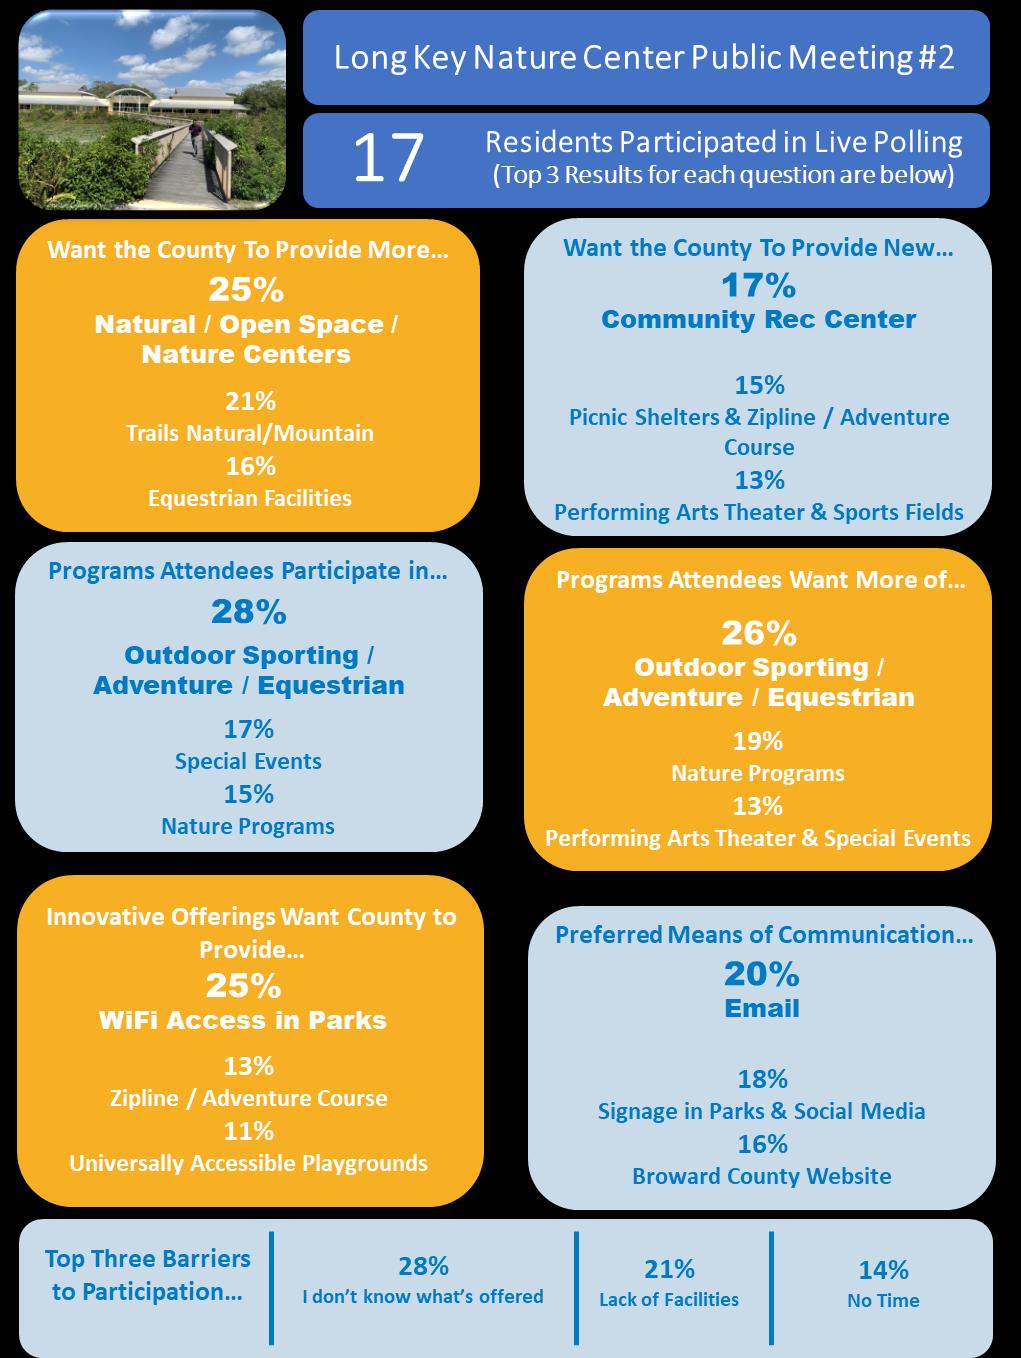
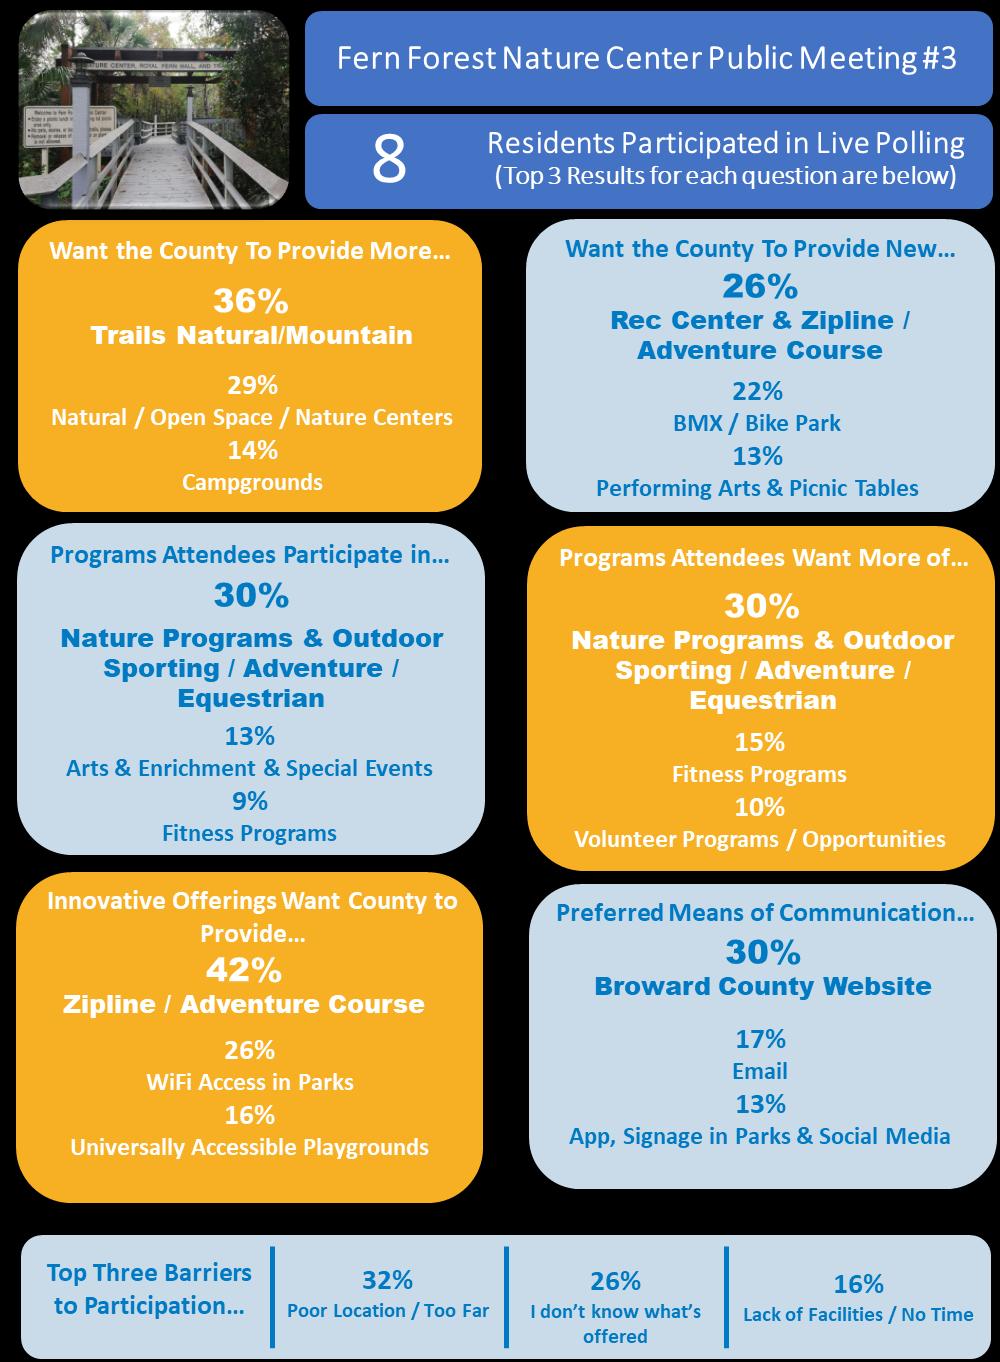
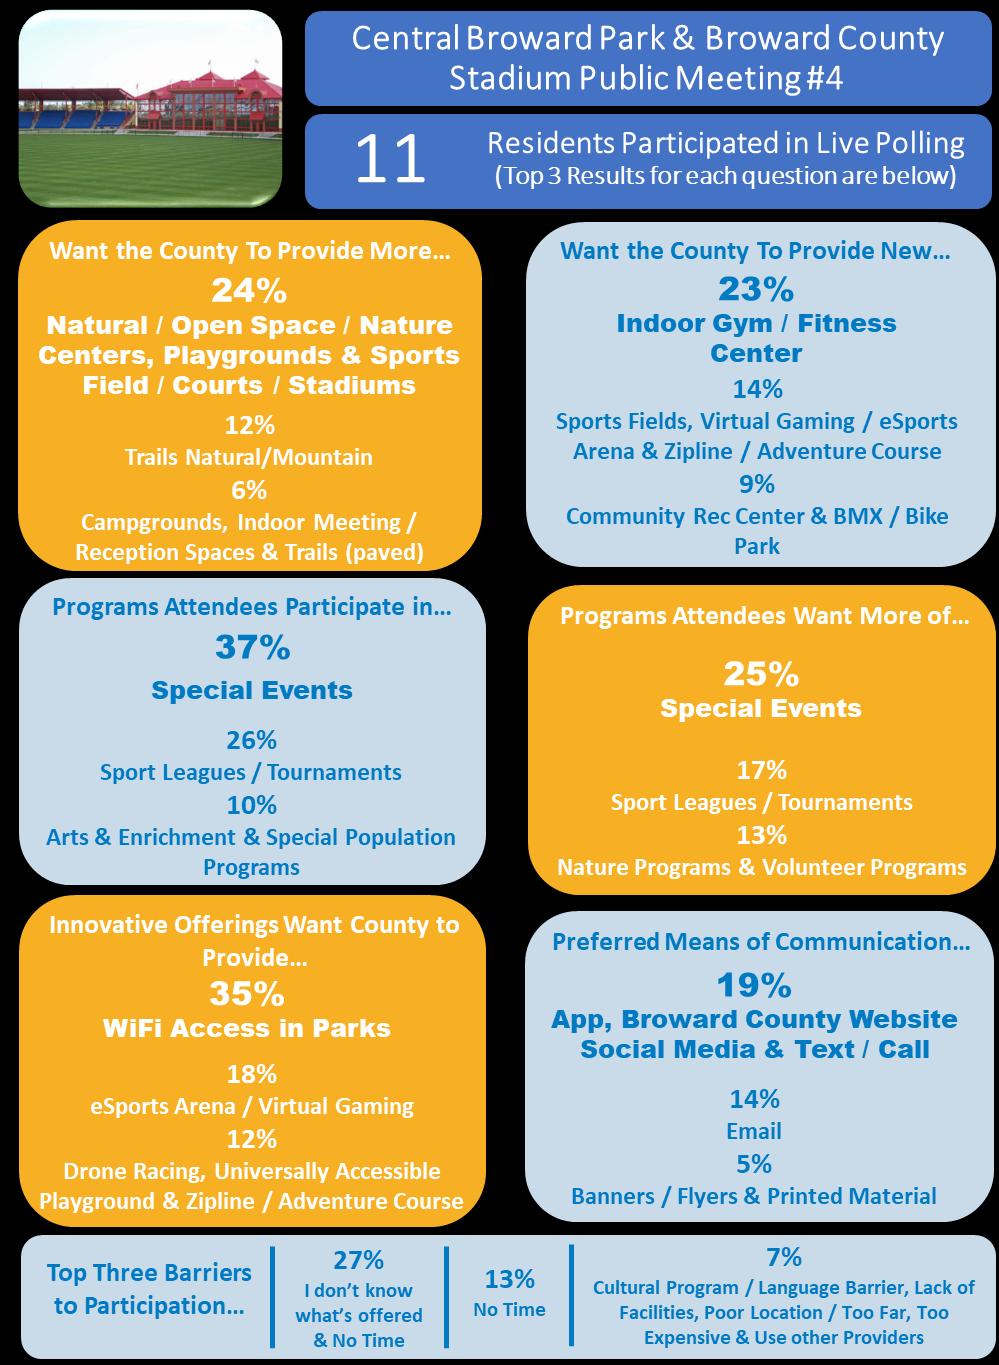
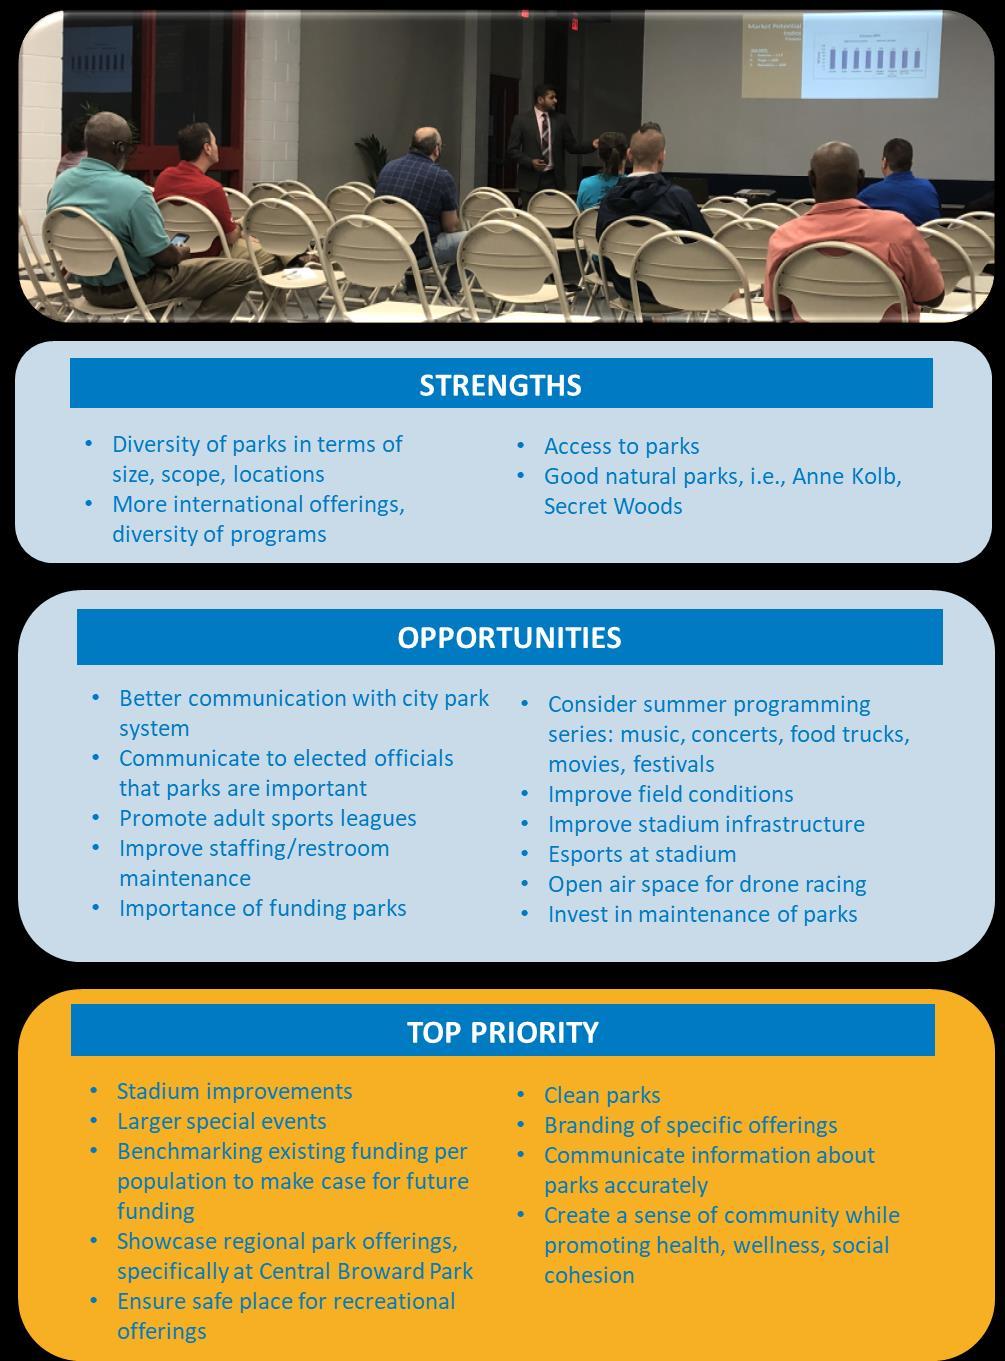
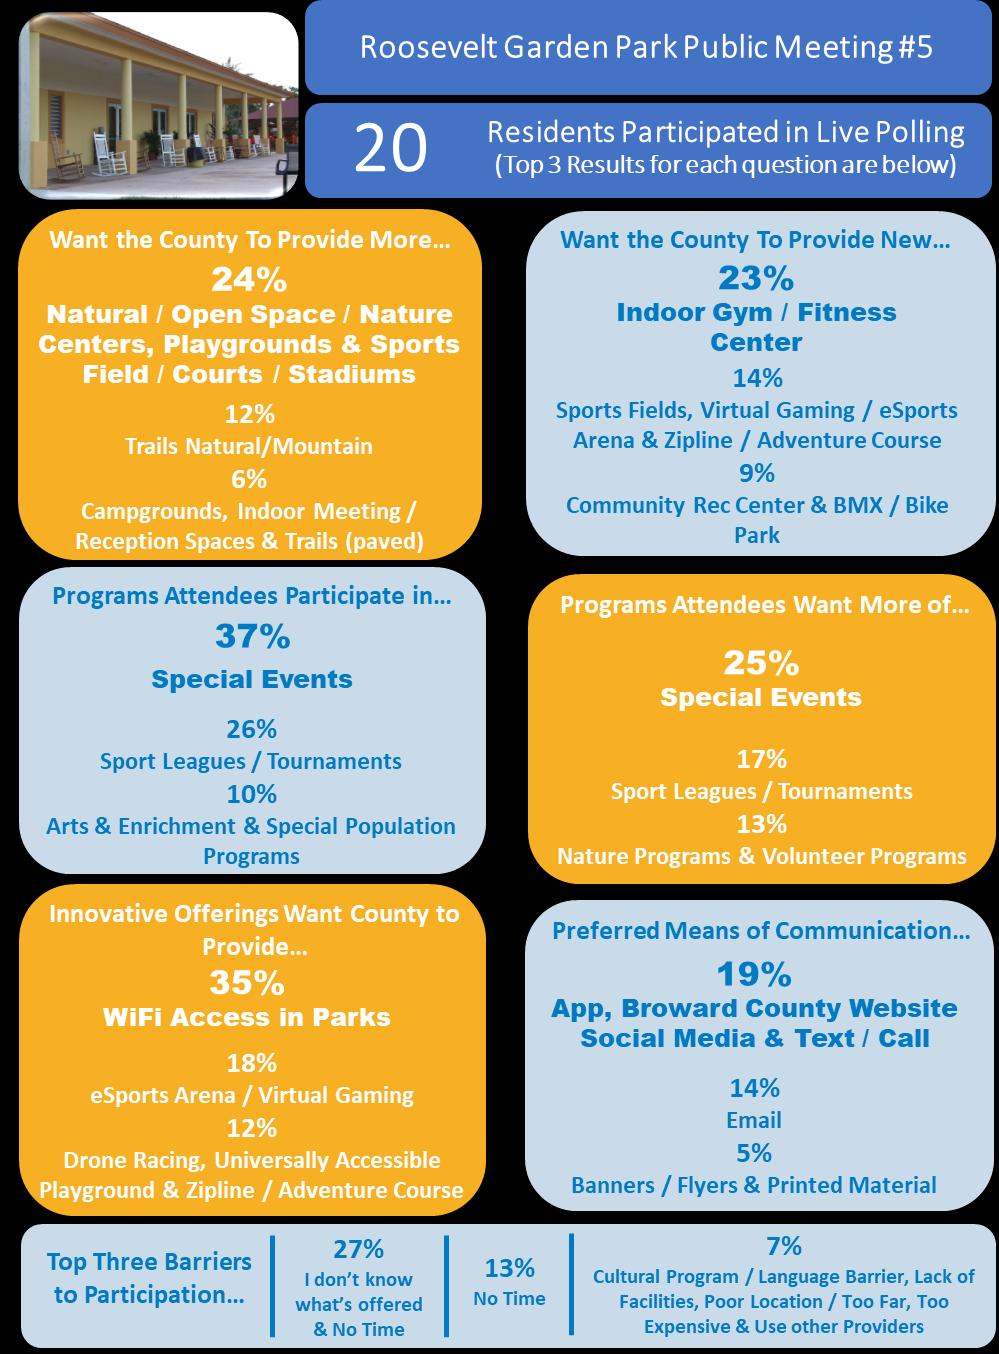
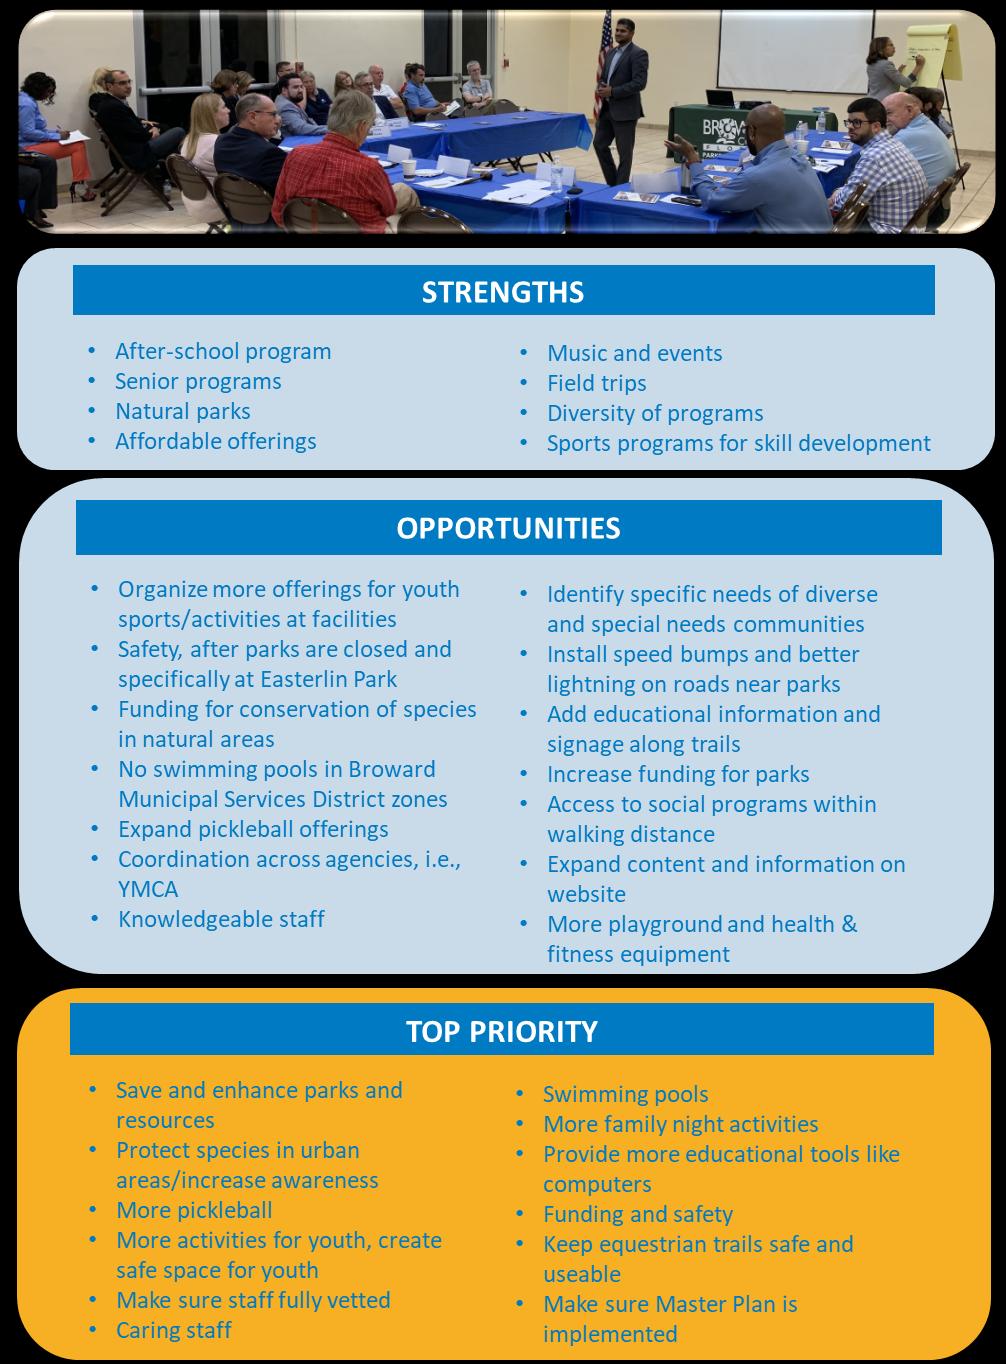
In tandem with the stakeholder and focus group interviews, the consulting team also hosted five public input meetings designed to further engage residents of the County. The public input meetings spanned three days and provided attendees with a presentation of the project, process, initial demographic findings, as well as an opportunity for residents to offer feedback on the parks system through live polling devices. The meetings were held at various Division parks and facilities across the County:
Anne Kolb Nature Center at West Lake Park
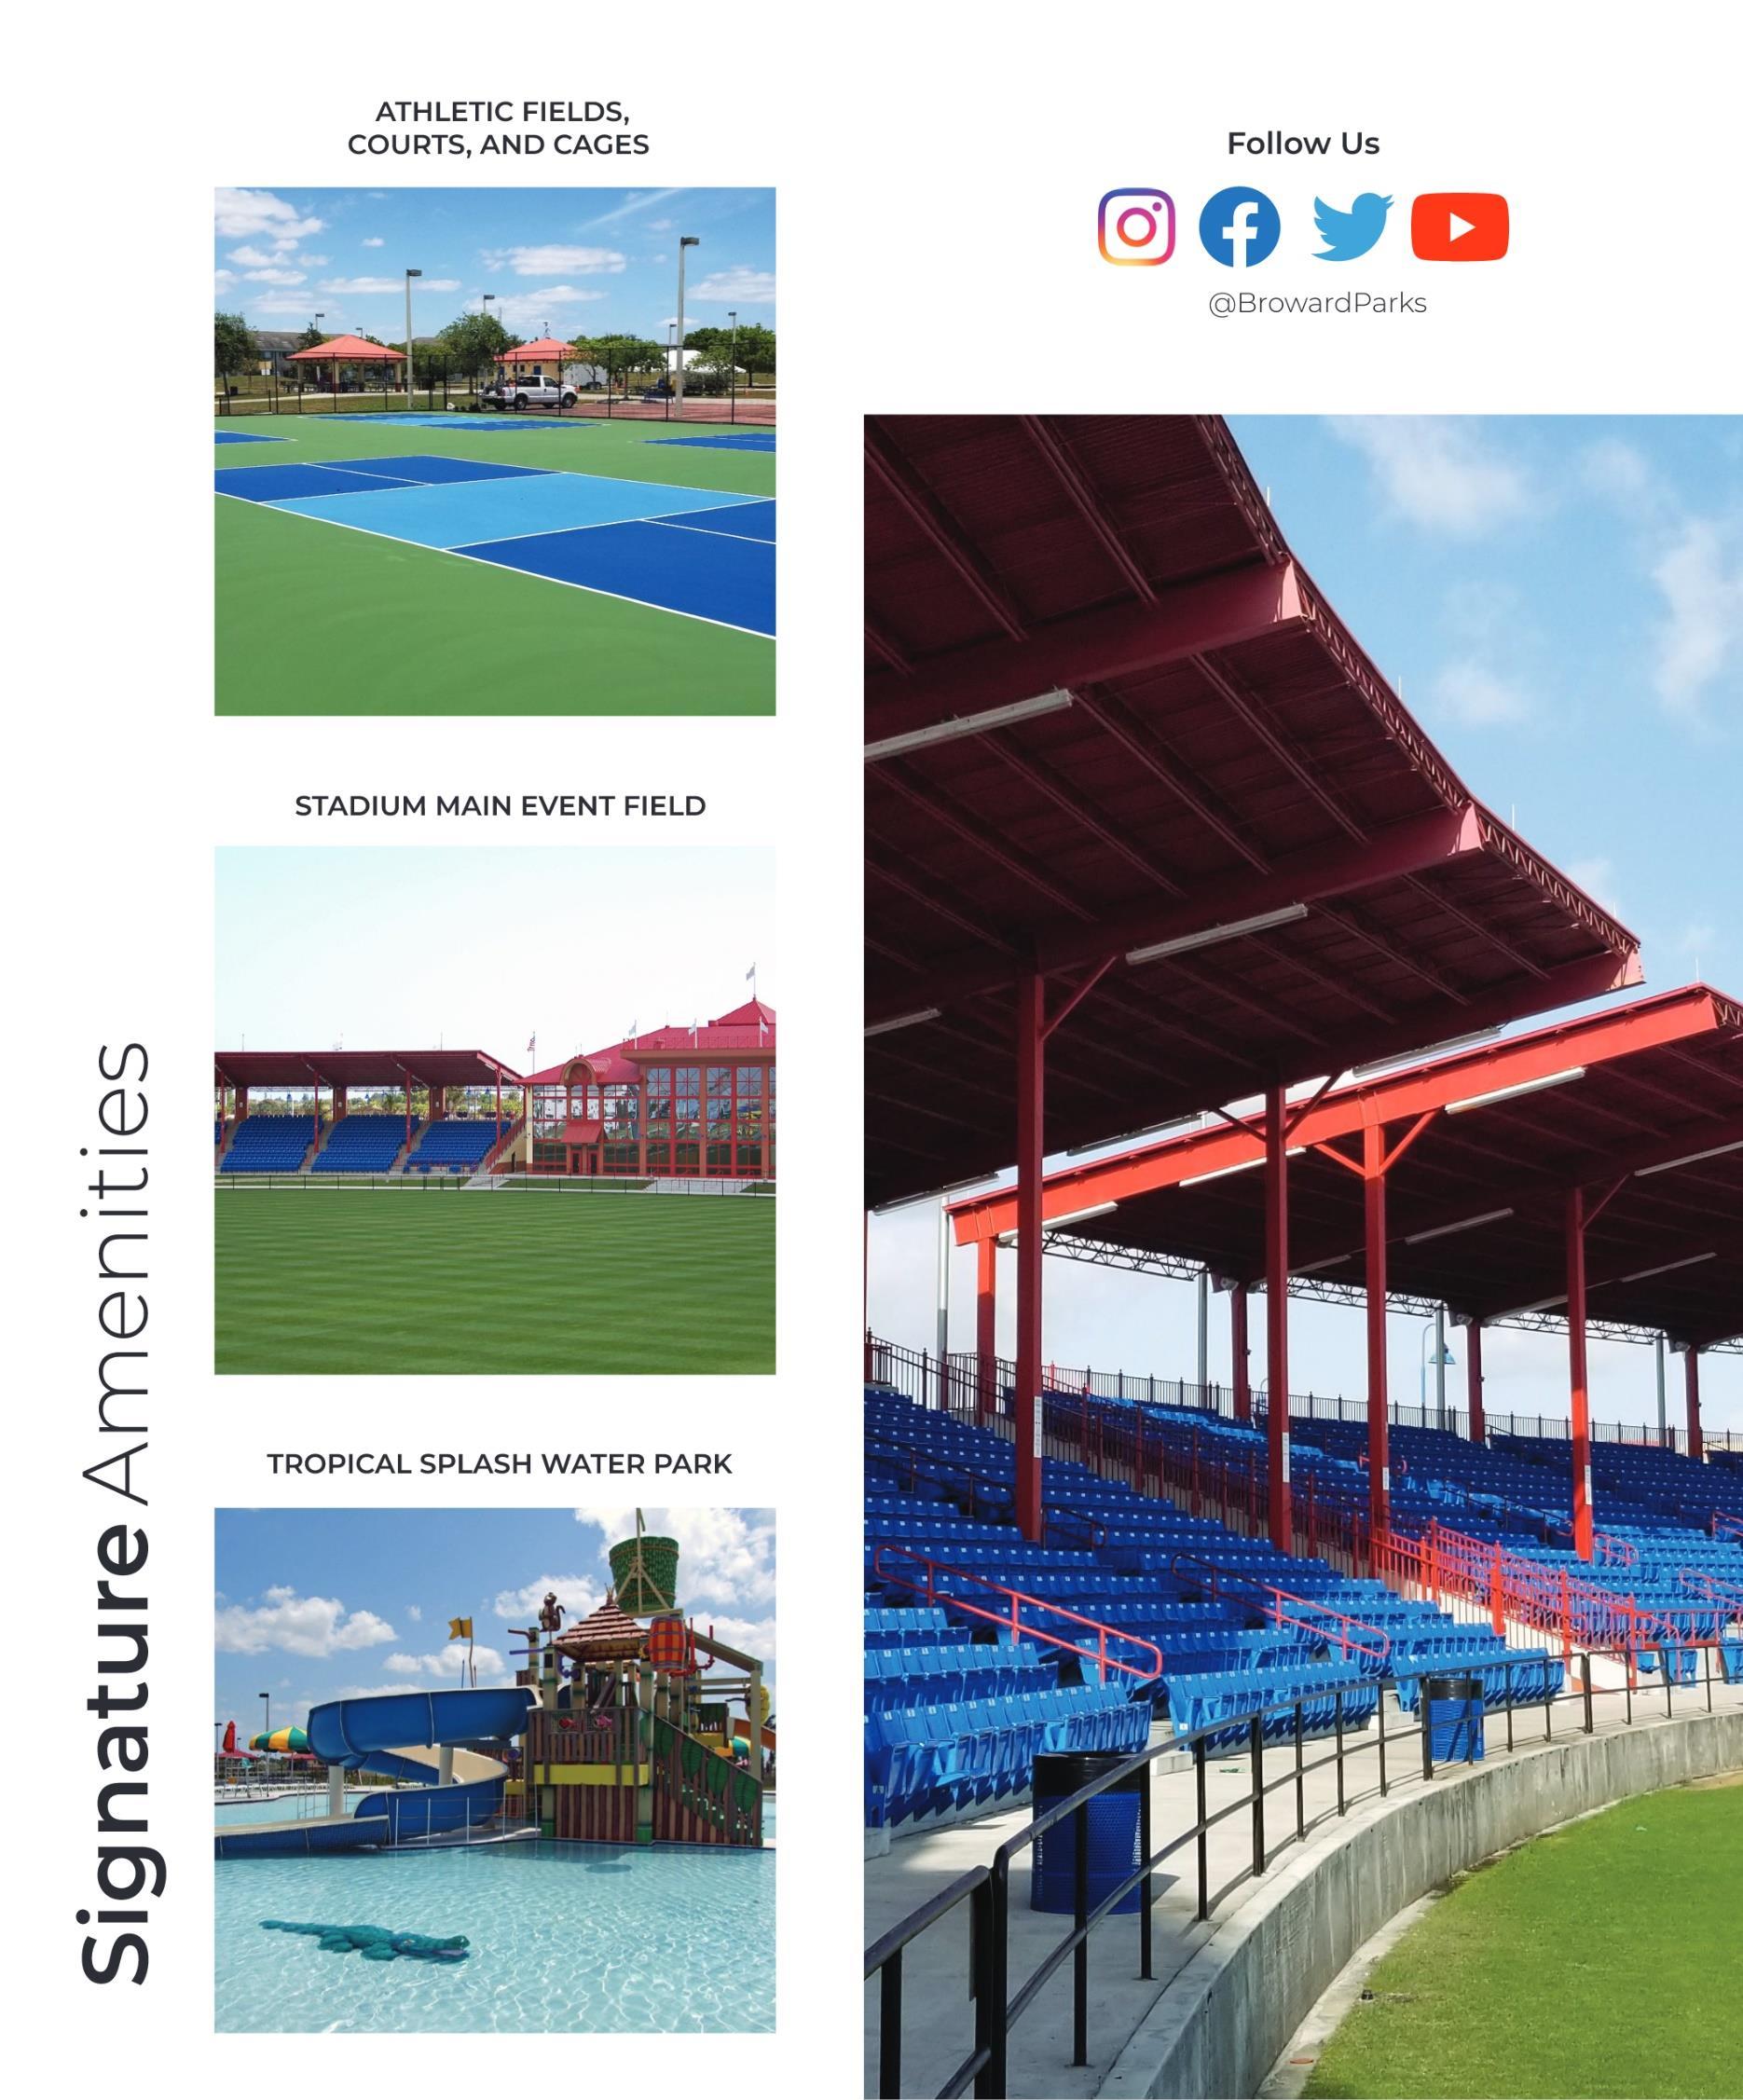
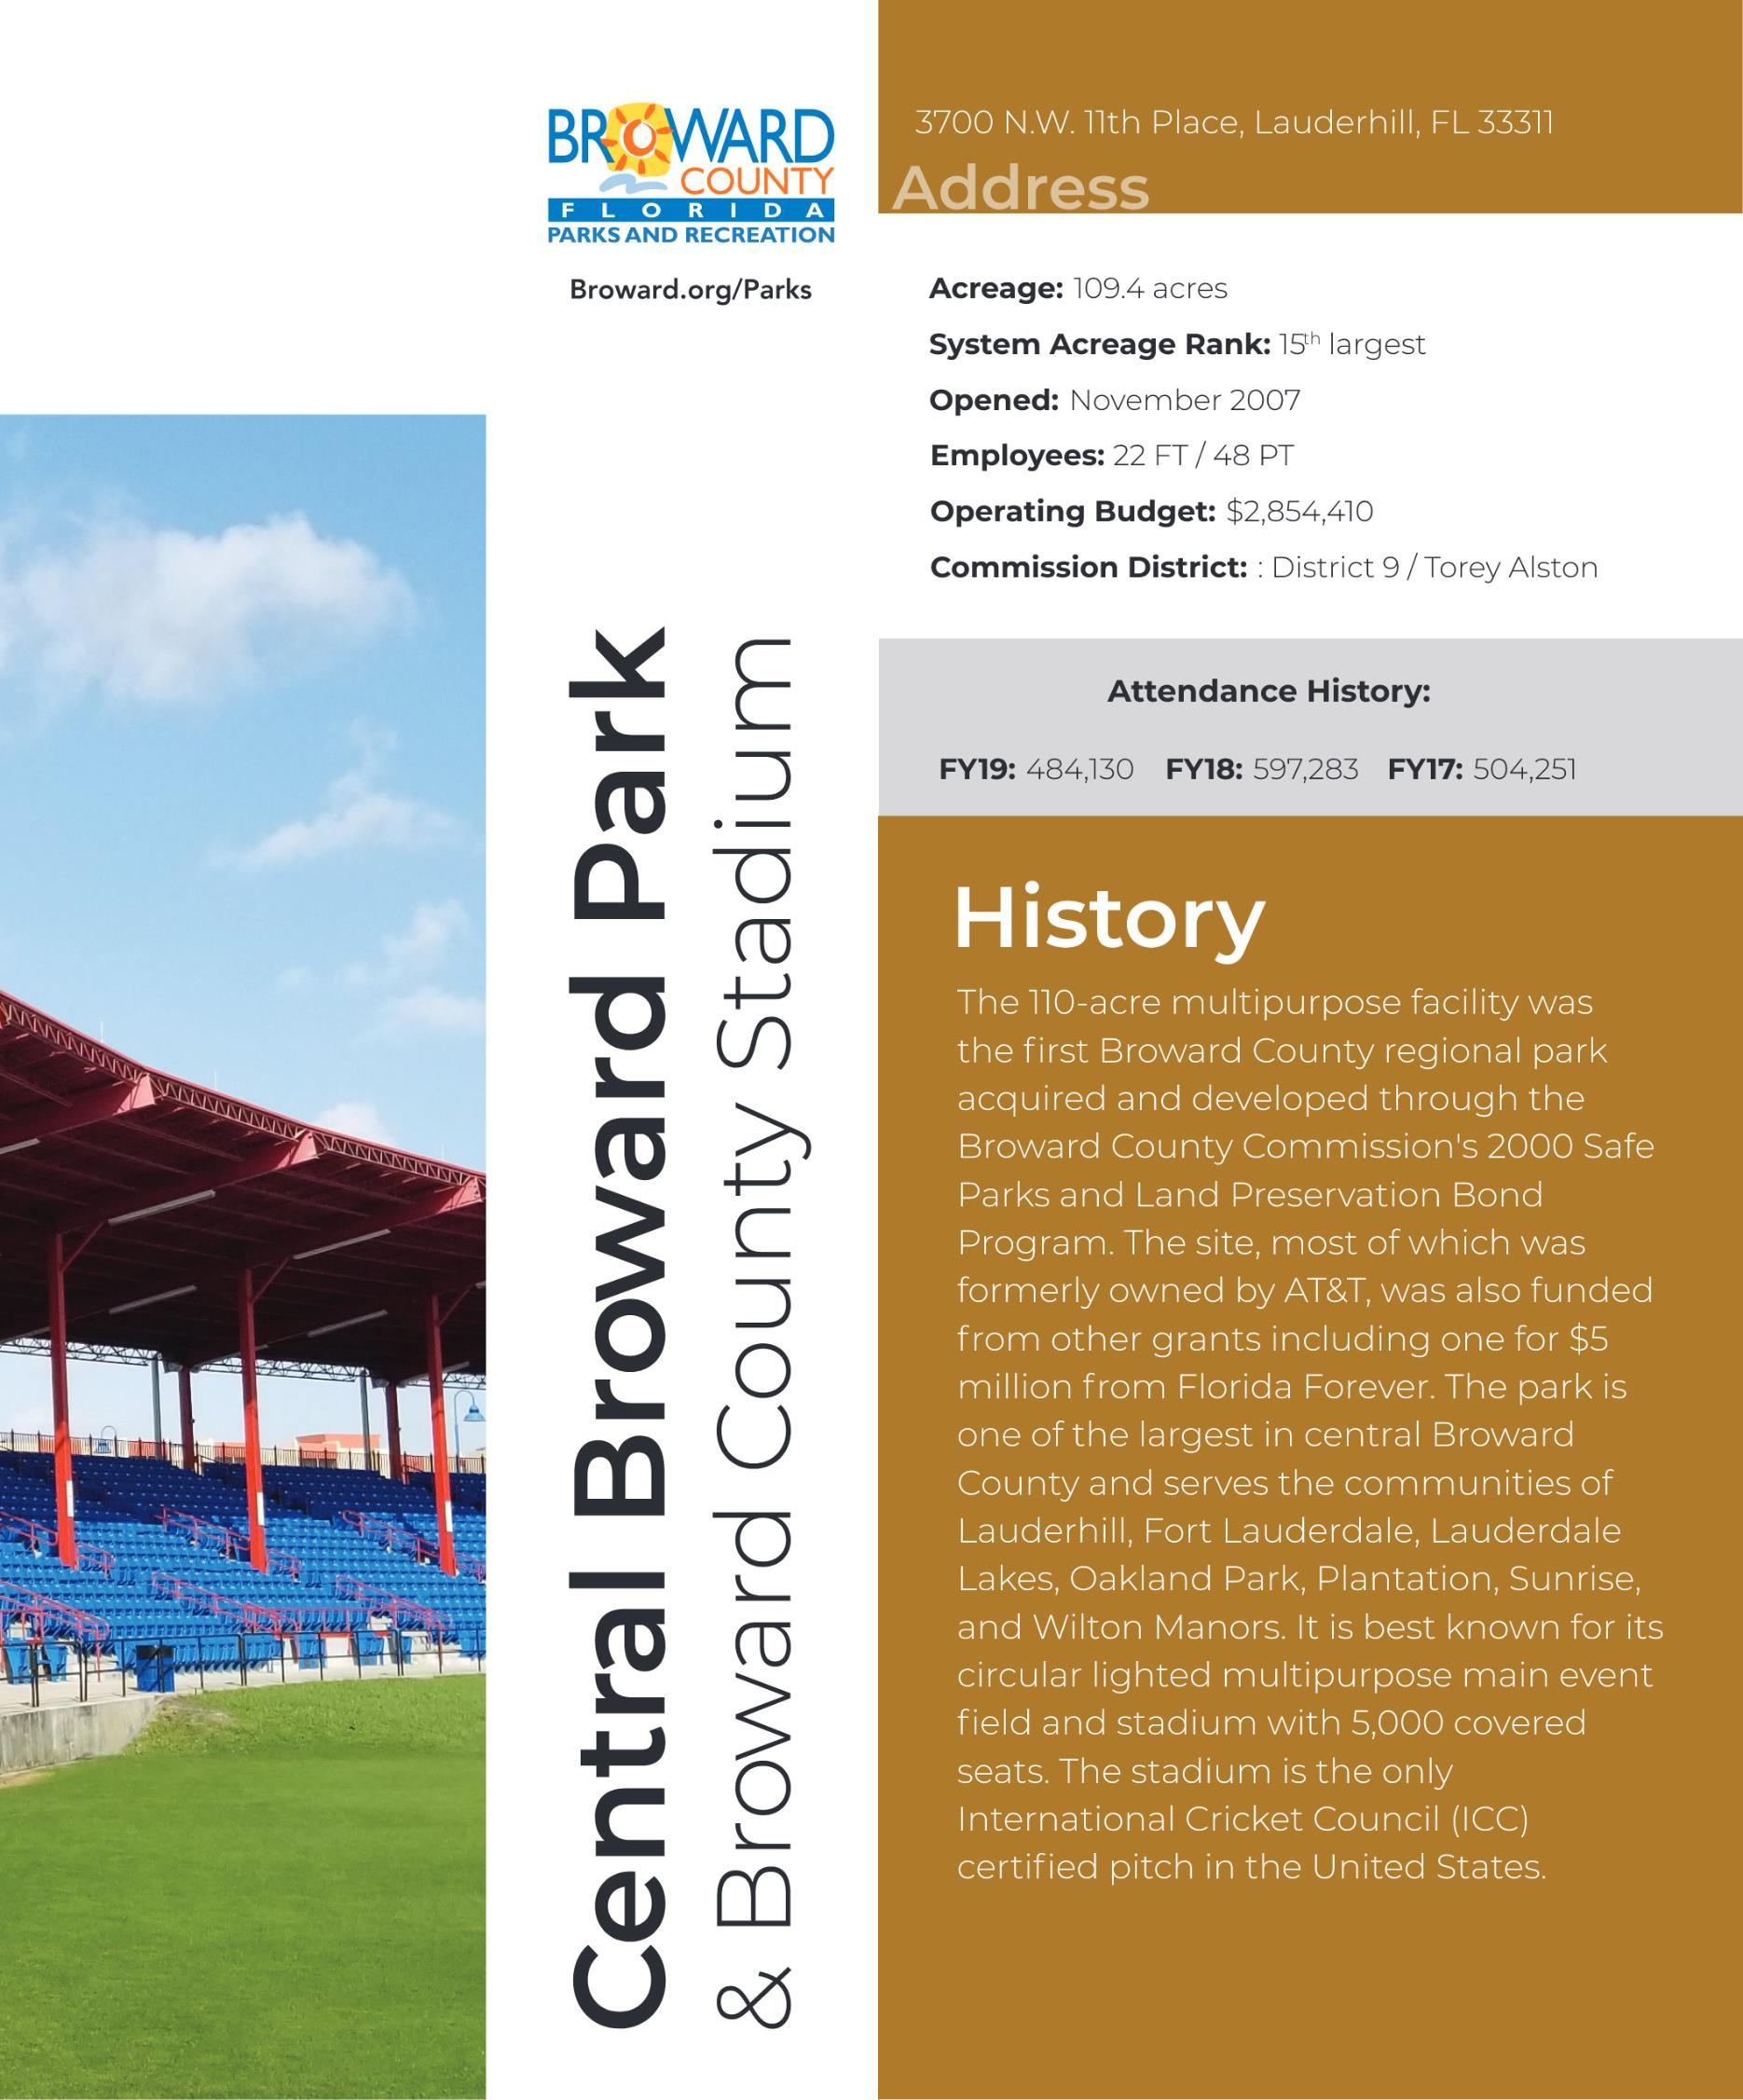
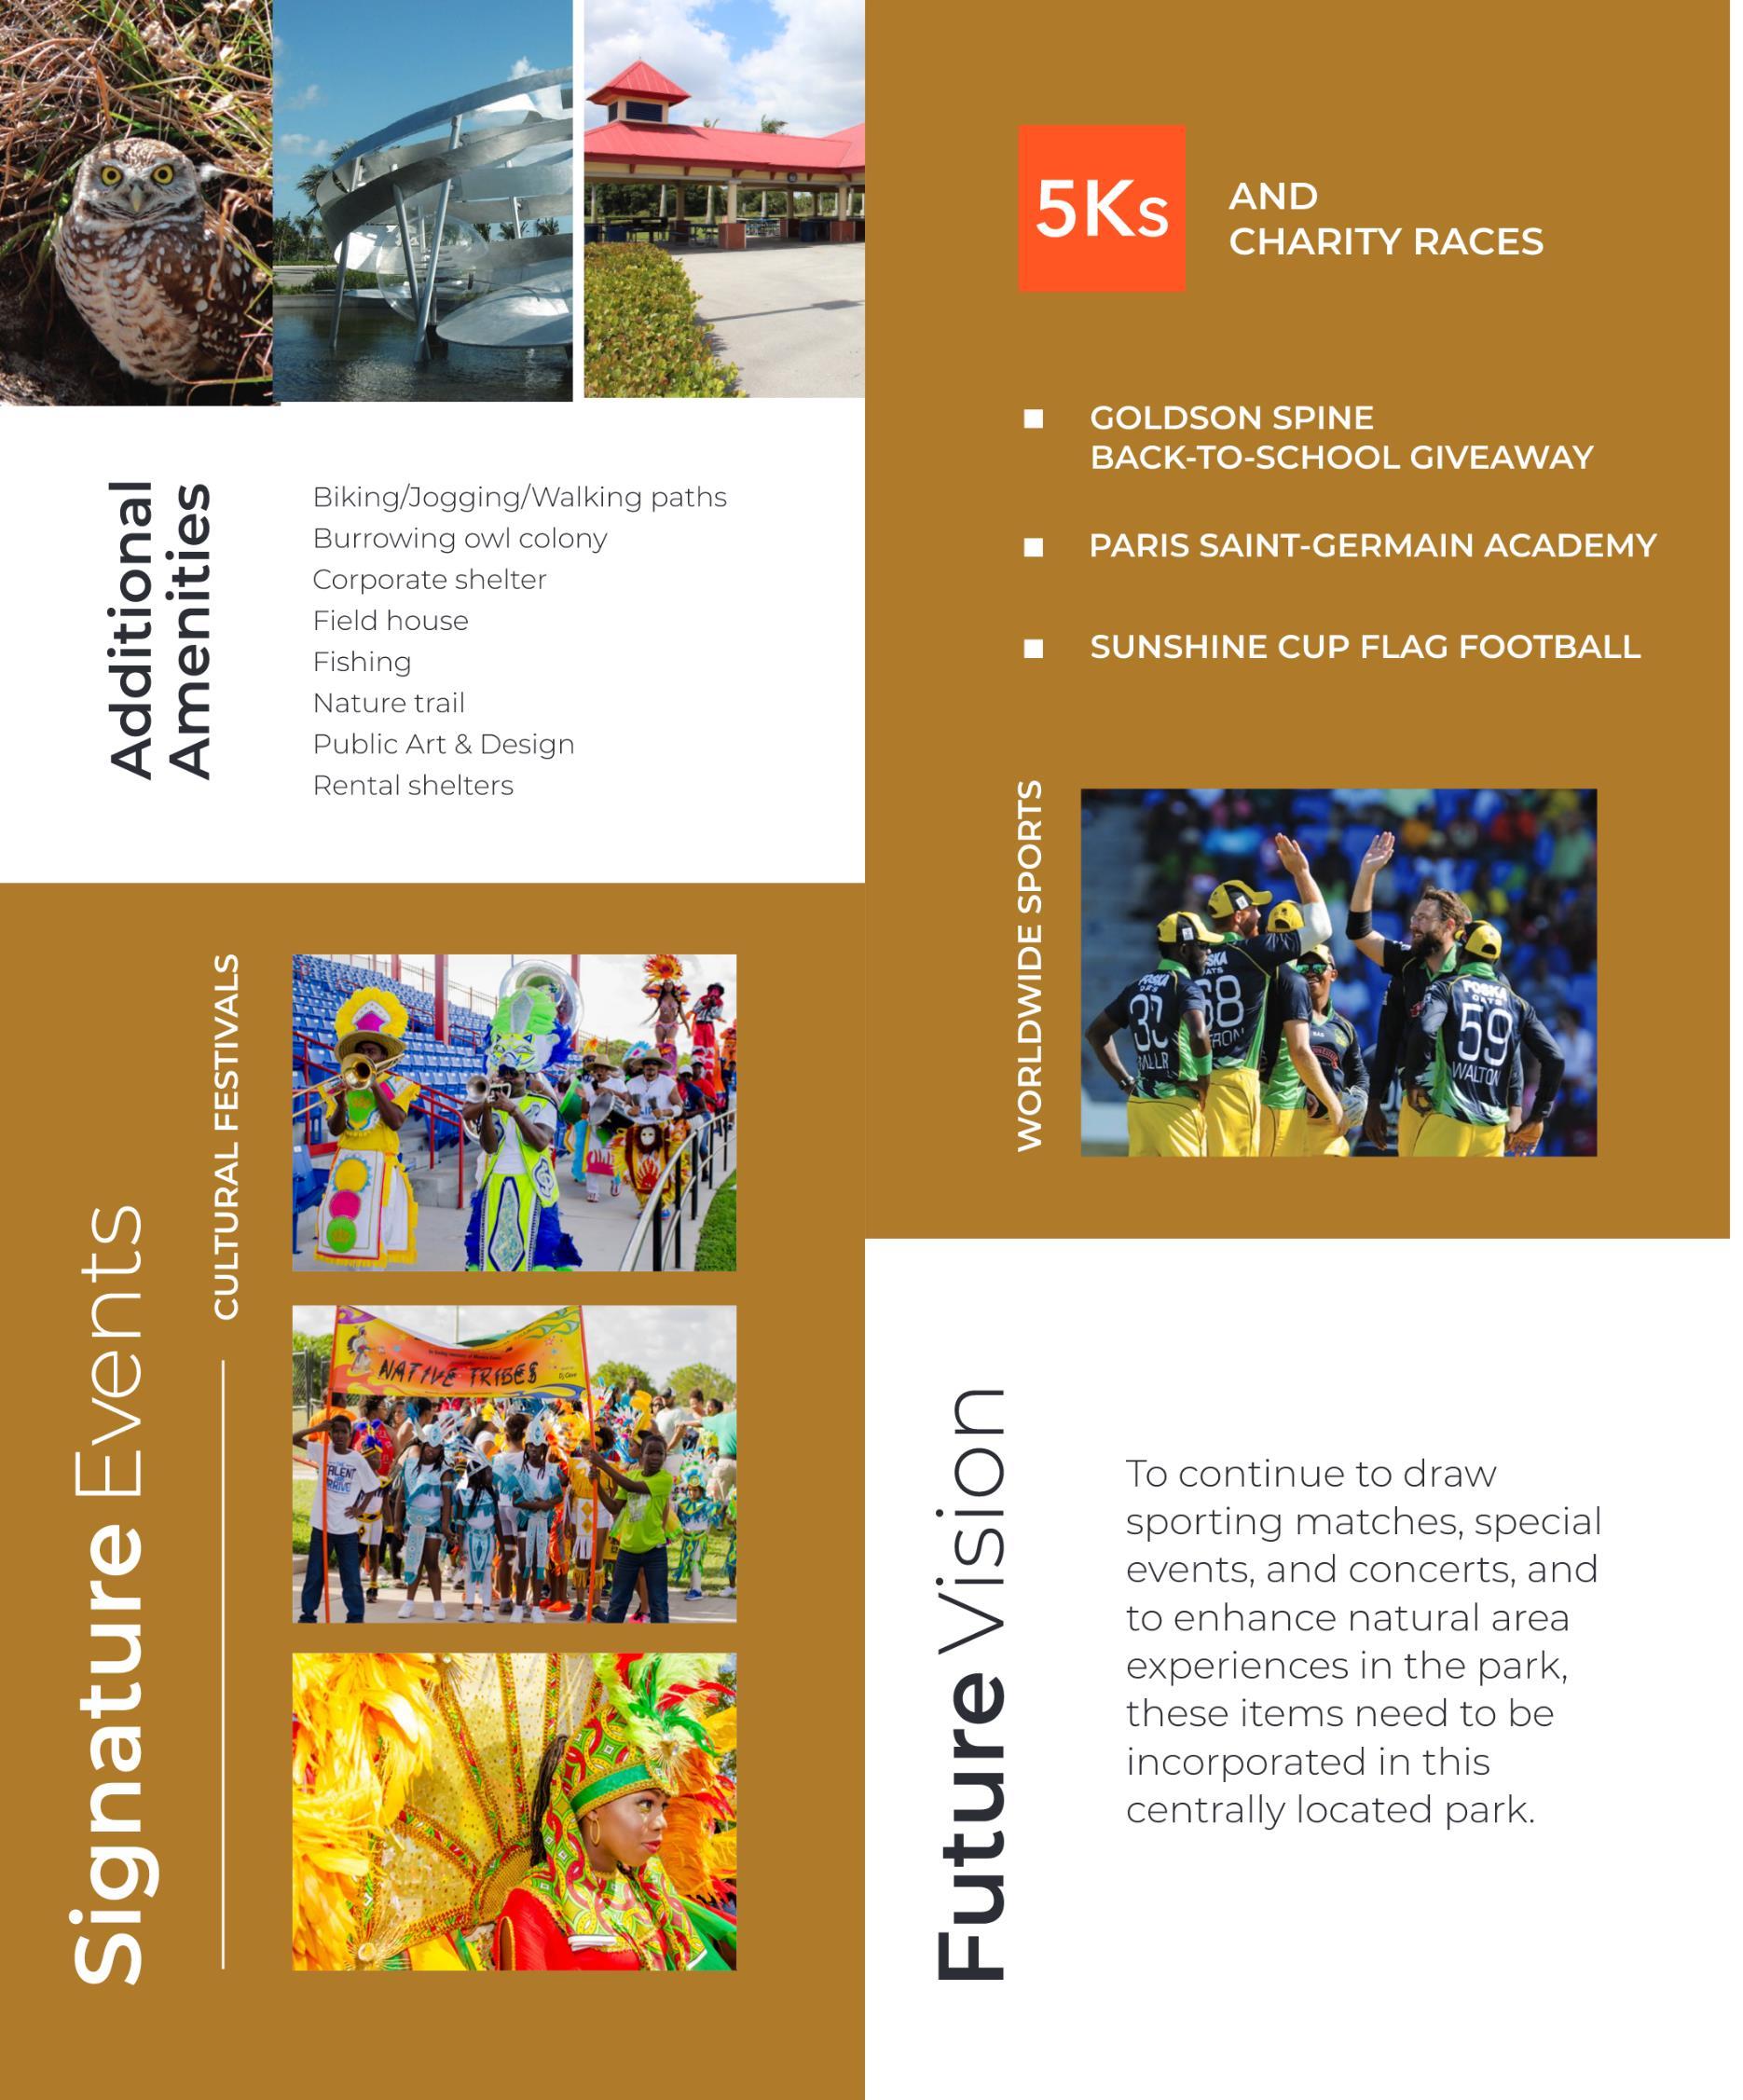
Central Broward Park & Broward County Stadium
Fern Forest Nature Center
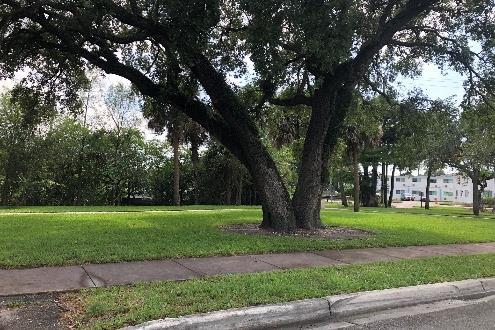
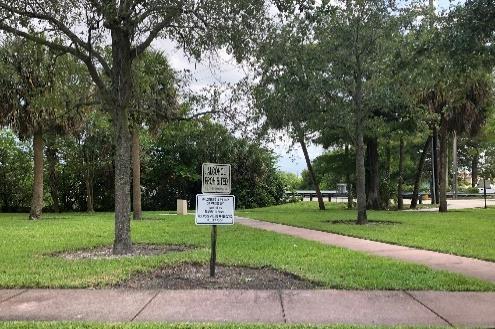
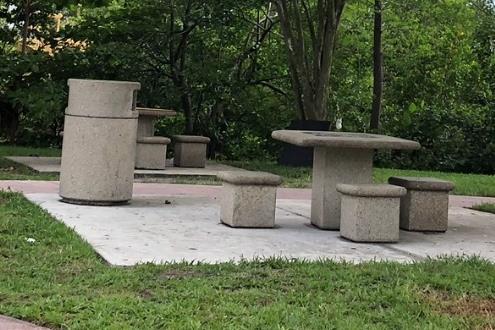
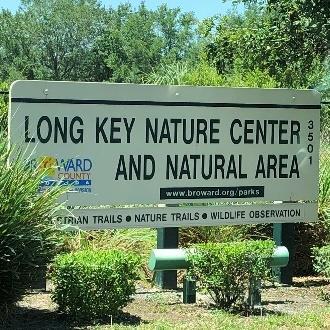
Long Key Natural Area & Nature Center
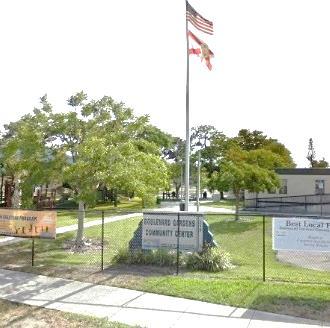
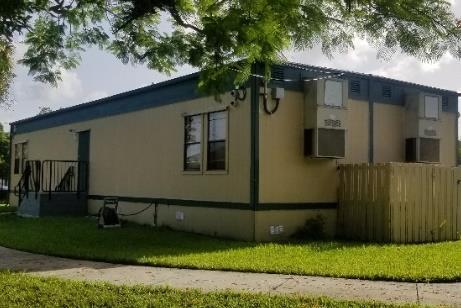
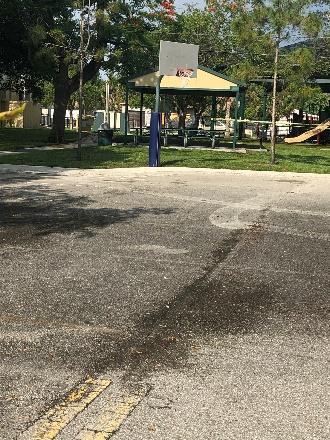
Roosevelt Gardens Park
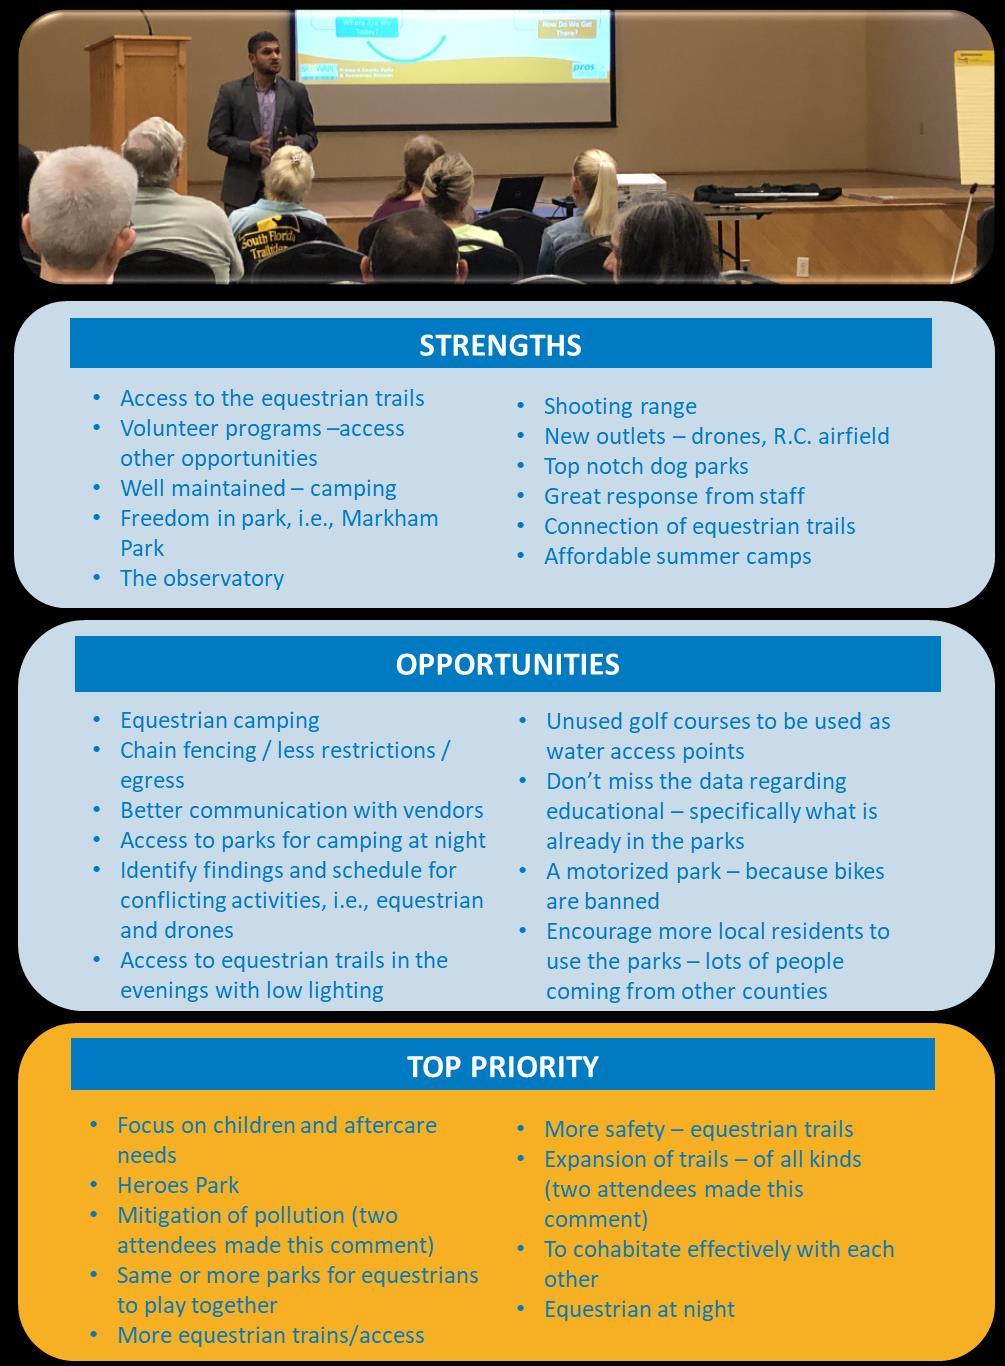
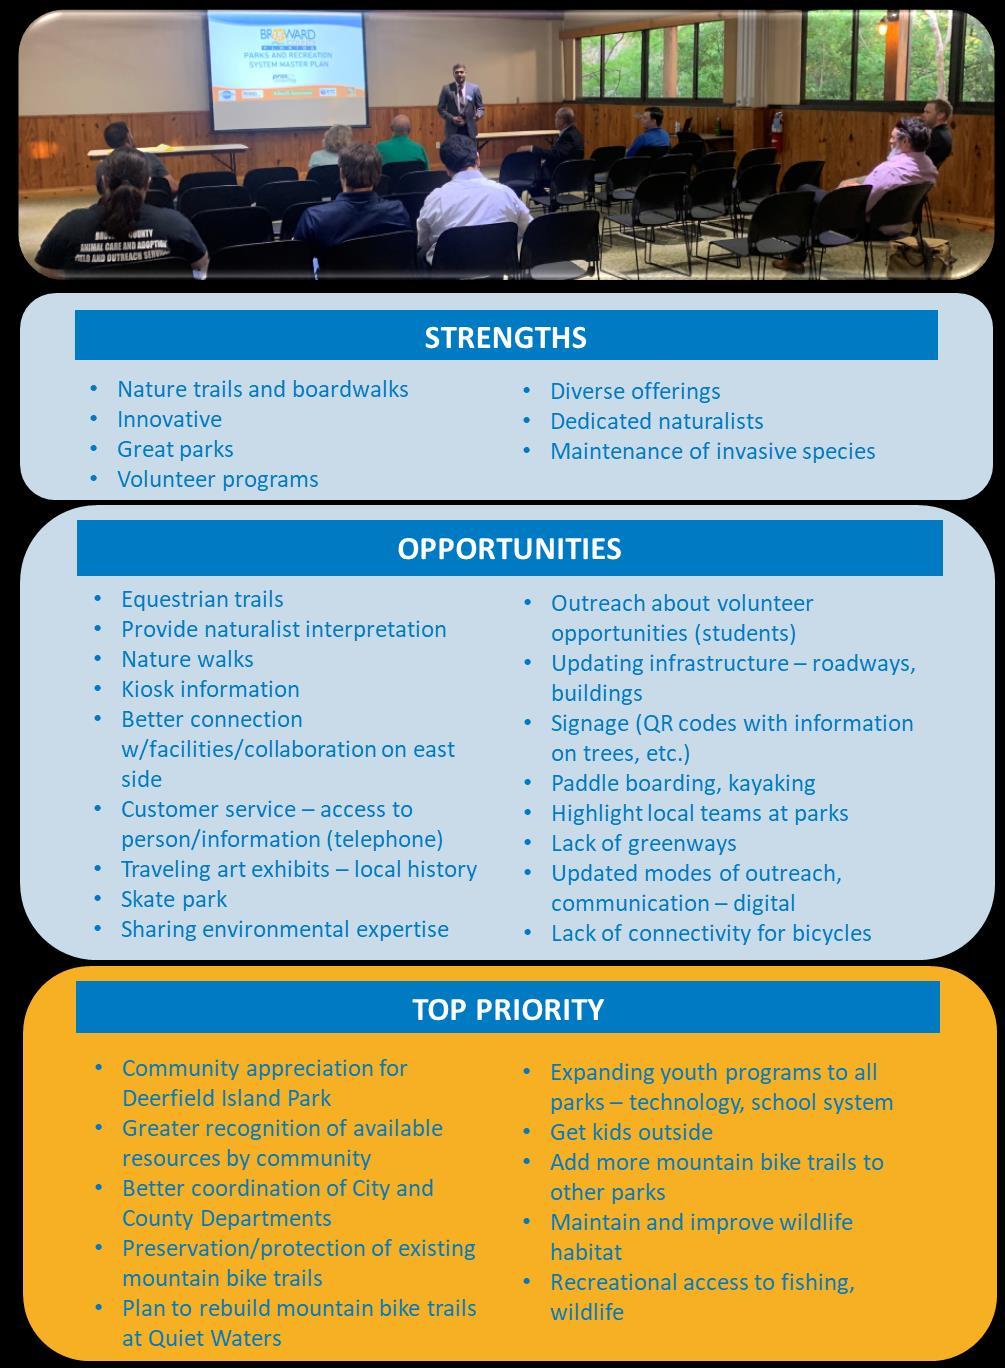
Following the presentations, attendees were able to ask questions and to identify the strengths, opportunities, and top priorities they see and envision for the Division. Close to 70 participants, representing a variety of interests, were present at the public forums.
LIVE POLLING
One key approach for soliciting feedback from attendees of the public forum was through live polling of the audience. Using the responses to focus group and key leadership interview questions, the consulting team developed questions within a PowerPoint presentation to gain an understanding of County needs.
Attendees were able to respond anonymously to these questions and view responses in real time using a polling device to answer a series of questions related to usage and need for parks, trails, facilities, and programs.
2.3. Statistically Valid Needs Analysis Survey
ETC Institute (ETC) administered a parks and recreation needs assessment in spring of 2020 for Broward County. This assessment was administered as part of the County’s efforts to develop area parks, facilities, and programs. Information compiled from the assessment will provide key data to set a clear vision for the future. This survey will determine priorities for parks, recreation facilities, program offerings, and special event offerings in the County.
The results of the survey will aid the County in taking a resident‐driven approach to making decisions that will enrich the future of the community and positively affect the lives of residents.
2.3.1.
Methodology
ETC mailed a survey packet to a random sample of households in Broward County. Each survey packet contained a cover letter, a copy of the survey, and a postage‐paid return envelope. Residents who received the survey were given the option of returning the survey by mail or completing it online at www.BrowardCountySurvey.org.
Ten days after the surveys were mailed, ETC sent emails to the households that received the surveys to encourage participation. The emails contained a link to the online version of the survey to make it easy for residents to complete the survey. To prevent people who were not residents of the County from participating, everyone who completed the survey online was required to enter their home address prior to submitting the survey. ETC then matched the addresses that were entered online with the addresses that were originally selected for the random sample. If the address from a survey completed online did not match one of the addresses selected for the sample, the online survey was not counted.
The goal was to obtain completed surveys from at least 600 residents. The goal was exceeded with a total of 652 residents completing the survey. The overall results for the sample of 652 households have a precision of at least +/‐3.8% at the 95% level of confidence. The detailed report can be found in section 3.4.2. The major findings of the survey are summarized on the following page.
2.3.2. Statistically Valid Survey Results
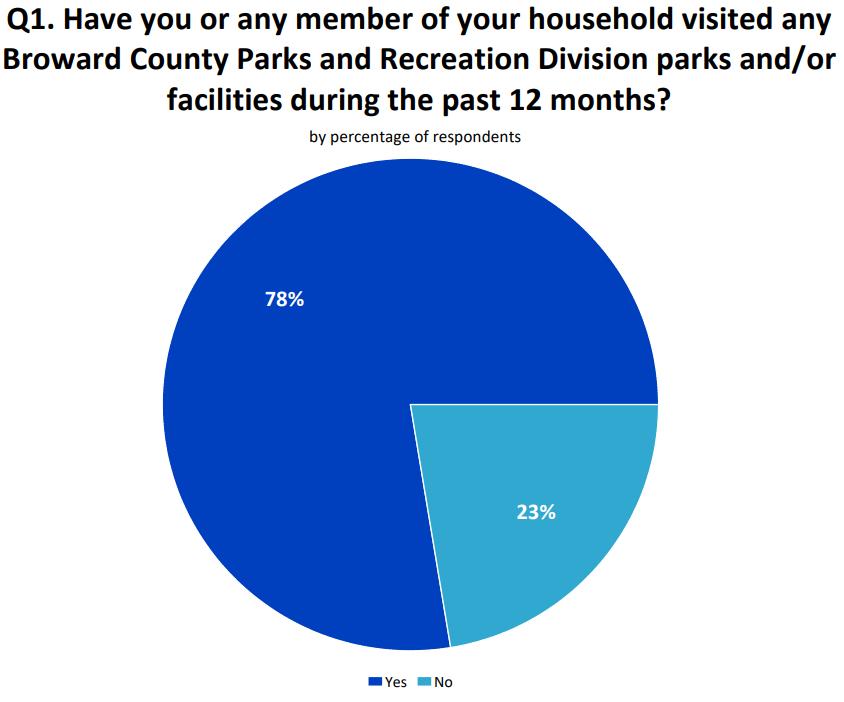
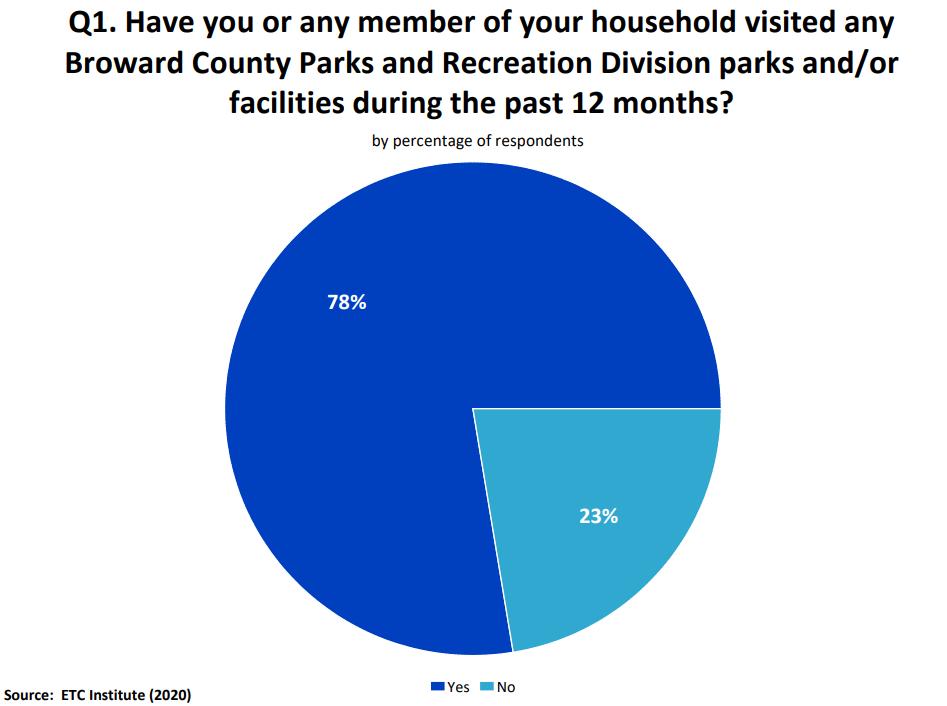
Question: 1
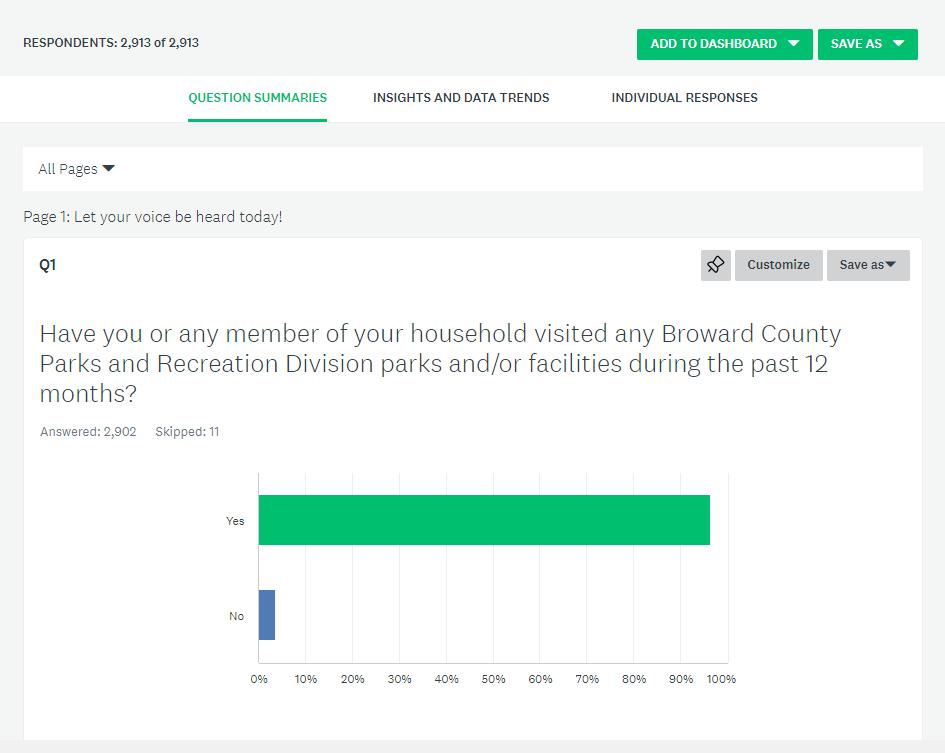
78% of respondent households have visited parks and/or facilities in the past year, which is aligned with the national average (82% visitation).
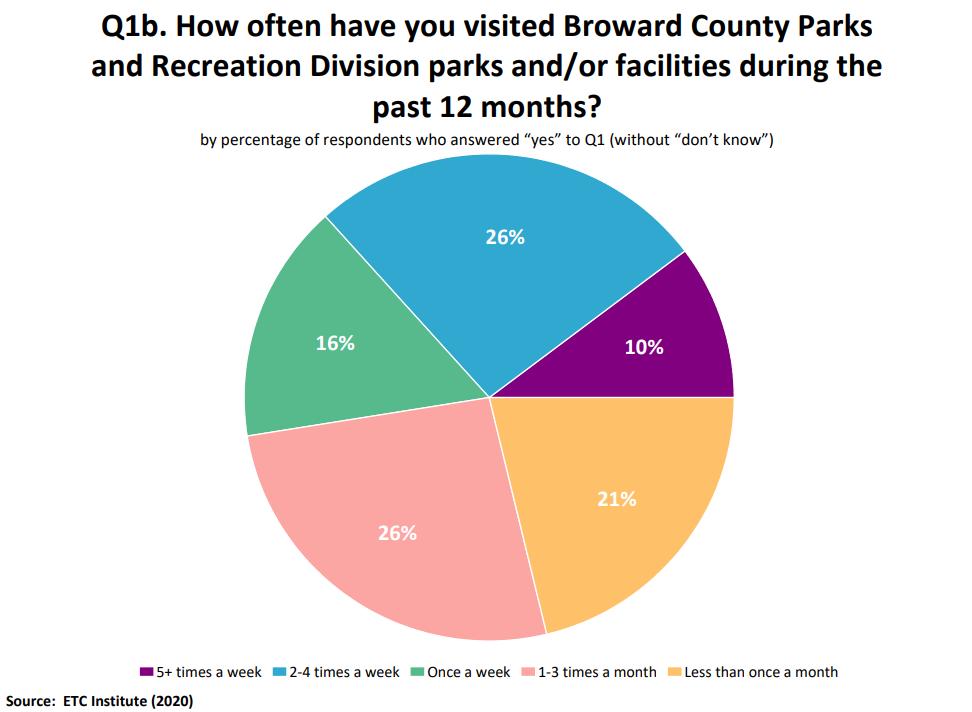
Question: 1b
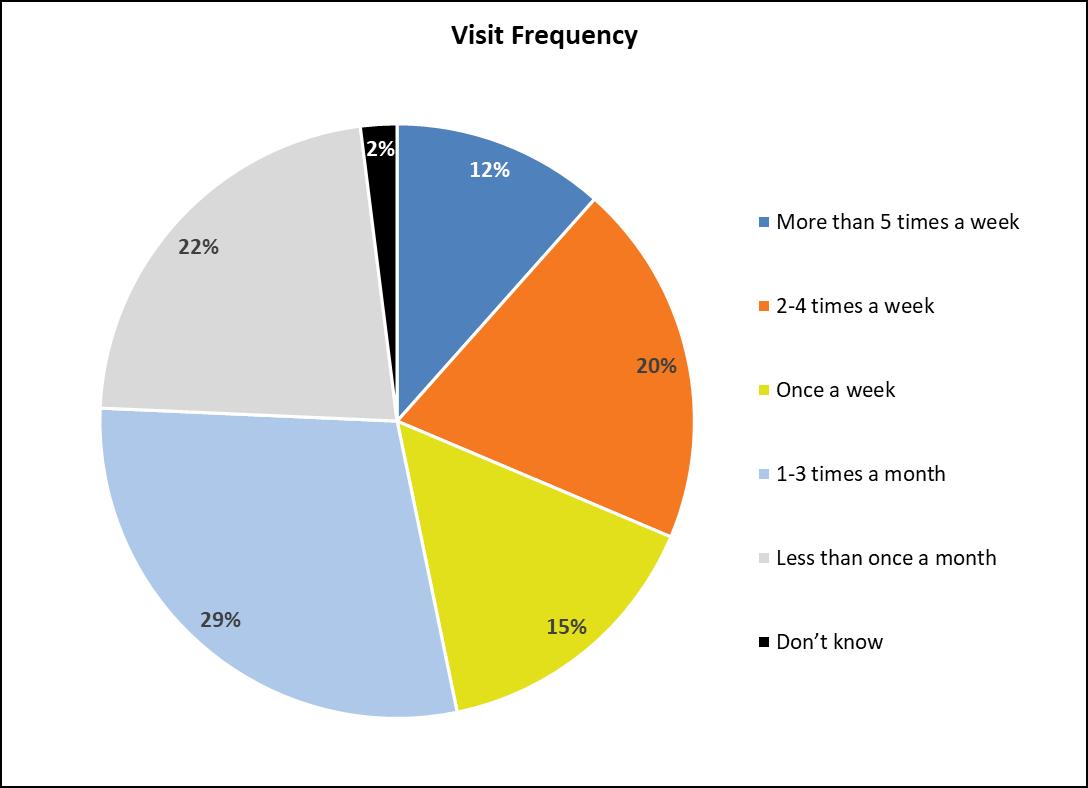
The survey indicated that 52% of the households have visited a park at least once a week to more than five times a week
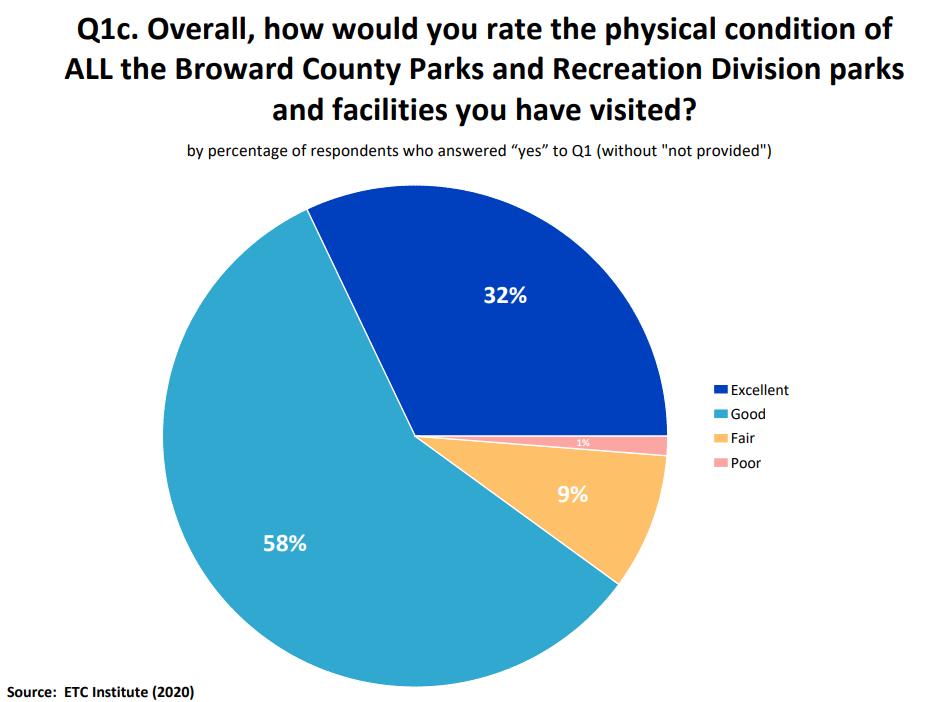
Question: 1c
As a result of combining ratings of Excellent and Good, 90% of respondents indicated they are satisfied with the conditions of the parks and facilities. Only 1% of all respondents rated the condition as poor, which speaks highly to the quality of park maintenance in Broward County.
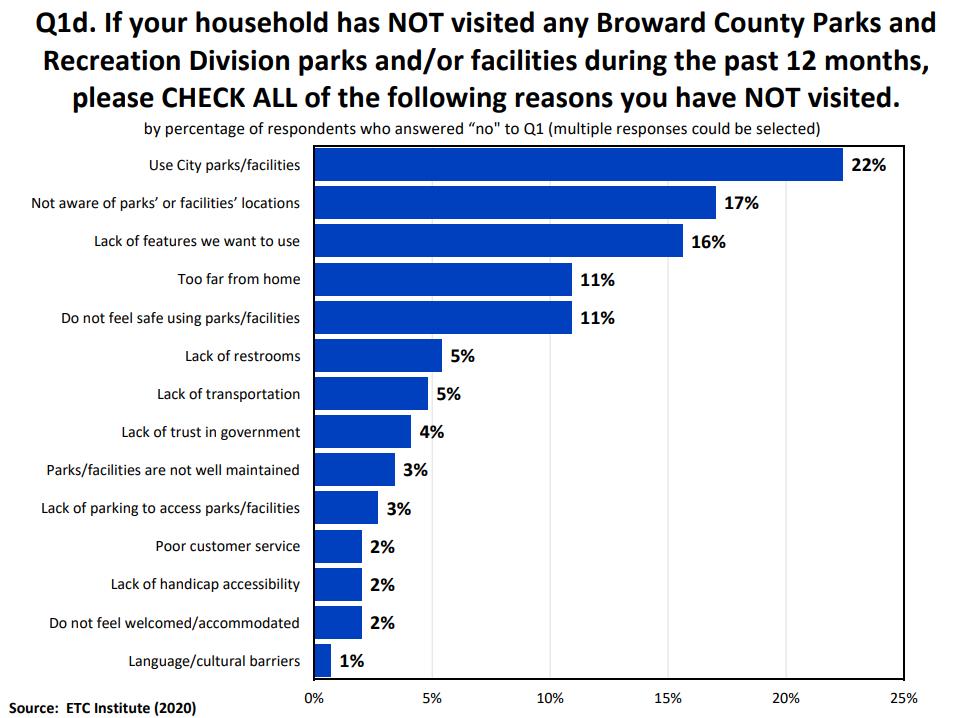
Question: 1d
Of the households that answered “No” to question 1, the top three reasons that prevent use of the County parks/facilities include Use City parks/facilities (22%), Not aware of parks’ or facilities’ locations (17%), and Lack of features we want to use (16%).
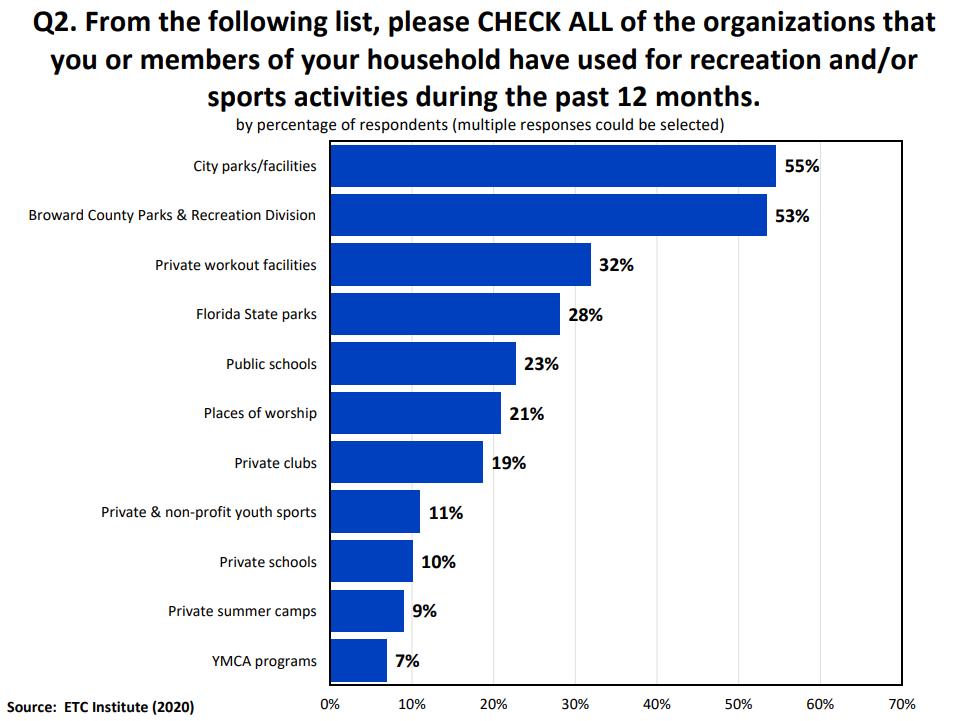
Question: 2
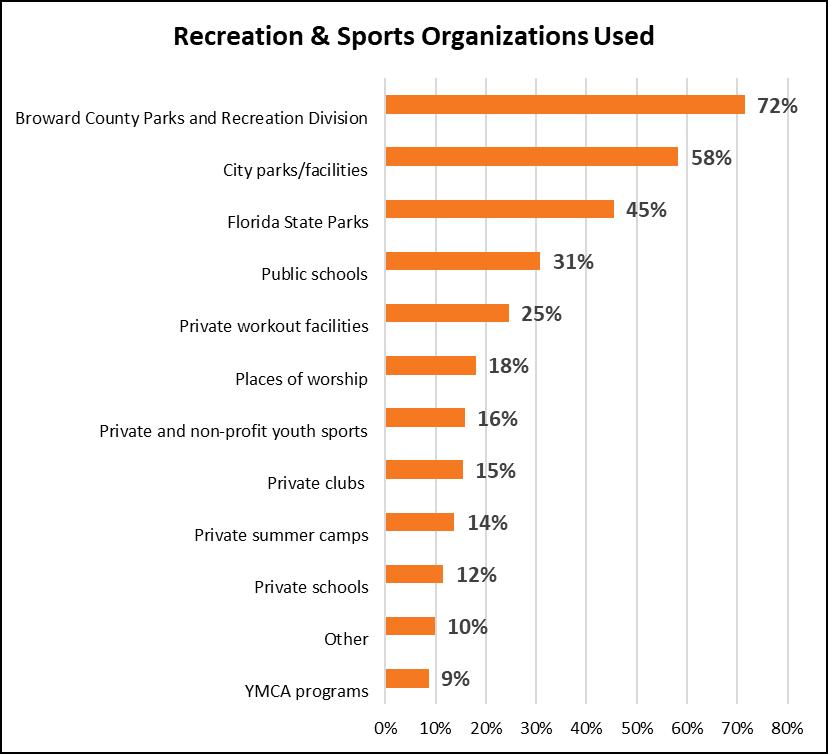
The chart below reveals that 53% of the respondents use County parks/facilities, 55% use City parks/facilities, and 32% use Private workout facilities
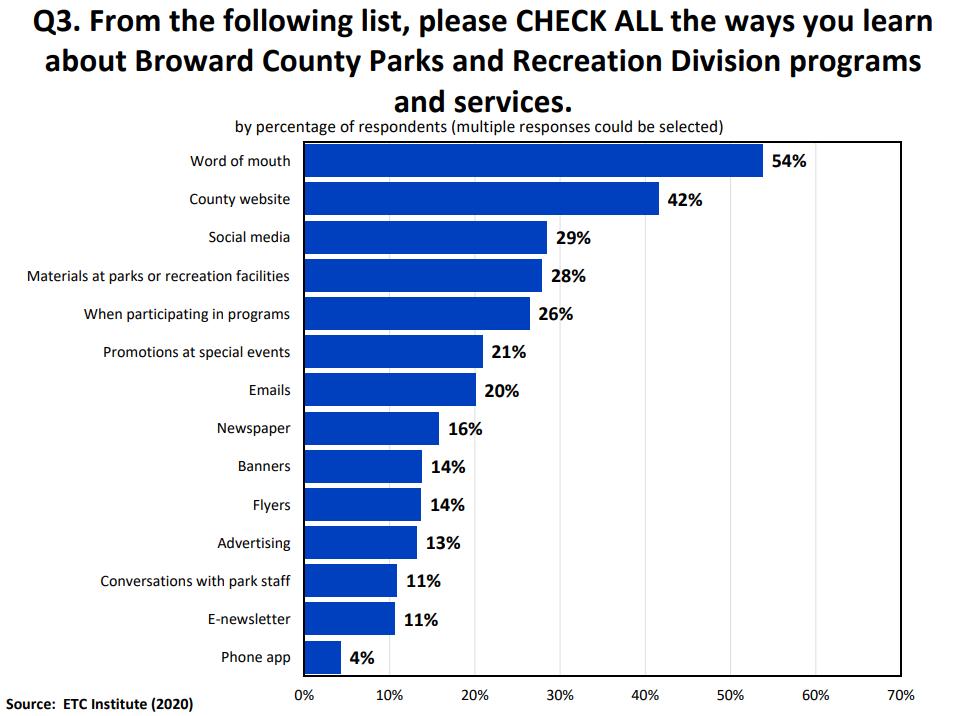
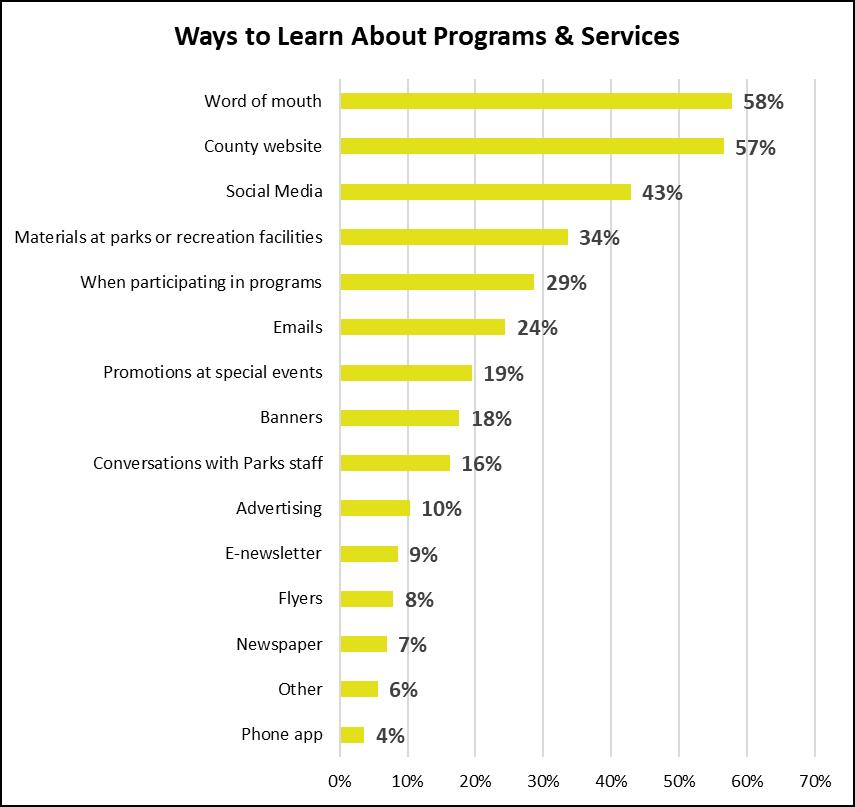
Question: 3
The chart below reveals Word of mouth (54%) as the most common way residents learn about programs and services. This is consistent with what the PROS Consulting team observed nationwide. The County Website (42%) and Social media (29%) were the next most popular ways residents are learning about the Division’s programs and services.
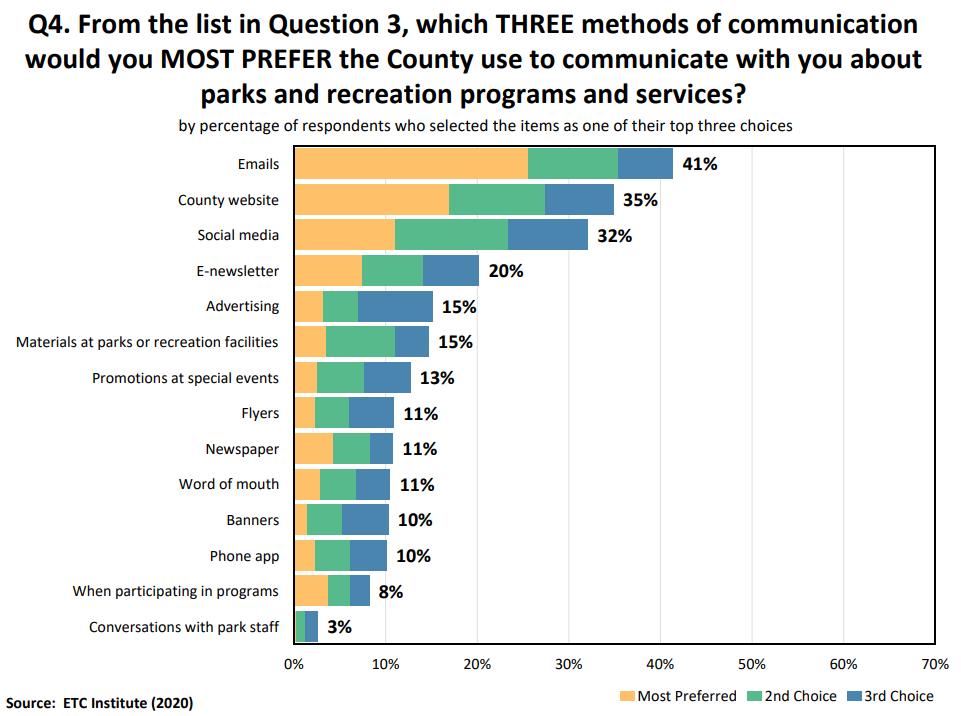
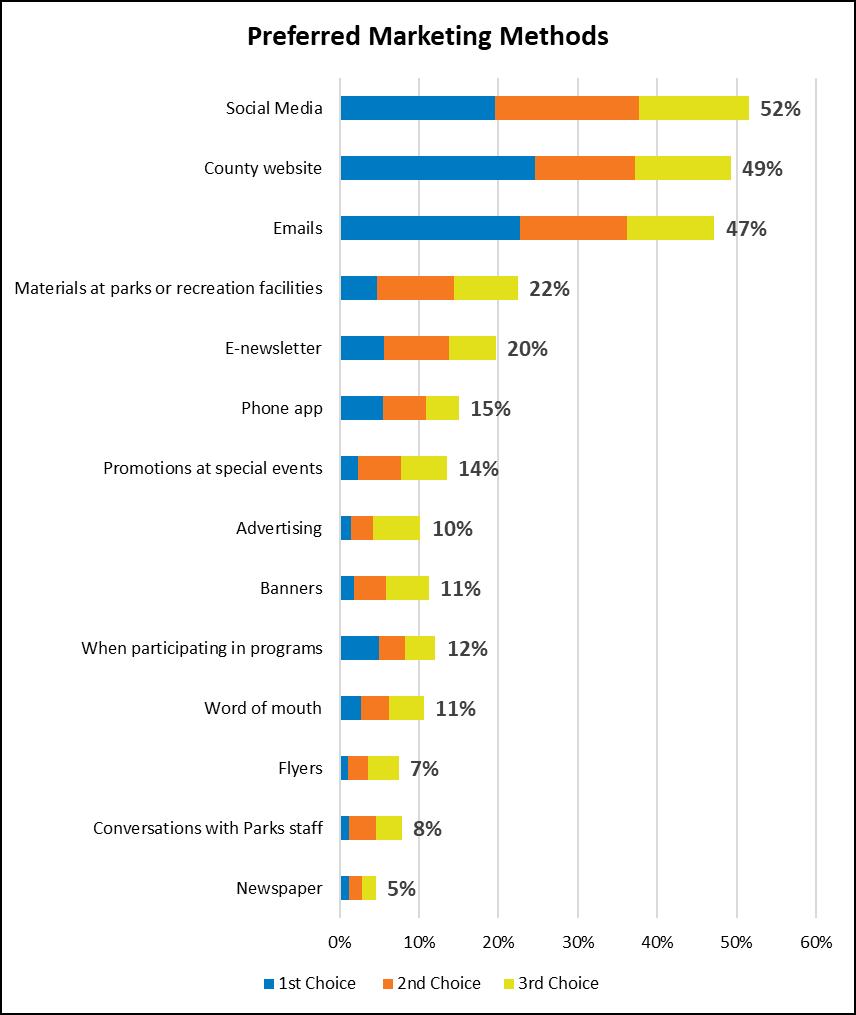
Question: 4
In addition to selecting the ways residents are currently learning about Broward County Parks and Recreation Division, respondents were asked to select their top three preferred ways to learn. The most popular choices, when combining all three, were Emails (41%), County Website (35%), and Social media (32%).
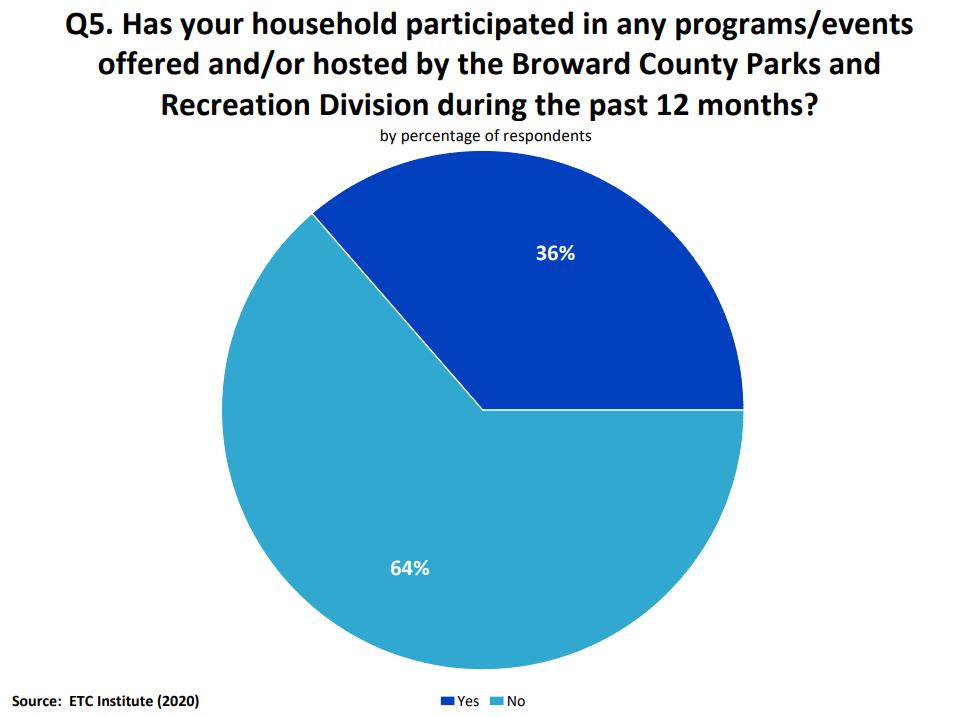
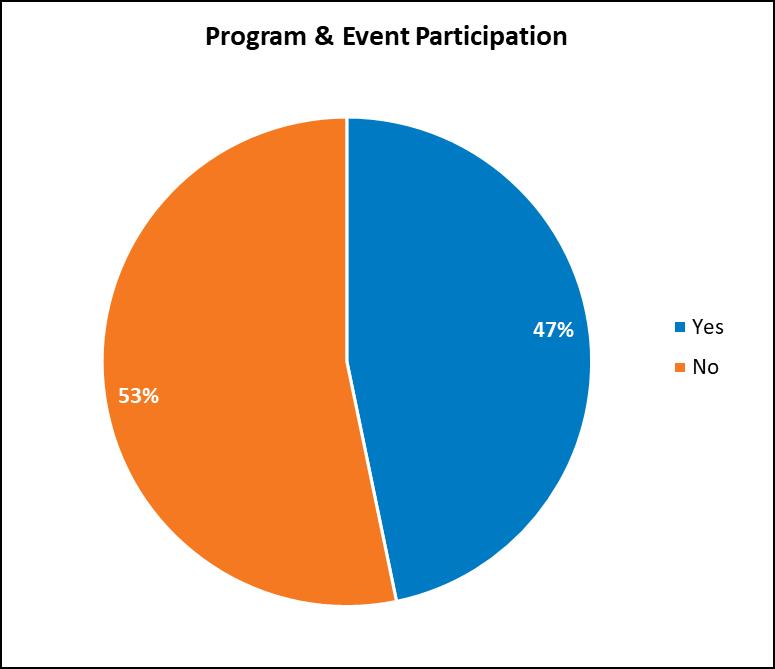
Question: 5
The survey indicated that 36% of the respondents have participated in programs in the past 12 months. In terms of participation levels, this is encouraging despite the ongoing pandemic. At the same time, it also offers an opportunity for future growth.
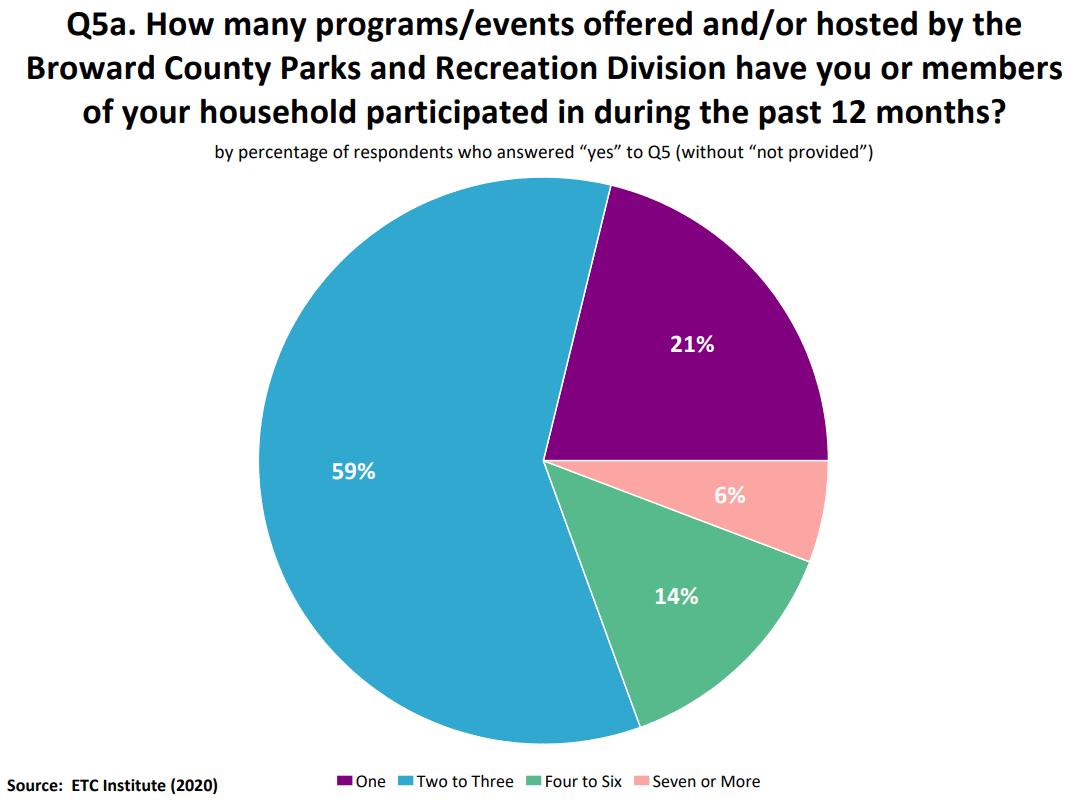
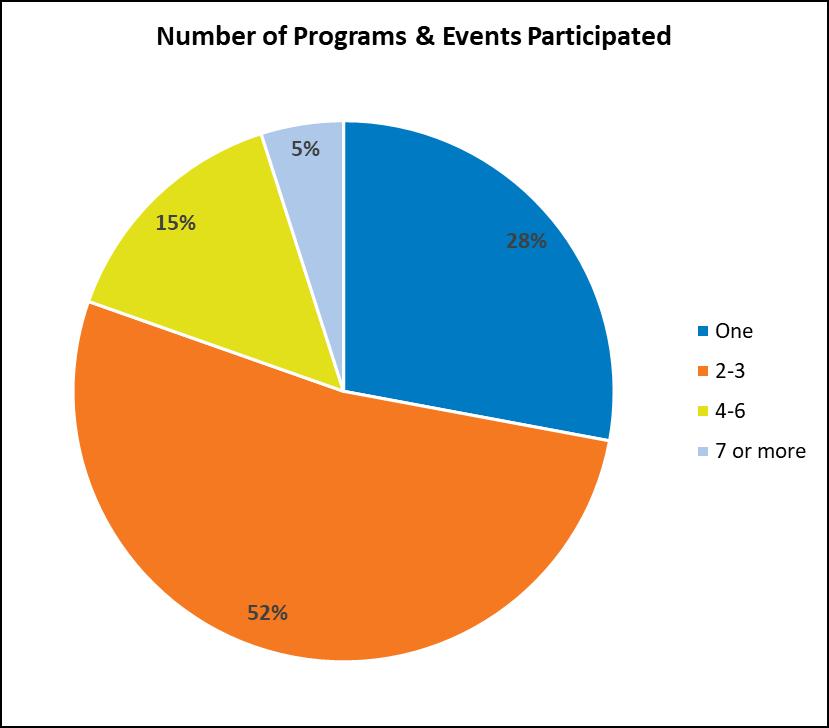
Question: 5a
From the 36% of respondents who participated in programs, the majority have participated in two to three programs per year (59%), followed by one program per year (21%). Ultimately, 79% of respondents who have participated in programs in the past year are repeat customers.
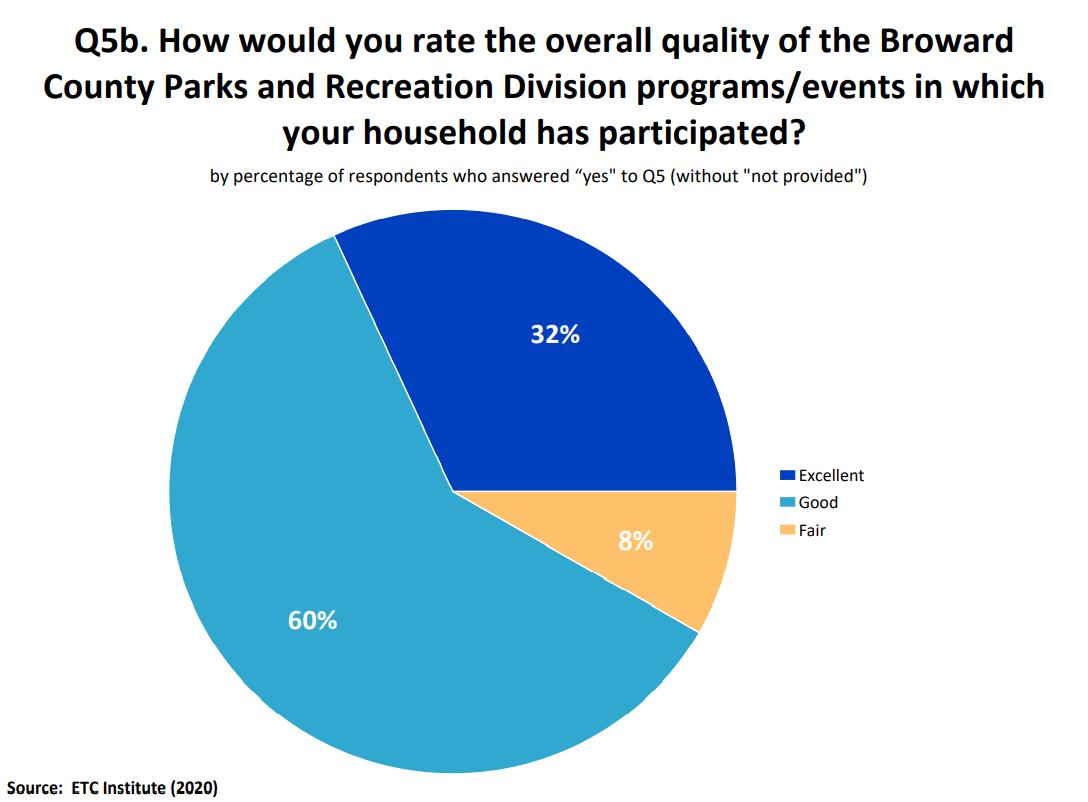
Question: 5b
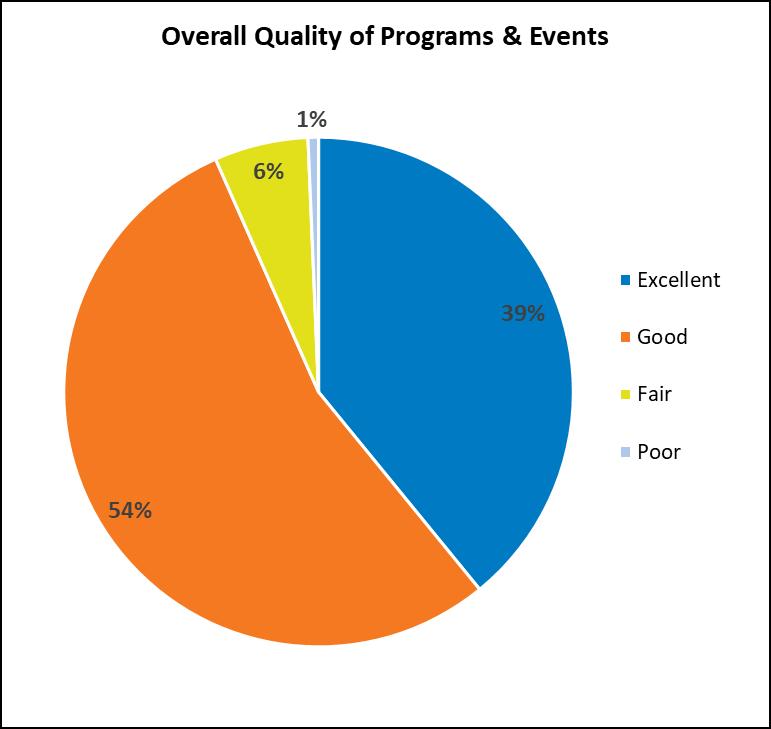
An overwhelming majority of respondents are satisfied with the overall quality of programs and events: 92% rate the programs and events as either excellent or good. Of the remaining respondents, 8% believe the program quality is fair, while 0% believes the programs are poor.
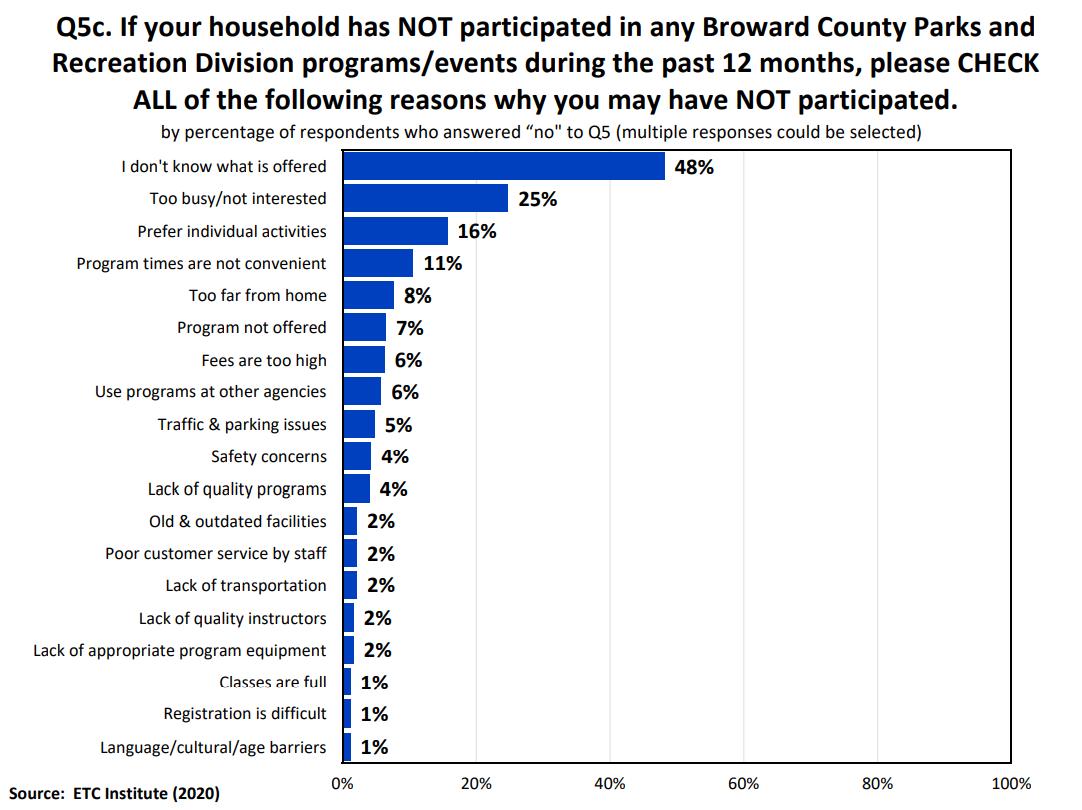
Question: 5c
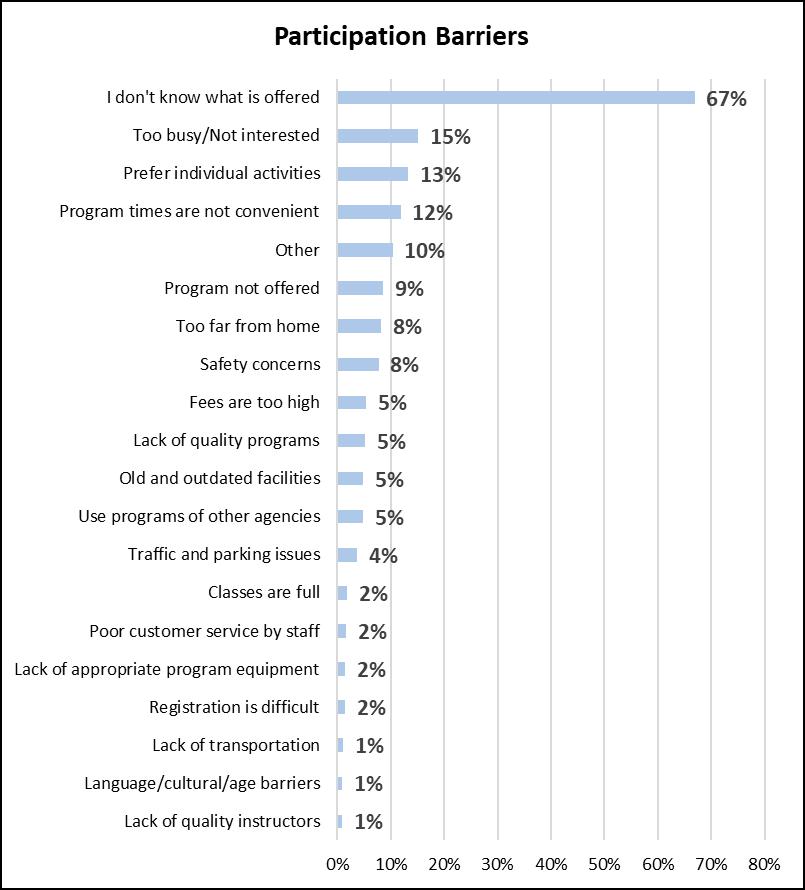
The largest reason for not participating in programs was I don’t know what is offered (48%). This is a challenge that the Division is working on strategically reducing and thus improve participation. The next most mentioned barriers were Too busy/not interested (25%) and Prefer individual activities (16%).
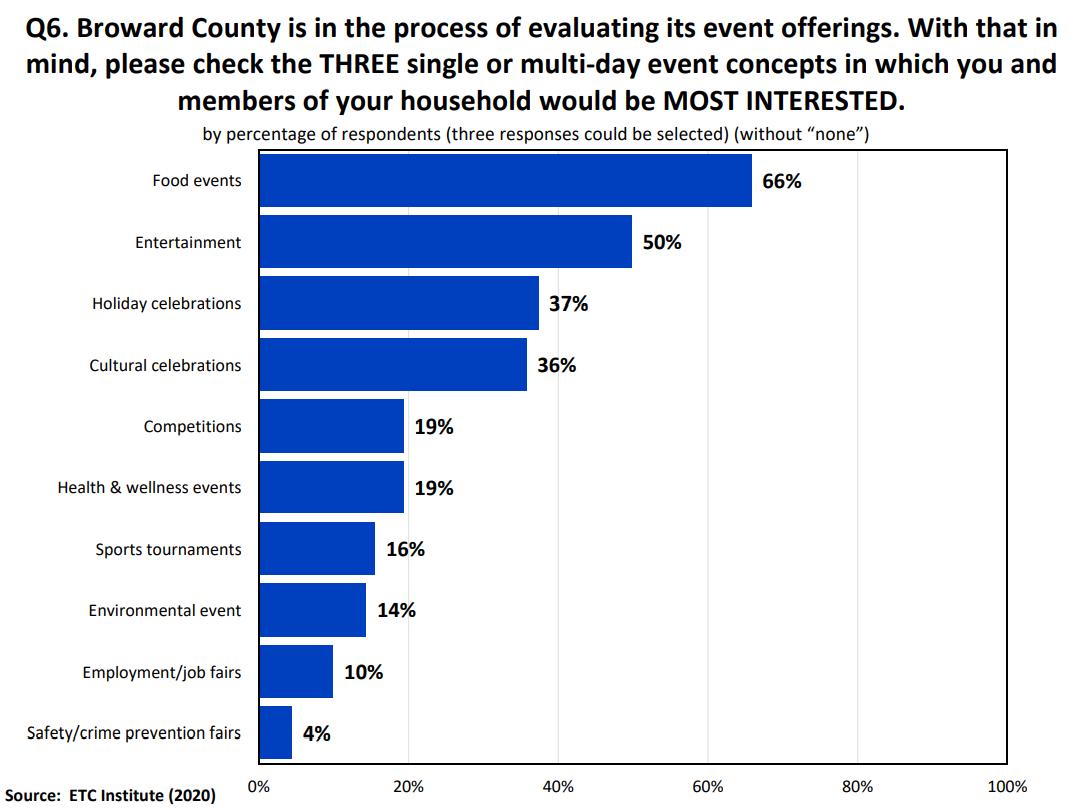
Question: 6
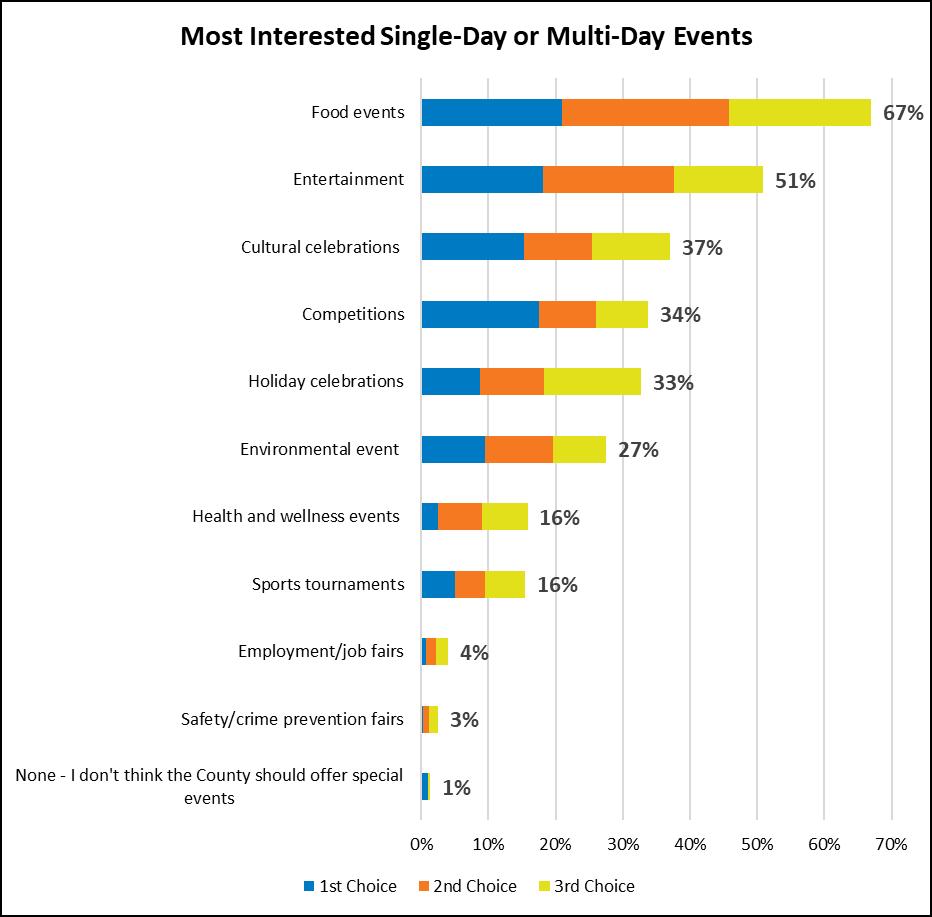
In regard to single-day or multi-day events, respondents are most interested in Food events (66%) and Entertainment (50%) as their top preferences. These two interests can be combined with any of the second-tier responses, creating a wider segment appeal. The second-tier concepts are Holiday celebrations (37%), Cultural celebrations (36%), Competitions (19%), and Health & wellness events (19%).
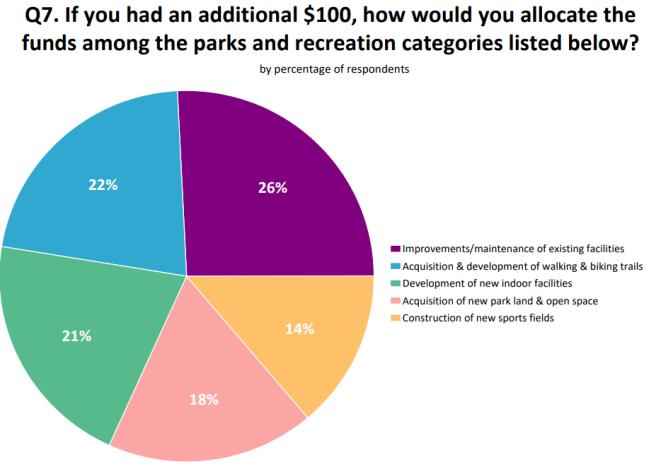
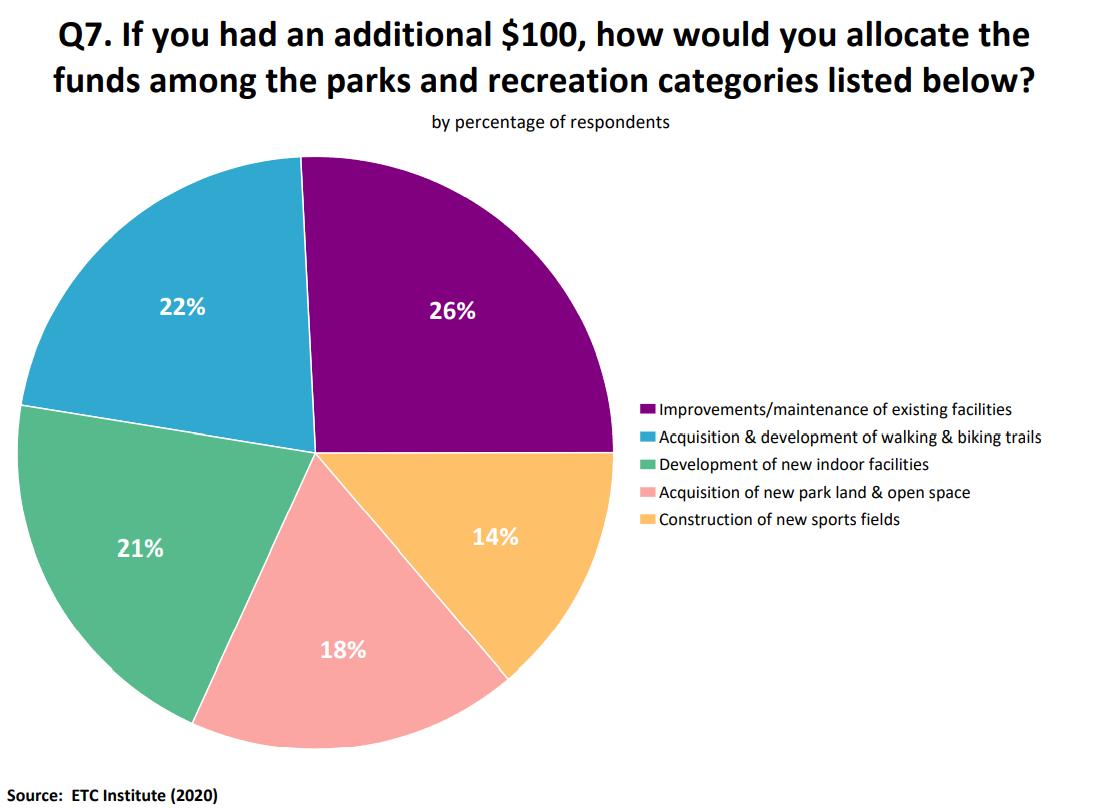
Question: 7
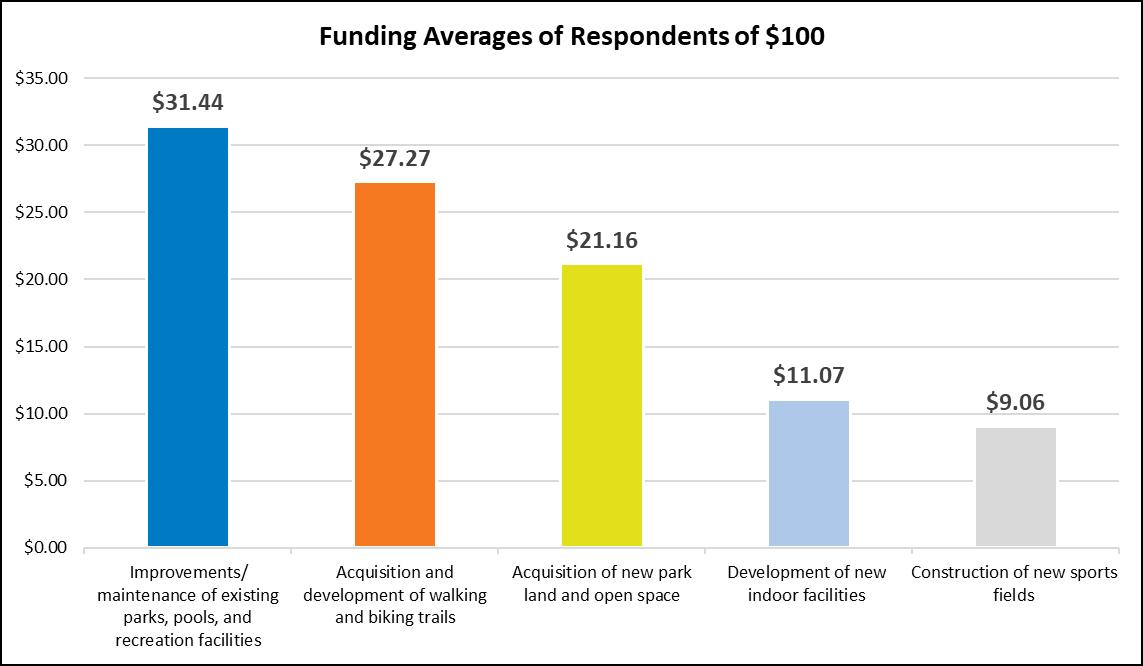
The most allocated dollars to fund projects within the County were for Improvements/maintenance of existing facilities (26%), followed by Acquisition and development of walking and biking trails (22%). The responses help the Division prioritize these categories in order of importance to the County.
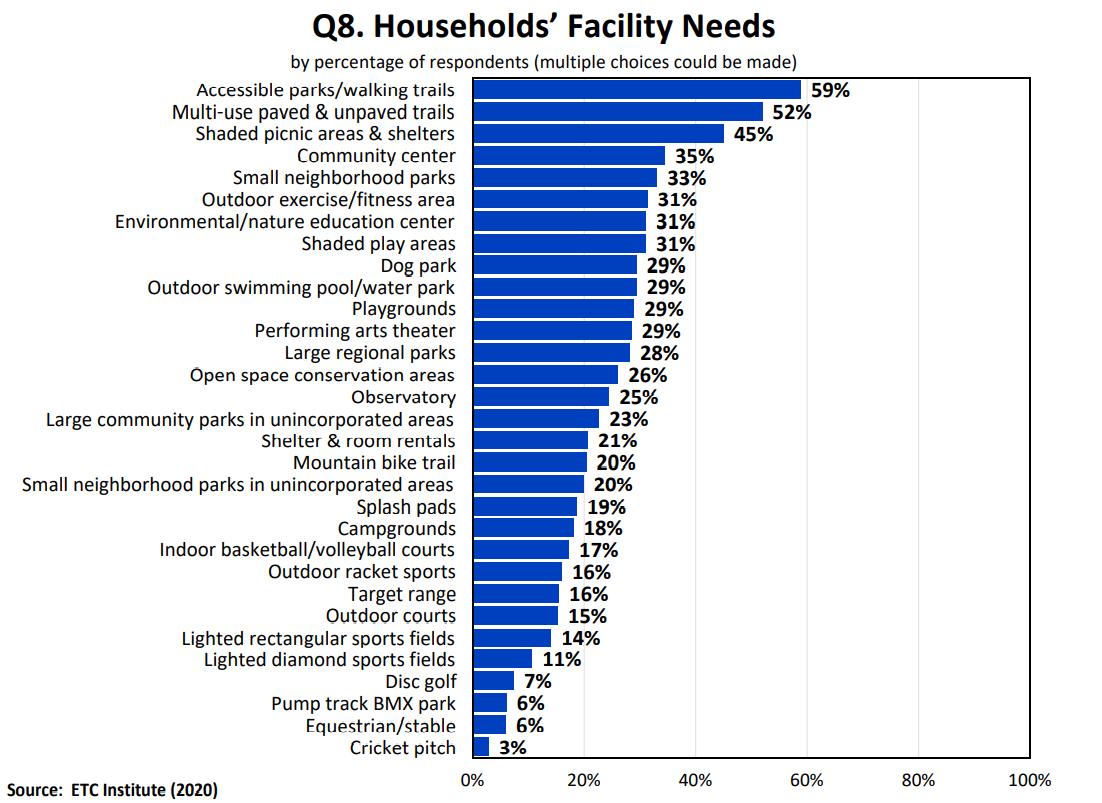
Question: 8
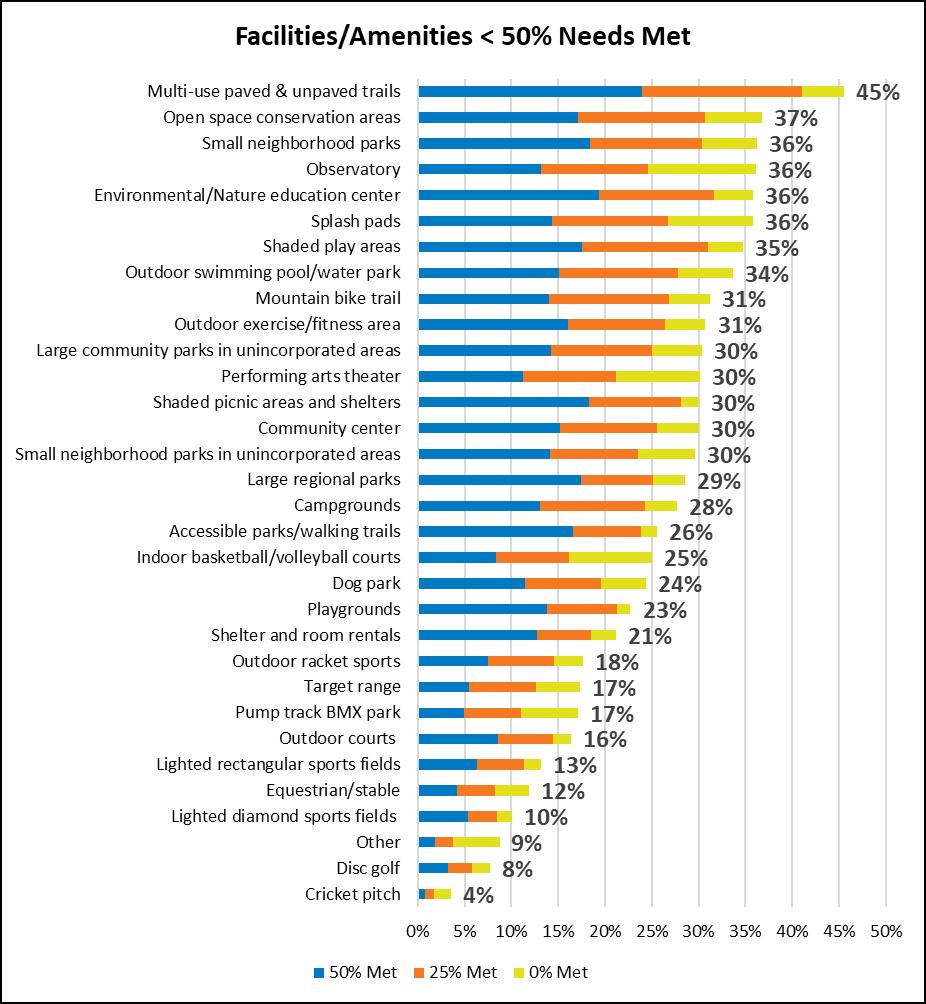
The graph below describes respondents’ needs for facilities and amenities within the County. Accessible parks/walking trails (59%) were identified as the greatest need, followed by Multiuse paved & unpaved trails (52%), Shaded picnic areas & shelters (45%), Community center (35%), and Small neighborhood parks (33%).
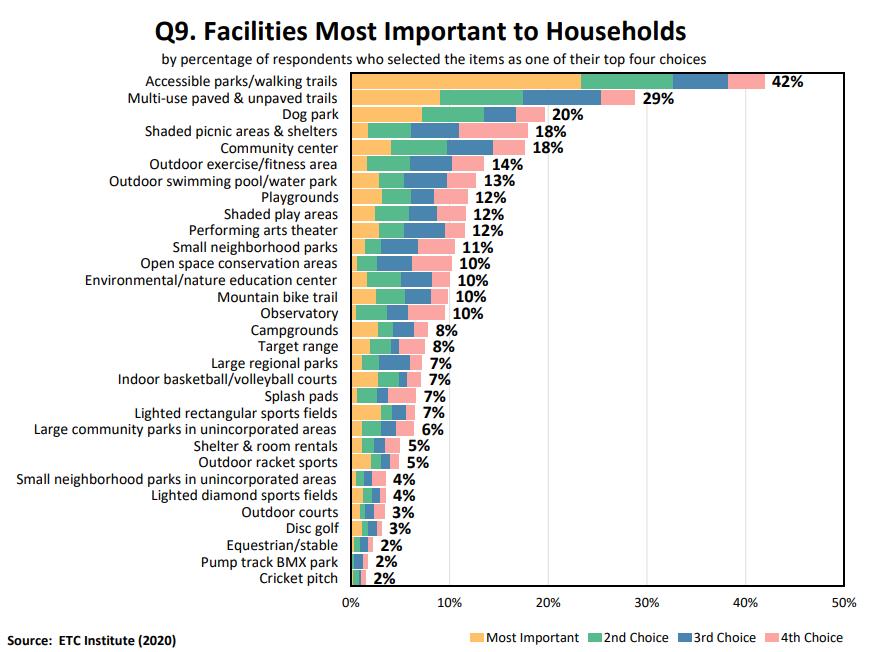
Question: 9
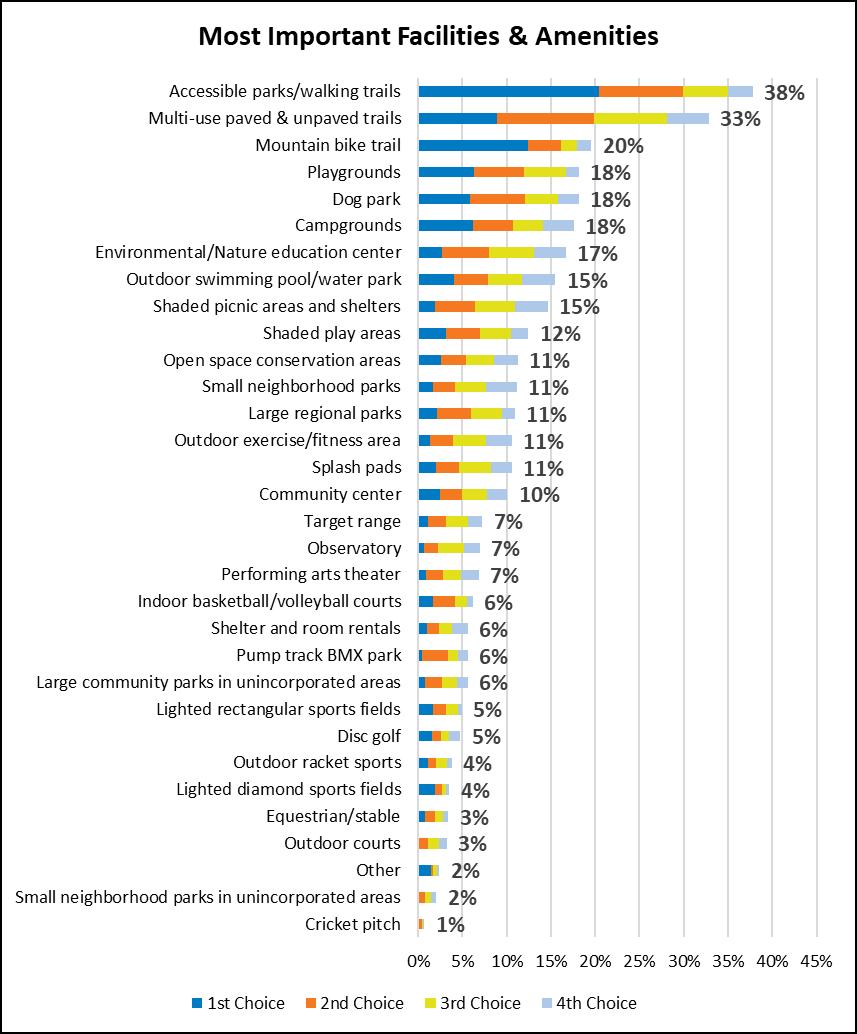
Of the unmet needs selected in the last question, the five most important facilities and amenities selected by respondents were Accessible parks/walking trails (42%), Multiuse paved & unpaved trails (29%), Dog park (20%), Shaded picnic areas & shelters (18%), and Community center (18%). When looking at the lowest number of responses to this question, it is important to understand that in many instances these are facilities that are important, but are already being provided, so there is not as much of a need.
It can also be that these are facilities and amenities that County residents may not be looking to the Division to provide as they are provided by local cities and towns within their parks and recreation departments.
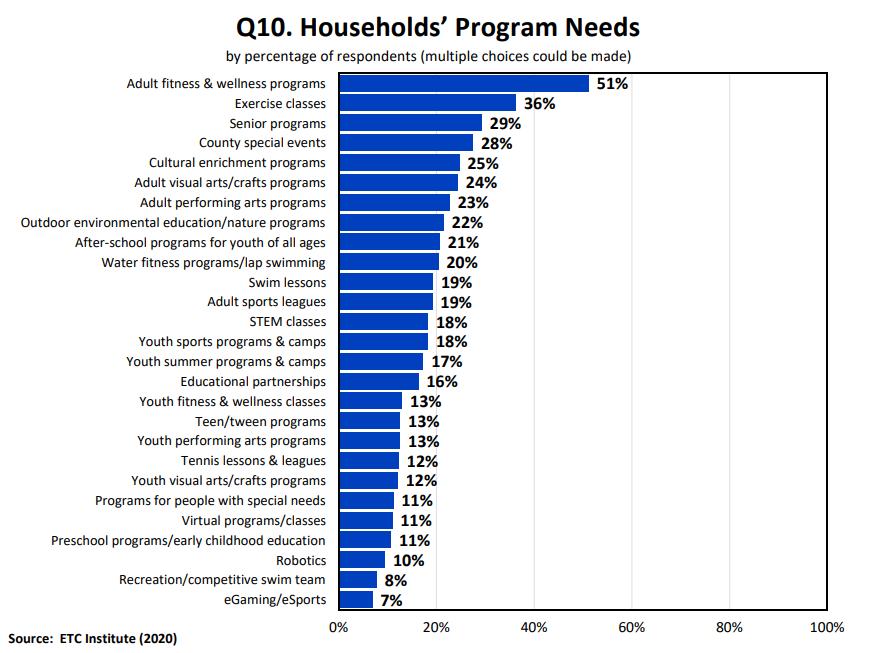
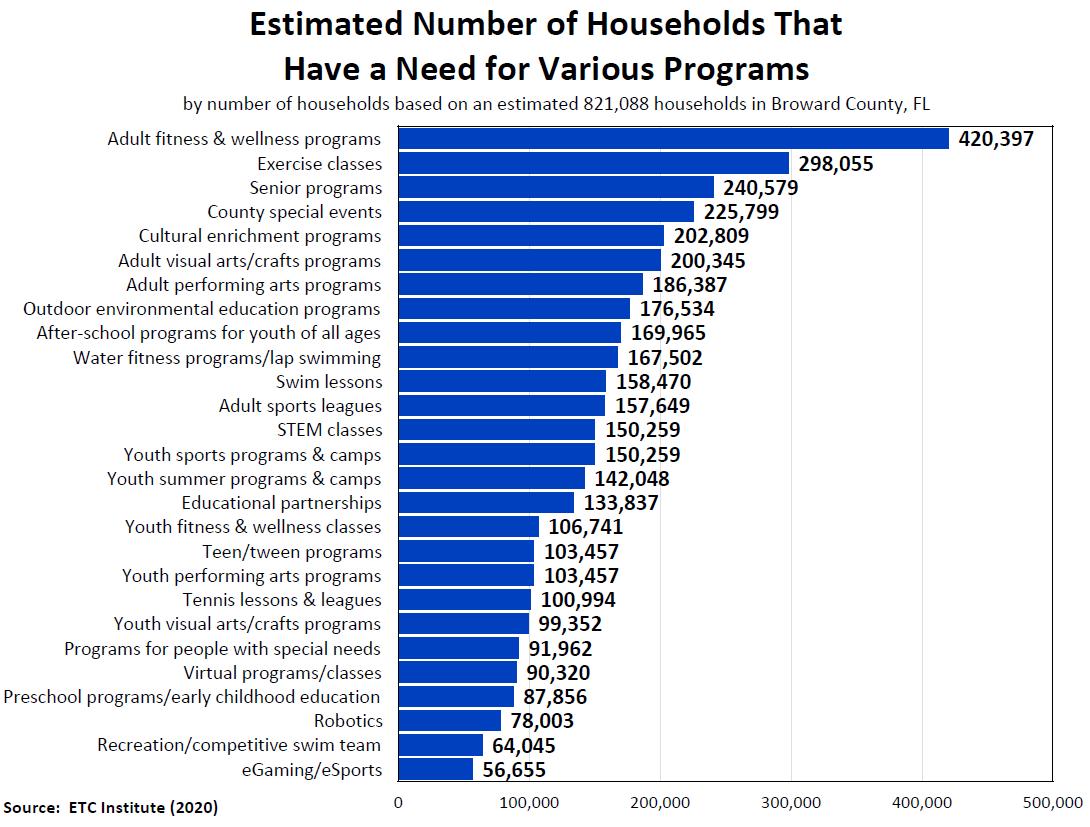
Question: 10
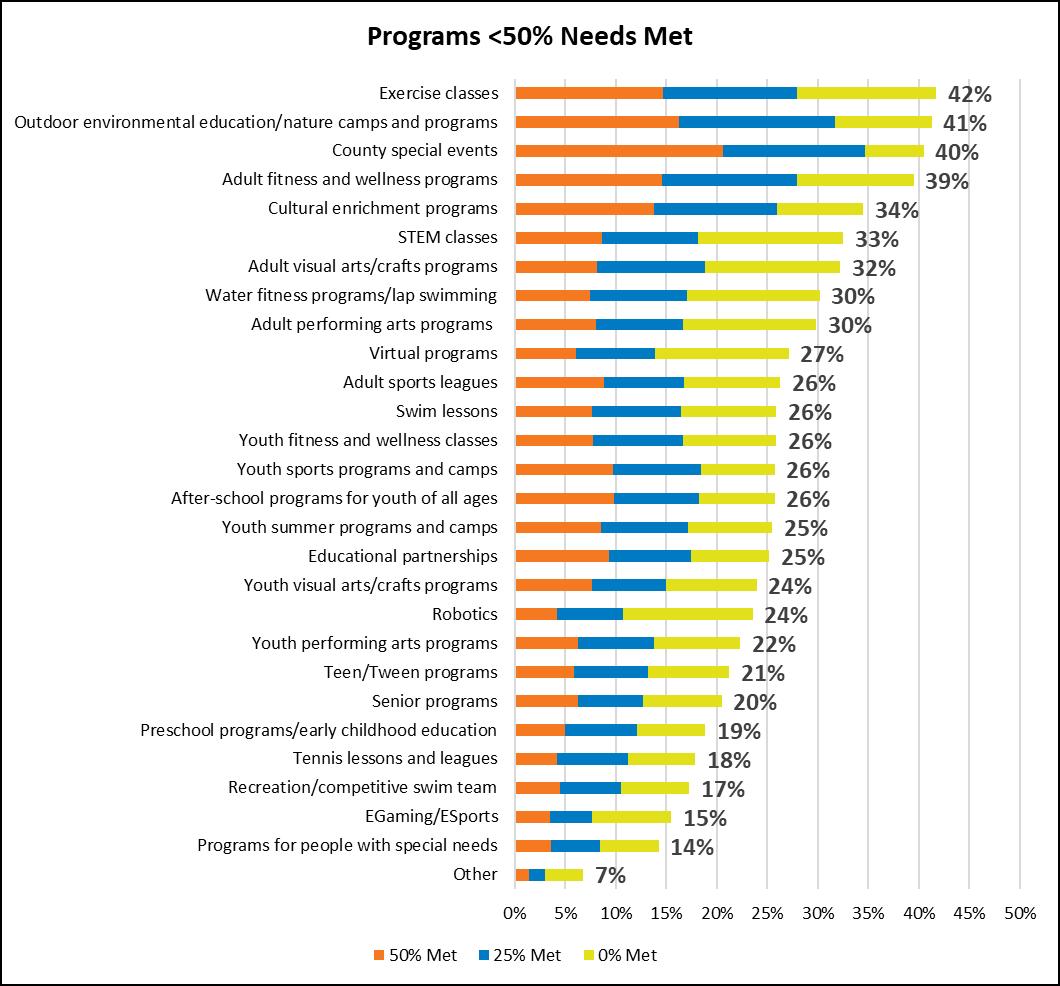
The graph below describes respondents’ needs for programs within the County. Adult fitness and wellness programs (51%), Exercise classes (36%), Senior programs (29%), and County special events (28%) were selected as the top four highest unmet needs.
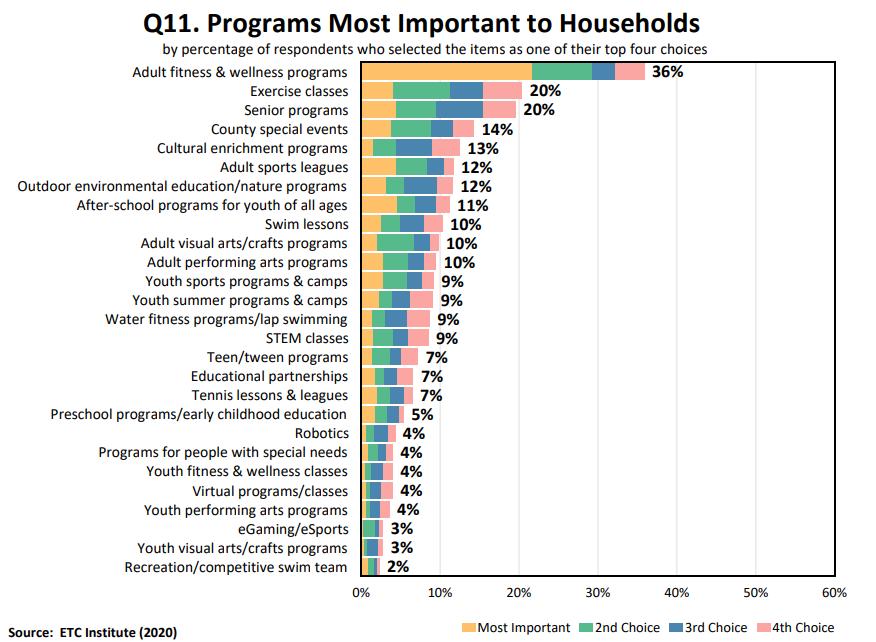
Question: 11
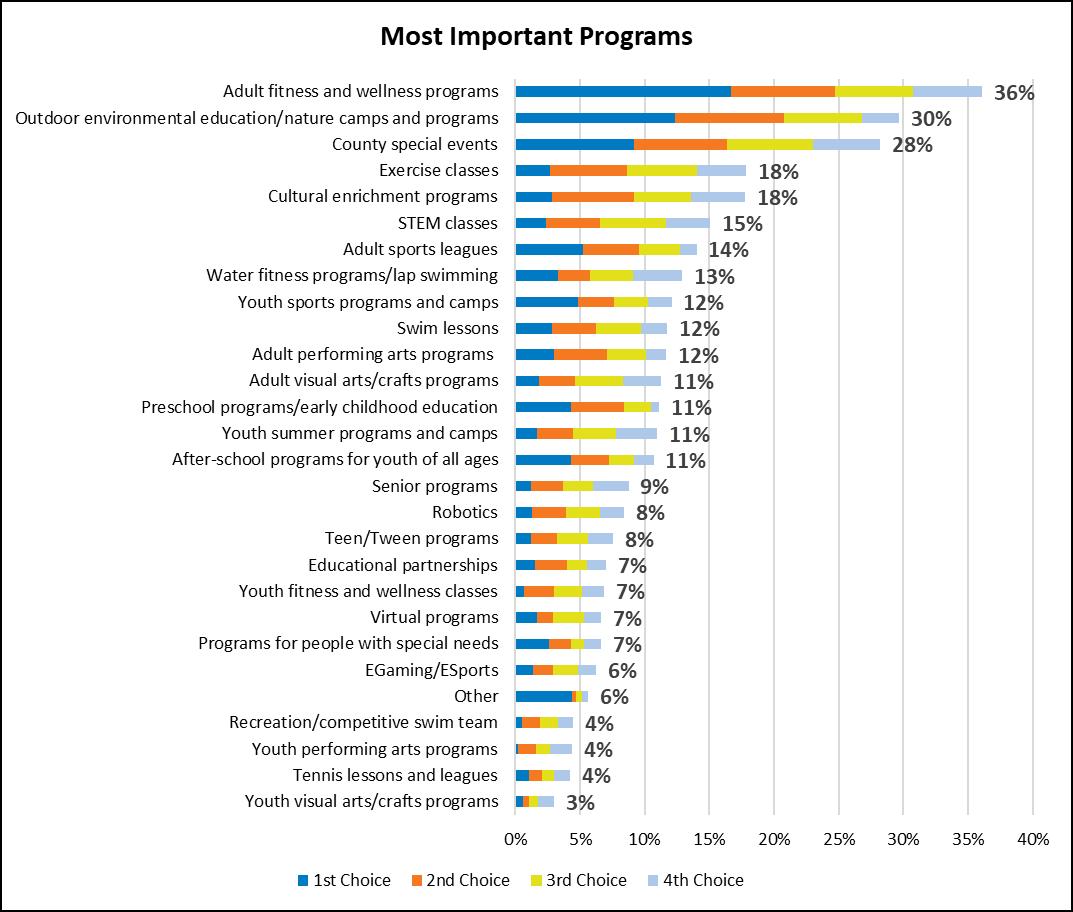
Of the unmet needs selected in the last question, the four most important programs selected by respondents were Adult fitness and wellness programs (36%), Exercise classes (20%), Senior programs (20%), and County special events (14%).
As noted in Question 9, County residents may not be looking to the Division to provide these programs as they are provided by local organizations in the cities through their local parks and recreation departments.
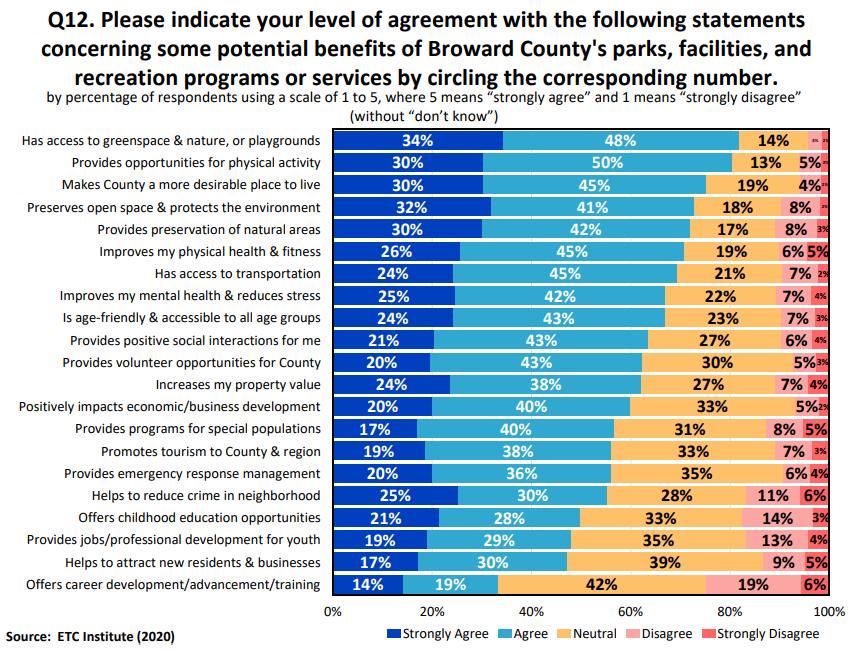
Question: 12
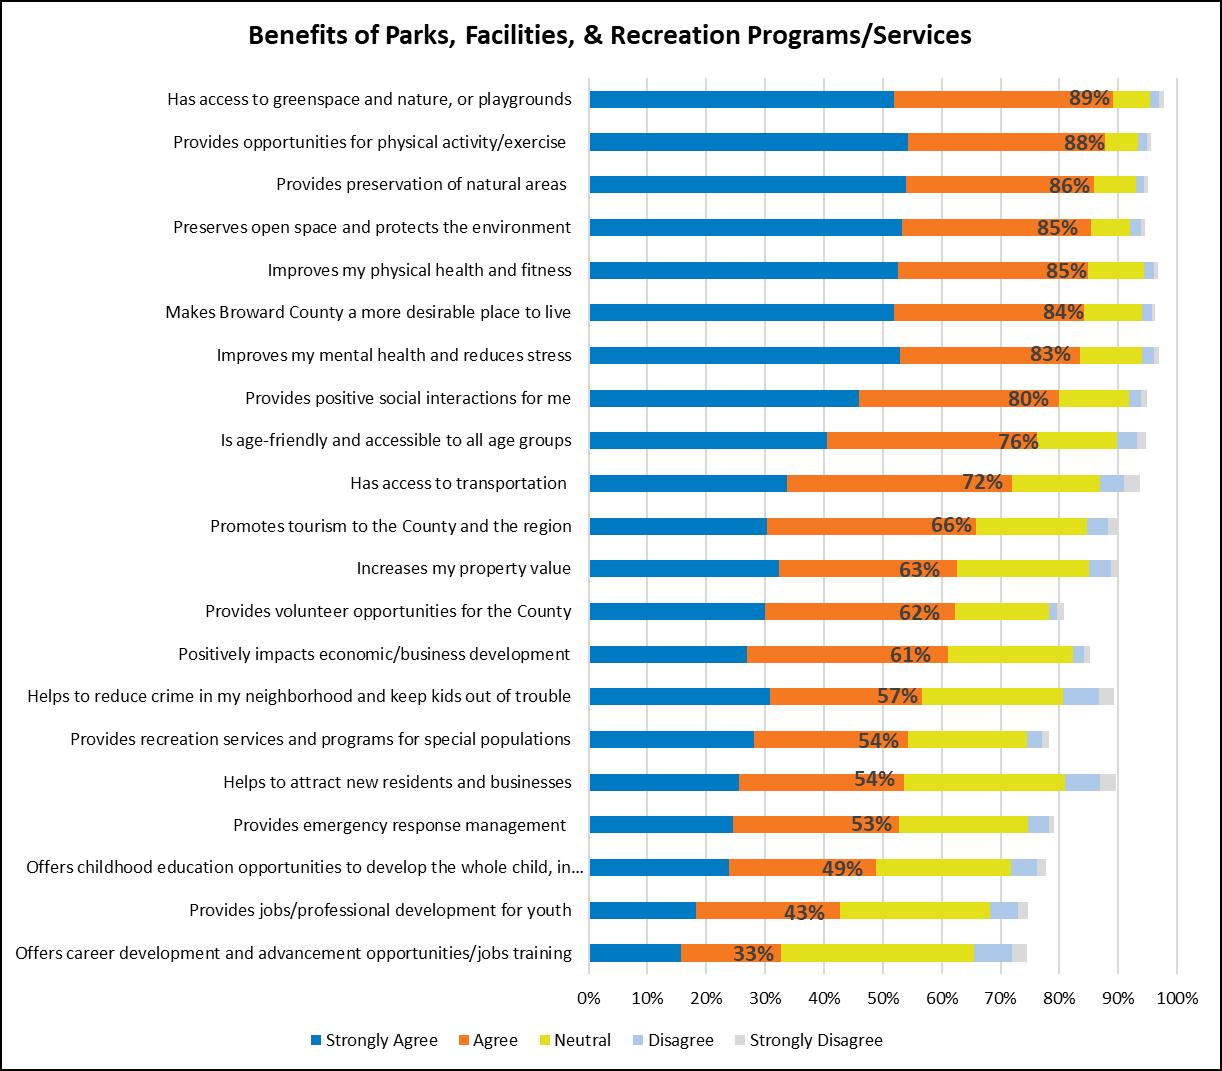
When combining Strongly Agree and Agree in the graph below, the top three supported benefits the County brings to the public include Has access to greenspace and nature, or playgrounds (82%), Provides opportunities for physical activity (80%), and Makes County a more desirable place to live (75%).
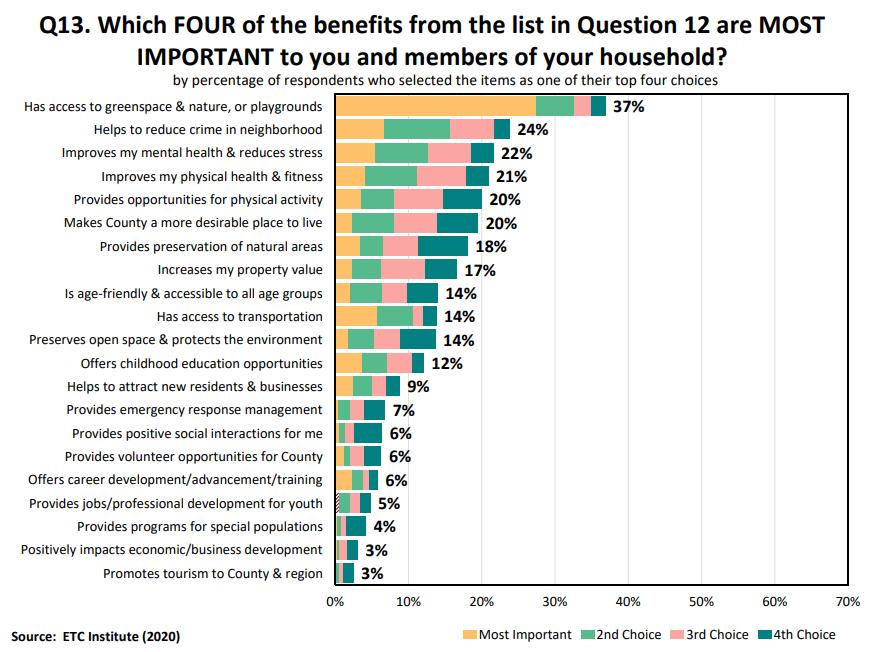
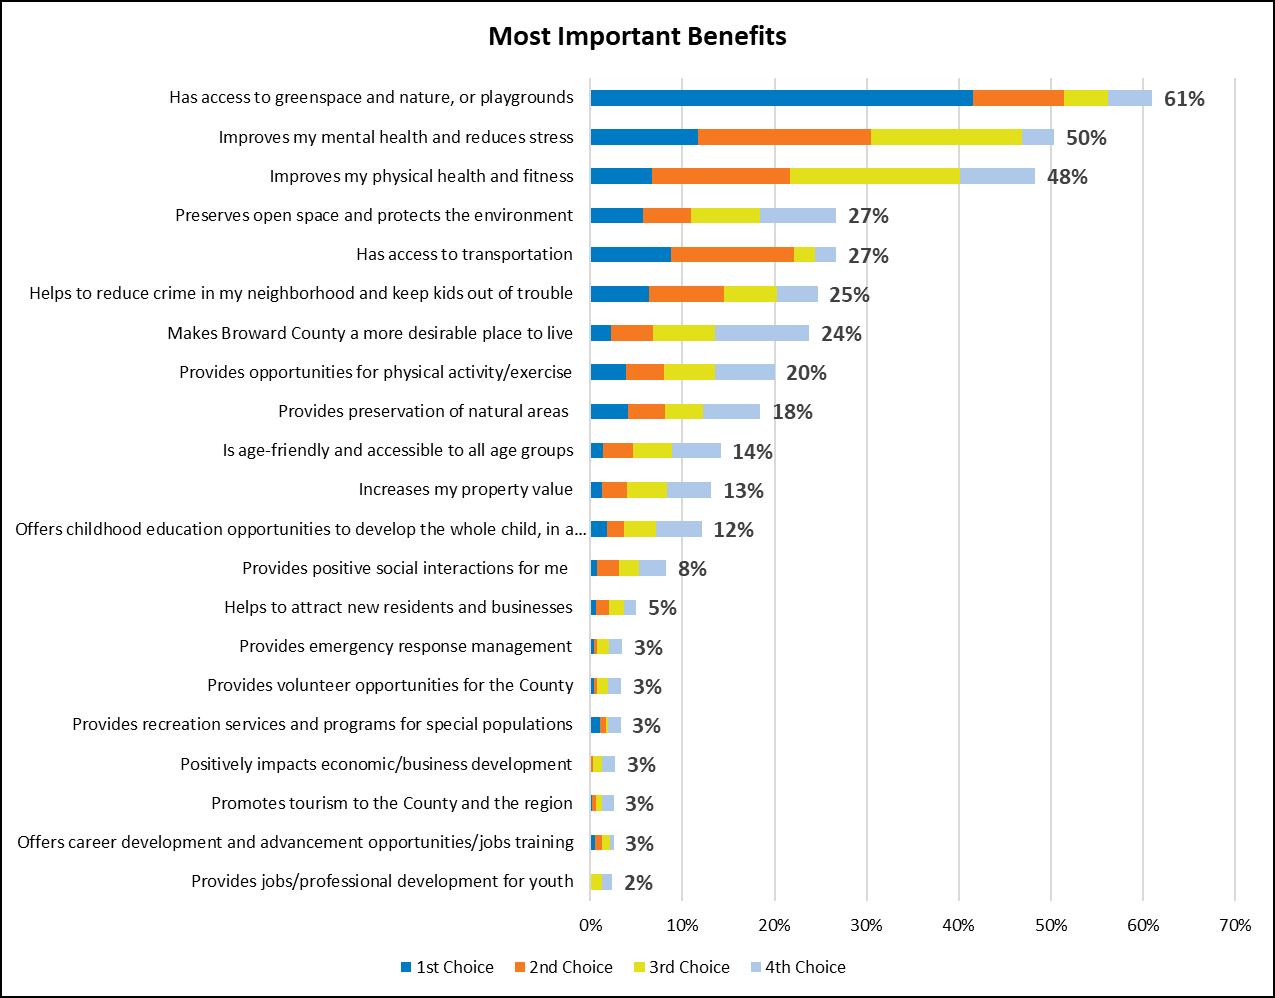
Question: 13
Respondents were asked to identify which four from the previous question are most important to their household. The most important benefits include Has access to greenspace & nature, or playgrounds (37%), Helps to reduce crime in neighborhoods (24%), Improves my mental health and reduces stress (22%), and Improves my physical health & fitness (21%).
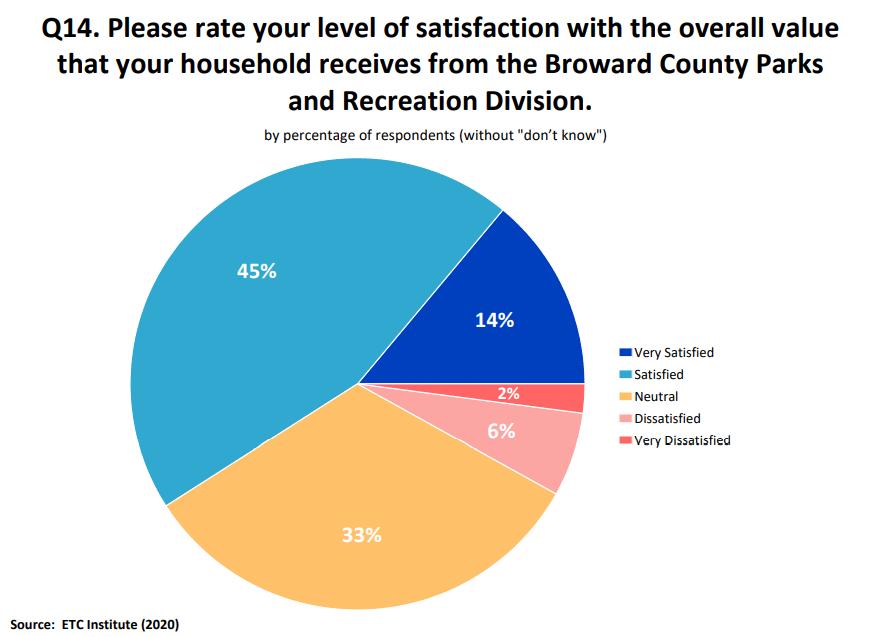
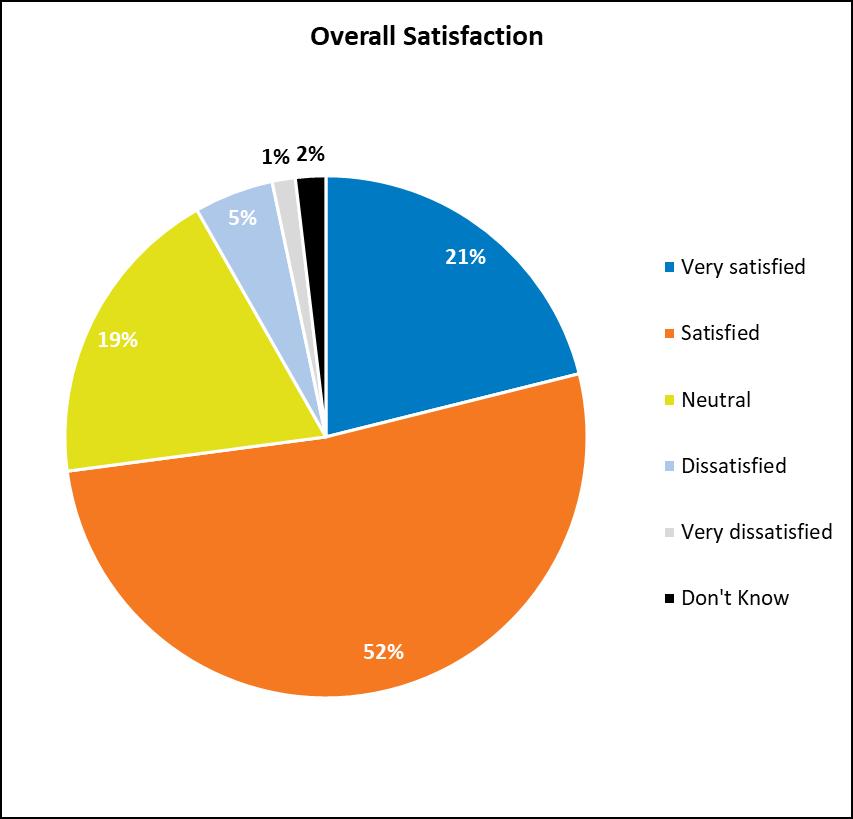
Question: 14
When combining Very Satisfied with Satisfied, respondents’ overall satisfaction with the County Parks and Recreation Division is 59% Only 8% of the respondents identified as Dissatisfied or Very Dissatisfied, which speaks highly to the perceived value that households receive from the Division’s offerings.
The local responses to this question are on a par with what the consulting team observed during the planning process. It is worth noting that Broward County is a major tourist destination. For this reason, it is extremely important that the County continue the decades of work to build a world-class park system. This contributes significantly to the County generating additional revenue to help offset general-fund program expenses. Some noteworthy examples are: overnight camping, golfing, aquatics facilities, adventure parks, endangered native habitats, educational and cultural activities, museums, and hospitality halls that create unique locations for weddings.
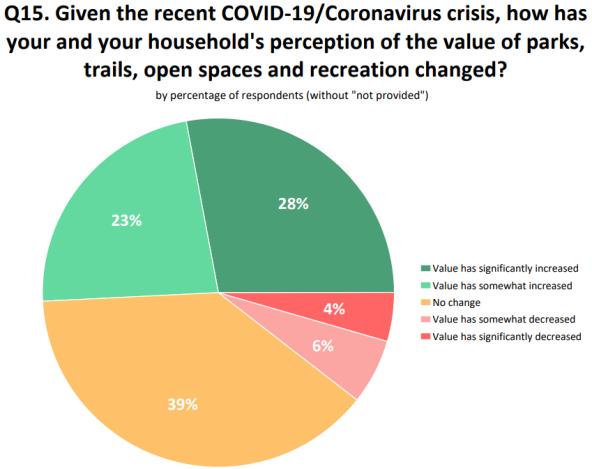
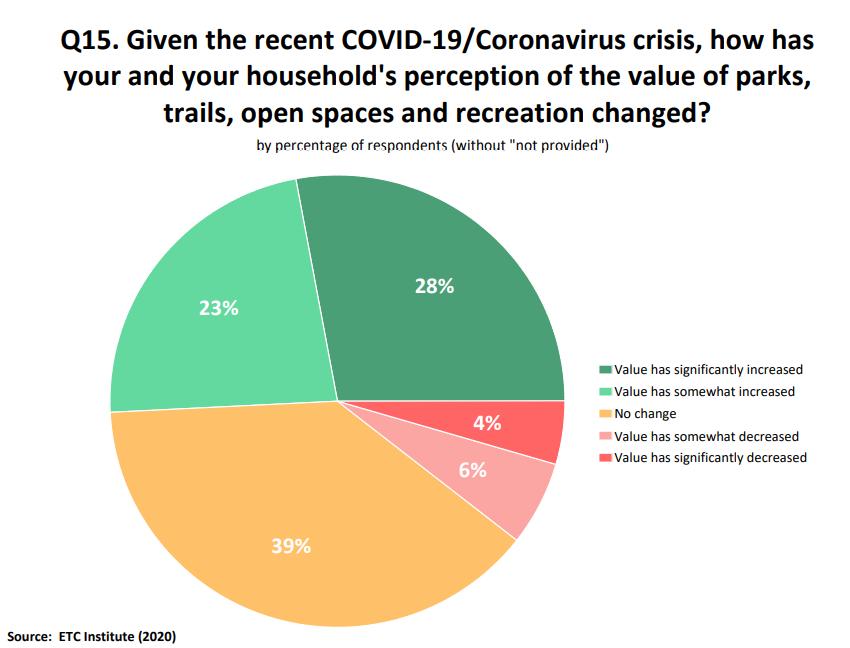
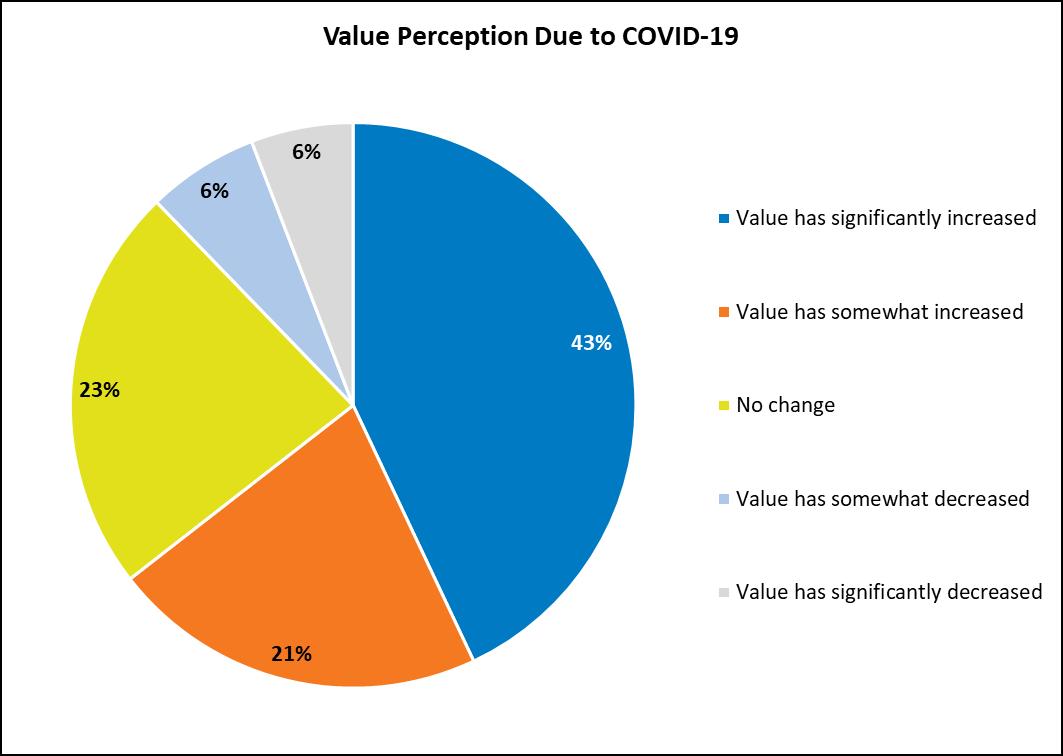
Question: 15
The Division has been adjusting to the County’s needs as the COVID-19 pandemic has evolved. In many instances the Division serves as an integral part of the emergency responses in the County. During the stay-at-home orders, parks and recreation facilities that were open air were able to open with protocols in place, thus providing the community with much-needed access to outdoor spaces.
Based on the responses, the perceived value of parks, trails, open space, and recreation has increased for more than half of all respondents (51%). This is a very encouraging sign for the Division. If this trend continues, it will help create greater advocacy and support for the Division and its offerings going forward.
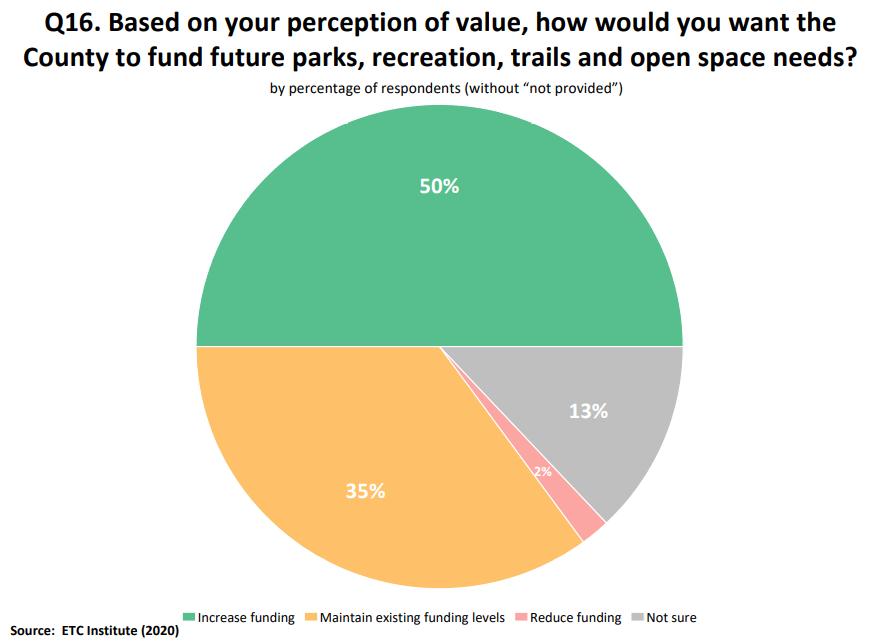
Question: 16
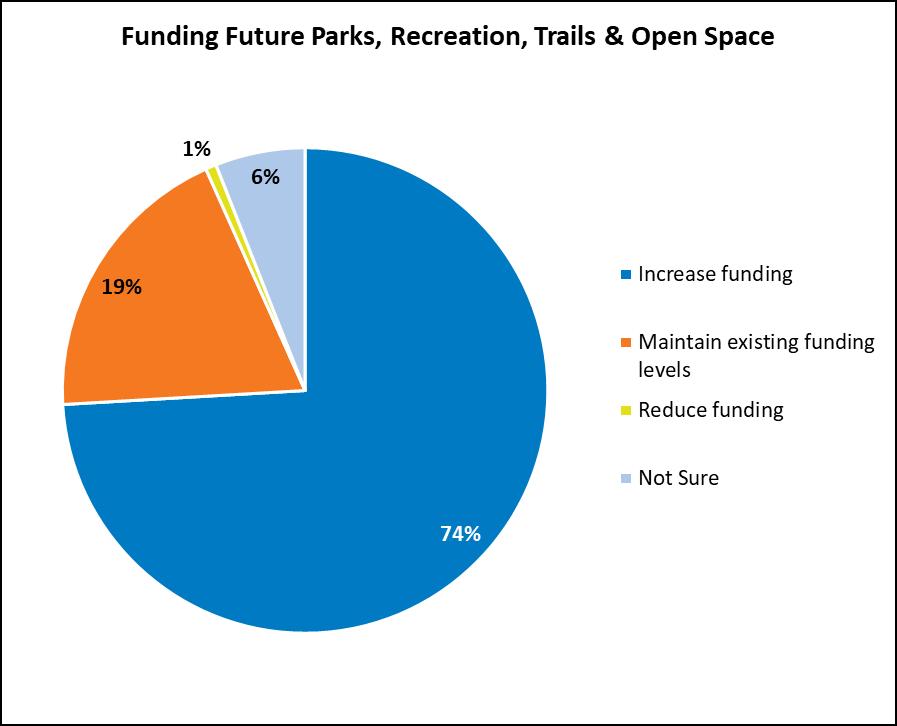
From the respondents who have stated that their perceived value of the Division’s offerings has changed positively, 50% would support an increase in funding while only 2% would consider reducing funding for the Division. With an increase in perceived value of parks, recreation, trails, and open space, it is likely to lead to a desire to increase funding, which is also a very encouraging sign for the Division’s long-term growth prospects.
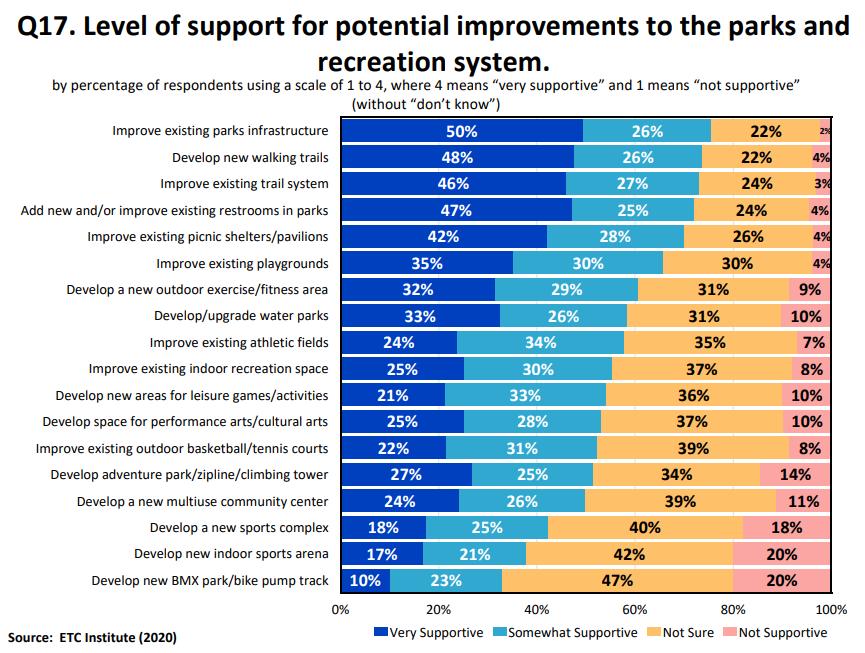
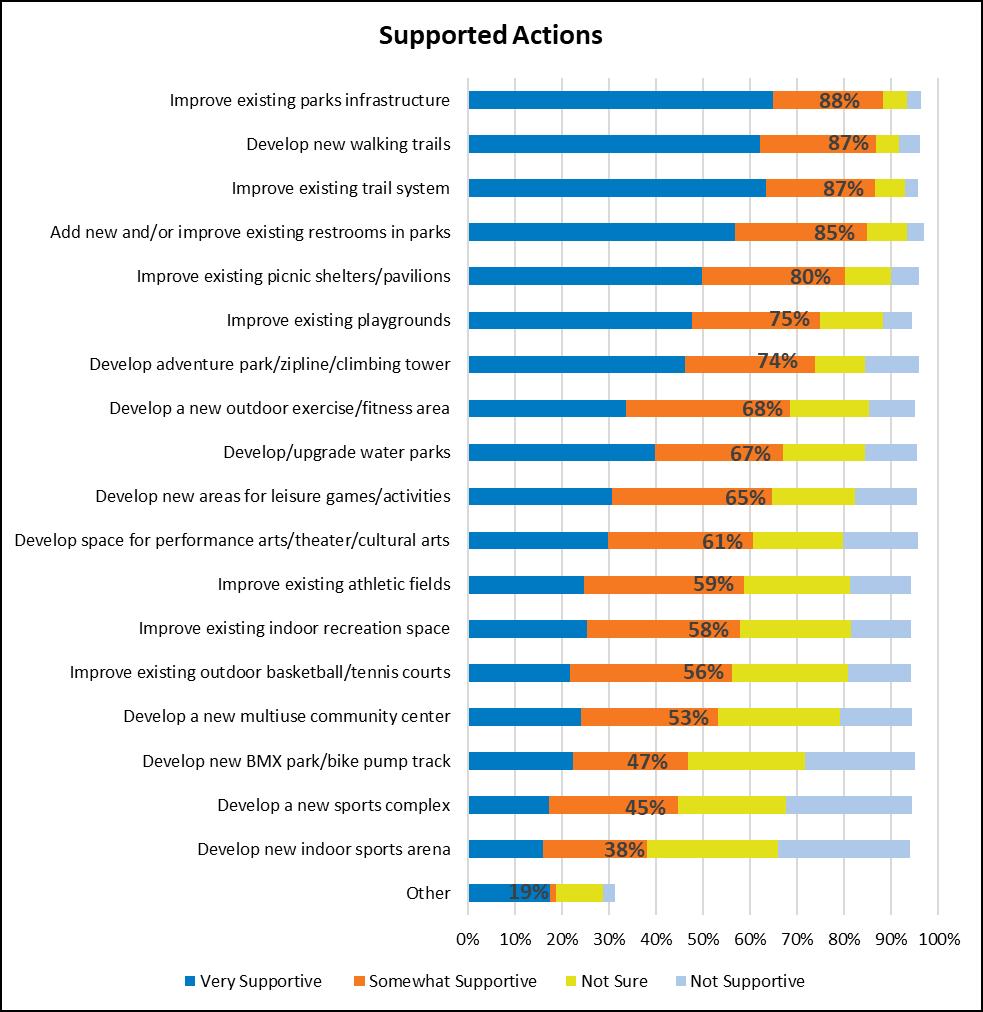
Question: 17
The dark-blue and light-blue bars in the graph below identify with respondent’s choice of Strongly Agree and Agree. The top three supported actions are Improve existing park infrastructure (76%), Develop new walking trails (74%), and Improve existing trail system (73%). It should be noted that five of the top six actions are to improve existing facilities and amenities.
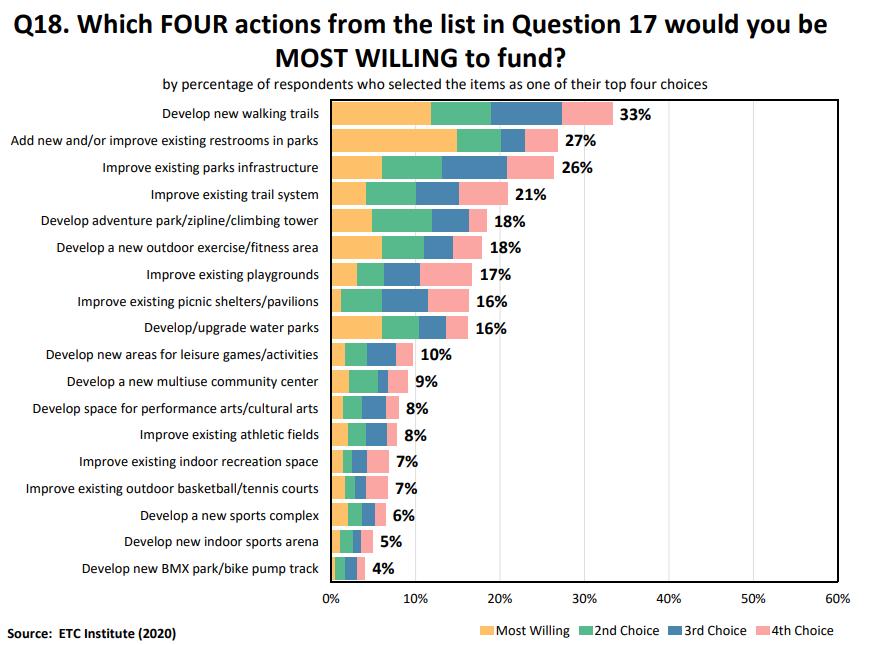
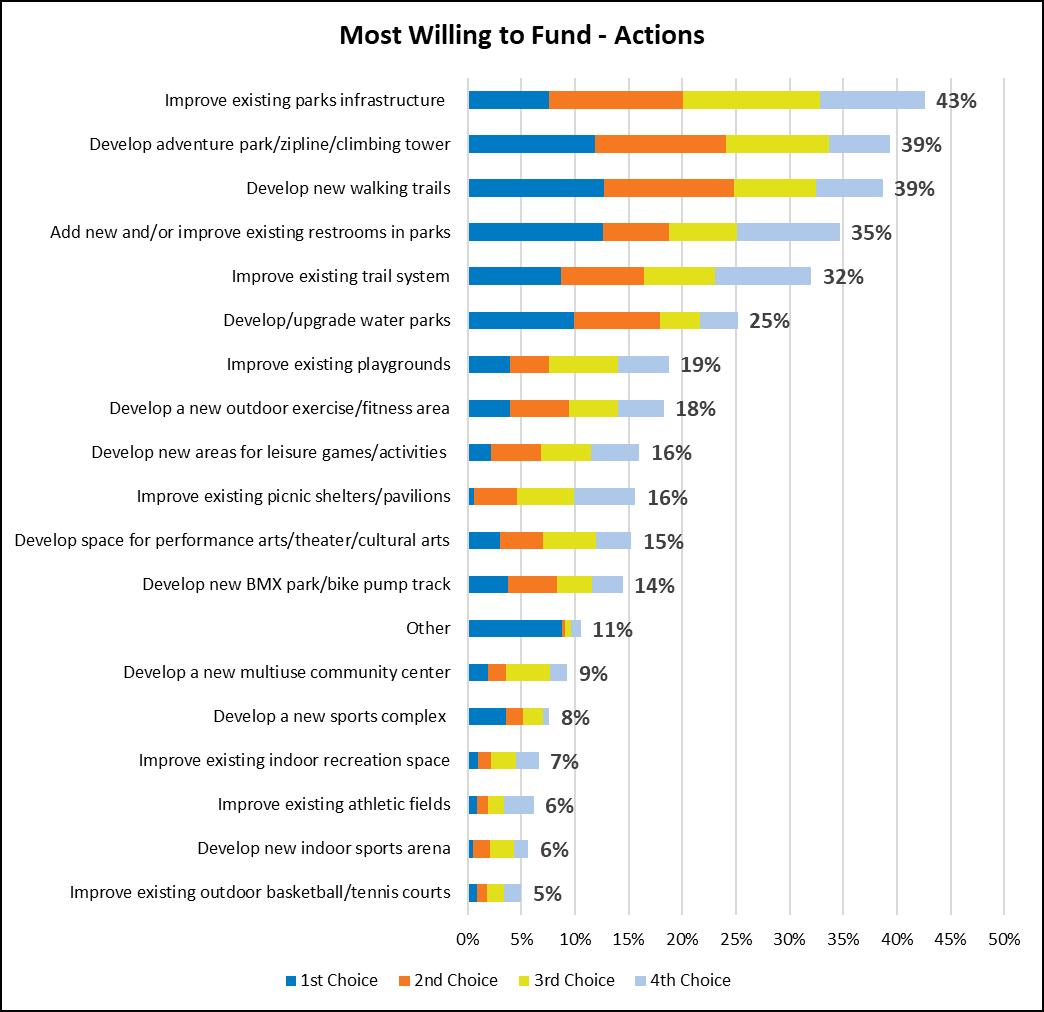
Question: 18
Of the actions from the previous question, the top four actions survey participants are most willing to fund include Develop new walking trails (33%), Add new and/or improve existing restrooms in parks (27%), Improve existing parks infrastructure (26%), and Improve existing trail system (21%).
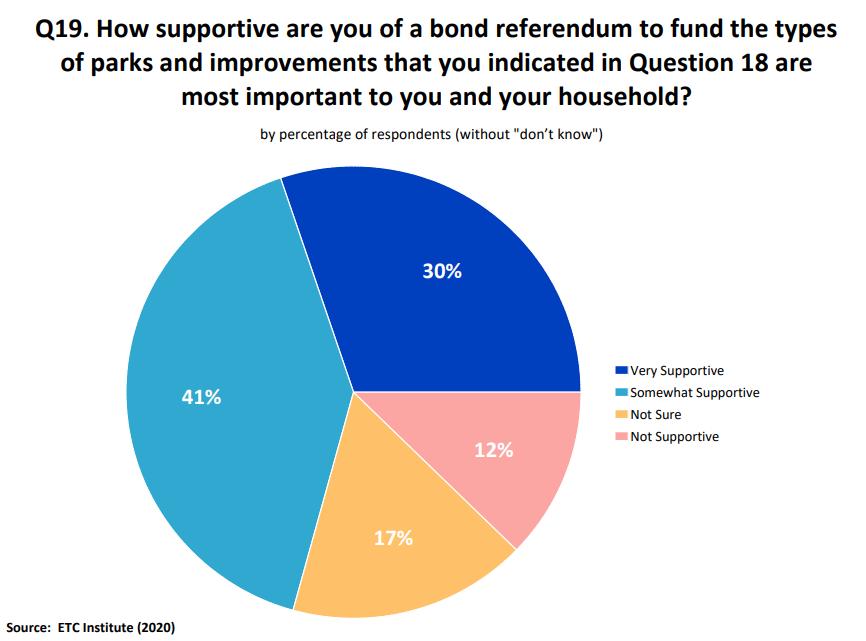
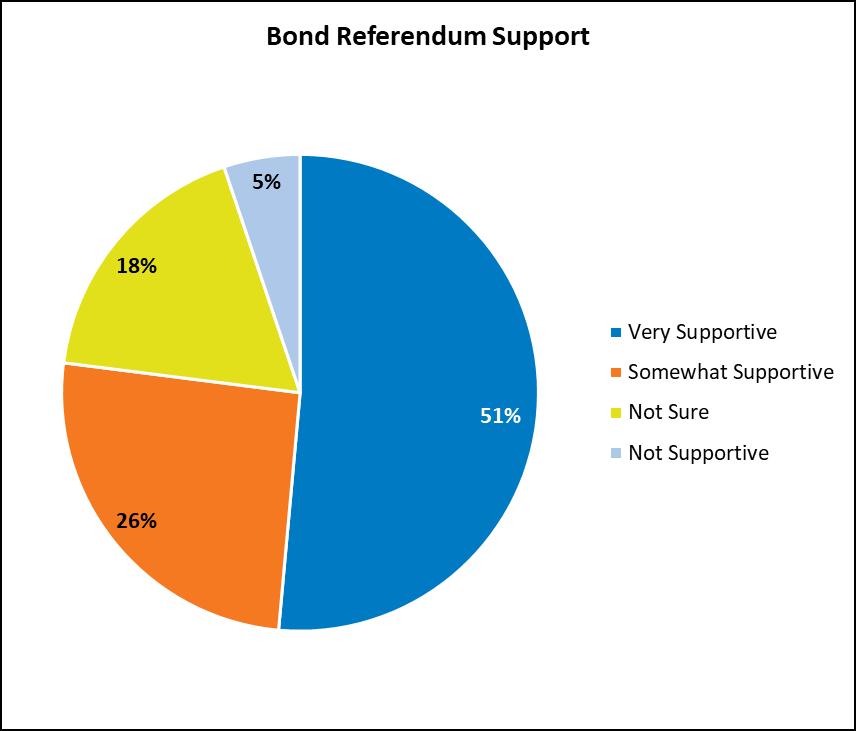
Question: 19
When combining results from respondents stating they are Very Supportive and Somewhat Supportive of a bond referendum, nearly three out of four (71%) respondents support the bond. Only 12% of the respondents do not support the bond. This is a strong representation and is most likely driven by the vast majority of respondents being users and appreciating the existing facilities and amenities.
The survey also asked respondents for opinions on what major investments the Division should consider, as well as how they would prefer to allocate the funding for these projects. Those responses and the response to this question demonstrate that respondents value parks and recreation enough to contribute financially to their desired outcome.
2.4. Electronic Community Survey
2.4.1. Methodology
In addition to the statistically valid survey, the Division conducted an electronic survey powered by SurveyMonkey. The purpose was for a better understanding of the characteristics, preferences, and satisfaction levels of residents, and especially existing parkgoers. The survey was available from May 26, 2020, through September 10, 2020, and received a total of 2,913 responses.
The electronic survey emulated the statistically valid survey questions distributed by ETC. This allowed all residents the opportunity to be part of the public input process in a comparable manner. It must be kept in mind that the results of this survey are not a statistically valid data set since they were not randomized. Electronic community survey results can be found in Appendix H
2.4.2.
Conclusion
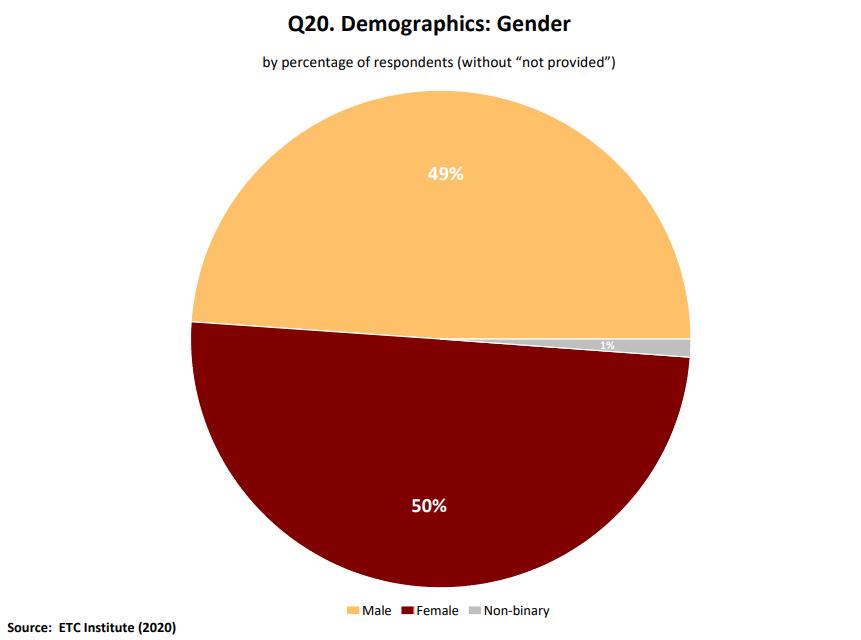
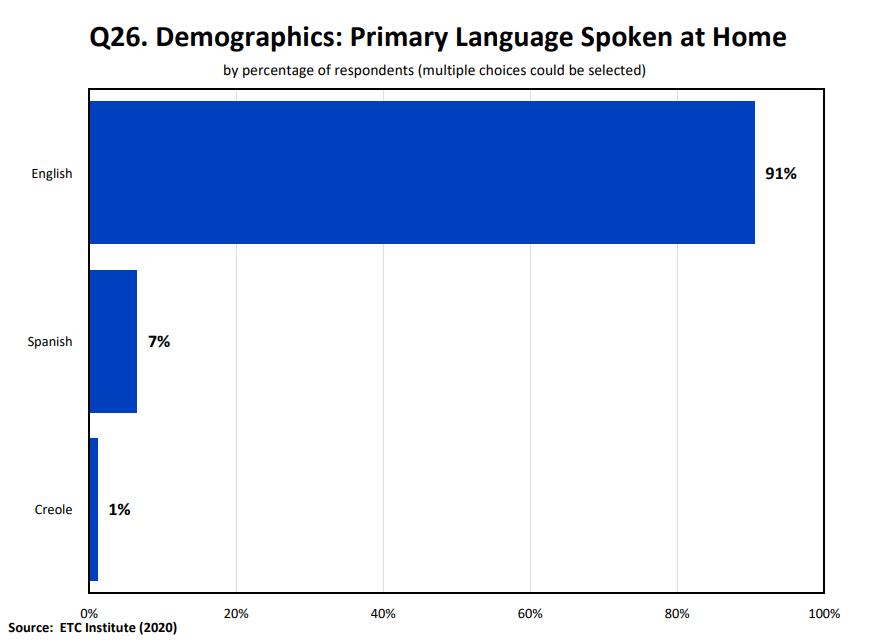
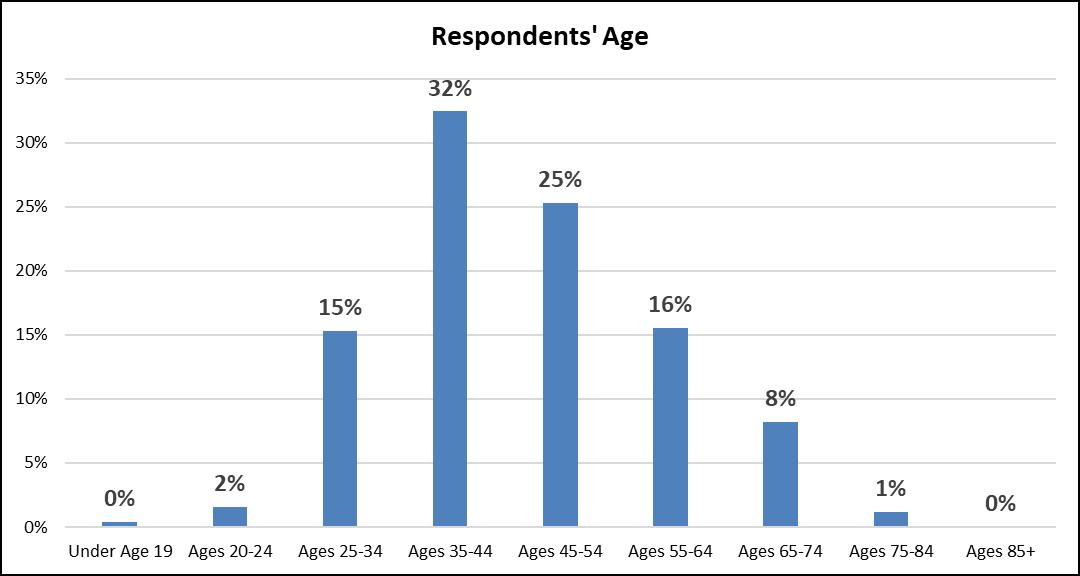
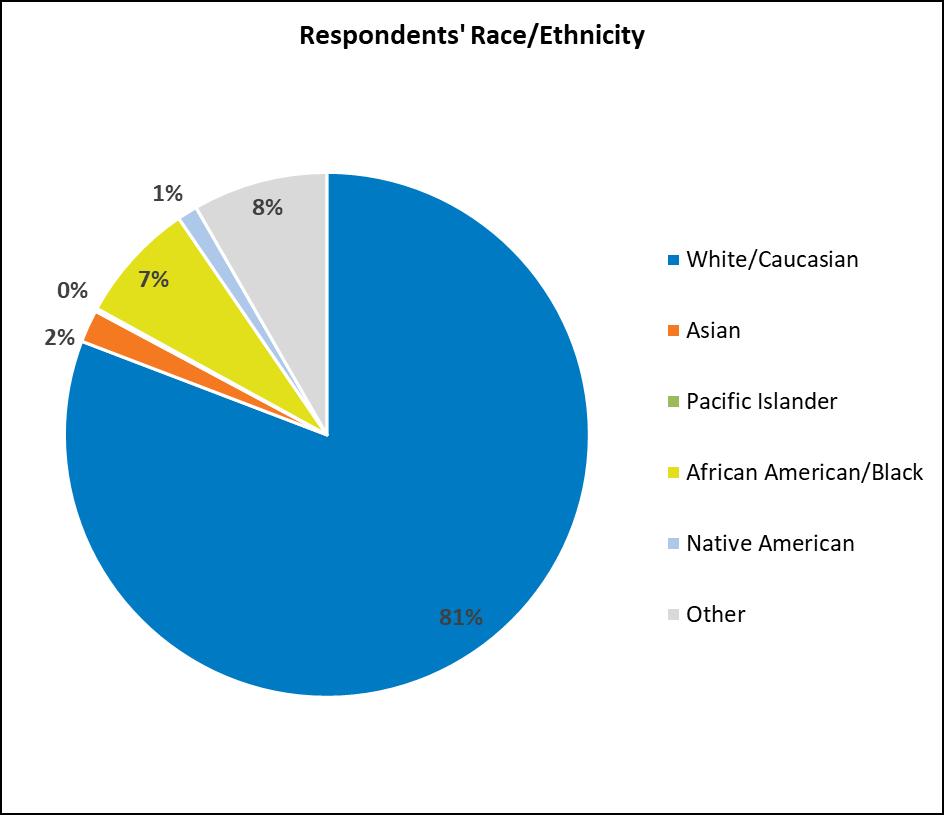
The PROS Consulting team recognizes that the survey was completed by a majority of individuals (96%) who are users of the parks/facilities in varying age segment representation. Of the respondents, 81% were White/Caucasian and 65% were female. These characteristics do not fully reflect the County’s demographic. As a result, the responses are skewed to some degree based on a greater than average population of park users, those with access to digital mediums, and with less diversity than the overall County population.
It is important to compare and contrast the online survey findings with those of the statistically valid survey, which is scientific in nature. It is equally important to know that these surveys were launched at separate times. The following represents additional key takeaways based on the electronic survey results:
Parks, Facilities, and Amenities
Thirty of the parks/facilities are used by less than 1% of the population.
Of the park users, 47% visit a park at least one to five times a week and a majority rate parks’ physical conditions as a combination of Excellent and Good (89%).
Low attendance numbers are mostly attributed to restrictions and apprehension during COVID-19.
The facilities and amenities in high demand include Multiuse paved and unpaved trails (45%), Open space conservation areas (37%), Small neighborhood parks (36%), and Observatory (36%). However, when asked which facilities or amenities are the most important, respondents chose Accessible parks/walking trails (38%), Multiuse paved and unpaved trails (33%), Mountain bike trails (20%), and Playgrounds (18%).
Communication
Current programs and park services are primarily learned of through Word of Mouth (85%), County Website (57%), and Social media (43%). However, respondents would prefer Social media (54%), County Website (49%), and Emails (47%) going forward. It is important to remember that digital media influences Word of Mouth. In social settings, residents are sharing what they have received and read from the County.
Programs
In the past 12 months, 41% of the respondents have Participated in programs. Of those respondents, 21% Participate once per year, 59% Participate two to three times per year, 14% Participate four to six times per year, and 6% Participate seven or more times per year
Combining ratings of Excellent and Good, respondents indicated they are Extremely satisfied with program quality (92%).
Top three barriers for program participation include I don’t know what is being offered (48%), Too busy/not interested (25%), and Prefer individual activities (16%).
Respondents have a high interest in Food events (66%), Entertainment (50%), and Holiday celebrations (37%).
The top four program needs include Adult fitness & wellness programs (51%), Exercise classes (36%), Senior programs (29%), and County special events (28%).
Reflecting on the most important programs selected, Adult fitness & wellness programs (36%), Exercise classes and Senior programs (20% each), County special events (14%), and Cultural enrichment programs (13%) were the top priorities.
Funding
Respondents support Improvements/maintenance of existing parks, pools, and recreation facilities ($26 average from $100), and Acquisition & development of walking and biking trails ($22 average from $100).
COVID-19 has increased the perception of the value of parks, trail, open spaces, and recreation significantly for more than half of the respondents (51%).
Due to the perception of value, 50% of the respondents support an increase in funding for the County.
The top three supported actions include Improve existing parks infrastructure (76%), Develop new walking trails (74%), and Improve existing trail system (73%).
Actions most willing to fund include Develop new walking trails (33%), Add new and/or improve existing restrooms in parks (27%), Improve existing park infrastructure (26%), Improve existing trail system (21%), Develop adventure park/zipline/climbing tower and Develop a new outdoor exercise/fitness area (18% each).
Respondents are supportive of a bond referendum (71%) to fund the types of parks and amenity improvements that are most important to them.
2.5. Website Analytics
To ensure the general public was informed of the Master Plan and could stay updated on the latest public input meetings or technical report releases, a dedicated website was released at www.BetterParksBetterBroward.com. This platform was fully ADA accessible and made to work well using any method a person might prefer, whether that was laptop, cell phone, tablet, or desktop computer.
Promotion was done with banners were created and placed strategically for maximum visibility throughout Division parks as well as using social media and email blasts. If someone missed the in person or virtual public input meetings, they could provide comments using a private contact box on the website which was directed to the consulting team.
Chapter Three Evaluation of Division Infrastructure & Greenways Program
3.1. Evaluation of Division Infrastructure
3.1.1.
Park Inventory & Assessment
The consultant team conducted in-person site assessments of 47+ County properties. These assessments established a baseline understanding and summarization of the system’s existing conditions and amenities at the time of the visit. These assessments, technical research reports using input from data sources such as ESRI and Trends data shared in Chapter 2, the community recommendations, and action strategies are all used to assist with this Master Plan.
METHODOLOGY
The consultant team used a site assessment form to document observations. One form was completed for 47 parks within the Broward County Parks and Recreation system. A questionnaire was also sent to each park’s lead manager to incorporate their knowledge and vision. The site assessment form includes:
General description
Park classification and observed use
First impressions
Access and visibility
Site structures and amenities
Site/amenity conditions
Site furnishing conditions
General landscape/hardscape
Signage
National Recreation and Park Association (“NRPA”) 3 Pillars: Health and Wellness, Conservation, and Social Equity
Any identified corrective actions needed
Planned capital improvements
Strengths, challenges, and opportunities
Park conditions were rated using a differential scale of excellent, fair, or poor with a grading component. The table below provides the condition descriptions utilized in this analysis.
Rating General Description
Excellent
Score: 3
Fair
Score: 2
Poor
Score: 1
Facilities/amenities are in excellent condition with little to no maintenance issues noted. Facilities do not feature any major design issues that contribute to diminished use or maintenance.
Facilities/amenities are in good condition and feature only minor maintenance issues. Generally, most maintenance issues appear to be the result of age and/or heavy use. Facilities may only feature minor design issues that contribute to diminished use or maintenance (i.e., drainage, structural, utilities, etc.).
Facilities/amenities are in poor condition and indicate ongoing maintenance issues that may ultimately result in suspended use for repair/replacement. Maintenance issues with these facilities are the result of age and heavy use. These issues are compounding over time due to deferred maintenance resulting from budget and/or resource limitations. Facilities may feature major design issues that contribute to diminished use or maintenance (i.e., drainage, structural, utilities, etc.).
GENERAL COMMENTS FOR PARK SYSTEM
In some cases, a detailed master plan for the entire site is necessary to meet the County’s needs.
General maintenance is required throughout parks. Continue to implement the Asset Management Program (AIM) to achieve better results.
Most site furnishings and equipment require cleaning, upgrading, or servicing. Update existing interpretive signage, benches, bike racks, and waste receptacles. Convert drinking fountains to bottle-fill stations and add bike fix-it stations to accommodate and encourage cyclists on the County greenways.
Develop park-specific deferred maintenance plans to address the backlog of current maintenance issues.
Continue to assess parks for ADA compliance and address deficiencies.
Conduct an in-depth analysis of existing parks for compliance with Crime Prevention Through Environmental Design (CPTED) standards.
Increase native tree canopy for shade and aesthetics; and to benefit wildlife, lower CO2 levels, reduce greenhouse gases, carbon monoxide, ozone, and more.
Identify mowed areas throughout the parks system that could be converted into locally native wildflower and native plantings to improve conservation efforts.
Coordinate with municipal engineering departments and the Surface Water Management Program for shared project opportunities.
Establish a digital transformation strategy throughout the park system to incorporate Wi-Fi access, solar-power charging stations, educational opportunities, asset management, gaming integration, and trail tracking. Technology improvements should include security monitoring, lighting, and energy efficiency.
For all outside basketball courts, move to covered and lighted basketball courts throughout the park system. Look at existing partnerships to assist with installing solar.
Potential for revenue, rent out an entire nature center for special events, more than just the hospitality halls.
Where parking is a big issue, evaluate parking fees and/or combining technology to collect entrance fees and promote intermodal transportation with walking and biking to parks.
LESSONS & RECOMMENDATIONS FROM THE COVID-19 PANDEMIC
The community has turned to parks and recreation areas for healthy outdoor physical activity and relief from the worries and pressures of the pandemic on them and their families. Openness and availability of these areas has shown to be critical to the health and well-being of residents.
National surveys have shown a sustained increase in visitation, trail usage, and the value of local park systems.
Expand the footprint of Broward County Parks with additional dog parks, splash pads in larger parks without pools, and outdoor fitness equipment to regional parks and natural areas, if appropriate.
In 2019, the Division took steps to reinstate the Parks Ranger Program to ensure a safe and enjoyable experience for park visitors. Four Parks Rangers were hired in 2020 to assist parks’ employees with compliance and enforcement of County ordinances and rules, service management, special-event management, and general
park operations. This service was crucial during the pandemic to help mitigate increased user conflicts. The Division should continue to build upon the current Parks Ranger Program, as funding permits.
Replace outdated drinking fountains with hands-free bottle-filling stations.
Consider adding hand-washing stations outside of restrooms, perhaps connected to the water bottle-filling stations.
Include additional natural play areas and be mindful of “small footprint, high occupancy” play equipment.
Develop regular cleaning schedule for park equipment, site furnishings, and play areas.
Transition to self-cleaning restrooms.
Add sanitizing stations to outdoor exercise areas.
Urban Broward County (defined as the land east of the Water Conservation Areas, i.e., “the Everglades”) is 97% developed and contains only 3% of the original natural areas. The majority of the remaining natural areas are protected conservation areas within parks. This is due to the Division’s leadership in environmental management and education. The challenge is to make conservation areas accessible on the west side of the County without disturbing the natural areas. The Division should work to include pedestrian trails, access points, boat ramps, environmental education programs, and recreational amenities, where appropriate.
Manage the Parks’ natural areas, including invasive species management, use of prescribed burns, endangered species management, and wetland rehydration for the long-term viability and resilience of these ecosystems, and the plants and animals that depend on them.
Prioritize invasive species management and reduce invasive plant species to less than 5% coverage, which is essential to protect the ecosystems within all parks. Consistent funding sources for this work must be identified and secured.
Preparing the parks infrastructure for a changing climate is essential for long-term resilience and adaptability.
Enlist federal, state, and local public/private partnerships to use mitigation credits. Shared project opportunities exist for the Division to coordinate with other County agencies, such as the Engineering Division, Resiliency Division, and Water and Wastewater Division.
Address several current sea level rise/flooding issues in planned capital improvements:
o Easterlin Park’s western weir and seawall project
o Anne Kolb, West Lake, and Hollywood North Beach Pocket Parks’ shoreline hardening projects
o T.Y. Park flooding
o Secret Woods boardwalk flooding
Implement a program of local and site appropriate native landscaping to enhance resiliency and habitat.
Host programs so participants can learn about the use of native plants in their home landscaping projects. Additional programs can be added to help identify exotic species, explain the damage they can cause, and recommend native alternatives.
SITE EVALUATIONS SUMMARY MATRIX
The following sites were not included in the scoring summary because they are not open to the public and have no structures or amenities:
o Crescent Trail Natural Area
o Pond Apple Slough
o Coconut Creek Maple Swamp
2
ANNE KOLB NATURE CENTER
Location: 751 Sheridan St., Hollywood Size: 1,501 acres
Type: Nature Center
Basic Improvements Estimate: $3,809,150
Reconstruction Estimate: $20,414,550
Anne Kolb Nature Center/West Lake Park is the largest park in the Division’s system and features approximately three miles of trails through mangrove communities along the Intracoastal Waterway. This park is less than one mile from the famous Hollywood Beach Broadwalk and two County regional parks, so it doesn’t need to expand its variety of amenities and services. However, its existing facilities and trails do need major renovations and updates to improve both the safety and aesthetics of the site. This park features a nature center that is the main draw. The structures on this property are of similar vintage and styles. The observation tower has recently been renovated. The other buildings require similar upgrades to bring the entire property up to the same level. This park has significant signage on the street. It is open and inviting and offers vistas of the water and adjacent mangroves. The Friends of Anne Kolb is a local volunteer group that assists with programming, invasive plant removal, native planting, litter collection, and fundraising.
ANNE KOLB NATURE CENTER
CONTINUED
Current, Planned, and/or Potential Projects:
Installation of ADA-compliant viewing telescopes at the top of the Observation Tower and on the Lake Observation Trail (Completed)
Replacement of streetlights (Completed)
Replacement of large aquarium and related displays in Exhibit Hall
Production of a new educational video for theater in Exhibit Hall
Replacement of cabinets in Exhibit Hall
Upgrade Mangrove Hall A/V system
Replacement of carpet in Exhibit Hall along with Bride and Groom Changing Rooms and Kitchen upgrades (in Planning)
Removal of storm shutters and installation of impact windows in Exhibit Hall
Replacement of exterior doors at exhibit hall, visitor center, and Mangrove Hall
Repair of concrete and asphalt pathways
Replacement of old boardwalks
Deficiencies and Recommendations:
Redesign entrance to include ADA-compliant multimodal path and address flooding/drainage
Replace boardwalk trails throughout park
Develop South Trail to add additional trail miles
Renovate amphitheater seating; include additional sail shade
Upgrade existing site furnishings throughout park
Modernize visitor center; include infotainment in lobby
Repair and upgrade exhibit hall aquarium
Repair paved walkways and trails throughout park
General maintenance required for most buildings
Mangrove Hall restrooms are not ADA compliant
2
BOATERS PARK
Location: 2450 Ravenswood Rd., Dania Beach
Size: 7.5 acres
Type: Regional Park
Basic Improvements Estimate: $174,000
Reconstruction Estimate: $3,042,128
Until recently, this park was accessible only by boat. A new parking lot was completed to allow car and pedestrian access. The site features fishing and picnic areas, with 1,200+ feet of dock accommodating 35 to 40 boats under 30 feet in length. A couple of the docks will be converted into fishing piers.
Existing Structures and Amenities:
Current, Planned, and/or Potential Projects:
New parking lot with 57 spaces (Completed)
Dock for canoe/kayak launch
Replacing trash receptacles and picnic tables (Completed)
Repair existing asphalt walkways (Completed)
Replacing perimeter fencing
Convert (two) docks into fishing piers
Will need to reimburse Broward Boaters Improvement Program (BBIP) for fishing pier costs
Deficiencies and Recommendations:
Vegetation management needed to increase native species and remove invasive species
Replace/repair paved sidewalks and address ADA deficiencies (Completed)
Add pedestrian bridge across canal to connect with the west side of the park
1
BOULEVARD GARDENS
COMMUNITY CENTER
Location: 2870 N.W. Fourth St., Fort Lauderdale Size: 1.5 acres
Type: Neighborhood Park
Basic Improvements Estimate: $293,480
Reconstruction Estimate: $2,320,000
Boulevard Gardens Community Center is a pet-friendly neighborhood park located within the Broward Municipal Services District. The community center offers free programs to community members of all ages. The site features a basketball court, playground, biking/jogging/walking paths, picnic areas, and facility rentals. Major renovations and reconstruction are necessary to reach this park’s potential and support the neighborhood’s needs. This park is in a suburban setting. The entrance is signed, similar to most parks, and with sufficient parking. The main building on this property is a well-maintained modular structure scheduled to be replaced by a recently acquired adjacent residential building. The other structures on the property are open-shade structures in adequate repair.
Existing Structures and Amenities:
Current, Planned, and/or Potential Projects:
Remodeling of recently purchased house to make a new community center (Completed)
New basketball court is under construction
Landscaping, patio shade, and shelter upgrades (in Planning)
BOULEVARD GARDENS COMMUNITY CENTER
CONTINUED
Deficiencies and Recommendations:
Create a master plan for the entire site to enhance services and experience and establish a deferred maintenance plan to address the backlog of current maintenance issues.
Develop site on west side of park, across N.W. 28th Way. This could be an outdoor exercise area or a dog park.
Playground and pavilions will need upgrading in five to 10 years.
More in-depth analysis of existing parks for compliance with Crime Prevention Through Environmental Design Standards.
Upgrade existing fencing, benches, bike racks, trash receptacles, and convert drinking fountains to bottle-fill stations.
Increase native tree canopy for shade and aesthetics.
Renovate parking lot and expand availability.
Develop volunteer group in local neighborhood, which may help increase awareness of park programs and amenities.
Add dog-waste stations.
Basketball court/hoop in west parking lot is in conflict with traffic and poses a safety risk for visitors. Once the community center is relocated, add a new basketball court to that area.
1
BRIAN PICCOLO
SPORTS PARK & VELODROME
Location: 9501 Sheridan St., Cooper City
Size: 175.2 acres
Type: Regional Park
Basic Improvements Estimate: $13,302,250
Reconstruction Estimate: $36,006,400
Brian Piccolo Sports Park prides itself as one of Broward County Parks' primary centers for athletic activity. The park’s velodrome is one of three in the southeastern U.S. and the only one in Florida. Surprisingly for such a busy park, it is also a site on the Great Florida Birding and Wildlife Trail. While it offers many different amenities and programs, the park is outdated and needs major updates to enhance the aesthetics and provide a more enjoyable experience for its visitors.
BRIAN PICCOLO SPORTS PARK & VELODROME
(CONTINUED)
Current, Planned, and/or Potential Projects:
Soccer 5 (Completed)
Deficiencies and Recommendations:
GENERAL
Add pedestrian ingress at main entrance and from adjacent neighborhood for safety and convenient access for local community.
Upgrade existing benches, bike racks, trash receptacles, and convert drinking fountains to bottle-fill stations.
Add cricket field, natural pitches, and update with artificial turf fields.
Upgrade signage/wayfinding and entire lighting throughout the park to efficient LED.
Significant repairs are needed for the gatehouse.
Increase tree canopy and native landscaping to provide more shade and improve aesthetics.
Improve current parking surfaces and expand parking availability.
Further coordinate Stormwater and Parks Master Plan for shared facilities opportunities.
Further coordinate with the County’s Resilient Environment Department regarding the tidal flooding issue.
More in-depth analysis of existing park for compliance with CPTED.
BASEBALL/SOFTBALL COMPLEX
Replace fencing, seating, shade structures, and nets
BASKETBALL COURTS
No Action – Recently reconstructed PLAYGROUND
Repave sidewalks; improve shade, seating, furnishings, and play equipment
RESTROOMS
Upgrade fixtures, furnishings, paint, and lighting
TENNIS/RACQUETBALL COURTS
Consider renovating to include pickleball courts
Educational component is needed
VELODROME/ROAD COURSE
Fully renovate; refer to the Dick Lane Velodrome in Atlanta for inspiration
C.B. SMITH PARK
Location: 900 N. Flamingo Rd., Pembroke Pines
Size: 296.2 acres
Type: Regional Park
Basic Improvements Estimate: $24,265,750
Reconstruction Estimate: $83,077,750
C.B. Smith Park is a regional park responding to the diverse needs of the southwest portion of the County. The site appears to be well used, offering a water park, campground, family golfing center, tennis complex, water-skiing and wakeboard lessons, and a large special event area with a capacity of up to 22,500. This park has well-defined signage on the approach. The gated entrance is in need of maintenance. Most buildings on this property are in need of maintenance or replacement. They are of mixed construction and styles. C.B. Smith served as one of the benchmark parks for the systemwide site assessment. As one of the County’s key parks, this site should be a top priority in the planning process. It hosts an annual concert that draws up to 22,000 patrons, and attendance approaches 1.1 million visitors per year. Investing in the campground, water park, and Concert Green will increase revenue, which reached more than $4 million in 2019.
Existing Structures and Amenities:
C.B. SMITH PARK (CONTINUED)
Current, Planned, and/or Potential Projects:
Main office flooring replacement
Playground replacement
Gatehouse renovations
Tennis clubhouse interior renovations
Lagoon water playground installation
Concert Green fencing
Re-asphalting walking paths
Removal of marina
Replace lifeguard breakroom
Deficiencies and Recommendations:
GENERAL
Redesign queue at main entrance to alleviate traffic and increase entry flow
Install pedestrian entrance for safer access to the park
Second entrance on Pines Boulevard used only during weekdays; consider using as secondary weekend entrance to assist with traffic flow
Replace park maintenance building and renovate, and replace park office
Improve and upgrade wayfinding throughout the park
Upgrade existing street lighting, benches, trash receptacles, and drinking water/bottle-fill stations in three to five years
Increase native tree canopy for shade and aesthetics
Improve current parking surfaces and expand parking availability
Address flooding and/or drainage issues at shelter #2, campsites #25-28, and Funbrella sites #8-9
AMPHITHEATER
Upgrade exterior façade, electrical infrastructure, lighting, and stage (Completed)
Replace fencing (Completed)
Repair asphalt walkway (Completed)
BASKETBALL COURT
Provide additional seating opportunities/benches
Increase tree canopy and provide shade surrounding the court
C.B. SMITH PARK
(CONTINUED)
BOAT RAMP
Consider expanding water-ski/tubing service
Upgrade boat ramp and provide vendor with electric, storage, and signage
Current vendor willing to assist with expense of upgrades/additional storage
CAMPGROUND
Expand campground to increase park revenue
FISHING DOCK/PIER
Building structure is primarily wood timber construction
Deck, dock, and piers are wood and in need of repairs
Some of the planks and piles need repairs
GOLF FACILITY
Maintain leasing relationship and extend agreement to continue offering the AllGolf services, but with more recent trends in golf, such as tracer balls, food service, targets, etc.
OUTDOOR FITNESS FACILITY
Repair/replace equipment with apparent rust
Provide additional shade sail PAVILIONS
Three types of pavilions: 1. All-wood structure with wood-truss roof; 2. All-wood structure with timber-framed roof; 3. Concrete-framed structure with wood roof.
Wood roof decking is covered with painted metal. Some of the metal roofs are standing seam and others are ribbed. Some wood-truss structures have been repaired with plywood.
There are signs of decay of the sheathing on the underside of the roofs.
PICKLEBALL/TENNIS COURTS
Increase number of water bottle-refill stations in surrounding area
Consider adding shade sails to two courts to allow play during rain or hotter days
Surface will require painting in the next five years
PLAYGROUNDS
Upgrade play equipment and surfaces
Repair sidewalks leading to the play area
Increase native tree canopy for shade and aesthetics
RESTROOMS
Upgrade fixtures and accessories, i.e., paper and soap dispensers
SAFETY TOWN
Replace pergola structures
Bolt down benches
WATER PARK
Master plan improvements and determine if continued use or replacement is more beneficial
Renovate splash pad structures
Repair main waterslides
Expand lazy river and enhance landscaping
Larger breakroom and additional training space needed for employees.
o Current breakroom, pictured below, is not adequate for the 60+ employees using it on any given day
One to two additional time clocks needed for employees
Consider expanding to the north (at the current marina)
Update/upgrade the attractions
o Each water playground structure is past its expected lifecycle
Repair concrete walkways and surface damage
CENTRAL BROWARD PARK & BROWARD COUNTY STADIUM
Location: 3700 N.W. 11th Place, Lauderhill
Size: 109.4 acres
Type: Regional Park
Basic Improvements Estimate: $16,717,050
Reconstruction Estimate: $23,316,000
Serving one of the most culturally diverse areas of the County, this park offers a wide variety of amenities including an internationally recognized cricket stadium. The stadium allows for large events and the fields are well maintained, but more shade is needed for patrons and the Bermuda grass should be upgraded to artificial turf. This park has welldefined signage and a fenced entrance. Most buildings on this property are well maintained but of mixed construction and styles. With the planned and recommended renovations implemented, this park could continue to grow international tourism in the County, while providing the community with a prestigious regional park.
With the West Indies and the United States being awarded the hosting right for the first T-20 Cricket World Cup in the region (in Summer 2024), it is critical to invest in this venue at the earliest in order to ensure it can continue to play host to the world’s greatest cricket players as well as share the Broward County story with the global tourism and media markets. Additionally, it also projects this venue as an annual host for Major League Cricket set to be launched in 2023.
FAIR FAIR
FAIR FAIR FAIR
CENTRAL BROWARD PARK & BROWARD COUNTY STADIUM (CONTINUED)
Current, Planned, and/or Potential Projects:
Parking lot paving: stadium, aquatics, west side of park
Cricket pitch upgrades
Pool equipment and system upgrades
Fieldhouse A/C upgrades
Scoreboard improvements
Grandstands expansion
Locker room and Officials’ room renovations and expansion
Deficiencies and Recommendations:
Upgrade wayfinding and signage. Consider addition of a marquee sign.
Determine the feasibility of a parking garage on site or partner with a local provider (possibly the city) in close proximity.
Update lighting throughout the park to efficient LED
Upgrade existing site furnishings and technology.
Increase native tree canopy for shade, aesthetics, outside of the natural areas and away from active burrowing owl nests, and to improve conservation efforts.
Improve current parking surfaces and expand parking availability.
Renovate closed bridge connecting to West Ken Lark Park.
Upgrade and repair restroom furnishings.
Add outdoor fitness area.
Repave sidewalks and trails.
Resurface basketball courts and replace hoops.
Upgrade Bermuda fields to artificial turf.
Replace playground equipment.
Update slides and play features at water park.
3
COCONUT CREEK MAPLE SWAMP
Location: 3700 N.W. 59th Place, Coconut Creek Size: 9.7 acres
Type: Natural Area
Basic Improvements Estimate: -
Reconstruction Estimate: $50,750
The Coconut Creek Maple Swamp is closed to the public and serves as an aesthetic enhancement to the surrounding neighborhood. The main priority for this site is to manage the vegetation and exotic species.
Existing Structures and Amenities:
Current, Planned, and/or Potential Projects: N/A
Deficiencies and Recommendations:
Consider adding basic trail system and site furnishings to provide neighborhood access.
3
CRESCENT TRAIL (SITE 39)
Location: 3901 W. Hillsboro Blvd., Coconut Creek Size: 7.1 acres
The Crescent Trail Natural Area is accessible to the adjacent neighborhood only and closed to the public. The main priority for this site is to manage the vegetation and exotic species. Local residents complain about the homeless presence in the park, so gates are kept locked.
Existing Structures and Amenities:
Current, Planned, and/or Potential Projects: N/A
Deficiencies and Recommendations:
Consider ways to allow access to neighborhood without opening park to homeless and general public. If the County had a key fob system for residents to gain access to its parks systemwide, this could speed up entry at larger parks and allow for security at smaller sites. If a trail system is installed and maintained here at Crescent Trail, residents might be willing to pay a small fee for access.
2
CRYSTAL LAKE SAND PINE SCRUB
Location: 3299 N.E. Third Ave., Pompano Beach
Size: 24.26 acres
Type: Natural Area
Basic Improvements Estimate: $182,700
Reconstruction Estimate: $2,972,500
Current, Planned, and/or Potential Projects:
Exotic plant removal/vegetation management
New fencing
Naturalist-led programming
Deficiencies and Recommendations:
Address the low-hanging wires in the park
Resurface parking lot
Upgrade interpretive and wayfinding signage
Lengthen trail and add picnic areas in regions without rare plant populations
Replace site furnishings and add drinking water/bottle-fill station
The Deerfield Highlands Nature Preserve is a sandy scrub area with a playground and picnic area. ATV damage is present. Secure perimeter with a better fence to avoid trespassing and improve security. This park is in a suburban setting. The entry is signed, gated, and has adequate parking. The open shade structures on this property are well maintained. A nature trail with wayfinding could provide an opportunity for visitors to better explore the preserve.
Existing Structures and Amenities:
Current, Planned, and/or Potential Projects:
Exotic plant removal/vegetation management
Naturalist-led programming
Deficiencies and Recommendations:
Enhance entrance/exit, repair gate, and improve signage
Repair current parking surfaces and regrade sidewalks to be even with ground edges
Improve landscaping; create a trail
Replace turf at playground and add another sail shade
Replace site furnishings
2
DEERFIELD ISLAND PARK
Location: 1720 Deerfield Island Park, Deerfield Beach
Size: 53.3 acres
Type: Specialty Park
Basic Improvements Estimate: $350,000
Reconstruction Estimate: $6,800,000
This island park is open Friday through Sunday and accessible only by boat. It features a marina, hiking trails, and an outdoor classroom for environmental education. The trail system includes overlooks along the Intracoastal Waterway, a pollinator garden, and a natural play area. Local volunteers maintain the pollinator garden and are currently planning a fossil dig site. Improvements are needed at this site, but the logistics create an expensive and complicated process, mostly with getting materials to the island
Existing Structures and Amenities:
FAIR FAIR
FAIR FAIR POOR
DEERFIELD ISLAND PARK (CONTINUED)
Current, Planned, and/or Potential Projects:
Replace Mangrove Boardwalk (Completed)
Installation of ADA-compliant path from dock to building and pathways to connect all existing boardwalks and paths (in Planning)
Convert caretaker house to a nature center (in Planning)
Deficiencies and Recommendations:
Vegetation management needed. Hire a full-time natural resource manager to maintain and remove invasive species.
Add interpretive signage and improve wayfinding throughout the park.
Replace picnic tables and grills.
Rainfall is collecting in one area of the island, causing flooding at the information shelter and marina paths; hire a drainage expert to address flooding.
Replace docks and marina to address ADA deficiencies.
Develop ADA-accessible trail system and pathway to the nature center. Replace old boardwalk and add compacted gravel path.
Improve natural play area since the island does not offer a typical playground.
3
DILLARD GREEN SPACE
Location: 2699 W. Sunrise Blvd., Fort Lauderdale
Size: 3.93 acres
Type: Specialty Park
Basic Improvements Estimate: $398,750
Reconstruction Estimate: $616,250
On a busy street corner between a public high school and suburban neighborhoods, this public green space enhances the aesthetics of an area that gets heavy foot traffic. It serves its purpose well and needs minor improvements at this time
Current, Planned, and/or Potential Projects:
Electronic marquee (Completed)
Deficiencies and Recommendations:
Improve sod and landscaping; add native wildflower plantings, taking care around existing pines
Over-mowing and watering can kill large slash pines
Add fence or plant screening between park and northeast neighborhoods
Add park benches (Completed)
1
EASTERLIN PARK
Location: 1000 N.W. 38th St., Oakland Park
Size: 46.6 acres
Type: Regional Park
Basic Improvements Estimate: $2,472,250
Reconstruction Estimate: $19,981,000
Easterlin Park offers a variety of activities and services, the most popular being its disc golf course and campground. It has a signed, heavily wooded natural entrance. The campground is currently undergoing a renovation with plans to replace both restrooms and add electricity, water, and sewer to all sites. Most structures on this property are of similar vintage and style, and well maintained. This park is one of the County’s oldest regional parks, with cypress trees more than 250 years old. It is important to protect the wilderness as this site is developed.
Existing Structures and Amenities:
FAIR
EASTERLIN PARK
(CONTINUED)
Current, Planned, and/or Potential Projects:
Campground utility upgrades (Phase 1 Completed, Phase 2 in Planning)
Restroom, shower, and laundry facility at campground is under construction
Install water, sewer, and electricity at all campground sites
Install four water shut-off valves, one for each campground road
Construct new restroom, shower, and laundry facility at campground
New playground
Deficiencies and Recommendations:
Add pedestrian path to entrance/exit of park
Repave roads and sidewalks and some parking areas
Create boardwalk trail through park
Reconstruct new basketball court
Renovate volleyball court
Add new playground
3
EVERGLADES HOLIDAY PARK
Location: 21940 Griffin Rd., Fort Lauderdale
Size: 39 acres
Type: Specialty Park
Basic Improvements Estimate: $2,135,850
Reconstruction Estimate: $7,947,812
Everglades Holiday Park sits on the westernmost border of Broward County, at the edge of the Florida Everglades. It has recently transformed undergoing a major renovation ($15.8 million) that included the parking lot, boat ramps, restrooms, a corporate shelter, and various other improvements. The site is a unique tourist destination.
Existing Structures and Amenities:
Current, Planned, and/or Potential Projects: N/A
Deficiencies and Recommendations:
Replace the 1960 Visitors Center structure
Incorporate greenway trails and construct observation tower
Seek partnership on 13- and 23-mile trails
Consider incorporating overnight accommodations into the park experience. For example, campground, overnight EcoCabins, remote camping area
EVERGLADES HOLIDAY PARK
(CONTINUED)
EVERGLADES HOLIDAY PARK
(CONTINUED)
2
FERN FOREST NATURE CENTER
Location: 201 Lyons Rd. South, Coconut Creek
Size: 247.01 acres
Type: Nature Center
Basic Improvements Estimate: $3,495,950
Reconstruction Estimate: $8,098,250
Fern Forest offers a system of boardwalks, hiking, rental space, public art, and educational facilities. This large nature center is home to three-plus miles of trails through 10 different plant communities. Most of them are ground trails, but an ADA-accessible quarter-mile boardwalk trail is also available. The Cypress Creek Greenway, which runs from the Everglades to the Atlantic Ocean in Pompano Beach, leads to but does not connect into the park. Plant resource management and exotic plant removal are maintained by Fern Allies Inc. along with the Florida Trail Association and the Broward Chapter of the Sierra Club. This park has a rustic, heavily wooded natural entrance. All structures on this property are of similar vintage and style. The roof covering and wood siding help to identify and immerse the visitor in a natural environment.
Existing Structures and Amenities:
FAIR FAIR
POOR
FAIR
FAIR
FERN FOREST NATURE CENTER
(CONTINUED)
Current, Planned, and/or Potential Projects:
Replacement of the entrance/exit gates (Completed)
Replacement of four A/C units
o Two complete units on the roof have been replaced and two partial units (air handlers located downstairs) need to be replaced
Updating nature center displays
Road extension to create ADA-accessible path from boardwalk trail to butterfly bridge (Completed)
Conservation of the public art piece (Completed)
Upgrade Hall A/V system
Installation of water fountain/bottle filler at nature center (Completed)
Lift Station replacement and upgrade (in progress)
Service Road improvement project
Deficiencies and Recommendations:
Add pedestrian-only entrance for safety and an easy connection to/from the Cypress Creek Greenway
Improve accessibility of trails and boardwalks - paved connections from the center to all the trails/boardwalks
Redesign picnic areas in the parking lot
Renovate and expand parking lot (currently 48,000+ square feet)
Improve security by adding cameras to the parking lot (Completed)
Upgrade signage and wayfinding throughout the park, especially amongst ground trails (in progress)
Upgrade existing seating, trash receptacles, and add drinking water/bottle-fill stations
Replace 3,000 feet of boardwalk trails
Address flooding and drainage issues on the south side of the parking lot
Assess park for ADA compliance and address deficiencies
2
FRANKLIN PARK
Location: 2501 Franklin Dr., Fort Lauderdale
Size: 2.9 acres
Type: Neighborhood
Basic Improvements Estimate: $2,238,500
Reconstruction Estimate: $4,917,000
Franklin Park includes a variety of amenities and also offers free programming to the community. It features a community center with an indoor fitness center and recreation room with ping pong, a billiard table, and audio-visual equipment. The basketball courts are covered by a large steel structure and include lighting. This park is in a suburban setting. The entry is signed, similar to most parks, with adequate parking. The main building on this property requires additional maintenance. All other structures on the property share the same style and paint palette.
Existing Structures and Amenities:
Current, Planned, and/or Potential Projects:
Basketball courts resurfacing and backboards and rims replacement (Completed)
New fencing for perimeter
Remodel and enhance fitness center
Deficiencies and Recommendations:
Repair current parking surfaces
Upgrade existing bike rack, benches, grills, water fountains, and trash receptacles
Increase native tree canopy and native plantings
Add more picnic areas or community garden to open space in northwest corner
Replace hoops and nets at basketball courts
2
HELENE KLEIN PINELAND PRESERVE
Location: 4701 W. Hillsboro Blvd., Coconut Creek
Size: 12.97 acres
Type: Natural Area
Basic Improvements Estimate: $179,800
Reconstruction Estimate: $777,200
This small but diverse natural area features informative interpretive signage, a nature trail, gazebo overlook, and picnic area. The trail comprises a quarter-mile paved path through a combination of cypress swamp and two small marl prairies. The park has a signed and gated entry. It appears to be well maintained. The open structures on this property are of similar vintage and style. The painted metal roof helps to identify the property.
Existing Structures and Amenities:
Current, Planned, and/or Potential Projects: N/A
Deficiencies and Recommendations:
Clean and/or upgrade existing gazebo, benches, bike racks, trash receptacles, and signage
Add water bottle-fill stations and hand-washing stations
Expand entrance, parking lot, and picnic area to accommodate more guests
Improve neighborhood entrance and consider adding security cameras at entrances
FAIR
FAIR
FAIR
HELENE KLEIN PINELAND PRESERVE
(CONTINUED)
3
HERMAN & DOROTHY SHOOSTER PRESERVE
Location: 740 S.W. 64th Terrace, Margate
Size: 19.8 acres
Type: Natural Area
Basic Improvements Estimate: $725,000
Reconstruction Estimate: $1,450,000
Herman & Dorothy Shooster Preserve is a newly developed site opened to the public in Fall 2020. This park is less than one mile from the Cypress Creek Greenway. Trails could detour off the greenway to nearby natural areas like this one. Site furnishings were not yet installed at the time of the evaluation but were scheduled for installation. The park is signed, fenced, and gated. The architectural team did not visit this park.
Existing Structures and Amenities:
Current, Planned, and/or Potential Projects:
Native vegetation restoration and tree planting
Wetland rehydration through improving pump system installed onsite
Exotic plant removal/vegetation management
Naturalist-led programming
Installation of interpretive signs and site furnishings
Deficiencies and Recommendations:
Include historical information about the Shooster family with the interpretive signage
The boardwalk and gazebo are structurally sound but need pressure washing
2
HIGHLANDS SCRUB NATURAL AREA
Location: 4050 N. Dixie Hwy., Pompano Beach
Size: 34.33 acres
Type: Natural Area
Basic Improvements Estimate: $371,200
Reconstruction Estimate: $1,494,950
Because of its central location and close proximity to I-95, Highlands Scrub provides quick access to a rare Florida sand pine scrub community. It features a short trail and small picnic area. This park has a signed, gated, and fenced entrance. The buildings on this property are similar in style to other parks. The painted metal roofs help to identify and make the property cohesive.
Existing Structures and Amenities:
Current, Planned, and/or Potential Projects:
Exotic plant removal/vegetation management
Naturalist-led programming
Deficiencies and Recommendations:
Upgrade the fencing
Renovate parking lot
Update interpretive signage and site furnishings
Lengthen and repave trail sidewalk
Add security cameras to prevent crime or vandalism
POOR
FAIR
FAIR
FAIR
FAIR
HOLLYWOOD NORTH BEACH PARK
Including pocket parks (five) and Carpenter House
Location: 3601 N. Ocean Dr., Hollywood
Size: 69.54 acres
Type: Specialty
Basic Improvements Estimate: $5,121,000
Reconstruction Estimate: $21,352,500
Hollywood North Beach Park along with the Carpenter House and pocket parks noted below provide access to the Atlantic Ocean on the east side and the Intracoastal Waterway on the west side. The various sites have high activity and are in need of full redevelopment to better accommodate the current demand. The existing features include biking/jogging/walking paths, fishing, picnic areas, shelter and room rentals, and an observation tower. The historic Carpenter House serves as a marine environmental education center and is available to rent for small private events. The outlook tower at Hollywood North Beach Park was recently demolished.
Pocket parks included in this evaluation:
Green Park
Hawksbill Park
Kemp's Ridley Park
Leatherback Park
Loggerhead Park
HOLLYWOOD NORTH BEACH PARK
(CONTINUED)
Current, Planned, and/or Potential Projects:
Mooring field at Loggerhead (in Design)
Hawksbill flooding management (in Design)
Remodeling of concession and restrooms (in progress)
HVAC replacement and mold remediation at Carpenter House (Completed)
Parking Management Agreement (being drafted)
Pocket Park restroom upgrades (in Planning)
Deficiencies and Recommendations (for all sites):
Renovate main entrance/exit and main parking lot
Main park and all pocket parks need complete redevelopment
Address flooding and/or drainage issues specifically in the main parking lot and tidal flood zones
Improve signage, branding, trails, landscape, and furnishings
Increase tree canopy for shade, aesthetics, and erosion control
Improve current parking surfaces and expand parking availability
Add kayak/canoe launch to one of the pocket parks
Replace fishing bridges connecting pocket parks
2
KRISTIN JACOBS NATURAL AREA AT HILLSBORO PINELAND
Location: 5591 N.W. 74th Place, Coconut Creek
Size: 56.34 acres
Type: Natural Area Basic
Kristin Jacobs Natural Area at Hillsboro Pineland was formerly Hillsboro Pineland Natural Area. The property offers two short and ADA-accessible trails through pine flatwoods and wet prairie. The Long Pine North Greenway runs adjacent to the site and could be connected or extended into the park for bike and foot traffic. This park has a signed, gated, and fenced entrance. The building on this property is similar in style to other parks. The painted metal roof and stucco help to identify and make the property cohesive.
Existing Structures and Amenities:
Current, Planned, and/or Potential Projects:
Exotic plant removal and vegetation management
Naturalist-led programming
Update interpretive signs
Installation of rehydration pump in Hillsboro Pineland addition (Pujara)
Deficiencies and Recommendations:
Renovate boardwalk trails
Upgrade site furnishings
FAIR
FAIR
FAIR
2
LAFAYETTE HART PARK
Location: 2851 N.W. Eighth Rd., Fort Lauderdale
Size: 1.75 acres
Type: Neighborhood Park
Basic Improvements Estimate: $755,450
Reconstruction Estimate: $3,635,875
Lafayette Hart is a neighborhood park located within the Broward Municipal Services District. It features a basketball, tennis, and racquetball court; a playground; a one-mile jogging/walking path; picnic areas; and facility rentals. The community center provides a variety of free programming for all ages, as well as a free summer recreation program. A private trail offers access from the neighborhood and an adjacent property has recently been acquired to include additional parking and a dog park. This park is in a suburban setting. The entry is signed, similar to most parks, with adequate parking. The main building on this property is a well-maintained modular structure. All other structures on the property share the same style and paint palette.
FAIR FAIR
FAIR FAIR FAIR
LAFAYETTE HART PARK
(CONTINUED)
Current, Planned, and/or Potential Projects:
Irrigation installation (Completed)
New parking lot on recently acquired property
Deficiencies and Recommendations:
Repurpose tennis and racquetball court
Convert drinking fountains to bottle-fill stations
Clean and/or upgrade existing site furnishings
Consider adding outdoor exercise area to expand services
Increase native tree canopy for shade and aesthetics
Enhance park security and technology
Develop newly acquired site to include more parking, an outdoor exercise area, or dog park
Resurface basketball court and address drainage/flooding on the court
Renovate racquetball court or replace with outdoor exercise area
Develop volunteer group in local neighborhood to help increase awareness of park programs and amenities
2
LEWIS-CHISOM PARK
Location: 2620 N.W. Eighth St., Fort Lauderdale
Size: 0.55 acres
Type: Specialty Park
Basic Improvements Estimate: $68,628
Reconstruction Estimate: $103,675
Lewis-Chisom is a passive park along the New River Canal, with little room for development. The site is one of many pocket parks in the neighborhood, providing green space to walk, rest, and picnic. Existing Structures and Amenities:
Current, Planned, and/or Potential Projects:
Lighting project is under construction (Completed)
Add a dog-waste station (Completed)
Deficiencies and Recommendations:
Update furnishings and walking paths
Add more seating and a free Little Library
Consider adding exercise equipment to offer another amenity to the community
FAIR FAIR
LONG KEY NATURAL AREA & NATURE CENTER
Including newly acquired Aitken property
Location: 3501 S.W. 130th Ave., Davie
Size: 170.39 acres
Type: Nature Center and Historical Site
Basic Improvements Estimate: $5,997,635
Reconstruction Estimate: $24,704,375
This natural area offers indoor and outdoor event or educational space, along with hiking and equestrian trails. An existing Friends of Long Key group is organized to assist with small projects at the park. While the trails are in good shape, the furnishings and public art area need to be updated. This park is in a suburban setting. The main building on this property is well maintained. Other structures on the property have recently been acquired by the County and require extensive refurbishment or demolition. The acquisition of the additional structures has also created the opportunity to develop 20+ acres of land.
Existing Structures and Amenities:
Current, Planned, and/or Potential Projects:
Wetland construction at old Pioneer City site
Roof shrink wrapping (temporary fix to leaking)
Conversion of Baez Home to living museum
Upgrade Hall A/V system
LONG KEY NATURAL AREA & NATURE CENTER
(CONTINUED)
Observations and Recommendations:
GENERAL
Upgrade some of the existing site furnishings and signage
Add water bottle-fill stations and more picnic areas
Renovate island garden and update public art
Improve bird viewing area and bird feeders
Increase full-time and part-time staff as Aitken site is developed
Design and build wetland overlook/viewing dock with ADA accessible trail
AITKEN HOUSE AND STABLES
Renovate home furnishings, bathrooms, and kitchen
Bring space up to code to comply with ADA compliance and hurricane standards
Fill in 65,000-gallon pool and hot tub for event space
Replace roof of main house and caretaker’s apartment
Convert caretaker’s apartment into a science lab for youth education
Demolish and remove abandoned buildings and debris piles (3 – 5 buildings seem unsafe)
Install parking lot (+/- 50 spaces)
Convert stables to environmental education classrooms/exhibits
Fill in stable courtyard with concrete and cover with pavilion for youth education/gathering space
Enclose stables and add air conditioning
BAEZ HOUSE
Build connecting boardwalk trail to/from nature center
Install parking lot (+/- 25 spaces shared with nature play areas)
Address termite damage and replace deteriorated screens
FORMER PASTURELAND/FUTURE PLAY AREAS
Design and build series of small, connected, nature inspired play areas
Design and build new restroom facility for play areas
Include nature trail surrounding the play areas
Address flooding in redesign of large fields
2
MARKHAM PARK & TARGET RANGE
Location: 16001 W. State Rd. 84, Sunrise Size: 669 acres
Type: Regional Park
Basic Improvements Estimate: $16,329,900
Reconstruction Estimate: $44,613,600
Markham Park & Target Range is a regional park with potential to be an elite state tourist destination. Perched at the edge of the Everglades, this large, diverse park features a huge campground and dog park, the Fox Observatory, a model airplane field, mountain bike trails, and one of the premier outdoor public shooting ranges in South Florida. Markham also served as one of the benchmark parks for the systemwide site assessment.
As one of the County’s key parks, this site should be a top priority in the planning process. Investments in the infrastructure, campground, and pool area will increase revenue substantially. This park has a well-landscaped, gated, and fenced entrance. Most buildings on this property are well maintained but of mixed construction and styles. This park offers several major functions the community uses extensively. The structures on this property would benefit from additional maintenance.
Existing Structures and Amenities:
MARKHAM PARK & TARGET RANGE
(CONTINUED)
Current, Planned, and/or Potential Projects:
Shelter 5 restroom renovation
Paving of campground sites and upgrade utilities
Addition of tennis and pickleball courts
Deficiencies and Recommendations:
GENERAL
Traffic study and renovation at main entrance to alleviate traffic and improve flow
Improve and upgrade wayfinding throughout the park, specifically at northeast end of campground and southeast side of park
Upgrade existing street lighting, benches, trash receptacles, and drinking water/bottle-fill stations in one to three years
Increase tree canopy for shade and aesthetics
Improve the picnic table layout throughout the park; picnic areas not in the shade are not being used
Improve current parking surfaces and expand parking availability, specifically at the office, dog park, and south playground
Address flooding and/or drainage issues at Target Range parking lot, corporate shelter parking lot, and within the campground area
Renovate volleyball courts
AIRFIELD & REMOTE CONTROL (R/C) TRACKS
Improve buffer between road and airfield
Develop R/C racetrack at southeast corner of the park
Increase tree canopy for shaded seating
Replace missing fire extinguisher at airfield shelter
BIKE LANES/ROADS
New paving and striping needed for bike lanes, sidewalks, and roads
BOAT RAMPS
Personal watercraft area appears unused; renovate and promote or repurpose area
Add kayak launch to separate area of the park
Main boat ramp on south side of park cuts into New River Greenway, creating a safety hazard for bikers. Redirect greenway north into the park to avoid the boat parking lot
CAMPGROUND
Expand main campground to increase park revenue
Increase tree canopy to provide shade and enhance aesthetics
DOG PARK
MARKHAM PARK & TARGET RANGE
(CONTINUED)
Improve irrigation for sod health and fill in ground around perimeter fencing
Add dog-waste stations to the outside of the fence for use as patrons arrive/depart
Add emergency contact sign to clarify who patrons call in the case of an emergency
Expand and restripe parking area
FISHING DOCKS/PIER
Replace and expand current fishing dock
Consider relocating further from the boat ramp and bike path
HERON PRESERVE
Redesign site to be a more elite private event/retreat area to increase use and park revenue
OUTDOOR FITNESS AREA
Replace equipment with apparent rust
Add shade sail PAVILIONS
Roofs need repairs as well as general maintenance and cleaning
Add clearer signage to the buildings
Restroom of older pavilions are not ADA compliant
Transition to LED lighting PLAYGROUNDS
Upgrade play equipment and surfaces
Repair sidewalks and surfaces
Increase native tree canopy and shaded seating areas
OASIS POOL AREA/SAFARI ISLAND
Demolish and redesign both
TARGET RANGE
Renovations will be needed in three to five years for the long-range structures
TRAILS/GREENWAY
Increase native tree canopy along greenway to provide shade at all times of the day
Add shaded seating and water fountains to trailheads at southwest corner of the park
Redesign and renovate main bike trail entrance
1
MILITARY TRAIL NATURAL AREA
Location: 4600 N. Military Trail, Deerfield Beach
Size: 19.92 acres
Type: Natural Area
Basic Improvements Estimate: $275,500
Reconstruction Estimate: $833,750
Military Trail Natural Area provides a half-mile trail through Florida scrubland. The trail offers little shade and seating, and poorly maintained pathways. The site has no available parking. The entrance is on a major road, difficult to find, and dangerous to park in front of. The park is signed and gated. The architectural team did not visit this park.
Existing Structures and Amenities:
Current, Planned, and/or Potential Projects:
Exotic plant removal/vegetation management
Naturalist-led programming
Deficiencies and Recommendations:
Enhance entrance, improve safety, and consider moving to different area of the park
Maintain trails; pave portion or add boardwalk
Replace site furnishings
Address ADA deficiencies
3
MIRAMAR PINELAND
Location: 3600 S. University Dr., Miramar
Size: 158.68 acres
Type: Regional Park
Basic Improvements Estimate: $587,250
Reconstruction Estimate: $2,182,250
This location features well-maintained nature trails, a large playground, small splash pad, and stormwater park. It sits adjacent to Florida’s Turnpike, a community high school, and a special-needs school. There is room to expand, but it is important to ensure the environmental integrity of the site.
Existing Structures and Amenities:
Pavilions
Current, Planned, and/or Potential Projects:
Nature center (Completed)
Deficiencies and Recommendations:
Restripe parking lots and upgrade some site furnishings, i.e., swings, water fountains, smoking receptacle, and grills.
Consider adding pedestrian entrance to northwest corner at the end of Newport Road, providing access for the adjacent neighborhood and schools. Residents currently travel 1.5 to 2 miles out of their neighborhood and onto a major road to access the main entrance.
3
PLANTATION HERITAGE PARK
Location: 1100 S. Fig Tree Lane, Plantation
Size: 88.39 acres
Type: Regional Park
Basic Improvements Estimate: $10,283,400
Reconstruction Estimate: $30,094,750
Plantation Heritage Park is in a suburban setting, located in the central portion of the County. Its close proximity to Florida’s Turnpike and I-595 make it a top choice for regional festivals and events. This site has the space, aesthetics, and amenities to appeal to the diverse interests of the County’s residents. The west portion of the park is still undeveloped, providing the opportunity to expand and offer more recreational activities for the community. The entry is signed similar to most parks with adequate parking throughout the park. The main building on this property is well maintained. All other structures on the property share the same style and paint palette. The park features the Fountain Room and several pavilions for the community’s use. Existing Structures
and Amenities:
Trails FAIR
Current, Planned, and/or Potential Projects:
Install outdoor fitness zone (Completed)
Replace maintenance building
Renovate public restrooms
Replace north playground surfacing (Completed)
Rehabilitate pump station
Upgrade Fountain Room (Completed)
Replace roof on Duck Pond Gazebo
Renovate Rec Center Complex
PLANTATION HERITAGE PARK
(CONTINUED)
Deficiencies and Recommendations:
Develop west portion of the park; include hard courts, splash pad, and other recreational activities
Repave main walking pathway through the park
Repair sail shade on northeast playground (Completed)
Lengthen trail system and extend pathways through the tropical fruit grove
Develop the fruit grove into a food forest and create a permaculture volunteer group to maintain it and provide garden education
Include an outdoor classroom setting for additional programming opportunities.
Increase parking availability
Expand conservation efforts; increase native tree canopy and native plantings
2
QUIET WATERS PARK
Location: 401 S. Powerline Rd., Deerfield Beach
Size: 425 acres
Type: Regional Park
Basic Improvements Estimate: $8,849,350
Reconstruction Estimate: $20,315,950
Quiet Waters Park is the fourth largest in the system, serving the northern end of the County. The site offers a wide variety of amenities and is home to the famous Florida Renaissance Festival every spring. The multitude of activities ensures there is something to do for everyone, but to make the park more inviting and enjoyable, outdated furnishings and ADA deficiencies need to be addressed, as do conservation efforts. This park has an insignificant entrance with minimal signage. The park is gated and fenced. The structures on this property are of varied vintage styles. They are all well maintained and being utilized to their designed functions. This park has open areas and is divided into “rooms.”
Existing Structures and Amenities:
QUIET WATERS PARK
(CONTINUED)
Current, Planned, and/or Potential Projects:
Restroom renovations
New mountain bike entrance gate
New cabin construction at the campground
Corporate shelter roof replacement
New A/C in marina, lifeguard office, gatehouse, and old bike building
42” reclaimed water pipe being installed through the park (Completed)
Renovation of bike building to park office (not funded)
Feasibility study for expansion of water park (funded)
Deficiencies and Recommendations:
GENERAL
Address flooding and/or drainage issues specifically at the dog park and splash pad
Increase native tree canopy and native plant landscaping
Improve current parking surfaces and expand availability
Upgrade signage, wayfinding, and streetlights throughout the park
Upgrade existing benches, grills, trash receptacles, and add water bottlefill stations
Pressure washing is needed for most amenities and site furnishings
BASKETBALL COURT
Provide additional seating opportunities/benches
Increase shade surrounding the court
Repair hoop nets
BOAT RAMP
Upgrade lighting and picnic areas around marina
CAMPGROUND
Expand campground to include RV camping
PLAYGROUND
There is currently one playground; another large playground is needed in the south or west section
Repair/repave sidewalks leading to the current play area
Increase native tree canopy for shade and aesthetics
VOLLEYBALL COURTS
Reconstruct courts (5)
1
REVEREND SAMUEL DELEVOE
MEMORIAL PARK
Location: 2520 N.W. Sixth St., Fort Lauderdale
Size: 33.50 acres
Type: Neighborhood Park
Basic Improvements Estimate: $2,981,925
Reconstruction Estimate: $6,916,500
This active park shares property with the Urban League of Broward County and the African American Research Library and Cultural Center. It is centrally located in a historical neighborhood that is known to many as “The Heart and Soul of the City.” It features a multitude of recreational activities and programs for the community, as well as easy access to mass transportation and the New River Canal. This park’s entry is on the periphery of the urban core. The gated and fenced entry is signed similar to most parks with adequate parking. The main building on this property is well maintained with a gymnasium and community rooms available to the public. All other structures on the property share the same style and paint palette.
FAIR FAIR POOR POOR FAIR
REVEREND SAMUEL DELEVOE MEMORIAL PARK
(CONTINUED)
Current, Planned, and/or Potential Projects:
Installation of solar cover over outdoor fitness area (Completed)
Installation of lighting around lake (in Planning)
Construction of new maintenance building (in Planning)
Resurface basketball court with new backboards and rims (Completed)
New restrooms (in Planning)
Replace wooden fishing docks and address flooding (Completed)
Replace play equipment (in Purchasing)
Deficiencies and Recommendations:
GENERAL
Upgrade signage and wayfinding throughout the park
Address flooding and/or drainage issues specifically around the lake and along the canal side
Replace Bike Fix-It Station
Increase native tree canopy for shade and aesthetics, especially around playground
Upgrade existing benches, grills, trash receptacles, and drinking water/bottle-fill stations
Improve current parking surfaces and expand parking availability
Consider adding a new community center, splash pad or water feature
Repave sidewalks and lake trail
Address ADA-compliance deficiencies
BOAT RAMP/CANOE LAUNCH
Enhance current ramp and clean lakeside trash
Outdoor Fitness Area
Demolish older fitness area
Replace equipment at newer fitness area and add shade PLAYGROUND
Include additional shade and seating with renovation
VOLLEYBALL COURT
Could not locate on the site; reconstruct one volleyball court or remove from the list of amenities (Removed)
3
ROOSEVELT GARDENS
Location: 2841 N.W. 11th St., Fort Lauderdale
Size: 5.42 acres
Type: Neighborhood Park
Basic Improvements Estimate: $1,312,250
Reconstruction Estimate: $9,419,200
Roosevelt Gardens offers a park, community center, and free programming to the surrounding neighborhood. This park is a good example for other neighborhood parks in the system. Along with the outdoor amenities, this site features a meeting room (rental facility), game room, computer lab, and office space. By purchasing the open lots to the north, you could expand to include a splash pad and fitness area. This park is in a suburban setting. The entry is signed similar to most parks and has adequate parking. The main building on this property is well maintained. All other structures on the property share the same style and paint palette. The park features basketball courts and open fields.
Existing Structures and Amenities:
ROOSEVELT GARDENS
(CONTINUED)
Current, Planned, and/or Potential Projects:
Basketball courts resurfacing and backboards and rims replacement (Completed)
Replace artificial turf in playground areas
Deficiencies and Recommendations:
Purchase lots to the north and expand park services to include an outdoor or indoor fitness area and splash pad
Increase native tree canopy and native plantings for both aesthetics and conservation efforts
Renovate northwest parking lot
Add shade sails to basketball bleachers
Replace swings and play equipment on medium-sized play area
Replace Bike Fix-it Station
Repave and regrade sidewalks through park
3
SAW PALMETTO NATURAL AREA
Location: 4950 N.W. 71st Place, Coconut Creek
Size: 11.06 acres
Type: Natural Area
Basic Improvements Estimate: $340,750
Reconstruction Estimate: $1,558,750
The Saw Palmetto Natural Area is one of many in the City of Coconut Creek. The city is motivated to provide its residents with more access to green space and walking/biking trails. This site currently offers two covered picnic tables and a short trail through pine flatwoods but has plans to expand its offerings by connecting to a greenway and adding a play feature. The city is helping to fund both projects. This park has a signed and gated entry. It appears to be well maintained. All structures on this property are of similar vintage and style. The painted metal roof helps to identify the property. There is paved parking and trail.
Existing Structures and Amenities:
Current, Planned, and/or Potential Projects:
Nature-themed play feature ($100K funding assistance from the City of Coconut Creek)
Greenway walkway (funded by City of Coconut Creek)
Exotic plant removal/vegetation management
Naturalist-led programming
Installation of directional sign in kiosk
Deficiencies and Recommendations:
Beautify entrance and parking area to make more inviting and improve picnic experience
Site furnishings and hardscape need pressure washing
Replace some dated site furnishings and upgrade water fountain to bottle-fill station
Add wayfinding and directional signage on the trail
2
SECRET WOODS NATURE CENTER
Location: 2701 W. State Rd. 84, Dania Beach
Size: 56.95 acres
Type: Nature Center
Basic Improvements Estimate: $1,667,500
Reconstruction Estimate: $8,924,750
Secret Woods Nature Center is a place for learning about and appreciating nature. The park features a nature trail system with natural play area, small classroom, and rental hall for special events. The manatee observation deck is currently being renovated. The Friends of Secret Woods volunteer group assists with invasive vegetation removal and educational endeavors. The New River Greenway runs adjacent to the park; there should certainly be a bicycle/pedestrian path into the park. This park has a rustic and natural entrance. All buildings on this property are of similar vintage and style. The painted metal roof and siding help to identify and provide cohesion to the property.
Existing Structures and Amenities:
SECRET WOODS NATURE CENTER
(CONTINUED)
Current, Planned, and/or Potential Projects:
Building exteriors replace/refinish (Completed)
Decking replacement near building is under construction
Manatee observation deck to replace existing river overlook
Upgrade Hall A/V system
Deficiencies and Recommendations:
Enhance entrance and add bike/pedestrian lane into the park from the New River Greenway
Coordinate with transportation organizations to lengthen the turn lane into the park from Marina Mile Boulevard
Update site furnishings and interpretive signage
Expand and enhance the natural play area
Add small play structure, e.g., crab- or manatee-themed climbing dome
Address the areas with sinking deck at the nature center
Replace boardwalk and seating throughout the New River Trail
It mostly consists of recycled plastic lumber, but portions have been replaced with wood and are slippery when wet.
1
SEWELL LOCK
Location: 6521 State Rd. 84, Davie
Size: 3.4 acres
Type: Specialty Park
Basic Improvements Estimate: $385,700
Reconstruction Estimate: $833,025
Sewell Lock is a designated historical site due to it being the County’s oldest water control structure. It includes a small picnic area, fishing permission, and connection to the New River Greenway Trail. The space needs major improvements to attract patrons or be useful. The County Website promotes this site as a “rest area for bikers” because of its connection to the NRG Trail, but does not provide a bike rack, water fountain, fix-it station, or restroom. The entry is insignificant and difficult to see from the road.
Existing Structures and Amenities:
SEWELL LOCK
(CONTINUED)
Current, Planned, and/or Potential Projects:
Repair bollards and replace missing links of large chain
Renovation of seawall
Addition of concrete along seawall with spacers
Addition of interpretive kiosk with information about lock, canal, and greenway
Deficiencies and Recommendations:
Enhance entrance/exit and improve signage
Because of the high speed on State Road 84, the turn into the park is quick and sharp; consider lengthening the turn lane or adding speed bumps
Add a bike fix-it station, bike rack, and drinking water/bottle-fill station to accommodate cyclists
Repair current parking surfaces and regrade sidewalks to be even with sod edges
Improve landscaping; add native landscaping including native wildflower plantings
Repair or replace fence along seawall
Add more picnic areas and a designated fishing spot; it is not clear whether fishing is allowed
This natural area sits on the border between Broward and Miami-Dade counties, in the center of a residential area. While it offers relaxing ecological scenery for walking and picnicking, it could draw more patrons by improving its fishing dock, exercise equipment, and play equipment. The site has plans for development of a welcome center and restroom; the project is under construction.
Existing Structures and Amenities:
FAIR
FAIR
FAIR FAIR FAIR
SNAKE WARRIOR’S ISLAND NATURAL AREA
(CONTINUED)
Current, Planned, and/or Potential Projects:
New restroom building
Development of welcome center Deficiencies and Recommendations:
Beautify entrance; expand and restripe parking lot
Replace bike rack and add water bottle-fill station
Add more picnic tables to the oak hammock area
Remove fitness equipment and develop shaded fitness area with new equipment
Add a small playground
Re-slope edges of sidewalk to grade with grass
Rocks along fence base need to be re-laid
Replace current interpretive signage and add information about wildlife and Great Florida Birding Trail
Replace fishing bridge and walking bridge
1
SOUTH FORK CANOE LAUNCH
Location: 4490 S. State Rd. 7, Davie
Size: 0.28 acres
Type: Specialty Park
Basic Improvements Estimate: $226,490
Reconstruction Estimate: $535,050
This small area on the New River Canal should be completely redesigned to create an enjoyable park space. The site is damaged, dirty, outdated, and lacking in safety. Although the space is limited, it serves as an access point for other local recreation. The south end of the nine-mile Linear Park Trail is located here, connecting this park to at least three other County parks. The kayak launch allows exploration throughout the entire County from the Everglades to the ocean. This park has no structures. It does have an entry and parking with a paved trail to the water’s edge. The architectural team did not visit this park.
Existing Structures and Amenities:
Current, Planned, and/or Potential Projects: N/A
Deficiencies and Recommendations:
Renovate entrance, parking lot, paths, picnic area, and boat launch
Consider roundabout drop-off for watercrafts
Add bike rack, drinking water/bottle-fill stations, dog-waste stations, benches, tables, and canopy shade
2
SUNVIEW PARK
Location: 1500 S.W. 42nd Ave., Fort Lauderdale
Size: 21.50 acres
Type: Neighborhood Park
Basic Improvements Estimate: $2,549,100
Reconstruction Estimate: $4,893,750
Although Sunview Park is categorized as a neighborhood park, it offers a variety of recreation opportunities as well as free programming for children. The site features hard courts, a baseball/softball complex, soccer fields, a dog park, and a computer lab. This park is in a suburban setting. The entry is insignificant, and the signage is of the same as most neighborhood parks. The main building on this property was recently rebuilt and has an unfortunate roof leak. All significant buildings on this property share the same style and paint palette. The older utility buildings on the property are dated and need major renovations. There is a drainage issue on this property, leaving the soccer field under water and unusable during rainy periods.
Existing Structures and Amenities:
FAIR FAIR
POOR FAIR FAIR
SUNVIEW PARK (CONTINUED)
Current, Planned, and/or Potential Projects:
Update drainage pump in south parking lot
Pave south parking lot
Upgrade site furnishings and add water bottle-fill stations (Completed)
Replace restroom furnishings (Completed)
Deficiencies and Recommendations:
Replace the irrigation system and field lighting throughout the park
Construct a new maintenance building
Remove the invasive Australian pine trees
Add more seating and picnic areas
Add community-supplied dog-waste station
Increase native tree canopy for shade and aesthetics
Improve current parking surfaces and expand parking availability
Update existing sports fields and consider the addition of an outdoor gym area
Add sail shades over the bleachers
Renovate batting cage/bullpen
Resurface basketball court
The County Website states that the park has volleyball and horseshoes, but those were not accessible; either replace or remove the site features from the Website
2
TALL CYPRESS NATURAL AREA
Location: 3700 Turtle Run Blvd., Coral Springs
Size: 66.50 acres
Type: Natural Area
Basic Improvements Estimate: $2,566,500
Reconstruction Estimate: $9,787,500
Tall Cypress Natural Area features a few picnic tables, an outdoor teaching area for nature education, and a half-mile boardwalk trail through dense cypress swampland. It allows for quick access to the wilderness for the local community. This park has a rustic and visibly gated entry, which is well maintained. The buildings on this property are adequately maintained and sufficient.
Existing Structures and Amenities:
Current, Planned, and/or Potential Projects:
Exotic plant removal and vegetation management
Naturalist-led programming
Deficiencies and Recommendations:
Renovate boardwalk trails and extend or add second trail in south portion of the park
Replace site furnishings and interpretive signage
Resurface parking lot
2
T.Y. (TOPEEKEEGEE YUGNEE) PARK
Location: 3300 N. Park Rd., Hollywood
Size: 150 acres
Type: Regional Park
Basic Improvements Estimate: $11,864,200
Reconstruction Estimate: $22,454,300
T.Y Park is a key regional park in the southeast portion of the County. It features amenities for all ages and abilities, including but not limited to a campground, water park, and outdoor fitness area. Its proximity to I-95 makes urban green space easily accessible for both locals and out-of-towners. The Friends of T.Y. volunteer group has assisted in purchasing fixtures and hosting special events for the community. While the park is in good condition, it still needs a few major improvements to increase its safety and integrity. This park has a significant sign at the confluence of Park Road and Sheridan Street. The signage at the gated and heavily treed entry is unique to this park. The aquatic component is one of the main draws. The second is a camping component. The structures on this property are of varied vintage and styles. They are being used to their designed functions. The structures that are older could use some additional maintenance.
Existing Structures and Amenities:
T.Y. (TOPEEKEEGEE YUGNEE) PARK
(CONTINUED)
Current, Planned, and/or Potential Projects:
Conference room renovation and restroom renovations (Completed)
Pathway repairs (Completed)
Pool equipment repairs
Installation of re-use irrigation
Replacement of shade sail canopies at concession
Installation of security gate for campground
Compactor replacement
Pavilion upgrades/replacements
Deficiencies and Recommendations:
Renovate entrance to alleviate traffic leading into the park
Update equipment at the outdoor fitness area
Replace volleyball courts throughout the park
Address flooding and/or drainage issues specifically at the park office and eastern side of the park
Upgrade existing benches, grills, trash receptacles, and drinking water/bottle-fill stations
Improve current parking surfaces and expand parking availability, without impacting canopy coverage
Park traffic includes large RVs and buses, but some roads are very narrow and lack sidewalks
Renovate the narrow roadways and include sidewalks to increase safety
Maintenance buildings have damage from water intrusion and a roof leak
Some structures need painting and fixtures replaced
TRADEWINDS PARK & STABLES
Location: 3600 W. Sample Rd., Coconut Creek
Size: 638.5 acres
Type: Regional Park
Basic Improvements Estimate: $14,768,250
Reconstruction Estimate: $34,356,200
Tradewinds Park & Stables is one of the largest and most diverse parks in the County system. This park is divided into two distinctive functions physically by West Sample Road: the equestrian component is accessible from the north side of the road and the athletic fields are accessible from the south side. The equestrian entry is wooded and rustic. The property has a mixture of building types and styles. Most all of the wooden structures appear to require the most maintenance. The maintenance building is the newest concrete block structure and is overflowing at the seams. The athletic field side entrance is more manicured and open with a visible perimeter fence. The buildings on this side of the property are more cohesive and integrated.
Tradewinds Park is a tourist destination and a heavily used recreational area. Partnerships with contracted vendors and nonprofit organizations allow the park to accommodate Butterfly World, Equine-Assisted Therapies of South Florida, and an annual Holiday Fantasy of Lights show. Tradewinds Farm Hands Inc. provides volunteers and financial support for the horse stables and educational farm. While the park has much to offer, the infrastructure and furnishings need updating. Currently, a $13 million renovation project is being realized on the north side of the park. A master plan is needed to develop the newly acquired Vinkemulder portion of the park. The south side may not need a complete reconstruction plan but does need significant improvements to the infrastructure and trails, as well as to the boardwalk, which is currently closed to the public.
Renovations to the stables, farm, barn, and garden areas on the north side (in progress)
Roof replacement on Fritillary shelter (Completed)
Replacement of a rehydration discharge pipe in the wetlands area at the south end
Renovations to the infrastructure, roadways, and parking lots on the north side
Additional shelter roof replacements, fence and gate replacements, and additional renovations on the north side
Construction of the Soccer 5 Inc. mini soccer fields
Deficiencies and Recommendations:
GENERAL
Renovate north entrance
Restripe bike lanes and improve bike entrance/exit
Upgrade signage and wayfinding throughout the park
Address flooding and/or drainage issues specifically at the athletic fields, south side trails, and disc golf course
Upgrade existing benches, grills, trash receptacles, and drinking water/bottle-fill stations
Increase native tree canopy for shade and aesthetics
Update existing sports fields and consider the addition of an outdoor gym and hard courts, e.g., basketball, pickleball
Repave sidewalks and trails throughout the park
BOAT RAMP
Enhance current ramp and clean lakeside trash
TRAILS
Canoe/Kayak Launch and Fishing Dock
Repair and clean launch site
Replace wooden fishing dock
Replace boardwalk trail through the wetlands on the south side
VOLLEYBALL COURTS
Replace courts (four)
TREE TOPS PARK & PINE ISLAND RIDGE NATURAL AREA
Location: 3900 S.W. 100th Ave., Davie
Size: 348.80 acres
Type: Regional Park Basic
$10,777,850
$21,684,750
These two adjacent parks offer access to the public as well as private access for residents living along the Pine Island Ridge. The main features of both sites are their nature trails for hikers and equestrians. The County has an updated conservation management plan for Pine Island Ridge and could benefit from improving the outdated infrastructure and adding hard courts, a disc golf course, or more challenging activities. This park has a rustic and visibly gated entrance. Most buildings on this property are well maintained but of mixed construction and styles. This park is wooded and is divided into “rooms” for a variety of visitor uses. The park offers a reception center available to the public. Most structures on this property would benefit from additional maintenance as well as the roadways/parking lot, which are in need of repaving. Existing
TREE TOPS PARK & PINE ISLAND RIDGE NATURAL AREA
(CONTINUED)
Current, Planned, and/or Potential Projects:
Demolition and construction of new prototype restroom on south side of park (Completed)
Exotic/invasive vegetation removal
Replace wire perimeter fencing at Pine Island Ridge
Deficiencies and Recommendations:
GENERAL
Add pedestrian/bike path to entrance/exit of Tree Tops
Address drainage issues in fields and picnic areas with stormwater BMPs
Upgrade signage and wayfinding throughout the park
Upgrade existing benches, grills, trash receptacles, and drinking water/bottle-fill stations
Improve current parking surfaces and expand parking availability, specifically at the parking lot nearest the Lakeside Cottage and Viewing Tower
Increase trail maintenance and exotic/invasive species removal in Pine Island Ridge Natural Area
Renovate boardwalk trails and viewing shelters
Renovate bridge to lakeside picnic areas
Replace outdoor stage and firepit to accommodate outdoor education groups
Relocate the park office to front of park
EQUESTRIAN TRAILS/STABLES
Renovate stables and add shade for horses
OUTDOOR FITNESS AREA
Replace equipment that has apparent rust
PLAYGROUNDS
Upgrade play equipment and surfaces
Repair sidewalks around play areas
VOLLEYBALL COURT
Replace courts (four)
2
VISTA VIEW PARK
Location: 4001 S.W. 142nd Ave., Davie
Size: 271.50 acres
Type: Regional Park
Basic Improvements Estimate: $8,781,200
Reconstruction Estimate: $23,342,100
Sitting on an old landfill, Vista View Park features the highest man-made elevation in Broward County and offers a wide variety of services and amenities. The site has a high level of activity throughout the day and plenty of space to increase programming and improve sustainability efforts. Developing the north hill would almost double the size of the park, allowing for the addition of a disc golf course, tennis/pickleball courts, water attractions, and much more. This park has a rustic and natural entrance, which is well maintained. All buildings on this property are of similar vintage and style. The painted metal roof, stone plinth, and stucco help to identify and cohere the property.
Existing Structures and Amenities:
Campground (Primitive)
Equestrian Trails
Fishing Dock/Pier
Current, Planned, and/or Potential Projects:
Splash pad is under construction
Restroom renovations ($60K unfunded capital project)
New front doors at park office (half of $8K funded)
North hill – development of roads, parking, and paths (unfunded capital project)
FAIR FAIR
FAIR FAIR FAIR
VISTA VIEW PARK
(CONTINUED)
Deficiencies and Recommendations:
GENERAL
Develop north hill to increase park size
Address drainage issues in fields with stormwater BMPs
Upgrade signage and furnishings throughout the park
Increase native tree canopy and native plantings; decrease sod maintenance
Add workout equipment and fitness benches throughout park; exercise seems to be the main activity of the patrons
Improve current parking surfaces and expand parking availability
Add community-supplied dog-waste stations and drinking water/bottlerefill stations
AIRFIELD/PARAGLIDING FIELD
Upgrade furnishings, pathways, and seating
BASKETBALL COURTS
Renovate basketball courts (two), hoops, and perimeter fencing
Provide additional seating opportunities/benches
Increase native tree canopy and shade surrounding the court
Add bottle-refill stations and trash cans/recycling outside of fence
CAMPGROUND (PRIMITIVE)
Expand campground and consider adding sites with water and electric hookups
Increase native tree canopy to provide shade and enhance aesthetics
EQUINE TRAILS/WASH STATIONS
Upgrade furnishings
Increase both shade and trailer parking PLAYGROUNDS
Upgrade play equipment and surfaces
Repair sidewalks leading to the play area
Increase native tree canopy for shade and aesthetics
R/C TRACK
Reconstruct; current track is out of service and not safe for use
3
WASHBURN PARK
Location: 1955 S.W. 50th Ave., Fort Lauderdale
Size: 0.64 acres
Type: Specialty Park
Basic Improvements Estimate: $105,603
Reconstruction Estimate: $202,275
Washburn is a passive neighborhood park providing green space for the Broadview Park community to walk, rest, and picnic. It has only a few parking spots and no play equipment.
Existing Structures and Amenities:
Current, Planned, and/or Potential Projects: N/A
Deficiencies and Recommendations:
The tree beds need a native ground-cover planting
Upgrade water fountain to bottle-fill station
Add picnic tables, sail shades, and a free Little Library
Consider adding dome climbing structure or small play equipment
3
WEST CREEK PINELAND NATURAL AREA
Location: 4800 W. Hillsboro Blvd., Coconut Creek Size: 7.43 acres
Type: Natural Area
Basic Improvements Estimate: $47,125
Reconstruction Estimate: $97,875
West Creek Pineland Natural Area sits adjacent to two other natural areas in the County’s park system. It offers a well-lit nature trail, gazebo, seating areas, and interpretive signage along the multimodal paths. The main trail connects to nearby neighborhoods and shopping plazas.
Existing Structures and Amenities:
Current, Planned, and/or Potential Projects: N/A
Deficiencies and Recommendations:
Clean and/or upgrade some of the existing benches, bike racks, and trash receptacles
Add drinking water/bottle-fill stations and dog-waste stations (community-supplied example below)
Improve wayfinding and signage
2
WEST LAKE PARK
Location: 1200 Sheridan St., Hollywood
Size: 65.04 acres
Type: Regional Park
Basic Improvements Estimate: $2,715,850
Reconstruction Estimate: $8,062,000
West Lake Park services the southeast portion of the County and offers a variety of recreational activities. Equipment upgrades and landscape enhancements are needed to make this site more inviting and enjoyable. The Friends of Anne Kolb volunteer group helps with maintenance in the park such as gathering litter and invasive plant removal. Although this park features many activities, it also contains an array of wildlife. According to the park manager this is one of the few sites, if not the only one, that is home to the American crocodile. This park has a significant entry feature. The gatehouse, entry, and all other buildings on the property are of the same vintage. Most structures are well maintained. The metal roofs tie all the buildings together.
WEST LAKE PARK
(CONTINUED)
Current, Planned, and/or Potential Projects:
Renovation of west restroom building (Completed)
Repair of public boat launch and addition of sandy launch beach (Completed)
Replacement of main playground and water feature
Conversion of racquetball courts to pickleball courts
Repair of park pathways
Deficiencies and Recommendations:
GENERAL
Highlighting the natural wildlife and upgrade the existing amenities
Add interpretive signage and improve wayfinding throughout the park
Address flooding and/or drainage issues specifically at southwest portion of the park
Add shaded seating and rest area between tennis and basketball courts
Replace fencing around basketball courts
Add outdoor fitness area
Repair paved walkways throughout park
Increase the native tree canopy and native plantings throughout the park to improve conservation efforts and aesthetics
Replace volleyball courts
Resurface parking lots
Replace boardwalk pier and gazebo
Renovate boat marina docks
STRUCTURAL
Some building exterior and interior walls require painting
Some fixtures and equipment need to be replaced
Some concrete floors and exterior walls need to be cleaned
Some signage needs to be cleaned or replaced
1
WILLIAM J. KELLEY ROOKERY
Location: 5150 N.W. 31st Ave., Fort Lauderdale
Size: 16.7 acres
Type: Natural Area
Basic Improvements Estimate: $91,350
Reconstruction Estimate: $217,500
This small viewing deck is a quick connection to nature for the surrounding neighborhoods. A short, paved path leads to a 25-square-foot deck overlooking a natural rookery. The site is uninviting and needs a complete renovation. The path was not clear as well as being dirty and damaged.
Existing Structures and Amenities:
Current, Planned, and/or Potential Projects: N/A
Deficiencies and Recommendations:
Repair entrance gate, improve signage, and add bike rack
Repave trail and improve native landscape along path
Renovate viewing deck and add sail shade
Include interpretive signage about local flora and fauna, along with the purpose of the rookery
2
WOODMONT NATURAL AREA
Location: 7250 N.W. 80th Ave., Tamarac
Size: 21.06 acres
Type: Natural Area
Basic Improvements Estimate: $340,750
Reconstruction Estimate: $2,515,750
Woodmont Natural Area is the largest remaining natural habitat in the City of Tamarac. The site offers a paved trail through pine flatwoods and a boardwalk trail through a natural wetland, which extends connections to the surrounding neighborhoods. There is ample space for additional amenities and development. This park has no structures. It does have an entry and parking with a paved trail. The architectural team did not visit this park.
Existing Structures and Amenities:
Current, Planned, and/or Potential Projects: N/A
Deficiencies and Recommendations:
Beautify entrance and renovate parking lot
Replace interpretive signage along the trails
Lengthen boardwalk trail system
Replace site furnishings; add a water bottle-fill station
Offer more amenities; the site has space for a small playground and picnic area
Consider adding a small restroom if development includes a playground
Chapter Four Inventory & Level of Service Standards
4.1. Level of Service
The Level of Service (LOS) standards are a measurement of public amenities available within the geographic boundary of the County, including those provided by local municipalities. Identifying inventory totals in relation to Broward’s population totals helps understand the current levels of service of parks, facilities, and amenities available to the residents of the County and supports investment decisions. The LOS can and will evolve over time as the program life cycles and community demographics change.
The recommended standards were evaluated using a combination of resources. These include National Recreation and Park Association (NRPA) guidelines; recreation activity participation rates reported by Sports & Fitness Industry Association (SFIA) 2020 Study of Sports, Fitness, and Leisure Participation as it applies to activities that occur in the United States and in Broward County; community and stakeholder input; statistically valid survey results; and findings from the prioritized needs assessment report and general observations. This combination of information allowed standards to be customized for the Division.
The LOS standards should be used as a guide for future planning and decision making, coupled with conventional wisdom and judgment related to the situation and needs of the community. By applying these facility standards to the service area, gaps and surpluses in park and facility/amenity types are identified. The standards that follow are based upon estimated population figures for 2021 and 2026. A snapshot overview is shown in Figure 16
4.2. Equity Mapping
Service area maps and LOS standards assist management staff and key leadership in assessing where services are offered, how equitable the service distribution and delivery is across Broward County’s service area, and how effective the service is as it compares to the demographic densities. In addition, reviewing per-capita guidelines enables the Division to assess gaps or overlaps in its services, where amenities/ facilities are needed, or where an area is oversaturated.
Based on this, the Division’s leadership can make appropriate capital improvement decisions that meet systemwide needs while assessing the ramifications of the decision on a specific area.
The following list shows the Equity Maps that were developed for each of the major parks, facilities, and amenities:
Parkland
Trails
Pocket Parks
Neighborhood Parks
Community Parks
Regional Parks
Specialty Parks/Natural Areas
Equestrian Trails
Nature Trails
Walk/Run/Jog/Bike Path/Fitness Trails
Indoor Facilities
Indoor Recreation Space
Special-Use Facilities
Outdoor Amenities
Baseball/Softball Fields
Basketball Courts
Dog Parks
Multi-Purpose Fields
Outdoor Pools
Pickleball Courts
Picnic Shelter/Pavilions
Playgrounds
Regional Water Parks
Skate Parks
Splash Pads
Tennis Courts
The source for the population totals used for LOS standard development is the estimated 2021 population as reported by ESRI. The shaded circular areas in the Equity Maps below indicate the service level (i.e., the population being served by that park type/amenity) as outlined in the previous section. The shaded areas vary in size and are dependent upon the quantity of a given amenity (or acre type) at each site and the service levels available to the surrounding population. The larger the circle, the more people a given amenity or park acre serves and vice versa. Additionally, circles may be shaded a different color representing the “owner” of that particular amenity or acre type.
There is a legend in the bottom left-hand corner of each map depicting the various owners included in the equity mapping process. The areas of overlapping circles represent adequate service, or duplicated service, and the areas with no shading represents the areas not served by a given amenity or park acre type.
4.2.1. Pocket Parks
4.2.2. Neighborhood Parks
4.2.3. Community Parks
4.2.4. Regional Parks
4.2.5. Specialty Parks/Natural Areas
4.2.6.
Equestrian Trails
4.2.7. Nature Trails
4.2.8. Walk/Run/Jog/Bike Path/Fitness Trails
4.2.9. Baseball/Softball Fields
4.2.10. Basketball Courts
4.2.11. Dog Parks
4.2.12. Multi-Purpose Fields
4.2.13. Outdoor Pools
4.2.14. Pickleball Courts
4.2.15. Picnic Shelter/Pavilions
4.2.16.
Playgrounds
4.2.17. Regional Water Parks
4.2.18. Skate Parks
4.2.19. Splash Pads
4.2.20. Tennis Courts
4.2.21. Indoor Recreation Space
4.2.22.
Special Use Facilities
Chapter Five Environmental Education Program and Services Assessment
5.1. Introduction
As part of the Plan, PROS Consulting Inc. performed an Environmental Education Programs and Service Assessment (“Environmental Assessment”) of the County’s nature centers. The Environmental Assessment offers an in-depth perspective of program and service offerings provided by the various nature centers and helps identify strengths, challenges, and opportunities regarding programming. The assessment also assists in identifying core programs, program gaps within the community, key system-wide issues, areas for improvement, and future programs and services for residents and visitors.
The consulting team based these findings and comments on a review of information provided by personnel from each of the nature centers including program descriptions, financial data, Website content, and discussions with staff. This report addresses the program offerings from an environmental perspective for the entire portfolio of programs offered among the nature centers.
5.2. Framework
The Division’s mission is focused on three main areas: Recreation, Preservation, and Education. Broward strives to “Provide a countywide park system with diverse facilities and recreation opportunities, along with natural area conservation and researchbased educational outreach, to enhance the well-being of all residents, businesses, and visitors.”
To help in achieving this mission, the Division owns 22 natural areas, several of which offer consistent naturalist-led environmental education programming. In addition, the Division owns and operates four nature centers, which also provide a comprehensive array of environmental, recreational, and educational programs, special event space, and various rental spaces. Analysis of the following four nature centers’ services is in Section 5.2.2.
Anne Kolb Nature Center
Fern Forest Nature Center
Long Key Natural Area & Nature Center
Secret Woods Nature Center
A fifth nature center at Miramar Pineland was recently completed in 2022, after the analysis period.
Secret Woods Nature Center
Long Key Nature Center & Natural Area
Anne Kolb Nature Center
Fern Forest Nature Center
5.3. Nature Center Overview
Each of the nature centers has ancillary services that support each park’s active and passive programs on site. These various services add value to visiting each site and provide additional experiences that can lengthen the time or enhance the overall experience of the visit. Services vary by location, as does the overall environment being highlighted to visitors through their participation.
The County has wisely seized the opportunity to not only educate residents, but to educate visitors through their hospitality. “SUNsational” Service is the County’s commitment to create value for all customers. This is at the core of all services and more so with the ancillary services provided at each of the County’s nature centers.
Facility staff use each center’s natural beauty to their advantage in marketing rental space for all types of gatherings. Most popular are wedding rentals. The combination of scenic destinations and beautiful interior gathering spaces play host to some of the County residents’ most special moments. The emphasis placed on accommodating these important life celebrations memorializes the location to these growing families for their lifetime. It is, for many of them, the reason they bring their children back to learn of the natural environment and of where their family began, growing the future advocates, stewards, and lifelong visitors.
While there are special moments created at the nature centers and the parks, it is the exceptional care by staff and volunteers that preserves and keeps these properties accessible during challenging circumstances. At various times, any one of these unique properties or all of them can be impacted by an unexpected event, be it weather- or peoplerelated. Best practice protocols are in place for responses and staff are well established in pivoting under these circumstances to changing priorities, based on needs. A Division comparison of all four centers has been conducted for visitation, facility rentals, and in-house programs over a three-year period. This gives the Division a snapshot side-byside comparison in areas of similar data tracking.
5.4. Division Nature Center Comparison
From a Division perspective, the consultant team compared a handful of areas where the nature centers are similar in services, which can be used as key performance indicators moving forward.
5.4.1.
Total Visitation
The nature centers track total visitation through a traffic monitoring system that counts each vehicle that enters the park. The Division then uses a multiplier to account for more than one person in vehicles, as an average. The visitation for the nature centers is a tool that can be used in conveying the importance of these unique environments and their preservation for future generations. Overall, the Division’s total participation for all four centers has increased 5% over the analysis period. Each nature center contributes to the overall visitation. It is recommended that each center explore new programming and/or ancillary service ideas in efforts to continue increasing future visitation.
Nature Center Total Visitation
*Note: Due to a nonoperational traffic monitoring system at Long Key for fiscal year 2018/2019, visitations had to be tracked using an alternative, less accurate, method. For this reason, it is believed that the Nature Center’s visitation numbers were actually undercounted and should be viewed as such.
5.4.2. Nature Center Facility Rentals
Nature center facility rentals are important to operations. These gatherings are known to bring in revenue and people that may not have visited the facility before. It is difficult to quantify the number of participants in rentals that will return and visit the parks. However, the staff view these as an opportunity to potentially reach non-visitors who are partaking in these gatherings and could become future users of the park. Rentals have slightly decreased (-7%) for the nature centers overall during the analysis period. As seen in the figures below, total revenue for facility rentals has decreased (-8%) over the analysis period. It is worth mentioning that total revenue increased from fiscal year 2016/17 to fiscal year 2017/18.
Additionally, it should be noted that some rental and programming participations may have been negatively impacted due to uncontrollable circumstances (e.g., the area was struck by hurricanes in 2017/2018 that directly affected some of the nature centers’ rental and programming capabilities.) This needs to be taken into consideration when analyzing the following tables.
Nature Center Facility Rentals
It should be kept in mind that facility rentals include all rentals, including those by partnering organizations that receive subsidized/sponsored rentals. This is likely the reason that even though the number of rentals went up (at Anne Kolb and Secret Woods) these nature centers are still showing a decrease in rental revenue.
Nature Center Facility Rental Revenue
5.4.3. Nature Center In-House Programs
The nature centers offer contracted classes, various guided tours, and in-house programs over a range of environmental, natural, and cultural history topics, including plants and animals of South Florida, climate change, and resilience. This analysis is solely focused on in-house programs. The program revenues have seen an increase (16%), despite the recent decrease (-8%) in participation. It is known that capital projects, such as reconstruction of the observation tower at Anne Kolb Nature Center and weather events such as hurricanes Matthew and Dorian, have impacted operations and attendance at various times over the analysis period. It is also worth noting that participation increased with three of the nature centers as seen in the figure below.
Nature Center In-house Program Analysis
5.5. Nature Centers’ Ancillary Services
The following sections identify the nature centers and their ancillary services, and analyzes these services over a threeyear period, individually.
5.5.1. Anne Kolb Nature Center
This nature center opened in 1996 after several years of planning. Anne Kolb is part of the largest property in the park system with 1,501 acres. This site protects a coastal mangrove wetland, and a variety of plants and animals call this preserve home including endangered and threatened species. The location has several unique features and services including:
Environmental Boat Tours
Exhibit Hall & Nature Tours
Kayak Rentals
Merchandise
Rentals (meeting room & wedding rentals)
Special Events
Volunteering
BOAT TOURS
The analysis shows that public boat tours have decreased 12% in participation and decreased 6% in revenue. It would be beneficial to look at the quality and consistency of the boat tours and ensure there are customer experience standards in place with periodic quality assurance audits. Trends show that a decrease can usually recover when the tours are refreshed with new interactions and quality improvements where possible. It should also be noted that participation in group guided tours has increased 24% over the last three years. Identifying what is different between the two and any similarities can assist staff in re-energizing the boat tours as a service.
During the site assessment, it was noted that the boat was no longer available, and the County is in the procurement process to bring in an improved tour boat. With a new boat, the County should be able to host more participants and do so more reliably. During this interim time, the staff should make plans on how to enhance the guided tours and continuously adjust the tour with new interactions.
Anne Kolb Boat Tours
EXHIBIT HALL/NATURE TOURS
The exhibit hall and nature tours provide an opportunity for a better experience. These interactions broaden perspectives and develop a deeper understanding of the environment and the human population’s place in it. Public visits to the exhibit hall have increased significantly (215%). This increase is largely due to discontinuing the entrance fee to the exhibit hall. The exhibit hall visitation increases interaction to educate the public about the environment at the Anne Kolb Nature Center.
The exhibit halls provide a critical method of enhancing the public’s knowledge of the history of Broward County and the impact that development has over time. With different videos and exhibits, participants can learn about the importance of native species and habitats, and resiliency efforts to address climate change and the resulting problems such as sea-level rise, increasing temperatures, and ocean acidification.
Anne Kolb Exhibit Hall Visitation
MARINA PADDLERS & RENTALS
The kayak rentals and programs are popular within the ancillary services. This up-close and intimate experience in the mangroves helps visitors feel enveloped by nature, reducing the paddlers’ focus to the immediate surroundings. The experience is a powerful way for visitors to leave with a respect for the environment and love for the area being preserved. Marina programs have decreased by 20% during the past three years. However, it is important to note that participation grew more than 100% from fiscal year 2016/17 to fiscal year 2017/18. Additionally, since this is an outdoor activity, weather can play a crucial role and foul weather can make customers apprehensive to venture out. When looking at the passive use through kayak rentals, there has been a 1% increase in participation with a decrease in revenues by 10% during the analysis period. Further, paddlers can appreciate the importance of and effect of mangroves in their natural habitat, quelling the impact and rise of the ocean as they seek a shady break during their trip.
Anne Kolb (at West Lake) Marina Visitation
FACILITY RENTALS
All of the nature centers track their rental types by category. As shown in Figure 17 to the right, meetings/ conferences and weddings are by far the most popular types of rentals at Anne Kolb, each averaging 32% and 22% (respectively) of the center’s total annual rentals over the last three fiscal years.
Additionally, rentals are tracked by fee-based and co-sponsorship rentals (non-fee-based). Cosponsorship rentals are uses of the spaces by partnering organizations. The organizations are made up from user groups, civic organizations, clubs with specific interests, other municipalities, and other County agencies.
Fee-based total rentals have increased 13% during the analysis period, yet revenue has decreased by 18%. Where non-fee-based rentals as a whole have increased 32%, the co-sponsorship events (non-feebased) increased 47%. It is important to ensure that non-fee-based rentals are not occupying peak demand timeslots. Not only do co-sponsorships receive the benefit of the space, they
impact on revenue generation.
Anne Kolb Hall Rentals
AnneKolbAnnualRentalsbyCategory
Figure 15: Anne Kolb Facility Rentals
MERCHANDISE
Merchandise sales have been decreasing during the analysis period. Merchandising can contribute to more than the bottom line. Attractive merchandise can help achieve a greater reach with impressions outside of the nature center by guests exhibiting the special place they enjoyed and enticing others to visit. Land permitting, it may also be beneficial to feature a community garden with native species for visitors to see and purchase, supplementing the rotating Native Plant Sales that already occur. Not only should such an initiative benefit the local environment, but it could be used to engage volunteers and generate a self-sustaining revenue stream.
SPECIAL EVENTS & PROGRAM PARTICIPATION
Special event and program participation have increased 17% and 7% respectively. Even more interesting is the rate at which employee-taught programming increased in revenue 89%. Understanding the significant increase from fiscal year 2016/17 to fiscal year 2017/18 could help identify changes to the programs that could be beneficial outside of Anne Kolb. Nature center programs typically focus on guided nature tours, EcoAction volunteer workdays, and general nature education. To reinforce the Division’s focus on resiliency and sustainability into the future, additional topics could focus on the impact each household or business may have and the efforts of the County to mitigate for the impacts of climate change.
Anne Kolb Event and Programs Participation
Anne Kolb Merchandise Revenue
MEETINGS/CLUBS & VOLUNTEERS
Meeting space for community organizations and various clubs in the County are great ways to cross over and gain opportunities with audiences the nature center may otherwise have difficulty reaching. Clubs have the ability to contribute, and in many instances do, to the nature center’s overall volunteer efforts. Total participation in meetings and clubs has increased 48%. Volunteer participation has decreased 35% during the analysis period, yet total volunteer hours have increased 5%. Volunteers are tracked on a calendar year (January 1 to December 31) and not the fiscal year (October 1 to September 30). It should be noted that “volunteer hours” is a combination of regular volunteers and workday volunteers. The noticeable fluctuation in volunteer hours is a direct cause of large groups coming out for EcoAction Days, which is rather unpredictable.
Anne Kolb Meeting/Clubs and Volunteer Participation
Note: Volunteer numbers are on a calendar year basis.
TOTAL VISITATION
Total visitation has increased approximately 10% during the analysis period. Continual increased visitation will help the Division accomplish a large part of the preservation and education in its mission.
Anne Kolb Visitation
5.5.2. Fern Forest Nature Center
The nature center opened in 1985 and is designated as an Urban Wilderness Area. Fern Forest is 247 acres of preserved environment. With more than 10 plant communities and more than 30 varieties of ferns, this property takes you into a lush forest and wetlands. The site protects a unique environment that began decreasing in size in the early 1900s due to development and the need for dry land to build upon. It is due to the wet nature of Fern Forest that there are elevated boardwalks throughout, which also limits the property uses. The location has several unique features and services including:
Nature Center Exhibits
Nature Tours
Rentals (meeting room & wedding rentals)
Special Events
Volunteering
NATURE TOURS
Nature tour participation numbers also include the program participation. For this reason, we have included the revenue from employee-taught classes in this analysis. Participation has increased 7%. Although revenues have decreased 14% over the period, they have also increased in the most recent fiscal year.
FACILITY RENTALS
Assessing rental types by category, Fern Forest’s hall and amphitheater are used primarily for weddings. As seen in Figure 18 to the right, weddings make up roughly three-quarters of all rentals over the last three fiscal years.
Hall rentals and revenues have decreased 2% and 14% respectively. More noticeably, co-sponsorship events (non-fee-based) have decreased 33%.
Fern Forest Exhibit Hall Visitation
Fern Forest Hall Rentals
Figure 16: Fern Forest Facility Rentals
SPECIAL EVENTS
Special event participation has increased marginally at 2%.
Forest Event Participation
VOLUNTEERS
Volunteer participation has decreased by 63% during the analysis period, while the total number of hours has increased 29%. This implies that there are fewer volunteers working more hours. It is important to monitor volunteer fatigue to ensure a returning volunteer. As an example, a local teacher recently retired who used to provide additional school credits for volunteering at Fern Forest, which has impacted the participation numbers. Fern
Forest Volunteer Participation
TOTAL VISITATION
Total visitation has increased 14% during the analysis period, however, it has decreased from fiscal year 2017/2018 to fiscal year 2018/2019.
Fern Forest Visitation
5.5.3. Long Key Natural Area & Nature Center
Long Key Natural Area is a one-of-a-kind location. It is home to the Long Key Nature Center and was purchased by the County to preserve the property and the rich heritage it has been known for from past civilizations and more modernday uses. The park opened in 2008 and features nature and equestrian trails, an exhibit hall, a large rental facility, and an exhibit hall on 160 acres. The exhibit hall captures the archaeology, history, and ecology of the property, educating visitors as to the importance of its preservation. The exhibits are a higher standard than typically exist in nature centers and are more along the quality of a museum in order to tell the full story of the environment and past civilizations that lived there. Long Key is a popular destination for tourists including cruise ship passengers due to its rich history and prior land use. Ancillary services include:
Exhibit Hall & Nature Tours
Nature Tours
Rentals (meeting room & wedding rentals)
Partnerships
NATURE TOURS
Nature tour participation has increased significantly by 109% over the analysis period. Participation fluctuates annually and increased by nearly 900 participants from fiscal year 2017/18 to fiscal year 2018/19.
Long Key Exhibit Hall Visitation
PROGRAMS
Programming has not been consistent over the analysis period. This is due in part to staff shortages and other priorities including hurricane clean-up and projects. As a result, revenues from programming have decreased 36%.
Long Key Programming
FACILITY RENTALS
Assessing rental types by category, Long Key’s hall and room are used primarily for weddings and meetings/conferences. As seen in Figure 19 to the right, weddings and meetings/conferences make up roughly two-thirds of all rentals over the last three fiscal years.
Rentals for Long Key include the classroom and the hall, both of which have decreased 26% and 24% respectively over the last three fiscal years. Rentals, like group tours, fluctuate annually. It is the largest source of earned income from Long Key. Revenues have been slightly impacted by the decrease in rentals 1%.
LongKeyAnnualRentalsbyCategory
Figure 17: Long Key Facility Rentals
Long Key Facility Rentals
TOTAL VISITATION
Total visitation has experienced a recent decrease during the analysis period. However, it has increased from fiscal year 2016/2017 to fiscal year 2017/2018.
Long Key Visitation
5.5.4. Secret Woods Nature Center
The County’s first nature center opened in 1978. Secret Woods is a perfect name for this park bordered to the north by the South Fork New River and the south by State Road 84. The visitors experience an urban oasis when walking along the trails through the thick tree canopy and areas of dense undergrowth. This first-of-its-kind, and appropriately labeled, urban wilderness places an emphasis on nature through nature trails, a nature exhibit hall, Pollinator Pathway, and nature-oriented programming. Secret Woods preserves almost 56 acres of mature tree canopy and undergrowth including cabbage palms, fig trees, laurel oaks, and red bay as examples. Ancillary services include:
Nature Center Exhibits
Rentals (meeting room & wedding rentals)
Special Events & Programming
Volunteering
FACILITY RENTALS
Secret Woods rents out its hall and butterfly garden for events and gatherings with an event breakdown as shown in Figure 20. Weddings and baby showers are by far the most popular types of rentals at Secret Woods, each making up 37% and 27%, respectively, of the center’s total annual rentals.
In addition to the rental categories, the hall rentals have increased 18% while revenues have decreased 3% during the analysis period. Furthermore, cosponsorship rentals also decreased 33% over the same time period.
Secret Woods Hall Rentals
SecretWoodsAnnualRentalsbyCategory
Figure 18: Secret Woods Facility Rentals
SPECIAL EVENTS & PROGRAM PARTICIPATION
Special event participation has increased significantly by 98% over the analysis period. Naturalist programming has decreased in participation by 39% and revenue by 16%. It is important to understand that renovations and Hurricane Dorian impacted the programming from the last two fiscal years.
Secret Woods Event and Programs Participation
MEETINGS/CLUBS & VOLUNTEERS
Total participation in meetings has decreased 10%. Volunteer participation has decreased 20% over the analysis period. It is worth noting that the weather played a role in the decrease from fiscal year 2017/18 to fiscal year 2018/19.
Secret Woods Meeting/Clubs and Volunteer Participation
TOTAL VISITATION
Total visitation has increased marginally over the analysis period by 5%.
Secret Woods Visitation
5.6. Nature Center Partners
The nature centers are near and dear to many County residents. The rich histories and locations make them a magnet for visitors and residents alike. With a wide segment appeal, partners have become part of the family through their use, help with preservation through volunteers, program assistance, and donations. The following is a list of partners with the Division at the time the analysis was conducted.
Broward County Parks and Recreation Partners
County Agency Partners
Aviation Department
Broward County Commissioners’ Offices
Broward County Schools
Community Partnership’s Division
Elderly and Veterans Services Division
Environmental Engineering Division
Environmental Protection and Growth Management Division
Family Success Administration
Human Resources Division
Human Services Department
Learning and Organizational Development Section
Nancy J Cotterman Center
NatureScape
Office of Intergovernmental Affairs
Office of Regional Communications and Technology
Office of the County Attorney
Office of the County Auditor
Pollution and Prevention Division
Purchasing Division
Supervisor of Elections
Transit Division
Other Partners
Boy Scouts of America
Broward County Butterfly Chapter of the North American Butterfly Association
Broward County Crime Commission
Broward Victim Right’s Coalition
Everglades Birding Festival
Florida Department of Agriculture and Consumer Services
Florida Fish and Wildlife Conservation Commission
Florida Master Gardeners
Florida Master Naturalists
Florida Native Plant Society
Florida Recreation and Park Association
Friends of Groups and the Parks Foundation of Broward County
Girl Scouts of America
HandsOn Broward
Healthy Mothers Healthy Babies
International Dark Sky Association
P3 Environmental Challenge
Publix Cares Day
Sierra Club of Broward County
South Florida Audubon Society
Local Municipalities
University of Florida Institute of Food and Agricultural Sciences Extension Education
Urban League of Broward County
US Department of Agriculture
5.7. Conclusion
As the Division, the nature centers, and services continue to evolve it will be crucial to ensure key metrics are being tracked consistently and monitored on an annual basis. Below are some overall observations that were identified during this analysis.
Total visitation has experienced a slight increase of 5% during the analysis period, with Anne Kolb having 255,267 visitors, the highest visitation in the most recent fiscal year. However, visitation numbers have decreased from fiscal year 2017/18 to fiscal year 2018/19 and were impacted by capital projects such as the reconstruction of the Anne Kolb observation tower and weather events, limiting access to the parks.
Facility rentals have decreased 7% overall and revenue has decreased 8%. Overall revenues increased from fiscal year 2016/17 to fiscal year 2017/18 before decreasing in fiscal year 2018/19. Facility rentals generate the largest collective amount of revenue for the nature centers.
In-house programs have decreased 8% overall in participation but have coincidingly increased in revenues by 16%. Moving forward, it will be important for nature centers to overcome one constant challenge in order to increase program participation. The Division will need to focus on finding new methods of delivering nature education and environmental resilience to younger audiences and keeping those audiences engaged over the years.
Anne Kolb and Long Key nature centers are the two most recent nature centers added to the system, while Secret Woods and Fern Forest were opened decades earlier. Differences in the exhibit halls and size of spaces can be attributed to the changes in the industry focusing on the customer experience and outcomes.
Fern Forest and Secret Woods have elevated boardwalks to allow visitors to reach locations on site that would otherwise be untraversable to most people. While it is the environment dictating the need for elevated boardwalks that take visitors to the interior of these parks, it is the same enticing beauty that limits the use of these parks as well.
As the Division completed construction of a new nature center at Miramar Pineland, it should be careful to note the key success factors for each of the other centers. Although a site-specific plan is core to long-term success, discounting the lessons already learned would be a disservice to the community.
The nature centers and natural areas are core to the mission of the County park system with preservation and education efforts. It is much greater than just being core to the Division’s mission, it is ultimately important to all residents that every effort be made to preserve these sites and educate the visitors on the impacts to the environment from a local and tourism standpoint. Outdoor recreation has evolved into ecotourism. This is a great way to preserve the environment and local heritage in a sustainable manner by making it relevant to tourists, enhancing the experience, and helping to foster a greater understanding of human existence in sensitive environments.
Chapter Six Program Assessment
6.1. Program Assessment Overview
Below are some overall observations that stood out when analyzing all four program assessment sheets from each of the nature centers.
Overall, the program descriptions effectively communicate the key benefits and goals of each Core Program Area. Age segment distribution is effective but needs to be annually monitored to ensure program distribution aligns with community demographics.
Program lifecycles: Approximately 13% of the system’s current programs are categorized in the Introduction Stage, while 2% of programs fall into the Decline Stage. A complete description of Lifecycle Stages can be found later in this chapter.
The County’s volunteer program allows residents and organizations to easily get involved and give back to the community through various volunteer opportunities, friends groups, special events, and programs, but there are some concerns with the organization, processing, and tracking of volunteer applications and efforts. The Division is currently leading a countywide initiative to improve the volunteer onboarding and tracking process, which should better facilitate volunteer efforts in the future.
From a marketing and promotions standpoint, the staff use a variety of marketing methods when promoting their programs including printed and online program guides, the County’s Website, flyers/brochures, email blasts, paid advertisements, on-hold preprogrammed phone messages, online newsletters, in-facility signage, QR codes, and various social media channels as a part of the marketing mix.
The Division, as well as each nature center, would benefit from identifying marketing Return on Investment (ROI) for all marketing initiatives
Opportunity to increase the number of cross-promotions
Currently, customer feedback methods are rather limited. Moving forward, it is highly recommended that each site begins incorporating user feedback, on a more consistent basis, as a key performance measure that can be tracked over time. Specifically, preprogram questionnaires and customer surveys can be beneficial feedback tools that should be considered moving forward.
Pricing strategies are very consistent when assessing Core Program Areas. Currently, the most frequently used approaches include market competition rates and the County Fee Schedule. With the County using a developed fee structure, the implementation of additional pricing strategies is limited.
Financial performance measures such as cost recovery goals are not currently being fully used. Moving forward, it is recommended for staff to begin tracking cost recovery for all Core Program Areas. When doing so, the staff should factor in all direct and indirect costs pertaining to programming. A focus on developing consistent earned income opportunities would be beneficial to the Division’s overall quest for greater fiscal sustainability.
6.1.1. Core Program Areas
To help achieve the mission, it is important to identify Core Program Areas based on current and future needs to create a sense of focus around specific program areas of greatest importance to the community. Public recreation is challenged by the premise of being all things to all people. The philosophy of the Core Program Area is to assist staff, policymakers, and the public to focus on what is most important. Program areas are considered as Core if they meet a majority of the following categories.
The program area has been provided for a long period of time (over four to five years) and/or is expected by the community.
The program area consumes a relatively large portion of 5% or more of the agency’s overall budget.
The program area is offered three to four seasons per year.
The program area has wide demographic appeal.
There is a tiered level of skill development available within the program area’s offerings.
There are full-time staff responsible for the program area.
There are facilities designed specifically to support the program area.
The agency controls a significant percentage of the local market at 20% or more.
EXISTING CORE PROGRAM AREAS
In consultation with the Division staff, the consultant team used the Monthly Activity Reports to identify Core Program Areas within all of the nature centers. After discussion, six Core Program Areas were agreed upon. Please note that this is not an all-encompassing list and that not all Core Program Areas are offered at all of the nature centers.
Description: A unique boating experience by personal watercraft or tour boat connects patrons to the waters, wildlife, and natural resource value of West Lake's mangrove habitat.
Goals: To promote preservation of our unique mangrove habitat and an understanding of the flora and fauna of South Florida by offering engaging recreational boating activities and access to the resource for the general public.
Description: Use outside talent to expand use and appreciation of amenities.
Public Guided Nature
Boat Tour
Full Moon Paddle
Kayak Class
Paddling Eco Tour
Stand-Up
Paddleboard Class
Line Dancing
Yoga
Goals: To provide services to the community using non-staff instructional resources.
Description: A gathering space for volunteers and clubs that support the core mission of education, preservation, recreation, and community support.
Goals: To support community and naturerelated meetings and clubs as a way of developing community engagement for the environment and local involvement.
Friends of Anne Kolb/Volunteers
Florida Trails Association
NABA Broward
Chapter
Friends of Long Key
Description: A variety of passive and active nature programs and activities that focus on the natural history and geological features as well as the unique flora and fauna that inhabit or visit our diverse Broward County habitats. Additionally, expose patrons to general science and nature topics that expand our view of the natural world and our impact on it.
Guided Exhibit Hall Tour
Lunch-and-Learn
Nature Series
Nature Tots
Goals: To provide a variety of programs and activities that educate our visitors on the value of natural areas for the resilience of our planet. To promote a sense of community in support of conservation and environmental education, all while developing an understanding of the importance of natural areas and ecosystem diversity on our own health and well-being.
Description: Meeting and event areas located in natural settings, offering unique and one-of-akind locations for public use.
Themed Hikes
Sea Turtles and Their Babies
Goals: To generate additional revenue.
Description: A variety of events ranging from nature to art programs that appeal to a diverse audience while experiencing native Florida habitats highlighted at each site.
Goals: To provide special events that include a variety of science and arts focused topics for all ages.
Royal Fern Hall Amphitheaters
Shelters
Julia Hall and Butterfly Glade
Plant Sales
Music Club of
Hollywood Concerts
Everglades Birding Festival
Themed Nature and Art Events
6.1.2. Core Program Area Recommendations
These existing Core Program Areas are environmentally mission driven and provide a well-rounded and diverse array of programs that can serve the community at present. Based upon the observations of the planning team, demographic data, and recreation trends information, the nature center staff should evaluate Core Program Areas and individual programs, ideally on an annual basis, to ensure offerings are relevant to evolving demographics and trends in the local community.
After reviewing the Statistically Valid Community Survey results shown in Figure 21, it is apparent that environmental education is important to the community. Out of all program areas, outdoor environmental education programs ranked in the top third in regard to households having a need for various programs. It is critical for the Division’s nature centers to continue their existing program offerings while also actively seeking new program opportunities.
Additional program areas in nature centers should further explore developing a key service based on survey findings, including Adult fitness & wellness programs, Exercise classes, and Senior programs. Some of these types of programs are already being offered at certain centers but could be expanded throughout the remaining centers and possibly rotate through the regional parks as well. Furthermore, in light of the lessons learned during the pandemic, virtual programs are a great alternative that nature centers could offer to the public. Such programs could include virtual walks throughout the boardwalks or a virtual introduction to various plants/animal species that can be found at each center.
Figure 19: Household Need for Programs
6.1.3. Program Strategy Analysis
AGE SEGMENT ANALYSIS
The table below depicts each Core Program Area and the most prominent age segments it serves. Recognizing that many Core Program Areas serve multiple age segments, Primary (noted with a ‘P’) and Secondary (noted with an ‘S’) markets are identified. Primary rankings are the main target of programs within a Core Program Area, the age segment that benefits the most. Secondary is an age segment that is not the main focus of services but are also served as part of the market.
Age Segment Analysis
For this report, an Age Segment Analysis was completed by Core Program Area, exhibiting an over-arching view of the age segments served by different program areas and displaying any gaps in segments served. It is also useful to perform an Age Segment Analysis by individual programs to gain a more nuanced view of the data. Based on the age demographics of the County, current programs seem to be well aligned with the community’s age profile. With roughly 50% of Broward County’s population ranging between 35 and 74, it is fitting that the Adult and Senior segments are highly catered to.
The lack of primary programs dedicated to the Preschool segment is noticeable. It is recommended that the nature centers consider introducing new programs to address any unmet needs. With approximately 20% of the County’s overall population falling between 0 and 17 years old, offering an adequate number of Preschool and Youth programs is essential for the Division’s success. Also, getting local youth involved in conservation and preservation at a young age can lead to increased volunteerism, while potentially creating lifetime users and advocates of the system.
Staff should continue to monitor demographic shifts and program offerings to ensure that the needs of each age group are being met. This can be done by conducting pre-/post-user surveys for all program offerings. It would also be best practice to create a plan including what age segment to target, how to establish the message, which marketing method(s) to use, create the social media campaign, and determine what to measure for success before allocating resources toward a particular effort.
PROGRAM LIFECYCLE
A Program Lifecycle Analysis involves reviewing each program offered by each nature center to determine the stage of growth or decline for each. This provides a way of informing strategic decisions about the overall mix of programs managed by the agency to ensure an appropriate number of programs are “fresh” and that relatively few programs, if any, need to be discontinued. This analysis is not based on strict quantitative data, but rather, is based on staff members’ knowledge of their program areas. The following table shows the percentage distribution of the various lifecycle categories of the County’s nature center programs. These percentages were obtained by comparing the number of programs in each individual stage with the total number of programs listed by staff members.
Lifecycle Description
The Lifecycle Analysis depicts a rather healthy program distribution. Approximately 59% of all programs fall within the beginning stages (Introduction, Take-Off, & Growth). It is recommended to have 50 to 60% of all programs within these beginning stages because it provides the nature centers an avenue to energize their programmatic offerings. Eventually, these programs will begin to move into the Mature stage, so these categories ensure the pipeline for new programs is there. It is key to continue adding new programs in the Introduction stage as those programs are meant to progress through the lifecycle stages.
According to staff, 33% of all program offerings fall into the Mature Stage. This stage anchors a program portfolio, and it is recommended to have roughly 40% of programs within the Mature category to achieve a stable foundation.
Additionally, 8% of programs are in the Saturation or Decline Stages. It is a natural progression for programs to eventually evolve into saturation and decline. However, if programs reach these stages rapidly, it could be an indication that the quality of the programs does not meet expectations, or there is not much of a demand for the programs.
As programs enter the Decline stage, they must be closely reviewed and evaluated for repositioning or elimination. When this occurs, the nature centers should modify these programs to begin a new lifecycle with the Introductory stage or add completely new programs based upon community needs and trends.
Staff should complete a Program Lifecycle Analysis on an annual basis and ensure that the percentage distribution closely aligns with desired performance. Furthermore, each nature center should include annual performance measures for each Core Program Area to track participation growth, customer retention, and the percentage of new programs as an incentive for innovation and alignment with community trends.
PROGRAM CLASSIFICATION
Conducting a classification of services analysis shows how each program serves the overall organization mission, the goals and objectives of each Core Program Area, and how the program should be funded with regard to tax dollars and/or user fees and charges. Program classification can help to determine the most appropriate management, funding, and marketing strategies.
Program classifications are based on the degree to which the program provides a public benefit versus a private benefit. Public benefit can be described as everyone receiving the same level of benefit with equal access, whereas private benefit can be described as the user receiving exclusive benefit above what a general taxpayer receives for their personal benefit.
For this exercise, the nature centers used a classification method based on three indicators: Essential Services, Important Services, and Value-Added Services. Where a program or service is classified depends upon alignment with the organizational mission, how the public perceives a program, legal mandates, financial sustainability, personal benefit, competition in the marketplace, and access by participants. The following graphic describes each of the three program classifications.
•Nature Centers May Provide: with additional resources, it adds value to community, it supports Core & Important Services, it is supported by community, it generates income, has an individual benefit, can be supported by user fees, it enhances community, and requires little to no subsidy
•Nature Centers Should Provide: if it expands & enhances core services, is broadly supported & used, has conditional public support, there is a economic / social / environmental outcome to the community, has community importance, and needs moderate subsidy
•Nature Centers Must Provide: if it protects assets & infrastructure, is expected and supported, is a sound investment of public funds, is a broad public benefit, there is a negative impact if not provided, is part of the mission, and needs high to complete subsidy
With assistance from staff, a classification of programs and services was conducted for all recreation programs offered by the nature centers. The results presented in the following table represent the current classification of recreation program services. Programs should be assigned cost recovery goal ranges within those overall categories.
Anne Kolb Program Classification Distribution
As the Division continues to evolve to better meet the community’s needs, there could be an added benefit to managing the services if they all were classified according to the Cost Recovery Model for Sustainable Services depicted in Figure 22 below.
Individual Benefit: exclusive benefit received by individuals and not the general public; individual pays at least 80% of the cost of service
Considerable Individual Benefit: nearly all benefit received by individuals, benefit to community in a narrow sense Balanced Community & Individual Benefit: benefits accrued to both individual and general public interests, but to a significant individual advantage
Cost Recovery Model for Sustainable Services
Given the broad range of cost recovery goals (i.e., 0 to 40% for Essential Services or 40 to 80% for Important Services), it would be helpful to further distribute programs internally within sub-ranges of cost recovery as depicted in the previous Figure. This will allow for programs to fall within an overall service classification tier while still demonstrating a difference in expected/desired cost recovery goals based on a greater understanding of the program’s goals (e.g., pure Community Benefit services versus mostly Community Benefit services or Community Benefit and Individual Benefit mix versus mostly Individual Benefit).
Figure 20: Cost Recovery Model
COST-OF-SERVICE & COST RECOVERY
Cost recovery targets should be identified for, at minimum, each Core Program Area, as well as for specific programs or events when realistic. The previously identified Core Program Areas would serve as an effective breakdown for tracking cost recovery metrics, including administrative costs. Theoretically, staff should review how programs are grouped for similar cost recovery and subsidy goals to determine if current practices still meet management outcomes.
Determining cost recovery performance and using it to make informed pricing decisions involves a three-step process:
1. Classify all programs and services based on the public or private benefit they provide (as completed in the previous section).
2. Conduct a Cost-of-Service Analysis to calculate the full cost of each program.
3. Establish a cost recovery percentage, through established Division standards, for each program or program type based on the outcomes of the previous two steps and adjust program prices accordingly.
The following provides more detail on steps 2 & 3.
UNDERSTANDING THE FULL COST OF SERVICE
To develop specific cost recovery targets, full cost of accounting needs to be created on each class or program that accurately calculates direct and indirect costs. Cost recovery goals are established once these numbers are in place, and the nature centers’ program staff should be trained in this process. A Cost-of-Service Analysis should be conducted on each program, or program type, that accurately calculates direct (i.e., program-specific) costs and indirect (i.e., comprehensive, including administrative overhead) costs. Completing a Cost-of-Service Analysis not only helps determine the true and full cost of offering a program, but it also provides information that can be used to price programs based upon accurate delivery costs. The figure below illustrates the common types of costs that must be accounted for in a Cost-of-Service Analysis.
Figure
The methodology for determining the total Cost of Service involves calculating the total cost for the activity, program, or service, then calculating the total revenue earned for that activity. Costs (and revenue) can also be derived on a perunit basis. Program or activity units may include:
Number of participants
Number of tasks performed
Number of consumable units
Number of service calls
Number of events
Required time for offering program/service
Agencies use Cost-of-Service Analysis to determine what financial resources are required to provide specific programs at specific levels of service. Results are used to determine and track cost recovery as well as to benchmark different programs provided by the nature centers between one another. Cost recovery goals are established once Cost-ofService totals have been calculated. Program staff should be trained in the process of conducting a Cost-of-Service Analysis and the process should be undertaken on an annual basis and during the initial program development.
CURRENT COST RECOVERY
Regarding programs, services, and events, methods to measure and track cost recovery are not consistently used up to this point. It is best practice to have cost recovery goals at the Core Program Area level and, over time, evolve into implementing cost recovery goals at the individual program level as well. Setting, tracking, and reaching cost recovery goals for every Core Program Area will help each nature center justify program expense and make a case for additional offerings in the future.
Cost recovery targets can vary based on the Core Program Area, and even at the program level within a Core Program Area. Several variables can influence the cost recovery target, including lifecycle stage, demographic served, and perhaps most important, program classification. Programs within each Core Program Area will vary in price and subsidy level. The program mix within each Core Program Area will determine the cost recovery capabilities. To begin establishing goals the Division should determine the current cost recovery of each Core Program Area. With an approved cost recovery goal, annual tracking, and quality assurance cost recovery goals will improve. Use this key performance indicator and update annually to include current cost recovery goals and the actual cost recovery achieved. Each Core Program Area can be benchmarked against itself on an annual basis.
COST RECOVERY BEST PRACTICES
Cost recovery targets should reflect the degree to which a program provides a public versus individual good. Programs providing public benefits (i.e., Essential programs) should be subsidized more by the Division; programs providing individual benefits (i.e., Value-Added programs) should seek to recover costs and/or generate revenue for other services. To help plan and implement cost recovery policies, the consultant team has developed the following definitions to help classify specific programs within program areas.
Essential Programs category is critical to achieving the organizational mission and providing communitywide benefits and generally receive priority for tax-dollar subsidization.
Important or Value-Added program classifications generally represent programs that receive lower priority for subsidization.
▪ Important programs contribute to the organizational mission but are not essential to it; cost recovery for these programs should be high (i.e., at least 80% overall).
▪ Value-Added programs are not critical to the mission and should be prevented from drawing upon limited public funding, so overall cost recovery for these programs should be near or in excess of 100%.
PRICING
Pricing strategies are one mechanism agencies can use to influence cost recovery. Overall, the degree to which the nature centers use various pricing strategies is rather limited due to a fixed County Fee Schedule given to the sites. For that reason, pricing tactics are concentrated in County Fee Schedule rates and market competition rates. However, some core areas also use weekday/weekend rates and prime/non-prime time rates.
The Core Program Area with the largest variety of pricing strategies is Rentals, which uses four of the 11 options. Moving forward, the Division should consider using additional pricing strategies such as age segment pricing, family/household status, and cost recovery goals, as they are also valuable strategies when setting prices. These untapped pricing strategies are useful to help stabilize usage patterns and help with cost recovery for higher-quality amenities and services. The consultant team recommends that all Core Program Areas use cost recovery as a major factor in determining pricing and look at underutilized pricing strategies to bolster participation and revenue.
Staff should continue to monitor the effectiveness of the various pricing strategies they employ and adjust as necessary. It is also important to continue monitoring the pricing and offerings of competing service providers. The table below details pricing methods currently in place by each Core Program Area and additional areas for strategies to implement over time.
Pricing Strategies
PROGRAM STRATEGY RECOMMENDATIONS
In general, the nature center program staff should continue the cycle of evaluating programs on both individual merit as well as program mix. This can be completed at one time on an annual basis, or in batches at key seasonal points of the year, if each program is checked once per year. The following tools and strategies can help facilitate this evaluation process:
MINI BUSINESS PLANS
The planning team recommends that Mini Business Plans (two to three pages) for each Core Program Area be updated on a yearly basis. These plans should evaluate the Core Program Area based on meeting the outcomes desired for participants, cost recovery, percentage of the market and business controls, Cost of Service, pricing strategy for the next year, and marketing strategies that are to be implemented. If developed regularly and consistently, they can be effective tools for budget construction and justification processes in addition to marketing and communication tools.
PROGRAM DEVELOPMENT & DECISION-MAKING MATRIX
When developing program plans and strategies, it is useful to consider all the Core Program Areas and individual program analysis discussed in this Program Assessment. Lifecycle, Age Segment, Classification, and Cost Recovery Goals should all be tracked, and this information along with the latest demographic trends and community input should be factors that lead to program decision-making. Community input can help staff focus on specific program areas to develop new opportunities, who to target, and what are the best marketing methods to use.
A simple, easy-to-use tool like the examples below will help compare programs and prioritize resources using multiple data points rather than relying solely on cost recovery. In addition, this analysis will help staff make an informed, objective case to the public when a program that is in decline, but beloved by a few, is retired. If the program/service is determined to have strong priority, appropriate cost recovery, good age segment appeal, good partnership potential, and strong market conditions, the next step is to determine the marketing methods shown in Figure 24 below.
PROGRAM EVALUATION CYCLE (WITH LIFECYCLE STAGES)
Using the Age Segment and Lifecycle analysis, along with other established criteria, the program staff should evaluate programs on an annual basis to determine program mix. This can be incorporated into the Program Operating/Business Plan process. A diagram of the program evaluation cycle and program lifecycle is found in Figure 25 below. During the Introductory Stages, program staff should establish program goals, design program scenarios and components, and develop the program operating/business plan. Regular program evaluations will help determine the future of a program.
If participation levels are still growing, continue to provide the program. When participation growth is slowing, or nonexistent, or competition increases, staff should look at modifying the program to re-energize the customers to participate. When program participation is consistently declining, staff should terminate the program and replace it with a new program based on the public’s priority ranking and/or in activity areas that are trending nationally/regionally/locally, while taking into consideration the anticipated local participation percentage.
Figure 23: Program Evaluation Lifecycle
MARKETING, VOLUNTEERS, AND PARTNERSHIPS
CURRENT RECREATION MARKETING AND COMMUNICATIONS
The Division follows a marketing plan that currently communicates with residents through printed and online program guides, the County’s Website, flyers/brochures, email blasts, paid advertisements, on-hold pre-programmed phone messages, online newsletters, in-facility signage, QR codes, and various social media channels (County and site-specific accounts).
Effective communication strategies require striking an appropriate balance between the content with the volume of messaging while using the “right” methods of delivery. The Division has a broad distribution of delivery methods for promoting programs. It is imperative to continue updating the marketing plan annually to provide information for community needs, demographics, and recreation trends.
An effective marketing plan must build upon and integrate with supporting plans and directly coordinate with organization priorities. The plan should also provide specific guidance as to how the Division’s identity and brand are to be consistently portrayed across the multiple methods and deliverables used for communication.
WEBSITE
The Division’s home page has a scrolling “Quick Links” bar directing users to secondary pages with various information including Things to Do, Upcoming Events, What’s New, Special Populations, and more. This allows visitors to locate and access information by what they want to do, making the Web page activity based. Fees are listed by activity and in a separate dropdown menu. A more user-friendly layout could improve user experience on the Website. Consider including ancillary service fees, site tours/videos from YouTube channel, and history of each site on the landing page for each facility. Additionally, directly below the “Quick Links” bar is “Park Locations,” which allows users to find all of Broward County’s various parks/facilities with ease.
SOCIAL MEDIA
The County’s Parks Division uses Web 2.0 technology through Facebook, Twitter, and YouTube. The Division currently has 9.5K Facebook followers, 5,752 Twitter followers, 3.9K Instagram followers, and 588 subscribers to the YouTube Channel. The key to successful implementation of a social network is to move the participants from awareness to action and create greater user engagement. This could be done by:
Allowing controlled “user-generated content” by encouraging users to send in their pictures from the County’s special events or programs.
Introducing Facebook-only promotions to drive greater interest in the parks by following their page.
Leverage the Website to obtain customer feedback for programs, parks, facilities, and customer service.
Expand opportunities for crowdsourcing information on an ongoing basis using betterparksbetterbroward.com. Crowdsourcing is used for a callout of all types of resources such as labor, volunteers, and equipment to help accomplish your set goal.
Some existing resources include mindmixer.com and peakdemocracy.com, which can be evaluated if the Division has the resources and can use them on an ongoing basis.
Crowdsourcing options could include printing program guides or developing marketing materials.
Provide opportunities for donations or crowdfunding through the Website. Other crowdfunding organizations that can be used as a callout to complete a project or meet a goal financially include:
o kickstarter.org/indiegogo.com/razoo.com - These sites help bring small amounts of money together to create needed capital.
o Even if the County may not be allowed to directly benefit from these types of campaigns, they could be used to bring awareness and funds to the Parks Foundation and/or other friends/volunteer groups throughout the Division.
Maximize the Website’s revenue-generating capabilities by incorporating direct links to reserve facilities or register for programs.
Conduct annual Website strategy workshop with the staff to identify ways and means that the Website can support the County’s social media trends.
SOCIAL MEDIA USERS
Over the last decade, social media has become one of the country’s fastest-growing trends. With only 10% of the country using social media in 2008, today, an estimated 79% of the U.S. population is currently using some form of social media. With such a large percentage of the population using these online media platforms in their daily lives, it becomes essential for the County to take advantage of these marketing opportunities. Social media can be a useful and affordable tool to reach current and potentially new system users. Such platforms as Facebook, YouTube, Instagram, Pinterest, Twitter, and LinkedIn are extremely popular with not only today’s youth but also young and middle-aged adults.
Below is a chart that depicts the most frequently used social media sites throughout the world. As of August 2019, Facebook stands out as the most heavily trafficked social media platform, with an estimated 2.2 billion visitors per month. YouTube is second with 1.9 billion visitors per month.
Ensure the marketing plan includes the components and strategies identified in this section.
Establish priority segments to target in terms of new program/service development and communication tactics.
Establish, and regularly review, performance measures for marketing. Performance measures can be tracked through increased use of customer surveys as well as some Web-based metrics including number of followers/subscribers, likes, views, and comments.
Monitor Website and social media analytics to determine habits and devices of visitors and consider using that information to better address those users.
Leverage relationships with partners to enhance marketing efforts through cross-promotions that include defined measurable outcomes.
Encourage the use of smartphones throughout programs and facilities. The devices can be used as a method to enhance existing programs, whether it’s through scannable QR codes throughout the park, unique augmented reality experiences, or just to gather feedback during and after programs. In addition, if phones are out, customers may take pictures to share with friends and family, which can encourage new visits.
VOLUNTEER & PARTNERSHIP MANAGEMENT
Today’s realities require most public park and recreation departments to seek productive and meaningful partnerships with both community organizations and individuals to deliver quality and seamless services to their residents. These relationships should be mutually beneficial to each party to better meet overall community needs and expand the positive impact of the agency’s mission. Effective partnerships and meaningful volunteerism are key strategic areas for the County to meet the needs of the community in the years to come.
CURRENT VOLUNTEER MANAGEMENT
When managed with respect and used strategically, volunteers can serve as the primary advocates for the County and its offerings. In 2010 the Broward County Parks and Recreation Division launched its revamped volunteer initiative, the VIP Program, short for “Volunteers Improving Parks.” The VIP Program’s primary mission is to “increase community involvement with Broward County Parks by providing a variety of volunteer opportunities for individuals, corporations, and organizations in order to assist in the beautification, maintenance, and programming of the County’s park system.”
The nature centers in particular benefit greatly from the VIP Program. These various volunteer opportunities can be easily found on the County’s Website including EcoAction Volunteer Workdays. Additionally, dedicated friends groups have been established at each of the Division’s nature centers. These friends groups assist in several areas including:
Fundraising activities
Visitor relations
Administrative/general office work
Enhancement/beautification of the center
Recruiting volunteers
Management of volunteers includes regularly tracking individual volunteers, their skills, and hours volunteered. Tracking volunteer hours can be used in budget discussions showing how well the Division is able to leverage limited resources. The Division already does a great job of doing this and promoting it on their Website. This is a Best Practice that should be continued going forward.
BEST PRACTICES IN VOLUNTEER MANAGEMENT
The Division already has a rather robust volunteer policy in place. The following are best practices in volunteer management, some of which the Division already has implemented and others that they should be aware of going forward.
Involve volunteers in cross-training to expose them to various organizational functions and increase their skill. This can also increase their utility, allowing for more flexibility in making work assignments, and can increase their appreciation and understanding of the Division.
Ensure a Volunteer Coordinator (a designated program staff member with volunteer management responsibility) and associated staff stay fully informed about the strategic direction of the agency overall, including strategic initiatives for all sections. Periodically identify, evaluate, or revise specific tactics the volunteer services program should undertake to support the larger organizational mission.
A key part of maintaining the desirability of volunteerism in the agency is developing a good reward and recognition system. The consultant team recommends using tactics similar to those found in frequent flier programs, wherein volunteers can use their volunteer hours to obtain early registration at programs, discounted pricing at certain programs, rentals or events, or any other County function. Identify and summarize volunteer recognition policies in a Volunteer Policy document.
Regularly update volunteer position descriptions by including an overview of the volunteer position lifecycle in the Volunteer Manual, including the procedure for creating a new position.
Add end-of-lifecycle process steps to the Volunteer Manual to ensure that there is formal documentation of resignation or termination of volunteers. Also include ways to monitor and track reasons for resignation/termination and perform exit interviews with outgoing volunteers when able.
In addition to number of volunteers and volunteer hours, categorization and tracking volunteerism by the type and extent of work is important.
Regular volunteers: Those volunteers whose work is considered to be continuous, provided their work performance is satisfactory and there is a continuing need for their services.
Special event volunteers: Volunteers who help out with a particular event with no expectation that they will return after the event is complete.
Episodic volunteers: Volunteers who help out with a particular project type on a recurring or irregular basis with no expectation that they will return for other duties.
Volunteer interns: Volunteers who have committed to work for the agency to fulfill a specific higher-level educational learning requirement.
Community service volunteers: Volunteers who are volunteering over a specified period of time to fulfill a community service requirement.
The Division should continue to encourage employees to volunteer themselves in the community. Exposure of staff to the community in different roles (including those not related to parks and recreation) will raise awareness of the agency and its volunteer program. It also helps staff understand the role and expectations of a volunteer if they can experience it for themselves.
RECREATION PROGRAM PARTNERSHIPS
The Division currently partners with various local organizations, clubs, and corporations to support park operations. By tracking these partnerships, leadership can gain insight into the effectiveness of staff in leveraging community resources. The Division maintains a database of all current partner organizations and it is recommended that this practice be continued to aid in tracking and managing partnerships.
However, it is important to note that in many instances, partnerships can be inequitable to the public agency and not produce reasonable shared benefits between parties. Therefore, to promote fairness and equity within existing and future partnerships while also managing against potential internal and external conflicts, the Division should adopt certain partnership principles.
These principles include:
Require a working agreement with measurable outcomes that will be evaluated on a regular basis, including annual reports on the performance and outcomes of the partnership to determine renewal potential.
Track costs associated with the partnership investment to demonstrate the shared level of equity.
Maintain a culture that focuses on collaborative planning, regular communications, and annual reporting on performance and outcomes to determine renewal potential and opportunities to strengthen the partnership.
In addition, the Division can pursue and develop partnerships with other public entities such as neighboring towns/cities, colleges, state or federal agencies, nonprofit organizations, as well as with private or for-profit organizations. There are recommended standard policies and practices that will apply to any partnership, and those that are unique to relationships with private, for-profit entities.
POLICY BEST PRACTICE FOR ALL PARTNERSHIPS
All partnerships developed and maintained by the Division should adhere to common policy requirements. These include:
Regular meetings or reports between Division staff and partners to plan and share activity-based costs and equity invested.
Establishment of measurable outcomes and focus on key issues for the coming year to meet desired outcomes.
A balance of equity agreed upon by all partners and tracking of investment costs accordingly.
Quarterly review of measurable outcomes with adjustments made as needed.
Development and monitoring of a working partnership agreement on a quarterly or as-needed basis.
Assignment of a liaison for communication and planning purposes by each partner.
POLICY RECOMMENDATIONS FOR PUBLIC/PRIVATE PARTNERSHIPS
The recommended policies and practices for public/private partnerships with businesses, private groups, private associations, or individuals who desire to make a profit from use of the Division’s facilities, properties, or programs are as follows:
Upon entering into an agreement, the Division staff and political leadership must recognize that they must allow the private entity to meet their financial objectives within reasonable parameters that protect the mission, goals, and integrity of the Division.
The Division must receive a designated fee, which may include a percentage of gross revenue dollars less sales tax on a regular basis, as outlined in the contract agreement.
The partnership must establish measurable outcomes to be achieved and a method for tracking progress. The outcomes will include standards of quality, financial reports, customer satisfaction, payments to the agency, and overall coordination with the Division for the services rendered.
The partnership agreement can be limited to months, a year, or multiple years depending on the level of investment made by the private contractor.
If applicable, the private contractor must provide an annual working management plan annually that they will follow to ensure the outcomes desired by the Division. The management plan can and should be negotiated if necessary. Monitoring of and adherence to the management plan will be the responsibility of both partners. The agency must allow the contractor to operate freely and in their best interest, as long as the outcomes are achieved and the terms of the partnership agreement are adhered to.
The private contractor cannot lobby agency advisory or governing boards for contract renewal. Any such action will be cause for termination. All negotiations must be with the Division Director or their designee.
The agency has the right to advertise for private contracted partnership services or negotiate on an individual basis through a bid process based on the professional level of the service to be provided.
If conflicts arise between both partners, the highest-ranking officers from both sides will try to resolve the issue before going to each partner’s legal counsels. If a resolution cannot be achieved, the partnership shall be dissolved.
PARTNERSHIP OPPORTUNITIES
The Division currently has a strong network of recreation program partners. The following recommendations are an overview of existing partnership opportunities available to the Division and a suggested approach to organizing partnership pursuits. This is not an exhaustive list of all potential partnerships that can be developed, but it can be used as a reference tool for the agency to develop its own priorities in partnership development. The recommended five areas of focus for partnership development are:
1. Operational Partners: Entities and organizations that can support the efforts of the Division in maintaining facilities and assets, promoting amenities and park usage, supporting site needs, providing programs and events, and/or maintaining the integrity of natural/cultural resources through in-kind labor, equipment, or materials.
2. Vendor Partners: Service providers and contractors that can gain brand association and notoriety as a preferred vendor or supporter of the County or Division in exchange for reduced rates, services, or some other agreedupon benefit.
3. Service Partners: Nonprofit organizations and/or friends groups that support the efforts of the agency to provide programs and events, and/or serve specific constituents in the community collaboratively.
4. Co-Branding Partners: Private, for-profit organizations that can gain brand association and notoriety as a supporter of the Division in exchange for sponsorship or co-branded programs, events, marketing and promotional campaigns, and/or advertising opportunities.
5. Resource Development Partners: A private, nonprofit organization that can leverage private sector resources, grants, other public funding opportunities, and resources from individuals and groups within the community to support the goals and objectives of the agency on mutually agreed-upon strategic initiatives.
VOLUNTEER AND PARTNERSHIP RECOMMENDATIONS
To effectively manage and maintain positive relationships with volunteers and partners, it is important for the Division follows the best practices listed in the previous section and continues:
1. Tailoring policies and agreements to the specific needs of each type of volunteer or partner, such as operational partners, vendor partners, service partners, co-branding partners, and resource development partners.
2. Compiling a list or database of all partner organizations, which will aid in managing partnerships and tracking the effectiveness of staff in leveraging community resources.
3. Conducting thorough background checks for all volunteers working with all programs. This will help ensure the safety and security of both the volunteers and the individuals they are interacting with through the programs.
By following these best practices, the Division can effectively manage and maintain positive relationships with its volunteers and partners, while also ensuring the safety and security of all involved.
6.2. Recreation Programs & Services Assessment
6.2.1.
Introduction
As part of the evaluation of services provided by the Division, a Recreation Programs and Services Assessment (“Assessment”) was conducted to evaluate the County’s regional and neighborhood parks. The Assessment identifies current program offerings and potential future programs to consider once additional staffing and funding can be secured.
6.2.2.
Framework
The Division’s mission is focused on three main areas: Recreation, Preservation, and Education. Broward strives to “Provide a countywide park system with diverse facilities and recreation opportunities, along with natural area conservation and research-based educational outreach, to enhance the well-being of all residents, businesses, and visitors.”
To achieve this mission, the Division's variety of regional and neighborhood parks offers direct programming and collaborates with multiple outside organizations and partners. The Division provides diverse recreation opportunities through a range of programs, including sports, arts and culture, nature and environmental education, and special events. These programs are designed to meet the needs of the community and to promote healthy living and active lifestyles.
In addition, the Division works with a variety of partners, including community organizations, schools, and other government agencies, to provide additional programming and services. These partnerships allow the Division to expand its reach and impact in the community and to provide a wider range of opportunities for residents and visitors to enjoy the parks and natural areas.
6.2.3. Direct Programming
Direct Programming includes programs and services provided by Division staff using existing facilities or amenities.
Adult athletic leagues
(e.g., softball, football, cricket)
Youth sports development
Nature Tots
Eco-action Days
Bike Safety Month Event
Photo sessions with horses (sale of the photos)
Splashtacular
SWIM Central
Walking Club
Walk and Talk programs
Weekly Volunteer Paddling Lake and Trails Cleanup
Geocaching
Special Populations programming
Horse trail rides
Horse riding lessons
Horse riding camp (spring, summer, winter)
Pony rides
Monthly Science Survey
Educational farm tours
Paddling Eco Tour
After School Program Full Moon Paddle
Teen Program
Senior Social Groups
Older Adults Exercise classes
Senior Line Dance Classes
Girls Mentoring Group
Karate
Campfire/Hayride Series
SUP Yoga
Orienteering
Summer Science Programs
Summer Recreation Programs
Basic Kayak Class
Basic Standup Paddleboard Class
Sunset Paddle
Orienteering on the Water
Bird Search: Bird Watching for Beginners
IncrEDIBLE Plants
Amazing Animal Kingdom
Sunrise Paddle
Event series for Under privileged youth
Rugged/Primitive Nature Trail
Exploration
Guided Nature Hike
Guided Seashore Hikes
Bird Hike
Dog Friendly Hike
Guided Butterfly Walk
Butterfly Garden Expedition
Wildlife Tour Scavenger Hunt
Nature Talk Series
The Everglades and Beyond
BSA Kayaking Merit Badge From Grass to Gravel
BSA Canoeing Merit Badge
Astronomy Days
K-12 Eco Paddle Days and Activities Hayride Series
Night Hikes
Fishing Clinic
Cubs Club (3-5 years old)
After-School/School-Break Programs
Survival Skills Workshop
Crocodilians and Their Cousins
Sea Turtles and Their Babies
Existing programs should be continuously evaluated and updated based on participant feedback and actual costs. This will ensure that programs are meeting the needs of the community and that resources are being allocated effectively. By regularly assessing the effectiveness of programs, the Division can identify which programs are successful and should be continued, and which programs are no longer viable and should be discontinued or replaced.
It is important to understand when a program is no longer viable and when the demand is no longer present to justify continued investment. This is crucial to make informed decisions and to redirect resources to other programs or initiatives that may better serve the community. Regularly evaluating programs also allows the Division to identify new opportunities for program development and to respond to changes in community needs and interests.
6.2.4. Partner and Outside Organization Programming
The Division has significant potential from collaborating with outside organizations for various programs. Pursuant to appropriate legal and administrative approvals, partnerships offer a great opportunity to take advantage of outside funding for direct projects and enhancements such as the Memorial Health Fitness Zones included in several parks.
Parks has also established an instructor program that allows outside individuals to provide a variety of classes with local professionals on a flexible schedule. For larger-scale operations, contracts are in place to better allow for performance management and maintaining expectations.
Below is a list of some outside partners and programming currently in place throughout the Division:
Parks Foundation
Friends Groups
Mountain Bike Demo Days
Wakeboarding Youth running
Campfire/hayride programs
Fitness bootcamps
Coastal Cleanup Days Golf
Eco-action Days
Concert Series
Karate club
Horse trail rides
Observatory Tennis Academies
Educational gardening programs (contracted with vendor)
Scout badge programs related to equine activities
FCC Soccer Program
Educational bee apiary and conservation programs (contracted with vendor)
Model steam train rides (contracted with vendor)
Yoga
Speed skating
Track cycling
Dog behavioral training
Non-Profits
Adult and children sports leagues
Private and school group butterfly and bird aviary tours (through Butterfly World concessionaire)
Therapeutic Equine Activities (contracted with vendor)
Potential Programming Growth
As previously highlighted within Chapter Five, existing programs are generally well-rounded, diverse, and serve the mission of the Division. However, based on observations of the planning team, demographic data, and recreation trends information, individual programs should be evaluated to ensure relevance to the changing trends in the local community.
The Statistically Valid Community Survey highlighted a number of key areas that households reported a need for. The top three requested programs were adult fitness and wellness programs, exercise classes, and senior programs. These findings indicate that there is a strong demand for these types of programs within the community.
Although this section is focused on overall Division offerings, each regional park should evaluate their individual offerings and consider the more local needs of their community. When proposing new programs, it is important to take into account community support and funding and staffing availability, New programming can benefit the wider community and subsidize the related costs.
The following programming opportunities were developed with input from the park management teams and present several growth opportunities for the Division to expand their current programs and diversify from the more facility rental focused operations.
Movie nights on the lawn with food trucks
Outdoor art program for youth and/or adults
Nature education programs for youth and adults
Group fitness utilizing the Memorial Fitness Zone equipment and natural elements of the park
Bed and Breakfast/Campfire Hayride
– 4 weekend series, campfire with smores and a hayride
eButterfly Hike - held multiple times at various natural sites; citizen science projecting learning about recording butterflies.
Eco Friendly Days
Bitesize Learning- once a month luncheon, led by a naturalist.
Barktoberfest – 2-day event, dogs get to enjoy the water park
Doggie Egg Hunt – 1 day event, dogs hunt for eggs at the dog park
Adult informational talks (variety of topics)
Splash in Space – 5-night series, theme varies but families come out for a swim at night and a movie
eBird Hike - held multiple times at various natural sites; citizen science projecting learning about recording birds.
Guided Nature Walks
Monthly drum circle Community Clean up days
Geocaching - held multiple times at various natural sites; learn GPS while exploring habitats searching for geocaches.
Movie nights on the lawn – With food trucks
Inclusive programming related to internships for individuals with disabilities
Bitesize Learning- once a month luncheon, led by a naturalist.
Bark after Dark – 4-night series, live music and food at the dog park
Night Hike – guided hike held multiple times at various natural sites
Interactive interpretive natural walks
Eggcitement – 1 day event, kids egg hunt in the water at Splash Adventure
Summerscape Camping – 1 weekend event, camping with cookout, games and movie
Scrub Symbiosis – held multiple times at various natural sites; learn symbiotic interaction with ecosystem.
School Group days
Senior pickleball game days
C.O.R.E.S. “Connecting with others recreationally educationally and socially”
Bark after Dark – 4-night series, live music and food at the dog park
Implementation Recommendations
For this chapter, the focus has been on what programs and services are available and recommendations for future ideas. Many of the execution details have already been covered as part of the Nature Program Assessment in Chapter Five, such as age segment analysis, program lifecycle, full cost of service and cost recovery analysis, pricing, programming strategy recommendations, marketing, volunteers, and partnerships. These are critical to successful implementation of new programs and the details from the earlier chapter are equally relevant to regional parks as to nature centers.
Chapter Seven Capital Development Study
7.1. Facility & Program Priority Rankings
The Facility and Program Priority Rankings provides a prioritized list of facility/amenity and recreation program needs for the Broward County service area.
The Priority Investment Rating (“PIR”) was developed by ETC Institute to provide organizations with an objective tool for evaluating the priority that should be placed on Parks and Recreation investments. The PIR equally weighs the importance that residents place on facilities/programs and how many residents have unmet needs for the facility/program. Based on the PIR, the following five amenities were rated as the highest priorities for investment:
Accessible parks/walking trails (PIR=184)
Multiuse paved & unpaved trails (PIR=169)
Shaded picnic areas & shelters (PIR=114)
Dog park (PIR=106)
Community center (PIR=105)
The chart to the right shows the Priority Investment Rating for each of the 31 facilities that were assessed on the statistically-valid survey. As seen below, “Accessible parks/walking trails,” “Multi‐use paved & unpaved trails,”
“Shaded picnic areas and shelters,” “Dog park,” and “Community center” make up the top five highest facility/amenity priorities in Broward County.
Figure 26: Top Priorities for Investment for Facilities
Based on the PIR, the following three programs were rated as “high priorities” for investment:
Adult fitness & wellness programs (PIR=200)
Exercise classes (PIR=129)
Senior programs (PIR=111)
The chart below shows the PIR for each of the 27 programs that were rated. As seen below, Adult fitness & wellness programs, Exercise classes, Senior programs, Adult visual arts/crafts programs, and County special events are the top five highest program priorities in Broward County.
It is important to note that community needs and preferences may change over time, so regular review and evaluation of these facilities and programs are crucial to ensure they align with community needs and are meeting the mission of the Division.
Figure 27: Top Priorities for Investment for Programs
7.2. Capital Improvement Plan
This cost estimate is based upon a high-level assessment and is subject to change based on many factors including alternative design plans, labor costs, material costs, etc.
Basic improvements are those that are required to maintain the integrity of the park system. Reconstruction/Replacement costs could be phased over the life of the Master Plan to elevate the quality of the whole system.
Chapter Eight Operational Review and Funding & Revenue Strategies
8.1.
Operational Review
It is important to note that a SWOT analysis is a strategic planning tool that helps organizations evaluate their internal strengths and weaknesses, as well as external opportunities and threats. It is a useful tool to identify areas of improvement and potential growth opportunities.
8.1.1. Definitions
STRENGTHS (INTERNAL)
Strengths are an internal analysis of what an organization does well. It is useful to think of strengths as special capabilities or expertise that have enabled the organization to be successful to this point and how it has prepared itself to compete in the future.
WEAKNESSES (INTERNAL)
Weaknesses are also considered to be an internal analysis and provide the opportunity for an organization to identify areas of improvement. They include problems that need to be corrected, deficiencies recognized through a comparison with other agencies or best practices, and deficiencies such as lacking the resources to grow.
OPPORTUNITIES (EXTERNAL)
Once strengths and weaknesses have been identified, the SWOT analysis becomes more external in nature and involves identifying ways in which the organization can better position itself for increased success in the future.
Opportunities are external factors that can enhance or improve services the organization offers (both new and existing services), and a defined customer group at which that service is targeted (including internal and external customers).
THREATS (EXTERNAL)
Threat identification is also external in nature. Threats are external trends or forces that may be out of the agency’s control but could adversely affect the organization and must be factored in to strategic planning in order to mitigate their potential negative impact.
8.1.2. Broward County Parks and Recreation Division SWOT Analysis
Helpful to achieving the objective
Strengths (Internal – can control)
Flexibility – responsiveness to changing conditions, emergencies, and competing priorities (COVID is an example)
Extraordinary customer service
Diversified staff skilled in the services provided
Variety of activities and facilities
High levels of park acreage and preserved land
Management team expertise and experience
Focus on inclusion and equity in offerings and ADA access
Internal origin
Responsiveness with the level of communication within the system amidst all the changes
Volunteer, Friends Groups, and Parks
Foundation support
Partnerships, earned income, and outcomes benefiting the County have improved
Collaboration with local universities
Increasing revenues to offset operational costs
Having Parks Planning and Design as a part of the Division
Security – reinstitution of ranger program and robust camera system
Knowledge, skills, and capabilities of the maintenance staff
Knowledge of various disabilities and how to accommodate and host diverse programming
Resourceful, ongoing collaborations with various groups in the community
Harmful to achieving the objective
Weaknesses (Internal –can control)
Some processes are inefficient and bogged down by excess bureaucracy
Competing interests and goals within the agency needing the same resources
Lack of ownership and accountability for projects
Lack of awareness of Division’s offerings (internal/external communication and marketing)
Website functionality (new system lacks some of the information and resources of previous Website)
Social media reach and engagement
Inconsistency in messaging of guidelines at different locations
Training is challenging currently – required certifications/expertise, system size, office locations, and current pandemic-related circumstances contribute
Reliance on status quo hinders innovation
Managing customer expectations
Commission awareness of and expectation of Division’s role can be unrealistic
Staffing levels and funding for new staffing
Minimal capital dollars in budget
Heavy park use without adequate security/ranger/staff presence
Not yet fully transitioned into RecTrac, manual record keeping is inefficient and time consuming
Division doesn’t have enough staff to meet growing programming demands of the community, especially with regard to special populations, including the elderly and/or individuals with mental and physical disabilities.
No dedicated facility for special populations programming, have to travel weekly to multiple County sites.
External origin
Opportunities
(External –may not be able to control)
Growing and diversifying County population
People’s positive perception of parks and recreation value: parks/trails are essential www.betterparksbetterbroward.com
Website could become the Division site while staying connected to County
Website branding
Increase in virtual programs and e-sports
Virtual Training – Intentional Professional Development
Managing customer expectations – by prioritizing and gracefully saying “no”
National focus on social equity and inclusion
Remote working and technology advances
Focus on activities (passive/active) that are convenient for social distancing
Cross-promotion to introduce non-users of the system to all the County’s offerings
Partnership opportunities with healthcare providers for capital or in-kind support –
i.e., outdoor fitness equipment
Increased participation in outdoor selfdirected activities like hiking, biking, mountain biking, nature exploration, etc.
Potential grants for increased funding for supplies and services provided
Threats
(External –may not be able to control)
Budget cuts and revenue loss
Reduced tourism and tax revenues
Staffing levels are below requirements
Resistance to change mindset
Commission awareness of full system and the needs to properly preserve and provide services
Security and staffing positions to enhance this important component
Funding for deferred maintenance
Climate change and sea level rise
Capital budget for new projects
Trying to be everything to everyone
Natural disasters and hurricanes
Philanthropic organizations may not have the continued ability to fund grant programs that have come to be relied upon
Too much focus on revenue can negatively impact social equity of access
The COVID-19 pandemic
o Isolation due to the perception of indoor spaces – may be more of a shortterm threat
o Senior workforce reduction due to current conditions with health and safety and associated loss of institutional knowledge
The Division has seen an increase in relevance to overall County operations as it is seen as essential to emergency management. While taking over Broward County’s Emergency Management Logistics Services Branch and other services outside the normal parks and recreation responsibilities increases the general awareness of the Division, it has a severe impact on availability of parks and recreation services for the public and also stretches a thin level of staff even further.
The Division has a good social media presence but could be improved by staying up to date with trends and platforms to attract a younger generation.
New equipment and facilities are needed to replace aging infrastructure that has been well-maintained but is beyond service life, including vehicles, playgrounds, shelters, water parks, etc.
The Division’s website platform was updated to increase accessibility, but the choice of layouts had unintended consequences and limits the information provided and how the visitors can search and find information. Many resort to using search engines instead, but the links lead to error pages. Core information materials such as shelter maps are no longer available because they were not accessible, but customers like this information to make informed decisions.
The Parks Maintenance Group staff works internally with Division to provide guidelines and ensure safety for equipment use.
Revenue is important but needs to be balanced with a focus on social equity in a predominantly urbanized region.
The Division is working to expand Special Populations program by gaining students from Florida International University with Special Needs area of study.
The Division relaunched the Park Ranger Program to enforce policies/procedures, provide information, and provide additional park operational and security presence to aid staff and patrons.
Increasing cost recovery or trying to maintain revenues relative to inflation, such as by increasing park admission fees, keeps people who cannot afford it out of the Division’s parks. They may just use other parks, but this is not equity. The Division must address this challenge to meet the needs of the community.
8.2. Funding & Revenue Strategies
The following sources are financial options for the Division to consider in identifying funds to support the recommendations outlined in the Master Plan. Currently, the revenue generated by the Division is not retained for reinvestment into the system to encourage innovation or to add value for the customers. This requires the Division seek alternative funding, when reinvestment is an option. Some of the funding sources identified may already be in use or have been used in previous instances. Conversely, some may not have precedent in the state of Florida, but could be pursued through legislative means, should the community see the value in accessing these funding sources. Regardless, this list is intended to serve as a resource to fit a variety of project-, operational-, or partner-specific initiatives and to provide inspiration for considering other strategies beyond these suggestions.
8.2.1. External Funding Sources
CORPORATE SPONSORSHIPS
Corporate sponsorships are a currently used revenue-funding source that allows corporations to invest in the development or enhancement of new or existing facilities in park systems. Sponsorships are also highly used for programs and events. These opportunities are already pursued by the County and are processed through Advantage Marketing along with screening for conflicts of interest.
CROWDFUNDING
Crowdfunding is a fairly new Web-based source that aggregates funds from a group of people who are willing to support a specific project, be it program related or facility related. Some sites that successfully do that are www.YouHelp.com and www.patroncity.com. The Michigan Economic Development Corporation recently used crowdfunding to raise matching funds for Douglas Park in Douglas, Michigan. This is most frequently used by nonprofit educational associations and other nonprofit institutions among their members, friends, patrons, and general public to garner further support and awareness. The Parks Foundation of Broward County and the other friends groups throughout the Division could explore opportunities like this for specific sites or amenities such as Anne Kolb Nature Center or the mountain bike trails at Markham and Quiet Waters parks.
CONSERVANCIES
Conservancies are organized fundraising and operational groups that raise money for individual signature parks and/or attractions such as zoos and regional parks. There are more than 2,000 conservancies in the United States now. This is an opportunity if citizens wanted to create a conservancy with the intended purpose of fundraising and assisting with operations of a specific park within the Division’s system such as Long Key Natural Area & Nature Center, Plantation Heritage Park, etc. The Bay Park Conservancy in Sarasota, Florida, is a great example of a recent initiative to help protect and conserve a valuable community asset.
FOUNDATIONS/GIFTS
Foundations and gifts are funding strategies used currently by the Division. The already established Parks Foundation is an effective, growing, and well-governed 501(c)(3) nonprofit that is registered to accept donations, hold fundraising events, accept endowments, etc. These dollars are raised from tax-exempt, nonprofit organizations established with private donations in promotion of specific causes, activities, or issues. They offer a variety of means to fund capital projects, including capital campaigns, gifts catalogs, fundraisers, endowments, sales of items, and generally complement operations and needs of the Division.
FRIENDS GROUPS
Friends groups are formed to raise money and contribute organized volunteer efforts typically for a single focus purpose that could include a park facility or program that will better the community as a whole and their special interest. Currently, there are several friends groups that contribute to the overall funding strategy. To maximize efforts and focus financial assistance, the current friends groups should consider establishing a cooperative strategy integrated with the goals of the Parks Foundation to foment program growth and increased stewardship of facilities throughout the system.
IRREVOCABLE REMAINDER TRUSTS
Irrevocable remainder trusts are set up by individuals who typically have more than a million dollars in wealth. They leave a portion of their wealth to an organization in a trust fund that allows the fund to grow over a period of time and then becomes available for the organization to use. Generally, organizations use a portion of the interest to support specific park and recreation facilities or programs that are designated by the trustee. These trusts could also be set up as charitable remainder or charitable lead trusts. Both of these may be easier to set up with the Parks Foundation.
VOLUNTEERISM
Volunteerism is an indirect revenue source in that persons donate time to assist the organization in providing a product or service on an hourly basis. It is currently implemented by the Division in many different capacities and reduces the organization’s cost in providing the service, plus it builds advocacy into the system. Currently, the Division has almost 3,000 volunteers. In 2020, volunteerism decreased significantly due to the pandemic. Increasing volunteerism can help the Division achieve its mission by leveraging the community’s enthusiasm and resources to support recreational programs and services.
SPECIAL FUNDRAISERS
Many parks and recreation agencies have special fundraisers on an annual basis to help cover specific programs and capital projects. These types of fundraisers are implemented by park foundations in support of agency initiatives, programs, and development.
8.2.2. Capital
Fees
CAPITAL FEES
Capital fees are added to the cost of revenue-producing facilities such as golf courses, pools, recreation centers, hospitality centers, and sports complexes. These fees are used to pay for improvements and are lifted off after the improvement is paid off. The County is responsible for setting standards on the practicality, implementation, and disbursement of capital fees.
DEDICATED/DEVELOPMENT/REDEVELOPMENT FEES
(Re)development fees are assessed on the development of residential properties with the proceeds used for parks and recreation purposes such as open space acquisitions, community park site development, or regional park acquisition and development. Additionally, these fees can also be obtained from the property tax increase that comes from the development of trails, signature parks, and destination facilities (e.g., Atlanta or Charlotte). This funding source would be County administered with standards on the practicality, implementation, and disbursement of capital fees.
IMPACT FEES/RETAIL IMPACT FEES
Impact fees are additional charges on top of the set user rate for accessing facilities such as stadiums, recreation centers, and water park facilities. These fees are used to support capital improvements that benefit the user of the facility. Retail impact fees are based on retail development like shopping centers or hotels on parks system land.
8.2.3. User Fees
RECREATION SERVICE FEES
Recreation service fees are a dedicated user fee which can be established by local government procedures to support the construction and maintenance of recreation facilities. The fee can apply to all organized activities that require registration, such as adult and youth sports or special interest classes. This allows participants to contribute toward the upkeep of the facilities they are using. The Division should work with the County to evaluate the feasibility of implementing this funding source.
FEES AND CHARGES
Fees and charges are currently used by the Division as part of the overall funding strategy. When implementing fees and charges, the organization should aim for them to be market-driven and based on both public and private facilities. These fees and charges can generate significant revenue, as seen in national trends where public park and recreation agencies generate an average of 35 to 50% of their operating expenditures from such fees. This could include program fees and daily fees for access to public-owned facilities and parks.
TICKET SALES AND ADMISSIONS
Ticket sales and admissions are also currently used by the Division as a funding source. These revenue sources come from accessing facilities for self-directed activities such as pools, ice-skating rinks, ballparks, and entertainment facilities. These user fees help offset operational costs.
PERMITS (SPECIAL USE PERMITS)
The Division currently works with individuals and organizers to provide special use permits. These permits allow individuals to use specific park property for financial gain and may result in a set amount of money or a percentage of the gross revenue from the service that is being provided.
RESERVATIONS
The Division conducts reservations at many of its parks and facilities, which allows individuals to reserve specific public property for a set amount of time. These reservations may include group picnic shelters, meeting rooms for weddings, reunions, and outings, or other types of facilities for special activities. The Division sets reservation rates to generate revenue from this service.
EQUIPMENT RENTAL
The Division rents recreational equipment for the enjoyment of its parkland and waterways, such as kayaks, bicycles, and rollerblades. This is another revenue source for the Division as individuals pay for the rental of equipment that is used for recreational purposes.
8.2.4.
Grants
Below are funding opportunities available through grants administered by the federal and state governments. The Division has already applied for and received funding for various projects through these grants, which are often available to apply for multiple times. In addition to the grant opportunities listed below, the Division has been provided with private foundation grant opportunities that should be considered. These grants should be evaluated based on their implementation feasibility and risk. The County views grants as one of several funding sources to meet their needs. The County has and will continue to apply for grants new grants as well as those already awarded in the past.
LAND & WATER CONSERVATION FUND (LWCF)
The LWCF is a grant administered by the Florida Department of Natural Resources, which provides up to 50% reimbursement for outdoor recreation projects. Applications are reviewed by the State of Florida and recommended projects are submitted to the National Park Service for final approval. All recommended projects must be in accordance with the priorities for outdoor recreation included in Florida's Statewide Comprehensive Outdoor Recreation Plan.
RECREATIONAL TRAILS PROGRAM
The Recreational Trails Program provides funding for the development of urban trail linkages, trailheads, and trailside facilities; maintenance of existing trails; restoration of trail areas damaged by usage; improving access for people with disabilities; acquisition of easements and property; development and construction of new trails; purchase and lease of recreational trail construction and maintenance equipment; and environment and safety education programs related to trails.
NEXT LEVEL TRAILS
The Recreational Harbor Evaluation Program is a grant administered by the Florida Department of Natural Resources. Political subdivisions, parks, conservancy, and agencies of state government are eligible. The funds are to be used for dredging public areas on navigable waters.
PARTNERSHIP ENHANCEMENT MONETARY GRANT PROGRAM
The Partnership Enhancement Monetary Grant Program, administered by the National Tree Trust, provides matching grants on a 50/50 cost-share basis for projects that promote public awareness and support tree planting, maintenance, management, protection, and cultivation.
FLORIDA BOATING IMPROVEMENT PROGRAM (FBIP)
Administered by the Florida Fish and Wildlife Conservation Commission, the FBIP program provides funding for boating access projects and other motorized boating-related activities on coastal and/or inland waters of Florida.
COASTAL PARTNERSHIP INITIATIVE (CPI)
The CPI promotes the protection and effective management of Florida's coastal resources at the local level, with grants supporting four program areas: resilient communities, public access, working waterfronts, and coastal stewardship. In the past, coastal paddling trail development and primitive campsite improvements such as composting toilets have been funded.
NRPA GRANT & FUNDING RESOURCES
NRPA periodically posts information about grant and fundraising opportunities that are available for park and recreation agencies. Grant opportunities are posted in areas of conservation, environmental/habitat, programming, social issue initiatives, art, and facility/amenity development. Several grants of $30,000, others for more, have been obtained for nature playscapes, recreational equipment, etc. This may be best suited for submission by Parks Foundation on behalf of the Division. There is also a potential to fund initiatives among neighborhood parks.
FLORIDA RECREATION DEVELOPMENT ASSISTANCE PROGRAM (FRDAP)
The FRDAP is a state competitive grant program that provides financial assistance to local governments to develop and/or acquire land for public outdoor recreational purposes.
FLORIDA COMMUNITIES TRUST (FCT)
The Division currently has 10 FCT sites. The growth within the County may be limiting the ability to continue the use of this funding source, as the growth has reduced the supply of available and suitable land. The FCT assists communities in protecting important natural resources, providing recreational opportunities, and preserving Florida’s traditional working waterfronts through the competitive criteria in the Parks and Open Space Florida Forever Grant Program and the Stan Mayfield Working Waterfronts Florida Forever Grant Program. These local land acquisition grant programs provide funding to local governments and eligible nonprofit organizations to acquire land for parks, open space, greenways, and projects supporting Florida’s seafood harvesting and aquaculture industries. The source of funding for Florida Communities Trust comes from Florida Forever proceeds.
SHARED-USE NONMOTORIZED (SUN) TRAIL NETWORK
Managed by the Florida Department of Transportation, the SUN Trail program funds nonmotorized, paved, shared-use trails that are part of the Florida Greenways and Trails System Priority Trail Map coordinated by the Office of Greenways and Trails.
DOPPELT FAMILY TRAIL DEVELOPMENT FUND (DFTDF)
The Rails to Trails Conservancy administers the DFTDF, which awards about $85,000 per year to support organizations and local governments that implement projects to build and improve multiuse trails.
8.2.5. Tax Support
PROPERTY TAXES
Property taxes include ad valorem taxes on real property. These are already used by the County and placed into the General Fund for allocation.
HOTEL, MOTEL AND RESTAURANT TAX
Hotel, motel, and restaurant taxes are based on gross receipts from charges and meal services, which may be used to build and operate sports fields, regional parks, golf courses, tennis courts, and other special park and recreation facilities.
SPECIAL IMPROVEMENT DISTRICT/BENEFIT DISTRICT
Special improvement/benefit districts are established to provide funds for specific types of improvements that benefit a designated group of affected properties. These improvements may include landscaping, public art installations, and recreation and cultural enhancements. This funding source is already in place for the Broward Municipal Services District.
DISCRETIONARY SALES SURTAX
In addition to the state sales and use tax rate, individual Florida counties may impose a sales surtax called discretionary sales surtax, also known as a local option County sales tax. This tax is collected by merchants at the time of sale and remitted to the Florida Department of Revenue, which then distributes the funds to the applicable counties for authorized local projects. The counties then use the funds to pay for authorized local projects.
SALES AND USE TAX ON RESTAURANTS AND CATERING
Sales and use tax on restaurants and catering is often associated with convention and tourism bureaus, but parks and recreation agencies that manage tourist attractions may receive a portion of this funding source for operational or capital expenses. Food and beverage served, prepared, or sold by restaurants, hotels, and other similar businesses are subject to sales tax and discretionary sales surtax.
PUBLIC IMPROVEMENT DISTRICT (PID)
New developments can establish a PID when authorized by the local government and legally set up according to state law. PIDs provide funds specifically for the operation and maintenance of public amenities such as parks and major boulevards. This funding source is mostly applied to unincorporated land such as the Broward Municipal Services District.
8.2.6. Franchises and Licenses
CATERING PERMITS AND SERVICES
The Division offers vendor permits to allow caterers to work in the park system on a permit basis. These permits come with a set fee or a percentage of food sales that are returned to the organization. Additionally, many organizations have their own catering services and receive a percentage of revenue from the sales of their food.
POURING RIGHTS
Private soft drink companies may enter into agreements with organizations for exclusive pouring rights within facilities. A portion of the gross sales goes back to the organization. For example, the City of Westfield, Indiana, signed a 10-year, $2 million pouring rights deal with Pepsi for their sports complex. The Division should look to amend the existing agreements with vendors when appropriate.
PRIVATE CONCESSIONAIRES
The Division uses private concessionaires for various events and locations. This funding source is a contract with a private business to provide and operate desirable recreational activities financed, constructed, and operated by the private sector, with additional compensation paid to the organization. COVID-19 exposed some challenges and risks with difficult negotiations and non-payment.
CONCESSION MANAGEMENT
Concession management involves retail sales or rentals of soft goods, hard goods, or consumable items. When outsourcing, the organization either contracts for the service or receives a set amount of the gross percentage or the full revenue dollars that incorporates a profit after expenses. The County has contracted for this service in the past without much success. Currently, the County operates most of the concessions.
NAMING RIGHTS
The Division may implement this revenue strategy through the County’s Advantage Marketing Program. Standards are in place for all known liabilities, but each opportunity can bring potential risks. Therefore, the County may place additional restrictions on these while individually vetting opportunities. Many cities and counties have turned to selling the naming rights for new buildings or renovation of existing buildings and parks for the development cost associated with the improvement.
LAND LEASE
The Division has leases with a few properties to cities for management and operation. A land lease is a lease agreement that permits the tenant to use a piece of land owned by the landlord in exchange for rent. Land leases work very similarly to the way traditional property leases operate. In the parks and recreation industry, land leases have been entered into for restaurants in destination parks, for an organization to provide services the agency does not have the means to provide, and to complement a signature facility with recreational retail, health and wellness businesses, and hotels.
LEASEBACKS
Leasebacks are instances whereby a private individual or company builds a community center or sports complex and the revenue earned comes back to pay the development costs.
EASEMENTS
Easements are an alternative revenue or funding source available to the County when it allows utility companies, businesses, or individuals to develop above-ground or below-ground improvements on their property for a set period of time. In exchange, the County receives a recurring payment. However, in areas where there are sensitive environments, there is concern that easements may cause further damage to the remaining ecosystems.
ADVERTISING SALES
The Division currently provides opportunities for local businesses and affiliated organizations to place tasteful and appropriate advertising on park and recreation-related items, such as in the Division’s print materials, on scoreboards, fences, and other visible products or services that are consumable or permanent and exposes the product or service to many people.
INTERLOCAL AGREEMENTS
The County and Division have many agreements with other publicly-funded organizations. These agreements, also known as interlocal agreements, are contractual relationships entered into between two or more local units of government and/or between a local unit of government and a nonprofit organization. These agreements allow for the joint usage and development of sports fields, regional parks, or other facilities.
Chapter Nine Action Plan & Parks and Recreation System Master Plan Development
9.1. Vision
The Broward County Parks and Recreation Division Envisions:
9.2.
Opportunities for Recreation through programs, events, and facilities that provide a sense of community and enhance the quality of life
Preservation of our natural resources, open spaces, and environment through responsible management stewardship
Innovative programming to promote Education through learning experiences for all segments
Mission
Recreation. Preservation. Education.
The Parks and Recreation Division is dedicated to providing a countywide park system with diverse facilities and recreation opportunities, along with natural area conservation and research-based educational outreach, to enhance the well-being of all residents, businesses, and visitors.
9.3. Core Values
Community
9.4. Big Moves
Big Moves are the most significant outcomes desired by stakeholders and, when achieved, will serve as the legacy fulfilling the Plan’s vision. The following are the Five Big Moves that were identified through the community visioning process:
1. Create a world-class and truly inclusive guest experience.
2. Continue developing specialty parks and signature elements unique to Broward County and the Division.
3. Ensure long-term financial sustainability with dedicated funding.
4. Incorporate green initiatives, resilience, and environmental sustainability throughout.
5. Pursue National Reaccreditation and a second Gold Medal.
Chapter Ten Conclusion
Broward County continues to be the community of choice for a growing number of people to live, work, play, and enjoy a wide range of parks and facilities provided by the Division. The coronavirus pandemic further emphasized the importance of parks and recreation offerings. The Division’s talented staff have made significant efforts to support the community, from providing COVID testing and vaccinations to organizing socially distanced programs and virtual offerings. Moving forward, the Division aspires to, and has the capability to, become the best in the nation by achieving CAPRA Accreditation and winning another Gold Medal.
To achieve this goal, it will take a dedicated investment in the park system and increasing personnel to address existing needs and create a world-class future. Building a connected system, ensuring equity of access, and designing signature world-class destinations and inclusive guest experiences will be tremendous legacies from this plan.
The Division’s greatest strength is its dedicated and passionate staff who are committed to making a difference in people’s lives. They are instrumental in making Broward County the destination of choice, from seagrass to sawgrass, for residents and visitors alike.
10.1. Actionable Recommendations
10.1.1. Parks and Trails
Mid-Term Strategies
Short-Term Strategies
Develop and launch a trail/hiking program.
Implement additional safety measures, including additional lighting and emergency stations, along trails and throughout parks.
Increase awareness of existing amenities through strategic marketing methods.
Introduce more pet-friendly trails.
Update existing trail and park maps for distribution through digital and print materials.
Utilize park visitation counters to better understand use patterns, peak visitation, and total visitation.
Consider adding splash pads to parks in underutilized areas and during lifecycle replacement of underutilized amenities.
Focus on further trail enhancements, such as: water stations, rest areas/benches, shade coverings, bike repair stations, exercise stations, and misting stations.
Improve wayfinding and interpretive signage throughout parks.
Increase pedestrian and bike (non-vehicle) access to all park entrances, separate from vehicles.
Increase ADA accessibility in trails and playgrounds.
Long-Term Strategies
Continue lifecycle-based replacement of playgrounds.
Increase overall connectivity through the entire system, including partnering with cities.
Provide additional paved parking for commonly visited parks.
Ongoing Strategies
Ensure diversity of trail types (E.g., mountain bike, equestrian, paved, natural, fitness).
Ensure upkeep and maintenance of parks and trails, including the use of volunteers and partner organizations.
Research and investigate the use of new materials for amenities to improve longevity, reduce environmental impact, or enhance sustainability efforts.
10.1.2. Recreation and Facilities
Short-Term Strategies
Cultural immersion events where participants learn about different groups with a passport for visiting different parks and participating in the cultural activities within the event.
Diversify activity and amenity offerings with more outdoor adventure opportunities. (E.g., Ropes course, rock wall, zip lining, etc.)
Ensure offerings reflect the County’s cultural diversity. (E.g., cultural festivals, holiday celebrations, cultural immersion events, etc.)
Grow existing environmental program offerings (E.g., Environmental Night Hikes, Native Plants Education, Build a Native Environment, etc.)
Incorporate community gardens as a program at facilities in high density areas.
Increase partnerships to get more kids into the parks (schools, similar providers, etc.). (E.g., Nature walks, birding tours, plant/tree identification, story time at the park, etc.)
Use of Technology Interpretive Exhibits for nature – more resources: (E.g., Bird App).
Mid-Term Strategies
Ensure the County’s athletic field and sport court needs are being met. (E.g., Additional soccer fields, pickleball courts)
Develop strategies to enhance each park's ancillary services and infrastructure. (E.g., equipment rental, food services, secondary activities, etc.)
Expand dedicated senior programs offered.
Virtual Reality Outdoor Experience and for those who cannot physically access.
Long-Term Strategies
Diversity of events facilities that are currently not adequate – Festival grounds with built in flexibility. Built in amenities to add value to the events.
New modern facilities to host new recreational trends and meet community needs. (E.g., water park with ADA playground & lazy river, updated community centers and nature center classroom size)
Ongoing Strategies
Diversify the types and locations of playground offerings. (E.g., Nature playgrounds, inclusive playgrounds, etc.)
Ensure adequate access to indoor recreation space.
10.1.3. Operations and Maintenance
Short-Term Strategies
Address staffing constraints, including full-time positions. New full-time positions (E.g., GIS specialist, grant writer, brand manager, volunteer coordinator, business data analyst, etc.)
Create office of DEI & Innovation within the division. Develop teen and youth advisory council, accessibility advisors, and equity experts.
Develop teams to tackle regularly occurring needs. Event Crew – assists with all aspects of events, and communication, field prep, asset preservation, and routine maintenance. Project Crew – for all neighborhood parks. Specialized maintenance crew – specific types of needs.
Establish or document best practice standards of asset preservation and ongoing park maintenance.
Expand support for park safety initiatives. (E.g., Increase number of park rangers, install security cameras in parking lots, bring back roving Broward Sheriff’s Office, etc.)
Mid-Term Strategies
Develop a team dedicated to process efficiencies, simplification and innovation.
Ensure staffing salaries are aligned with market rates to increase employee retention.
Increase volunteer use as appropriate
Long-Term Strategies
Continue lifecycle replacement of site furnishings, infrastructure and equipment
Ongoing Strategies
Ensure proper equipment for maintenance personnel.
Ensure the best preventive maintenance on all equipment and amenities.
10.1.4. Funding & Revenue
Short-Term Strategies
Add a position dedicated to earned income. (E.g., Grant writing, sponsorship, fee study/increase, etc.)
Develop a depreciation fund for capital assets and annually budget to build reserves for developed amenities –transfer from budget into depreciation fund annually. A percentage of annual revenue from the Division could accomplish this instead of going back into the general fund.
Develop user fees for existing free amenities/accommodations. (E.g., Disc golf user fee, dog park registration fee, RV parking fee)
Encourage more parks to incorporate friend groups and utilize them to help fund specific projects.
Explore new sponsorship, naming right opportunities and additional partnership opportunities with local businesses, universities, organizations, clubs, and associations.
Work with the County to keep and reinvest revenue the division generated to encourage innovation, add value for customers and create additional revenue generating opportunities.
Institute a development impact fee dedicated to parks.
Propose a new bond referendum – Educate community on needs.
Mid-Term Strategies
Develop a business plan and incorporate working to increase philanthropy of Parks Foundation. Consider with the Foundation to include donation kiosks at key locations and attractions.
Establish an enterprise fund for parks admissions.
Increase the number of large, revenue generating events. (E.g., 5k race series, concerts at the park, multiple day festivals, etc.)
Park Merchandise – enterprise fund to capture and reinvest in merchandise. Sell individual park merchandise, our patrons want to represent the park. Stickers or magnets for our campers to put on their rig.
Review existing fees to ensure they are aligned with market rates.
Long-Term Strategies
Standardized operations where applicable for cost containment. Consider incorporating an Adopt-a-Habitat or Natural area targeting businesses.
Ongoing Strategies
Revisit the process of the Advantage Marketing Program.
Calculate and measure your marketing ROI (Return on Investment).
Develop a new Marketing / Branding Plan
Branding – Who Are We? Environmental Stewards, Variety of programming, Open Access, Enrichment, Fun, Enhanced Quality of Life, diversity of county and cultures using park, educational, family and community components.
Taglines - We Have It All, Everything Under The Sun, Get Away from it all, Get away without going away, Get out and play (photos of nature, sports, wildlife, waterparks, boating, etc.).
Establish points of interest in the parks (E.g., murals, natural vistas, or 3d art in which people take selfies and they post it on social media increasing reach)
Increase the Division’s marketing budget.
Simplify website navigation for users.
Mid-Term Strategies
Explore new marketing mediums. (E.g., TikTok)
Long-Term Strategies
Update County park signage and incorporate branding
Ongoing Strategies
Continue utilizing technology to increase user awareness. (E.g., Social Media, website, email blasts, interactive & multi-lingual trail maps, etc.) Create a # hashtag that park patrons could tag parks and recreation in twitter and other social media platforms. (E.g., #BetterParksBetterBroward)
Ensure consistent branding Division wide.
Utilize taglines and hashtags throughout branding initiative. Utilize sponsored ads on various social media platforms.
Chapter Eleven Appendices
Appendices
11.1.
Appendix A –
Social Vulnerability Index
The social vulnerability of a community refers to its preparedness to respond to hazardous events, such as natural disasters or disease outbreak, or human-made events like chemical spills. Factors including poverty, lack of access to transportation, and inadequate housing conditions can hinder a community’s ability to prevent human suffering and financial loss during and after a disaster.
To assist in understanding and measuring social vulnerability, the Agency for Toxic Substances and Disease Registry (ATSDR) and the Centers for Disease Control and Prevention (CDC), in collaborate with the U.S. Census Bureau, provide a Social Vulnerability Index (SVI) for every census tract in the US. The SVI is based on a total of 15 social factors that channel into four key themes: Socioeconomic Status, Household Composition & Disability, Minority Status & Language, and Housing & Transportation. Each census tract receives an individual score for all four themes, as well as an overall SVI ranking. The chart below depicts the relationship between the social factors, key themes, and overall SVI.
The following sections further detail the overall SVI rankings, as well as rankings for each of the four key themes, for the County. The SVI report for the County was sourced through ATSDR, while SVI ranking maps for the County were developed through the CDC’s National Environmental Public Health Tracking Network. Data was pulled in March 2020 and includes SVI rankings from the most recent year available (2016).
Figure 28: Social Vulnerability Factors
11.1.1. Broward County – Overall SVI
The majority of the County has moderate-to-low social vulnerability in 2016, especially in the more rural areas. Higher levels of social vulnerability are present in the urban areas along I-95.
Figure 29: Broward County Overall SVI 2016
11.1.2. Broward County – SVI by Theme
The SVI can be analyzed by the four major themes to understand the vulnerability levels of different areas. In general, there are lower levels of vulnerability in rural areas and higher levels in urban cores. In the case of the County as a whole, it has relatively low vulnerability related to Housing and Transportation, while the most prominent vulnerability is associated with Race, Ethnicity, and Language.
The areas of Lauderdale Lakes and Oakland Park have the highest levels of vulnerability for Socioeconomic Status, Household Composition/Disability, and Race/Ethnicity/Language. Additionally, there is also a notably high vulnerability for Race/Ethnicity/Language present in the southern region of the County, specifically around Pembroke Pines and Miramar.
Figure 30: Broward County SVI by Theme 2016
11.2. Appendix B – National Sport and Fitness Participatory Trends
11.2.1. National Trends in General Sports PARTICIPATION LEVELS
The most heavily participated sports in the United States are Basketball (24.9 million) and Golf (24.3 million). These two sports have significantly higher participation figures than other activities within the general sports category. The next most popular sports are Tennis (17.7 million), Baseball (15.8 million), and Outdoor Soccer (11.9 million).
The popularity of Basketball, Golf, and Tennis can be attributed to the ability to compete with relatively small number of participants. Basketball’s success can also be attributed to the limited amount of equipment needed to participate and the limited space requirements necessary, which make basketball the only traditional sport that can be played at the majority of American dwellings as a drive-way pickup game. Despite a recent decrease in participation in the last five years, Golf continues to benefit from its wide age segment appeal and is considered a lifelong sport. Additionally, the emergence of Golf Entertainment Venues, such as Top Golf, has increased dramatically (84.7%) over the last five years, which has helped increase participation for golf as an activity outside of traditional golf course environments. Figure 33 on the next page shows annual participation figures for the most participated sports, as well as their one- and five-year trends.
FIVE-YEAR TREND
Since 2014, Golf Entertainment Venues (84.7%), Pickleball (40.5%), and Flag Football (23.1%) have emerged as the overall fastest growing sports. Similarly, Baseball (20.2%) and Indoor Soccer (17.8%) have also experienced significant growth. From 2014 to 2019, the sports that are most rapidly declining include Ultimate Frisbee (-49.4%), Squash (-23.4%), Touch Football (-21.5%), Badminton (-15.1%), and Tackle Football (-14.6%).
ONE-YEAR TREND
In general, the most recent year (2019) follows a similar pattern to the five-year trends, with Boxing for Competition (8.2%), Golf Entertainment Venues (6.7%), and Pickleball (4.8%) showing the greatest increases in participation. However, some sports that saw rapid increases over the past five years have experienced recent decreases in participation such as Rugby (-10.8%) and Gymnastics (-1.5%). Other sports including Ultimate Frisbee (-15.5%), Sand Volleyball (-7.8%), Roller Hockey (-6.8%), and Touch Football (-6.3%) have also seen a significant decrease in participation over the last year.
National Participatory Trends - General Sports
NOTE: Participation figures are in 000's for the US population ages 6 and over
CORE VS. CASUAL TRENDS IN GENERAL SPORTS
Highly participated sports, such as Basketball, Baseball, and Softball (Slow Pitch), have a larger core participant base (participate 13+ times per year) compared to their casual participant base sports (participate 1-12 times per year). In the past year, Ice Hockey and Softball (Fast Pitch) have seen an increase in core participation. On the other hand, less mainstream sports such as Boxing for Competition, Roller Hockey, Badminton, and Racquetball have larger casual participation base. These participants may be more likely to switch to other sports or fitness activities. For a full breakdown of Core vs Casual Participation, please see Appendix C
Figure 31: General Sports Participatory Trends
11.2.2. National Trends in General Fitness PARTICIPATION LEVELS
Overall, national participatory trends in fitness have experienced strong growth in recent years as shown in Figure 34. This is due to an increased interest among Americans to improve their health and enhance their quality of life through an active lifestyle. Many of these activities have become popular because they have few barriers to entry, providing a variety of options that are relatively inexpensive to participate in and can be performed by most individuals. The most popular general fitness activities among the U.S. population include Fitness Walking (111.4 million), Treadmill (56.8 million), Free Weights (51.4 million), Running/Jogging (49.5 million), and Stationary Cycling (37.1 million).
FIVE-YEAR TREND
Over the last five years (2014-2019), the activities growing most rapidly are Trail Running (46.0%), Yoga (20.6%), Cross Training Style Workout (20.2%), and Stationary Group Cycling (17.5%). Over the same time frame, the activities with the biggest decline include Traditional Triathlon (-9.2%), Running/Jogging (-8.7%), Free Weights (-8.3%), and Fitness Walking (-1.0%).
ONE-YEAR TREND
In the last year, the activities with the largest gains in participation were Trail Running (9.9%), Dance, Step, & Choreographed Exercise (7.0%), and Yoga (6.0%). From 2018 to 2019, the activities that had the largest decline in participation were Traditional Triathlons (-7.7%), Non-Traditional Triathlon (-7.4%), Bodyweight Exercise (-2.8%), and Running/Jogging (-2.6%).
National Participatory Trends - General Fitness
NOTE: Participation figures are in 000's for the US population ages 6 and over
Figure 32: General Fitness National Participatory Trends
CORE VS. CASUAL TRENDS IN GENERAL FITNESS
The most participated in fitness activities all have a strong core user base (participating 50+ times per year). These fitness activities include Fitness Walking, Treadmill, Free Weights, Running/Jogging, Stationary Cycling, Weight/Resistant Machines, and Elliptical Motion/Cross Training, all with 48% or more core participants. For a full breakdown of Core vs Casual Participation, please see Appendix C.
Legend:
11.2.3. National Trends in Outdoor Recreation PARTICIPATION LEVELS
Results from the SFIA report demonstrate a contrast of growth and decline in participation regarding outdoor/adventure recreation activities. Much like the general fitness activities, these activities encourage an active lifestyle, can be performed individually or within a group, and are not as limited by time constraints. In 2019, the most popular activities, in terms of total participants, from the outdoor/adventure recreation category included: Day Hiking (49.7 million), Road Bicycling (39.4 million), Freshwater Fishing (39.2 million), and Camping within ¼ mile of Vehicle/Home (28.2 million), and Recreational Vehicle Camping (15.4 million).
FIVE-YEAR TREND
From 2014 to 2019, BMX Bicycling (55.2%), Day Hiking (37.2%), Fishing (Fly) (20.1%), Fishing (Saltwater) (11.6%), and Mountain Bicycling (7.2%) saw the largest increases in participation. The five-year trend also shows activities such as In-Line Roller Skating (-20.5%), Archery (-11.7%), and Adventure Racing (-9.5%) experiencing the largest decreases in participation.
ONE-YEAR TREND
The one-year trend shows that the activities that have grown the most rapidly are BMX Bicycling (6.1%), Day Hiking (3.8%), and Birdwatching (3.8%). Over the last year, activities that experienced the largest decreases in participation include Climbing (-5.5%), In-Line Roller Skating (4.4%), and Camping with a Recreation Vehicle (-3.5%).
National Participatory Trends - Outdoor / Adventure Recreation
NOTE: Participation figures are in 000's for the US population ages 6 and over
A majority of outdoor activities have experienced participation growth in the last five years. Although this a positive trend, it should be noted that outdoor activity participation, except for adventure racing, consists primarily of casual users. This is likely why we see fluctuation in participation numbers, as the casual users likely found alternative activities in which to participate. For a full breakdown of Core vs Casual Participation, please refer to Appendix C
11.2.4.
National Trends in Aquatics PARTICIPATION LEVELS
Swimming is considered a lifetime activity, which is likely why it continues to have such strong participation. In 2019, Fitness Swimming was the clear leader in overall participation (28.2 million) among aquatic activities, largely due to its broad, multigenerational appeal.
Swimming (Fitness)
FIVE-YEAR TREND
Assessing the five-year trend, all aquatic activities have experienced growth. Aquatic Exercise stands out, having increased (22.7%) from 2014 to 2019, likely due to ongoing research that demonstrates the activity’s great therapeutic benefit. This is followed by Fitness Swimming (11.5%) and Competition Swimming (4.1%).
ONE-YEAR TREND
From 2018 to 2019, Competitive Swimming (-7.3%) declined in participation as both Aquatic Exercise (6.4%) and Fitness Swimming (2.3%) experienced lesser increases.
National Participatory Trends - Aquatics
NOTE: Participation figures are in 000's for the US population ages 6 and over
CORE VS. CASUAL TRENDS IN AQUATICS
All aquatic activities have experienced increases in participation over the last five years, primarily due to large increases in casual participation (1-49 times per year). From 2014 to 2019, casual participants for Aquatic Exercise (35.7%), Competition Swimming (22.7%), and Fitness Swimming (18.4%) have all grown significantly. However, all core participation (50+ times per year) for aquatic activities have decreased over the last five years. For a full breakdown of Core vs Casual Participation, please refer to Appendix C.
11.2.5. NATIONAL TRENDS IN WATER SPORTS/ACTIVITIES
PARTICIPATION LEVELS
The most popular water sports/activities based on total participants in 2019 were Recreational Kayaking (11.4 million), Canoeing (8.9 million), and Snorkeling (7.7 million). It is important to note that water activity participation tends to vary based on regional, seasonal, and environmental factors. A region with more water access and a warmer climate is more likely to have a higher participation rate in water activities than a region that has a long winter season or limited water access. Therefore, when assessing trends in water sports and activities, it is important to understand that fluctuations may be the result of environmental barriers that can greatly influence water activity participation.
FIVE-YEAR TREND
Over the last five years, Stand-Up Paddling (29.5%) and Recreational Kayaking (28.5%) were the fastest growing water activities, followed by White Water Kayaking (9.9%) and Surfing (8.9%). From 2014 to 2019, the activities declining in participation most rapidly were Water Skiing (-20.1%), Jet Skiing (-19.6%), Scuba Diving (-13.7%), Wakeboarding (-12.7%), and Snorkeling (-12.5%).
ONE-YEAR TREND
Similar to the five-year trend, Recreational Kayaking (3.3%) and Stand-Up Paddling (3.2%) had the greatest one-year growth in participation from 2018 to 2019. Activities that experienced the largest decreases in participation in the same time frame include Boardsailing/Windsurfing (-9.7%), Sea Kayaking (-5.5%), and Water Skiing (-4.8%).
National Participatory Trends - Water Sports / Activities
NOTE: Participation figures are in 000's for the US population ages 6 and over
CORE VS. CASUAL TRENDS IN WATER SPORTS/ACTIVITIES
As mentioned previously, regional, seasonal, and environmental limiting factors may influence the participation rate of water sport and activities. These factors may also explain why all water-based activities have a great deal more casual participants than core participants, since frequencies of activities may be constrained by uncontrollable factors. These high casual user numbers are likely the reason a majority of water sports/activities have experienced decreases in participation in recent years. For a full breakdown of Core vs Casual Participation, please refer to Appendix C.
Figure 34: Water Sports/Activities Participatory Trends
11.3. Appendix C –
Core vs. Casual Participation Trends
11.3.1. General Sports
11.3.1. General Sports (continued)
NOTE:
National Core vs Casual Participatory Trends - General Fitness
Outdoor/Adventure Recreation
National Core vs Casual ParticipatoryTrends - WaterSports /Activities
11.4. Appendix D – National and Regional Programming Trends
11.4.1. Programs Offered by Park and Recreation Agencies (Southern Region) PROGRAMS OFFERED BY PARK AND RECREATION AGENCIES (SOUTHERN
NRPA’s Agency Performance Review 2019 summarizes key findings from NRPA Park Metrics, which is a benchmark tool that compares the management and planning of operating resources and capital facilities of park and recreation agencies. The report contains data from 1,075 park and recreation agencies across the U.S. as reported between 2016 and 2018.
Based on this report, the typical agency (i.e., those at the median values) offers 175 programs annually, with roughly 63% of those programs being fee-based activities and events.
REGION)
According to the information reported to the NRPA, the top five programming activities most frequently offered by park and recreation agencies, both in the U.S. and regionally, are described in the table below (Figure 35). A complete comparison of regional and national programs offered by agencies can be found in Figure 38.
When comparing Southern Region agencies to the U.S. average, team sports, social recreation events, themed special events, health & wellness education, and fitness enhancement classes were all identified in top five most commonly provided program areas offered regionally and nationally.
Top 5 Most Offered Core Program Areas
Figure 35: Top 5 Core
Overall, Southern Region parks and recreation agencies are very similar to the U.S. average for program offerings. However, agencies in the Southern Region currently offer Safety Training, Aquatics, Performing Arts, and Golf programs at a rate less than the national average, +/- 5%.
CoreProgramAreasOfferedbyParksandRecreationAgencies (PercentofAgencies) Southern U.S.
Figure 36: Programs Offered by Parks and Recreation Agencies
TARGETED PROGRAMS FOR CHILDREN, SENIORS, AND PEOPLE WITH DISABILITIES
For a better understanding of targeted programs (programs that cater to a specific age segment, demographic, etc.), NRPA also tracks program offerings that are dedicated specifically to children, seniors, and people with disabilities. This allows for further analysis of these commonly targeted populations on a national and regional basis.
Based on this information, the top three targeted programs offered by park and recreation agencies, nationally and regionally, are described in the table below (Figure 29). A complete comparison of regional and national targeted program offerings can be found in Figure 30.
Top 3 Most Offered Core Program Areas
Agencies in the Southern Region tend to offer targeted programs at a lower rate than the national average. Southern agencies are currently offering After School Programs, Preschool Programs, and Before School Programs at a significantly lower rate than the national average (Figure 27).
Figure 38: Targeted Programs for Children, Seniors, and/or People with Disabilities
Figure 37: Top 3 Core Target Program Areas
11.5. Appendix E – Non-Participant Interest by Age Segment
In addition to participation rates by generation, SFIA also tracks non-participant interest. These are activities that the U.S. population currently does not participate in due to physical or monetary barriers, but remains interested in participating in. Below are the top five activities that each age segment would be most likely to partake in if they were readily available.
Overall, the most prevalent activities, across all age segments, include Camping, Bicycling, Fishing, and Swimming for Fitness. Each of these are low-impact activities, making them possible for any age segment to enjoy.
Fishing
Fishing Camping
Working out w/ Weights Volleyball
Running/Jogging
Camping Fishing Martial Arts Volleyball Kayaking
Camping
Fitness Swimming
Bicycling
Fishing Kayaking
Fitness Swimming Camping
Bicycling
Fishing Hiking
Bicycling Fishing Camping
Fitness Swimming Hiking
Bicycling Fishing
Fitness Swimming Camping Hiking
Fishing
Fitness Swimming
Bicycling
Birdwatching/Wildlife viewing
Working out using machines
11.6.1. Results by Location
Anne Kolb Nature Center Public Meeting #1
11.6.2. Live Polling Results
This exercise was facilitated using live polling software that allowed for attendees to anonymously share their input in real-time using clickers as polling devices. These results were then displayed to the attendees immediately after all the respondents had provided their input. The following pages depict the cumulative results of the public meetings.
WHAT IS YOUR AGE GROUP?
The attendees of all public input meetings make up the age groups of 35-54 years (46%), 55-74 years (31%), 18-34 years (16%), and 0-17 years (7%).
WHAT TOP THREE EXISTING FACILITIES/AMENITIES DO YOU WANT THE COUNTY TO PROVIDE MORE OF?
The top three combined responses for existing facilities and amenities that attendees want the County to provide more of were Natural/Open Space/Nature Centers (25%), Trails (Natural/Mountain Bike) (19%), and Playgrounds (13%).
What Top Three Existing Facilities / Amenities
Do You Want The County To Provide More Of?
NATURAL / OPEN SPACE / NATURE CENTERS
TRAILS (NATURAL / MOUNTAIN BIKE)
PLAYGROUNDS
SPORTS FIELDS / COURTS / STADIUMS
TRAILS (PAVED)
CAMPGROUNDS
EQUESTRIAN FACILITY
INDOOR MEETING / RECEPTION SPACES
OUTDOOR POOL / SPLASH PAD
WATER ACCESS / FISHING / BOATING
WHAT TOP THREE
NEW FACILITIES/AMENITIES DO YOU WANT THE COUNTY TO PROVIDE?
The top three new facilities and amenities that attendees want the County to provide were Zipline/ Adventure Course, Indoor Gym/Fitness Center (17%), and Community Rec. Center (Senior/Teens) (13%).
What Top
Three
New Facilities
/ Amenities Do You Want The County To Provide?
ZIPLINE / ADVENTURE COURSE
INDOOR GYM / FITNESS CENTER
COMMUNITY REC. CENTER (SENIOR, YOUTH)
SPORTS FIELDS
PERFORMING ARTS THEATER
BMX / BIKE PARK
VIRTUAL GAMING / ESPORTS ARENA
PICNIC SHELTERS
PLAYGROUNDS
SPORTS COURTS
WHAT THREE PROGRAM AREAS DO YOU PARTICIPATE IN THE MOST?
The top three current program areas that attendees participate in the most were Special Events (25%), Outdoor Sporting/Adventure/Equestrian (15%), and Sport Leagues/Tournaments (15%).
What Three Program Areas Do You Participate in the Most?
SPECIAL EVENTS
OUTDOOR SPORTING / ADVENTURE / EQUESTRIAN
SPORTS LEAGUES / TOURNAMENTS
NATURE PROGRAMS
ART & ENRICHMENT PROGRAMS
SPECIAL POPULATION PROGRAMS
FITNESS PROGRAMS
SENIOR PROGRAMS
SWIM LESSONS
PRESCHOOL PROGRAMS
WHAT THREE PROGRAM AREAS DO YOU WANT THE COUNTY TO PROVIDE MORE OF?
The top three new program areas that attendees want the County to provide are Nature Programs (19%), Outdoor Sporting/Adventure/Equestrian (17%), and Special Events (17%).
What Three Program Areas Do You Want The County To Provide More Of?
NATURE PROGRAMS
OUTDOOR SPORTING / ADVENTURE / EQUESTRIAN
SPECIAL EVENTS
VOLUNTEER PROGRAMS/OPPORTUNITIES
SPORTS LEAGUES / TOURNAMENTS
ART & ENRICHMENT PROGRAMS
FITNESS PROGRAMS
SPECIAL POPULATION PROGRAMS
SENIOR PROGRAMS
PRESCHOOL PROGRAMS
WHICH THREE INNOVATIVE OFFERINGS DO YOU WANT THE COUNTY TO PROVIDE?
The top three new innovative offerings that attendees want the County to provide are Wi-Fi Access in the Parks (27%), Zipline/Adventure Course (23%), and Universally Accessible Playground (15%).
Which Three Innovative Offerings Do You Want The County To Provide?
WI-FI ACCESS IN THE PARKS
ZIPLINE/ADVENTURE COURSE
UNIVERSALLY ACCESSIBLE PLAYGROUND
ESPORTS AREA / VIRTUAL GAMING
DRONE RACING
GAGA BALL PICKLEBALL
VIRTUAL RACES
WHAT ARE YOUR TOP THREE PREFERRED MEANS OF COMMUNICATION FROM THE COUNTY?
The top three preferred means of communication from the County that attendees identified are Broward County Website (20%), Social Media (18%), and Email (17%).
What Are Your Top Three Preferred Means Of Communication From The County?
BROWARD COUNTY WEBSITE
SOCIAL MEDIA
TEXT NOTIFICATION / CALL APP EMAIL
SIGNAGE IN PARKS
PRINTED MATERIAL
BANNERS/FLYERS
WHAT ARE THE TOP THREE BARRIERS THAT PREVENT YOU FROM PARTICIPATING MORE IN THE COUNTY’S OFFERINGS?
The top three barriers that prevent participants from participating more in the County’s offerings are I Don’t Know What’s Offered (26%), No Time (21%), and Lack of Facilities and Not Enough Choices, tied for third (12%).
11.6.3. Public Input Meetings Open Discussion
The open discussion that followed the live polling centered around the strengths, opportunities, and priorities of the system as seen by participants of the public forum. The following is a summary of the notes captured during these facilitated discussions with the audience.
Strengths
Operations & Staff
Staff are very responsive, knowledgeable, innovative & dedicated
Friends’ groups
Diversity of offerings
Efforts to address invasive species
Fee structure supports access to parks
Maintenance
Campgrounds – well maintained
Well maintained facilities & trails
Parks, Facilities, Trails & Amenities
Programs & Events
Volunteer programs – access other opportunities
Affordable summer camps
More international offerings, diversity of programs
Senior programs
After School programs
Sports programs – skill development
Music and events
Geographical locations – spread out
Nature Centers are valuable assets
Access to & connection of equestrian trails
The Observatory
Target ranges
New outlets – Drones, RC airfield
Top notch dog parks
Last remaining green spaces in County
Nature trails & boardwalks
Diversity of parks in terms of size, scope, locations
Opportunities
Operations
Utilize apps like geo-tagging
Better communication with vendors
Identify findings and schedule for conflicting activities, i.e., equestrian and drones
Customer service – access to person/information (telephone)
Sharing environmental expertise
Identify specific needs of diverse and special needs communities
Maintenance
Improve staffing and restroom maintenance
Expand Website content
System Funding
Communicate the importance of appropriately funding parks
Funding for conservation of species in natural areas
Parks, Facilities & Amenities
Connectivity between City/County assets
Equestrian camping
Chain fencing/less restrictions/ egress
Access to equestrian trails in the evenings with low lighting
Better connection w/facilities/collaboration on east side
Safety, after parks are closed
Swimming pools in Broward Municipal Services District zones
Expand pickleball offerings
Marina more boats, clean restrooms
Paved bike trails more accessible
Position information kiosks in parks
Better security: light, cameras, signs
Updating infrastructure – roadways, buildings
Signage (QR codes with information on trees, etc.)
Paddle boarding, kayaking
Develop more greenways
Improve field conditions
Improve stadium infrastructure
Esports at stadium
Open air space for drone racing
Install speed bumps and better lightning on roads near parks
Access to social programs by walking
Opportunities (continued)
Programs & Events
Share programming/rotate exhibits
Mobile exhibits/outreach programs
More kid-friendly programming - Jr Ranger Program
Traveling art exhibits – local history
Organize more offerings for youth sports/activities at facilities
Greater recognition of the value of parks resources by community
Increase awareness and outreach
Better coordination of City and County Departments
Programs & Events
Ensure safe place for recreational offerings
Expanding youth programs to all parks
Larger special events
Marketing & Communications
Increase awareness of offerings
Cross promote with partners
Communicate to elected officials that parks are important
Promote adult sports leagues
Develop promotion video of offerings
Encourage more local residents to use the parks –lots of people coming from other counties
Outreach about volunteer opportunities (students)
Highlight local teams at parks
Updated modes of outreach, communication –digital
Parks, Facilities, Trails & Amenities
Expand trail systems – More equestrian/mountain bike
Protect species in urban areas/increase awareness - Remove exotic animals & plants
Maintain and improve wildlife habitat
Operations
Conserve/preserve ecosystems in parks
Mitigation of pollution
Develop roadmap for priority setting
11.7. Appendix G – Statistically Valid Survey Demographics
11.8. Appendix H – Electronic Community Survey Results
11.8.1. Electronic Survey Results
HAVE YOU OR ANY MEMBER OF YOUR HOUSEHOLD VISITED ANY BROWARD COUNTY PARKS AND RECREATION DIVISION PARKS AND/OR FACILITIES DURING THE PAST 12 MONTHS?
Of the respondents, 96% have visited parks and/or facilities. Only 4% of the respondents answered “No” they have not visited a park and/or facility.
Visited Broward County Parks & Recreation Division Parks/Facilities
WHICH THREE PARKS/FACILITIES DO YOU VISIT MOST OFTEN?
The top three parks and facilities most visited by respondents included Markham Park & Target Range (37%), C.B. Smith Park (28%), and Quiet Waters Park (28%). The table listing parks and facilities that were visited by less than 1% of the respondents is also below.
Park/Facilities Selected <1%
Boaters Park
Boulevard Gardens Community Center
Coconut Creek Maple Swamp
Crescent Trail Natural Area
Crystal Lake Sand Pine Scrub
Deerfield Highlands Preserve
Dillard Green Space
Forman Preserve (Parkland)
Franklin Park
Helene Klein Pineland Preserve
Highlands Scrub Natural Area
Lafayette Hart Park
Hillsboro Pineland Natural Area
Lewis--ChisomPark
Military Trail Natural Area
Pond Apple Slough
Reverend Samuel Delevoe Park
Roosevelt Gardens Park
Saw Palmetto Natural Area
Sewell Lock
Shooster Preserve
Snake Warrior's Island
South Fork Canoe Launch
Sunview Park
Warbler Wetland (Ft Lauderdale)
Washburn Park
West Creek Pineland Natural Area
WilliamJ. Kelley Rookery
Willow Pond
Woodmont Natural Area
HOW OFTEN HAVE YOU VISITED BROWARD COUNTY PARKS AND RECREATION DIVISION PARKS AND/OR FACILITIES DURING THE PAST 12 MONTHS?
The survey demonstrated high visitation to County parks with almost half of the respondents (47%) visiting County parks at least once a week. Of the remaining responses, 29% visit 1-3 times a month and 22% less than once a month.
OVERALL, HOW WOULD YOU RATE THE PHYSICAL CONDITION OF ALL THE BROWARD COUNTY PARKS AND RECREATION DIVISION PARKS AND FACILITIES YOU HAVE VISITED?
Participants that visited a park/facility in the past 12 months were asked to rate the condition of the parks/facilities they used. In combining ratings of Excellent and Good, respondents indicated 89% are satisfied with the physical conditions of parks and facilities. This is very positive feedback and speaks to the quality of maintenance and upkeep staff have been able to do with their limited resources.
Physical Conditions of Parks & Facilities
IF YOUR HOUSEHOLD HAS NOT VISITED ANY BROWARD COUNTY PARKS AND RECREATION DIVISION PARKS AND/OR FACILITIES DURING THE PAST 12 MONTHS, PLEASE CHECK ALL OF THE FOLLOWING REASONS YOU HAVE NOT VISITED.
This question is a follow up to question number one. Only 4% of the respondents (116 households) answered that they have not visited any of the parks and/or facilities in the past 12 months. The top response (43%) was Other as a reason not to visit parks and/or facilities. The most reoccurring themes of “Other” comments include:
We were too busy
COVID-19
Parks were closed
RV Park was full
No reasons to visit
Distance to drive
Fees to enter
The remaining top three reasons that are preventing use of the County parks/facilities include Lack of features we want to use (24%), Not aware of parks’ or facilities’ location (18%), and Do not feel safe using parks/facilities (16%).
Visiting Barriers
Lack of features we want to use
Not aware of parks’ or facilities’ locations
Do not feel safe using parks/facilities
Too far from home
Use city parks/facilities
Lack of restrooms
Parks/facilities are not well maintained
Lack of parking to access parks/facilities
Lack of transportation
Do not feel welcomed/accommodated
Language/cultural barriers
Poor customer service
Lack of trust in government
Lack of handicap accessibility
PLEASE CHECK ALL OF THE ORGANIZATIONS THAT YOU OR MEMBERS OF YOUR HOUSEHOLD HAVE USED FOR RECREATION AND/OR SPORTS ACTIVITIES DURING THE LAST 12 MONTHS.
The chart below reveals that 72% of the respondents use Broward County Parks and Recreation Division, 58% use City parks/facilities, and 45% use Florida State Parks. The most reoccurring themes of Other comments include specific park names, non-profit names, and mountain bike trails.
PLEASE CHECK ALL THE WAYS YOU LEARN ABOUT BROWARD COUNTY PARKS AND RECREATION DIVISION PROGRAMS AND SERVICES.
The chart below illustrates that Word of mouth (58%) is the most frequent way residents learn about programs and services offered by the Division. County website (57%) and Social Media (43%) are the next most popular ways, which aligns with what the PROS Consulting team observes nationwide.
WHICH THREE METHODS OF COMMUNICATION WOULD YOU MOST PREFER THE COUNTY USE TO COMMUNICATE WITH YOU ABOUT PARKS AND RECREATION PROGRAMS AND SERVICES?
Additionally, respondents were asked to select their top three preferred ways to learn about Broward County Parks and Recreation Division happenings. The most popular choices were Social Media (52%), County website (49%), and Emails (47%), based on a combination of first, second, and third choices. The top first choice was County website (25%), followed by Emails (23%). Digital mediums were the most preferred marketing methods for the respondents, but this may be biased as the responses were collected through an online survey, likely from an audience that is comfortable and able to access online tools.
HAS YOUR HOUSEHOLD PARTICIPATED IN ANY PROGRAMS/EVENTS OFFERED AND/OR HOSTED BY THE BROWARD COUNTY PARKS AND RECREATION DIVISION DURING THE PAST 12 MONTHS?
The survey indicated that 47% of the respondents have participated in programs in the past 12 months, which is encouraging in terms of participation levels and presents an opportunity for future growth.
HOW MANY PROGRAMS/EVENTS OFFERED AND/OR HOSTED BY THE BROWARD COUNTY PARKS AND RECREATION DIVISION HAVE YOU OR MEMBERS OF YOUR HOUSEHOLD PARTICIPATED IN DURING THE PAST 12 MONTHS?
Of the 47% of respondents who participated in programs, the majority (52%) have participated in 2 to 3 programs per year, followed by those who participated in one program per year (28%). Overall, 72% of respondents who have participated in programs in the past year are repeat customers.
HOW WOULD YOU RATE THE OVERALL QUALITY OF THE BROWARD COUNTY PARKS AND RECREATION DIVISION PROGRAMS/EVENTS IN WHICH YOUR HOUSEHOLD HAS PARTICIPATED?
A vast majority of respondents expressed satisfaction with the overall quality of programs and events; 93% rate the programs and events as excellent or good. The remaining responses include 6% who rated the program quality as fair, and 1% who rated it as poor.
IF YOUR HOUSEHOLD HAS NOT PARTICIPATED IN ANY BROWARD COUNTY PARKS AND RECREATION DIVISION PROGRAMS/EVENTS DURING THE PAST 12 MONTHS, PLEASE CHECK ALL OF THE FOLLOWING REASONS WHY YOU MAY HAVE NOT PARTICIPATED.
The main reason reported for not participating in programs was I don’t know what is offered (67%). This is a barrier that the Division can address by improving communication and outreach. The next two reasons, Too busy/Not interested (15%) and Prefer individual activities (13%), are not barriers that the Divisions can easily control.
In addition, the "Other" category included reasons such as:
Snowbird or out of state
Park Closures
Programs not related to age segment
Weather (too hot)
COVID-19
BROWARD COUNTY IS IN THE PROCESS OF EVALUATING ITS EVENT OFFERINGS. WITH THAT IN MIND, PLEASE CHECK THE THREE SINGLE OR MULTI-DAY EVENT CONCEPTS IN WHICH YOU AND MEMBERS OF YOUR HOUSEHOLD WOULD BE MOST INTERESTED.
The respondents who are most interested in single-day or multi-day events expressed a preference for events that include Food events (67%) and Entertainment (51%) as the top preferences. These two interests can be combined with other second-tier responses to appeal to a wider audience. The second-tier concepts include Cultural celebrations (37%), Competitions (34%), Holiday celebrations (33%), and Environmental event (27%).
IF YOU HAD AN ADDITIONAL $100, HOW WOULD YOU ALLOCATE THE FUNDS AMONG THE PARKS AND RECREATION CATEGORIES LISTED BELOW?
The highest amount of funds allocated for projects within the County were for Improvements/maintenance of existing parks, pools, and recreation facilities ($31.44), followed by Acquisition and development of walking and biking trails ($27.27). These responses will help the Division prioritize these categories based on the importance to the County’s population.
PLEASE INDICATE IF YOU OR ANY MEMBER OF YOUR HOUSEHOLD HAS A NEED FOR EACH OF THE PARKS AND RECREATION FACILITIES/AMENITIES IN BROWARD COUNTY LISTED BELOW. IF "YES," PLEASE LET US KNOW THE DEGREE IN WHICH YOUR NEEDS ARE MET FOR ALL OF THE FACILITIES/AMENITIES IN BROWARD COUNTY. IF "NO," CLICK ON THE FIRST RESPONSE.
The graph below illustrates respondents’ unmet needs as 50% or less for facilities and amenities within the County. The greatest unmet need was for Multi-use paved & unpaved trails (45%), followed by Open space conservation areas (37%). Small neighborhood parks, Observatory, Environmental/Nature education center, and Splash pads (36%) tied as the third most unmet need.
WHICH FOUR FACILITIES/AMENITIES FROM THE LIST IN QUESTION 8 ARE MOST IMPORTANT TO YOUR HOUSEHOLD?
Of the unmet needs selected in the last question, the four most important facilities and amenities chosen by respondents were Accessible parks/walking trails (38%), Multi-use paved & unpaved trails (33%), Mountain bike trail (20%), and Playgrounds (18%). When considering the lowest responses to this question, it is important to understand that in many instances these are facilities that are important, but are already being provided, so there is not a demonstrated need. Additionally, these facilities and amenities may be provided by local cities and towns within their parks and recreation departments, rather than being expected to be provided by the Division.
PLEASE INDICATE IF YOU OR ANY MEMBER OF YOUR HOUSEHOLD HAS A NEED FOR EACH OF THE PROGRAMS IN BROWARD COUNTY LISTED BELOW.IF "YES," PLEASE LET US KNOW THE DEGREE IN WHICH YOUR NEEDS ARE MET FOR ALL OF THE PROGRAMS IN BROWARD COUNTY. IF "NO," CLICK THE FIRST RESPONSE.
The graph below illustrates that respondents identified unmet needs at 50% or less for programs within the County. The top four highest unmet needs were Exercise classes (42%), Outdoor environmental education/nature camps and programs (41%), County special events (40%), and Adult fitness and wellness programs (39%).
Here too County residents may not be looking to the Division to provide these programs as they are already provided by the Division, local organizations in the cities, or through city parks and recreation departments.
WHICH FOUR PROGRAMS ARE MOST IMPORTANT TO YOUR HOUSEHOLD?
Of the unmet needs selected in the previous question, the four most important programs chosen by respondents were Adult fitness and wellness programs (36%), Outdoor environmental education/nature camps and programs (30%), County special events (28%), and Exercise classes (18%).
PLEASE INDICATE YOUR LEVEL OF AGREEMENT WITH THE FOLLOWING STATEMENTS CONCERNING SOME POTENTIAL BENEFITS OF BROWARD COUNTY'S PARKS, FACILITIES, AND RECREATION PROGRAMS OR SERVICES.
When combining Strongly Agree (blue) and Agree (orange) in the graph below, the top three benefits respondents associated with the County include Has access to greenspace and nature, or playgrounds (89%), Provides opportunities for physical activity (88%), and Provides preservation of natural areas (86%).
WHICH FOUR OF THE BENEFITS ARE MOST IMPORTANT TO YOU AND MEMBERS OF YOUR HOUSEHOLD?
Respondents were asked to identify the four most important benefits to their household from the previous question. The most important benefits identified were Has access to greenspace and nature, or playgrounds (61%), Improves my mental health and reduces stress (50%), Improves my physical health and fitness (48%), and Preserves open space and protects the environment (27%).
PLEASE RATE YOUR LEVEL OF SATISFACTION WITH THE OVERALL VALUE THAT YOUR HOUSEHOLD RECEIVES FROM THE BROWARD COUNTY PARKS AND RECREATION DIVISION.
Combining Very satisfied and Satisfied, respondents’ overall satisfaction with the value provided by the Division is 73%. Only 6% of the respondents are dissatisfied or very dissatisfied, indicating a high perceived value of the Division’s offerings to households.
GIVEN THE RECENT COVID-19/CORONAVIRUS CRISIS, HOW HAS YOUR AND YOUR HOUSEHOLD’S PERCEPTION OF THE VALUE OF PARKS, TRAILS, OPEN SPACES AND RECREATION CHANGED?
The Division adapted to the County’s needs throughout the COVID-19 pandemic, often serving as an essential part of emergency responses in the County. During stay-at-home orders, open-air parks and recreation facilities were able to open with protocols in place, providing the community with much-needed access to outdoor spaces.
Based on the responses, the perceived value of parks, trails, open spaces and recreation has increased for nearly twothirds of all respondents (64%). This is a positive sign for the Division and if this trend continues, it will foster greater advocacy and support for the Division and its offerings in the future.
BASED ON YOUR PERCEPTION OF VALUE, HOW WOULD YOU WANT THE COUNTY TO FUND FUTURE PARKS, RECREATION, TRAILS AND OPEN SPACE NEEDS?
Of the respondents who reported that their perceived value of the Division’s offerings has increased, 74% would support an increase in funding, while only 1% would consider reducing funding for the Division. With a positive change in the perceived value of parks, recreation, trails and open space, it is likely to lead to a desire to increase funding, which is also a very encouraging sign for the Division’s long-term growth prospects. These results align with responses throughout the process, which identified increased funding as a top priority.
PLEASE INDICATE YOUR SUPPORT FOR EACH POTENTIAL ACTION BY CIRCLING THE CORRESPONDING NUMBER TO THE RIGHT.
The blue and orange bars in the graph below illustrate respondent’s choice of Strongly Agree and Agree. The top three supported actions are Improve existing park infrastructure (88%), Develop new walking trails (87%), and Improve existing walking trails (87%). Five of the top six actions are focused on improving existing facilities and amenities.
WHICH FOUR ACTIONS WOULD YOU BE MOST WILLING TO FUND?
Of the supported actions from the previous question, the initiatives respondents were most willing to fund include Improve existing park infrastructure (43%), Develop adventure park/zipline/climbing tower (39%), Develop new walking trails (39%), and Add new and/or improve existing restrooms in parks (35%). Five of the top seven actions are specific to existing facilities and amenities.
HOW SUPPORTIVE ARE YOU OF A BOND REFERENDUM TO FUND THE TYPES OF PARKS AND IMPROVEMENTS THAT YOU INDICATED ABOVE ARE MOST IMPORTANT TO YOU AND YOUR HOUSEHOLD?
When combining results from respondents stating they are very supportive and somewhat supportive of a bond referendum, over three quarters (77%) respondents support a bond. Only 5% of respondents do not support a bond. This strong representation is most likely due to the majority of respondents being users and appreciating the existing facilities and amenities.
Several questions in this survey asked about major actions and how people would allocate funds. Those responses and the response to this question demonstrate that respondents value parks and recreation enough to financially contribute to their desired outcome.
11.8.2. Electronic Survey Demographics
GENDER
Respondents' Gender
Male
Female
Non-binary
INCLUDING YOURSELF, HOW MANY PEOPLE IN YOUR HOUSEHOLD ARE…
WHAT IS YOUR AGE?
HOW MANY YEARS HAVE YOU LIVED IN BROWARD COUNTY?
ARE YOU OR OTHER MEMBERS OF YOUR HOUSEHOLD OF HISPANIC, LATINO, OR SPANISH ANCESTRY?
WHICH OF FOLLOWING BEST DESCRIBES YOUR RACE/ETHNICITY?
WHAT IS THE PRIMARY LANGUAGE SPOKEN IN YOUR HOME?
Other responses included:
Portuguese (5)
French (3)
Hebrew (1)
Romainian (1)
Polish (2)
Japanese (1)
Tamil (1)
Lithuanian (1)
Russian (1)
Czech (1)
11.9. Appendix I – Signature Park Series
As part of the Master Plan process and to support long-term visioning, a Signature Park Series concept was developed. This concept was applied to each of the Division’s regional parks, nature centers, neighborhood parks, and natural areas to identify key features, events, and statistics about each location. Each brochure takes a visionary approach to enhance what already makes the park special.
As each series brochure is completed, it should be made available to the public and used to promote the parks and demonstrate the Division’s potential with adequate funding and staffing resources. The Signature Park Series may be critical in laying the foundation of a future bond referendum and building consensus with the public users to complete transformative initiatives across the park system, similar to the work started at Everglades Holiday Park