Preferred Scenario Report
Carolina Crossroads
BCDCOG US 52 Corridor Study

Berkeley and Charleston Counties, South Carolina
June 7, 2022
Prepared for BCDCOG
Prepared by

1
2 Table of Contents 1 Introduction...........................................................................................................................................3 2 Public Outreach.....................................................................................................................................3 3 Land Use Scenario Development Process............ ..............................4 3.1 CommunityViz Output..................................................................................................................9 3.2 Example Node Development Rendering............ ......................19 3.3 Application of Performance Measures........................................................................................22 4 Environmental Resources ......................... .......................................26 4.1 TOD Scenario.............................................................................................................................26 4.2 Environmental Resources ....................... .......................................26 5 Active Transportation .........................................................................................................................27 5.1 TOD Scenario.................................. ........................................27 6 Transit.....................................................................................................................................................31 6.1 Transit Service for the TOD Scenario.......... ..................................31 6.2 Application of Performance Measures........... ................................37 7 Traffic & Roadway.............................................................................................................................38 7.1 Design Year Volume Development................ .........................38 7.2 Traffic Analysis ..........................................................................................................................39 7.3 Recommended Improvements...................... ............................41 7.4 Proposed Transitway Design Approach......................................................................................46 7.5 Access Management ............................. ...................................49 7.6 Right-of-Way Impacts.................................................................................................................50 7.7 Priorities.................................... ...............................................51
1 Introduction
The US 52 Corridor Study was initiated a key planning project in the region to establish a vision for the corridor from North Charleston, through Goose Creek, to Moncks Corner. The study and subsequent analysis defined the relationship between the roadway and adjacent land uses to assist in planning for the corridor’s overall future growth. Additionally, the study was developed to serve as a tool to assess the corridor’sexistingconditions,todevelopapreferredfuturecondition,andtorecommendarangeofcontextsensitive multimodal solutions, such as high-capacity transit, that maximize existing infrastructure and improve roadway safety, access/mobility, and long-term capacity of the corridor.
This Preferred Scenario Report summarizes the previous scenario development process, identifies the Preferred Scenario carried forward for further evaluation, and recommends improvements and other measures to support design year conditions.

2 Public Outreach
Two Public Information Meetings were held in December 2021 to present information to the community. The December 13th meeting was held in Goose Creek and the December 14th meeting was held in Moncks Corner. These meetings introduced the purpose of the study, a description of each of the three land use scenarios evaluated, and preliminary analysis findings. In addition, an on-line MetroQuest Survey was available for public comment from December 14, 2021 to January 14, 2022. By the end of the Survey period, 500 respondents provided over 1500 comments. As shown below in Figure 2.1, nearly two thirds of the comments received were Traffic and Safety related, followed by comments and concerns associated with pedestrians and bicyclists.
Survey respondents were also asked to rate and rank the three Land Use Scenarios on a scale from one to five. The following Figure 2.2 illustrates the ranking, resulting in a rating or 2.2 for the Base Scenario, 3.1 for the Growth Management Scenario and 3.6 for the TOD scenario.
3
Figure 2-1. MetroQuest Comment Summary
As outlined in the previous Scenario Briefing Report, and subsequently supported by both the Larger Community and the Steering Committee, the TOD Scenario preserves open space within the study area by concentrating development at specific nodes along the corridor, increases accessibility to potential high capacity transit, and results in slightly lower peak period and daily traffic demand.

3 Land Use Scenario Development Process
The land use scenarios were created using CommunityViz software, an extension of ArcGIS, and represent potential future alternatives of how projected population and job growth can be accommodated within the corridor.
Figure 3-1 illustrates the model-building process in CommunityViz. A data inventory of existing and adopted future land uses, land development status and place types, and employment and population projections from the Charleston Area Transportation Study Travel Demand Model (CHATS TDM), are used to identify general areas of concentrated development or development nodes. These inputs are then used to construct scenarios, or alternative versions of future growth and development within the corridor, that can be used in land use decision-making.
Scenarios are based on several assumptions:
• Thetotalamountofresidentialandjobgrowthisfiniteandbasedon2040futureprojectionsderived from the CHATS TDM.
• Residential and job densities within a particular area can be readjusted based on the spatial arrangement of development.
• Changing a place type toincludemore density will reallocate residential and/or commercial growth from nearby areas.
4
Figure 2-2. Scenario Ranking
Identifying the location of general development clusters or nodes along the study corridor was a critical first step in building the future alternative scenarios. Nodes are defined as geographic areas which extend out from a center point located on the study corridor for one-half mile in all directions, to which future development density is guided. Based on the assumed development densities located within nodes, these locations have the potential to support higher quality transit service and serve as future transit stops. Subsequent transit analysis of the alternative land use scenarios will further evaluate which nodes are best suited for transit and what type of transit to implement.
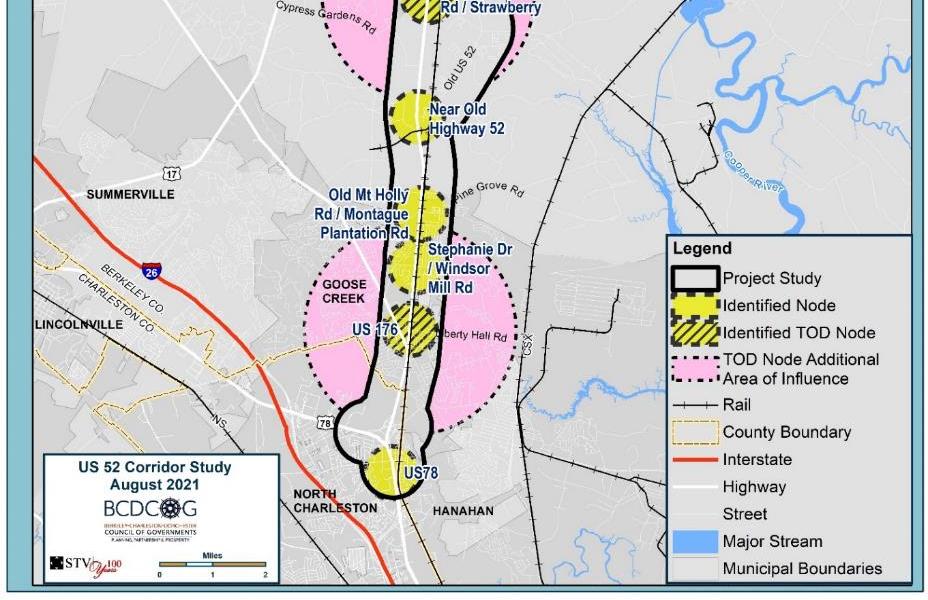
Eleven nodes were identified based on a review of existing and future land use, forecasted growth, committed development, and coordination with the transit planning consultant team, BCDCOG staff, and local jurisdictions. All identified nodes are included in each scenario: in the Base Scenario, the nodes serve as a basis of comparison for existing development conditions. In the TOD Scenario, the nodes are the areas targeted for more concentrated development. Figure 3-2 illustrates the node locations withinthestudy area. Table 3-1 presents nodes by name and location.


5
Figure 3-1: CommunityViz Scenario Development Process


6
Figure 3-2. Identified Nodes
Node Name
Table 3-1: Nodes by Name and Location
Location Node Type
US78 NorthCharleston TownCenter
US176* GooseCreek TownCenter
StephanieDr/WindsorMillRd GooseCreek Neighborhood**
OldMtHollyRd/MontaguePlantationRd GooseCreek Neighborhood**
NearOldHighway52 GooseCreek,Berkeley County Employment**
CypressGardensRd/Strawberry* MoncksCorner Neighborhood/TownCenter
OakleyRd BerkeleyCounty, MoncksCorner Neighborhood**
NearGaillardRd BerkeleyCounty Neighborhood**
BetweenMountainPineRdandGaillardRd BerkeleyCounty, MoncksCorner Neighborhood**
OldHighway52 MoncksCorner EmploymentHub
ParkandRide(PNR)-SanteeCooper* MoncksCorner EmploymentHub
*TOD Node under the TOD Scenario
**Density is not anticipated to reach the specified density for the node type
TOD nodes, a subset of the nodes identified in the model, are used only in the TOD Scenario and represent areas of denser development. Due to their existing and committed development patterns, TOD nodes have the potential to serve as primary transit stops, while the other nodes in the corridor may serve as supplemental transit stops. TOD nodes redistribute population and jobs from a larger area of influence to achieve a higher density within the node. This larger area of influence is the two-mile radius beyond the center point of the TOD node. Figure 3-3 highlights the three nodes identified as TOD nodes used only in the TOD Scenario.
7

8
Figure 3-3. Identified TOD Nodes
3.1 CommunityViz Output
The US 52 Corridor Study CommunityViz Model was created to visualize alternative growth scenarios using a planning horizon year of 2040. The Base Scenario reflects on-the-ground conditions in 2040 if current trends continue, and is presented here as a comparison between the future based on existing conditions and the alternate future conditions represented by the TOD Scenario. The selection of the TOD Scenario as the preferred scenario indicates that stakeholder agencies and governments along the corridor will adopt appropriate policies to redirect growth patterns away from the Base Scenario and toward the desired outcomes associated with the preferred scenario. Recommendations as to what these policies could include will be included in the Final Report later this year.
In all cases, the parcels selected for development in the model do not represent real-world development or redevelopment intent.
Base Scenario
Model outputs for the Base Scenario reflect on-the-ground conditions in 2040 if current trends continue. The Base Scenario,asinall modeleddevelopment scenarios, assumes that 100percent of developed parcels will remain developed, 100 percent of parcels with committed development will develop as planned, and no development will take place on parcels designated as open space.
In some cases, the CHATS TDM projected that there would be more residents or jobs within a node than is permitted under current development regulations. In these cases, indicated by shares of undeveloped and underdeveloped parcels at levels of over 100 percent inTable 3-2, the node was assigned new, denser place types to meet the projected growth level. To obtain these density results, the County or municipality would need to modify the place type and underlying zoning to allow for denser development.
9
Node Residential Non-Residential Undeveloped / Underdeveloped Parcels Within ½ Mile of Nodes US78 0% 0% US176 0% 0% StephanieDr/WindsorMillRd 0% 0% OldMtHollyRd/MontaguePlantationRd 20% 10% NearOldHighway52 100+% 40% CypressGardensRd/Strawberry 30% 10% OakleyRd 100+% 10% NearGaillardRd 70% 0% BetweenMountainPineRdandGaillardRd 90% 0% OldHighway52 20% 10% PNR-SanteeCooper 50% 100+% Undeveloped/UnderdevelopedParcelsOutsideofNodes,withinStudyArea OutsideofNodes 75% 50%
Table 3-2: Share of Undeveloped and Underdeveloped Parcels by Node Under the Base Scenario


10
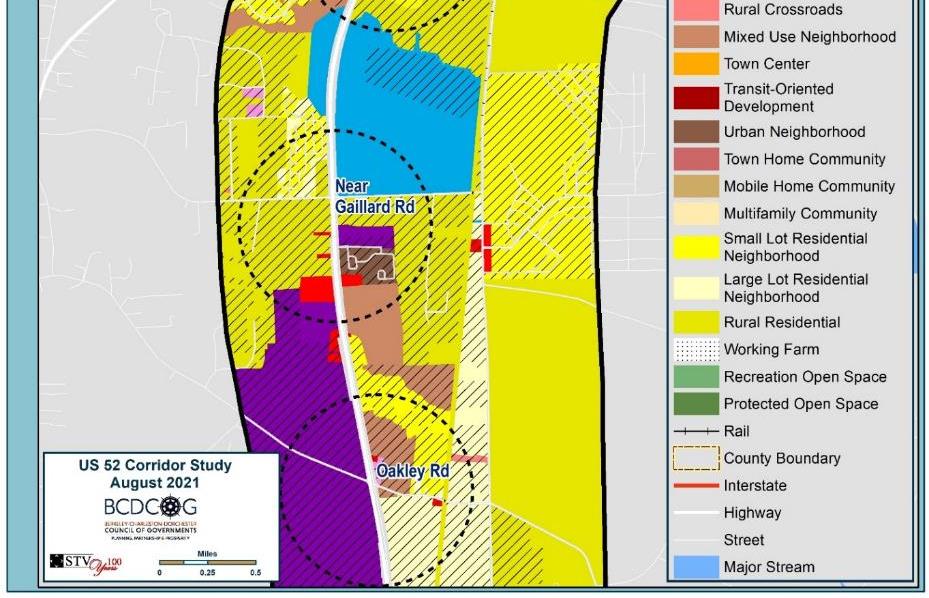
Figure 3-5 through Figure 3-8 illustrate place types and development status of the study area under the Base Scenario.
Figure 3-5: Base Scenario Place Types and Development Status, Map A


11
Figure 3-6: Base Scenario Place Types and Development Status, Map B

12
Figure 3-7: Base Scenario Place Types and Development Status, Map C


13
Figure 3-8: Base Scenario Place Types and Development Status, Map D
TOD Scenario
The TOD Scenario assumes that 100 percent of developed parcels will remain developed, 100 percent of parcels with committed development will develop as planned, and no development will take place on parcels designated as open space. The TOD Scenario provides an alternate future development pattern to the Base Scenario by redistributing future growth to the identified nodes from both the study area and the additional areas of influence surrounding the TOD nodes. In the TOD Scenario, TOD nodes follow the same footprint as nodes used in the Growth Scenario but redistribute population and jobs from a larger area of influence to achieve a higher density. This larger area of influence is the geographic area beyond the study area boundary out to a two-mile radius beyond the center point of the TOD node. Figure 3-9 through Figure 3-12 illustrate place types and development status of the study area under the TOD Scenario.
CommunityViz identifiedmore residents or jobs within a node than is permitted under current development regulations. In these cases, indicated by shares of undeveloped and underdeveloped parcels at levels of 100+% in Table 3-4, the node was assigned new, denser place types to meet the targeted level of growth. This adjustment resulted in development patterns that are congruent with the goals of the TOD Scenario and adequately concentrate development within the study area into the identified nodes and TOD nodes. To obtain these density results, the County or municipality would need to modify the place type and underlying zoning to allow for denser development.
Development targets in the TOD Scenario meet or exceed previously determined place type capacity at seven nodes:
• US 78 (residential development)
• US 176 (residential development)
• Near Old Highway 52 (residential development)
• Oakley Road (residential development)
• Near Gaillard Road (residential development)
• Between Pine Mountain Road and Gaillard Road (residential development)
• PNR – Santee Cooper (residential and non-residential development)
14
Node Residential Non-Residential Undeveloped / Underdeveloped Parcels Within Nodes US78 100% 15% US176 100+% 60% StephanieDr/WindsorMillRd 75% 40% OldMtHollyRd/MontaguePlantationRd 75% 10% NearOldHighway52 100+% 85% CypressGardensRd/Strawberry 100% 15% OakleyRd 100+% 15% NearGaillardRd 100% 20% BetweenMountainPineRdandGaillardRd 100+% 5% OldHighway52 50% 95% PNR-SanteeCooper 100+% 100+% Undeveloped / Underdeveloped Parcels Outside of Nodes, within Study Area OutsideofNodes 60% 25% Undeveloped / Underdeveloped Parcels within TOD Nodes’ Additional Areas of Influence WithinAdditionalAreasofInfluence 55% 15%
Table 3-4: Share of Undeveloped and Underdeveloped Parcels by Node Under the TOD Scenario


15
Figure 3-9: TOD Scenario Place Types and Development Status, Map A


16
Figure 3-10: TOD Scenario Place Types and Development Status, Map B


17
Figure 3-11: TOD Scenario Place Types and Development Status, Map C


18
Figure 3-12: TOD Scenario Place Types and Development Status, Map D
3.2 Example Node Development Rendering
Sample renderings were developed for the US 176 node illustrating what the area might look like, in terms of building mass, under the TOD Scenario. The node is conceived of as a Town Center TOD node, in which residential uses make up 60 percent of land uses, and commercial uses make up 40 percent, and there is a maximum of 1,500 housing units and 1,200 jobs at the node. The rendered assemblages illustrate the projected form and nature of residential, office and retail development under TOD Scenario. These materials are presented for visualization and comparison for decision-making and does not imply a proposed plan for development in this or any form.
Figure 3-13 presents the development metrics by place type for the US 176 node under the TOD Scenario.
Table 3-5 presents the development potential for each of the assembled blocks under the TOD Scenario. Using Place Types selected for the TOD Scenario and corresponding residential and non-residential development metrics, the US 176 node can be developed with 743 residential units (292 units in the TOD Place Type and 451 in the Urban Neighborhood Place Type).

Figure 3-14 presents the rendering of what development might look like for the US 176 node under the TOD Scenario.
19
Figure 3-13: US 176 Node Assemblage Under the TOD Scenario

20
Assemblage Place Type Assemblage Sq. Ft. Res. Units Res. Sq. Ft. Net Res. Area % Res. % NonRes. % Efficiency Net Non- Res. Area NonRes. FAR NonResidential Sq. Ft. A TOD 990,273 145 144,926 420,866 50% 50% 85% 420,866 1.5 631,299 B TOD 604,053 88 88,403 256,723 50% 50% 85% 256,723 1.5 385,084 C TOD 183,814 27 26,901 78,121 50% 50% 85% 78,121 1.5 117,181 D TOD 215,706 32 31,569 91,675 50% 50% 85% 91,675 1.5 137,513 Totals 292 291,799 1,422,762 E Urban Neighborhood 822,514 227 226,588 658,011 100% 0% 80% 0 0 F Urban Neighborhood 815,772 225 224,731 652,618 100% 0% 80% 0 0 Totals 451 0
Table 3-5: Development Assemblage for the US 176 Node under the TOD Scenario

21
Figure 3-14: US 176 Typology Under the TOD Scenario
3.3 Application of Performance Measures
The TOD Scenario was evaluated against the Base Scenario across select performance measures identified in coordination with BCDCOG. Table 3-6 summarizes the scenarios’ performance on land use performance measures based on the CommunityViz model outputs.
The performance of the preferred scenario under each of the plan’s objectives is as follows:
1. Encourage planned residential densities along the corridor including future locations for transit supportive land use in association with Lowcountry Rapid Transit. The TOD Scenario more successfully supports this goal in that it provides higher residential density per acre (1.15) than the Base Scenario (1.09) and more residential units within one-half mile of a transit stop (2.13 and 1.39, respectively).
2. Minimize occurrences of conflicting land uses; provide adequate buffers to shield residences from incompatible uses. The TOD Scenario about as successfully supports this goal as the Base Scenario. The TOD Scenario provides a narrower landscape and/or use buffer between residential and heavy industrial uses (598 feet, vs 855 feet under the Base Scenario) bas has fewer heavy industrial uses without a buffer from residential uses (9 uses vs 10 uses for the Base Scenario).
3. Provide a broader range of housing types and prices to meet area needs. Seek to meet minimum State of South Carolina thresholds for affordable housing. The TOD more successfullysupportsthisgoal thantheBaseScenariowithmoresinglefamilydetachedunits,more single family attached units and more multifamily units – both overall and within nodes –than the Base Scenario.
4. Organize existing and new patterns of commercial, office and industrial uses along Hwy 52 in nodes compatible with adjacent uses. The TOD Scenario supports this goal better than the Base Scenario, with more retail jobs (3,641) and office jobs (7,852) within one-half mile of transit than the Base Scenario (2,460 and 6,376, respectively), for overall higher activity density at transit stops (4.33 for the TOD Scenario and 3.11 for the Base). Both scenarios offer the same number of industrial jobs within one-half mile of transit and the same amount of preserved open space.

5. Protect uniqueenvironmental resources,including primefarmlands, numerouswetlandsand Goose Creek, which is on the South Carolina 2018 303d list of impaired waterbodies. Several privately-owned protected plantations in the vicinity of the Old US 52 intersection and are part of the Lord Berkeley Conservation Trust. Both Scenarios support this goal equally well, with 364 acres of environmental features / protected lands.
6. Continuetosupporteconomicdevelopment andemploymentgrowthwithinthecorridor. The TOD Scenario supports this goal better than the Base Scenario. The TOD Scenario shows 21, 407 jobs in the study area and the Base Scenario, 20,246.
7. Continue to provide suitable locations for new development and redevelopment for appropriate employment land uses with which to grow Goose Creek and Moncks Corner’s own employment and commercial base. The TOD Scenario supports this goal better than the Base Scenario. The TOD Scenario shows 21,407 jobs in the study area, 12,129 of them within one-half mile of transit, and the Base Scenario, 20,246 jobs in the study area, 9,472 of them within one-half mile of a proposed transit stop.
22
Encourage planned residential densities along the corridor including future locations for transit supportive land use in association with Lowcountry Rapid Transit.
Width of landscape and/or use buffer between residential and heavy industrial uses / Number
of heavy
affordable
housing Total Single Family Detached Units (Units within nodes) 20,335 (7,308) 20,434 (8,348) Total Single Family Attached Units (Units within nodes) 971 (510) 1,930 (1,529) Total Multifamily Units (Units within nodes) 1,449 (597) 2,609 (1,817)
Protect unique environmental resources, including prime farmlands, numerous wetlands and Goose Creek, which is on the South Carolina 2018 303d list of impaired waterbodies. Several privately-owned protected plantations in the vicinity of the Old US 52 intersection and are part of the Lord Berkeley Conservation Trust. area
lands within 1/2 mile of transit stops / study
Number of jobs in the study area 20,246 21,407 Continue
development Number of jobs in the study area 20,246 21,407
23
Performance Measure (s) Base Transit Oriented Development
Table 3-6: Performance Measures Objective
Number of residential units per acre (increase over Base Scenario) 1.09 1.15 (+.06) Unit density within 1/2 mile of proposed transit stop (increase in units) 1.39 2.13 (+0.74)
industrial
Minimize occurrences of conflicting land uses; provide adequate buffers to shield residences from incompatible uses 855 ft / 10 parcels 598 ft / 9 parcels
uses without a buffer from residential uses
Provide a broader range of housing types and prices to meet area needs. Seek to meet minimum State of South Carolina thresholds for
Number of retail jobs within ½ mile of transit stops 2,460 3,641 Number of office jobs within ½ mile of transit stops 6,376 7,852 Number of industrial jobs within ½ mile of transit stops 184 184 Ratio of development nodes to preserved open space Preserved Open Space is same across both scenarios Activity density within 1/2 mile of transit stops 3.11 4.33
Organize existing and new patterns of commercial, office and industrial uses along Hwy 52 in nodes compatible with adjacent uses
Percent share of environmental features / protected 364 acres 364 acres
Continue to support economic development and employment growth within the corridor
to
provide suitable locations for new
and redevelopment for appropriate employment land uses with which to grow Goose Creek and Moncks Corner’s own employment and commercial base.
Number of jobs with access to transit
Table 3-7 compares parcel development characteristics across scenarios. Place types were kept constant across the scenarios unless a change was needed to accommodate projected growth. Place types were changed across more parcels in the TOD Scenario to accommodate marginal growth at slightly greater densities at nodes and TOD nodes.
TheTODScenariowouldsupport thedevelopment andredevelopment of undevelopedandunderdeveloped parcels at development nodes to a greater degree thanthe Base Scenario. The TOD Scenario would support an additional residential development and redevelopment at all eleven nodes and additional non-residential development at nine nodes.
Table 3-7: Development of Scenarios: Percent Area Developed Based on Targets and Existing Development
100+% Non-Residential: l0%
Stephanie Dr / Windsor Mill Rd Residential: 0%
Old Mt Holly Rd / Montague Plantation Rd
Near Old Highway 52
Cypress Gardens Rd / Strawberry
Oakley Rd
Near Gaillard Rd
Between Mountain Pine Rd and Gaillard Rd
Old Highway 52
PNR - Santee Cooper
Non-Residential: 0%
Residential: 20%
Non-Residential: 10%
Residential: 100+%
60%
75%
Residential: 75%
0%
Non-Residential: 10%
Residential: 100+%
Non-Residential: 40% Non-Residential: 85%
Residential: 30%
Residential: 100%
Non-Residential: 10% Non-Residential: 15%
Residential: 100+%
Non-Residential: 10%
Residential: 70%
Non-Residential: 0%
Residential: 90%
Non-Residential: 0%
Residential: 20%
Residential: 100+%
Non-Residential: 15%
Residential: 100%
Non-Residential: 20%
Residential: 100+%
Non-Residential: 5%
Residential: 50%
Non-Residential: 10% Non-Residential: 95%
Residential: 50% Residential: 100+%
24 Objective Performance Measure (s) Base Transit Oriented Development
9,472 12,129
Characteristics Base Scenario TOD Scenario Developed Parcels 100% 100% Committed Development 100% 100% Open Space 0% 0% Undeveloped / Underdeveloped Parcels
US
Residential:
Residential:
Non-Residential:
Non-Residential:
US
Residential:
Residential:
Non-Residential:
Within Nodes
78
0%
100%
0%
15%
176
0%
Residential:
Non-Residential:
Non-Residential: 100+% Non- Residential: 100+%
Undeveloped / Underdeveloped Parcels Outside of Nodes and within Study Area
75%
60%
50% Non-Residential: 25%
55%
15%
Undeveloped / Underdeveloped Parcels within TOD Nodes’ Additional Areas of Influence TOD Nodes’ Additional Areas of Influence
Table 3-8 presents a summary of total households and employment within the nodes in both scenarios. By design, the TOD scenario has the highest total number of households and employment within the nodes.
Table 3-9 presents a summary of households and employment outside of one half-mile of the nodes in each scenario. The Base Scenario has the highest number of households and employment in this area, as some of the growth in this area is redirected to nodal areas under the Growth Management and TOD Scenarios.
Table 3-10 compares residences and jobs and their level of access to transit across scenarios. Under the TOD Scenario, the total number of jobs and the number of jobs accessible by transit are greater than under the other scenarios. The same is true for residential dwelling units. The TOD Scenario would more successfully concentrate development where it could be served by future high-capacity transit.
25
Outside
Residential:
Residential:
of Nodes
Non-Residential:
Residential:
Non-Residential:
N/A
Households (2020) Households (2040) Growth in Households Employment (2020) Employment (2040) Growth in Employment Within Nodes (Base) 5,353 7,693 2,340 7,133 9,472 2,340 Within Nodes (TOD) 5,353 11,785 6,431 7,133 12,129 4,996
Table 3-8: Summary of Households and Employment Within Nodes
Households (2020) Households (2040) Growth in Households Employment (2020) Employment (2040) Growth in Employment Outside Nodes, within Study Area (Base) 7,601 13,535 5,933 7,640 10,774 3,134 Outside Nodes, within Study Area (TOD) 7,601 10,568 2,967 7,640 9,278 1,638
Table 3-9: Summary of Households and Employment Outside One Half-Mile of Nodes
4 Environmental Resources
4.1 TOD Scenario
Based on input received from the project Steering Committee and from the public, the Transit Oriented Development (TOD) Scenario has been identified as the preferred scenario for guiding future land use and development along the US 52 corridor. In the TOD Scenario, land near three identified TOD locations at US 176/Goose Creek Downtown, Cypress Gardens Road/Strawberry, and Northern Terminus-Park and Ride at Santee Cooper will develop with higher intensity than the Base Scenario and Growth Management Scenario. The TOD Scenario focuses corridor growth at identified nodes with more intense development patterns at transit stop/TOD locations using new, TOD-based place types, and it redirects a portion of anticipated growth from outside the corridor but within a 2-mile radius of the nodes into the three nodes identified for TOD. Total population, households, and employment for the corridor is therefore higher than the Base and Growth Management Scenarios.
4.2 Environmental Resources
Environmentally sensitive lands and environmental constraints within and surrounding the US 52 Corridor Study Area were identified and mapped. Sensitive lands are areas that have environmental benefits for natural and recreational resources, including farmland soils, wetlands and streams, 100-year flood areas, and open space (protected and/or recreational). Environmental constraints include protected species (waterbird colony and bald eagle nesting sites), historic resources (National Register eligible and listed), and cemeteries.
Table 4-1 shows the percentage of sensitive lands and number of environmental constraints contained within the development nodes, study area, and TOD influence areas (outside the corridor but within a 2mile radius of the TOD nodes), and clearly shows that as distance from the US 52corridor and development nodes increases, so does the relative amount of sensitive lands and number of environmental constraints.
26
Table 3-10: Comparison of Scenarios for Residential and Employment Density
*Residence or job is within one-half mile of transit
Characteristics Base Scenario TOD Scenario Number of Residential Dwelling Units (DUs) 22,755 24,973 Number of residential DUs with access to transit* 8,414 11,694 Non-residential Area, in square feet 31,532,784 33,712,941 Number of Jobs 20,246 21,407 Number of Jobs with access to transit* 9,472 12,129
1 StJamesGooseCreekChurchandCemetery,OtrantoPlantation
2 BigginChurchRuins,BigginChurchCemetery,TailraceCanal
3 SwampFoxDrive-inTheatre
4 SwampFoxDrive-in,GippyPlantationHouse/GippyDairyPlant,TheOaksPlantation
5 OldSanteeCanal
Because in the TOD scenario a percentage of anticipated future growth would shift from the TOD influence areas to the development nodes, this would help reduce impacts to environmentally sensitive lands and therefore result in positive effects to environmental resources in these areas.
5 Active Transportation
The following section describes the recommendations and opportunities for active transportation improvements within the study area and at the identified nodes for the selected preferred scenario, TOD.
5.1 TOD Scenario
As the preferred scenario, the TOD scenario focuses on expected study area growth within the identified nodes; developments would include higher densities, allowing for additional sidewalk and bicycle connections and opportunities through new development. For example, developments may include new streets or access points that would incorporate sidewalks and connections to existing pedestrian facilities.
Active transportation within the TOD Scenario would focus on safe and direct pedestrian connections to transit facilities and on bicycle network improvements, where feasible. Transit stations, located within each node, would include amenities such as shelters, benches, lighting, real-time “next bus” signs, and bike racks.
Landscape buffered sidewalks and enhanced intersection crosswalks are examples of facilities that could be implemented in and supported by the TOD Scenario, increasing the presence and amount of sidewalk andbicyclefacilities,aswell asprovidingsafeconnectivitytotransit stops.Designfor enhancedcrosswalks
27
Sensitive Lands and Environmental Constraints Nodes Study Area (including Nodes) TOD Influence Area (outside of Study Area) PrimeorStatewideImportantFarmland 85% 86% 93% FEMA100-yearFloodArea 5% 16% 35% NWIWetlands 14% 26% 35% OpenSpace(recreationalandprotected) 3% 5% 9% WaterbirdColony 0 2 7 BaldEagleNest 1 1 1 HistoricStructures(NationalRegisterListed) 0 31 32 HistoricStructures(PotentiallyEligible) 13 34 0 HistoricAreas(NationalRegisterListed) 0 15 15 Cemeteries 2 8 3
Table 4-1: Percentage of Sensitive Lands and Number of Environmental Constraints
may be as minimal as basic striping to increase visibility or as intensive as fully controlled crossings with traffic signals and call buttons. Installation of simple concrete islands in the existing center turn lane may be practical short-term solutions to increase safety. Installing raised medians or pedestrian crossing islands would improve safety by simplifying crossing maneuvers and allowing pedestrians to cross one direction of traffic at a time.
TOD Scenario Recommended Improvements
In addition to incorporating the WalkBike BCD improvements, additional sidewalk connections are proposed at the following locations, as shown in Figures 5-1 and 5-2;
• Along Woodland Lakes Road between US 52 and Sora Lane (Stephanie Windsor Mill node)
• Between US 52 and the park and ride lot at Altman Street
• Between Old US 52/Rembert C. Dennis Blvd and the Santee Cooper park and ride site; along Riverwood Drive (Santee Cooper node)
• Between Old US 52/Rembert C. Dennis Boulevard and US 52, along Riverwood Road (Santee Cooper node)
• Between E. Main Street and Peagler Way (filling the connection into Moncks Corner Regional Recreation Complex (Old Hwy 52 node)
• Along 1st St. John Drive between Old Hwy 52 and Rockville Road (Old Hwy 52 node)
• Along Bradley Road, to Shannonwood Drive (Old Hwy 52 node)
• Along Shannonwood Drive between Birchwood Drive and Old US 52 (Old Hwy 52 node)
• Along Gaillard Road between Stoney Creek Way and US 52 (Near Gaillard node)
• Along Westbury Lane between US 52 and Sugeree Drive
• Between Highway 52 and the entrance of Foxbank Plantation (Cypress Gardens node)
• Along Robin Wood Boulevard between Piney Branch Drive and US 52 (Between Mountain Pine node)
• Along Moss Grove Drive between entrance of Moss Grove Plantation and US 52 (Between Mountain Pine node)
• Along Red Bank Road, across US 52 (US 176 node)
• Along Liberty Hall Road, across US 52 (US 176 node)
Additional Opportunities with Transit
The TOD Scenario would focus more intense growth and density within the nodes, presenting added active transportation opportunity for connection within the new development footprint, such as along new roadways and access points. The TOD scenario envisions a further intensity of development around three nodes;
• Santee Cooper Park and Ride (enhanced transit zone),
• Cypress Gardens/Strawberry Road (enhanced transit zone), and
• US 176 (enhanced transit zone).
With enhanced transit service (micro-transit) and anticipated increase in population and employment in these TOD nodes, landscape buffered sidewalks, mid-block pedestrian crossings, protected bicycle lanes and enhanced intersection crosswalks are examples of facilities that could beimplemented in and supported by the TOD Scenario, increasing the presence and amount of sidewalk and bicycle facilities, providing safe connectivity to transit stops and enhancing user safety and comfort level. When street-facing retail and commercial developments replace car-oriented shopping centers and strip malls along the corridor, the volume of pedestrians and cyclists from residential and employment centers should increase.
28


29
Figure 5-1: US 52 TOD Scenario Active Transportation Improvements


30
Figure 5-2: US 52 TOD Scenario Active Transportation Improvements
Summary
As presented in the Scenario Briefing Report, the TOD Scenario would expect to see approximately 6.2 miles in new sidewalk, 6.8 feet of new bicycle facilities and 14.6 miles in path facilities within the TOD nodes. The TOD Scenario would provide ample opportunity for more sidewalk connections within the new development footprint, such as along new roadways and side streets. Additional access points within a development footprint could provide an opportunity to connect sidewalk, bicycle facility or a path facility to a nearby existing facility.
With the TOD Scenario anticipating a larger transit zone within the three designated nodes, there is opportunity to implement more enhanced bicycle and pedestrian facilities within the area to increase user separation from vehicles and improve user safety and comfort level. These include separated bicycle and pedestrian facilities from an activity center to a larger residential area or another activity center. The improved bicycle and pedestrianfacilities wouldconnect andactivatetherecommendedhigher densityland use along the corridor.
6 Transit
The US 52 study area is served by the area’s local transit service provider, TriCounty Link (TCL), which operates both commuter and fixed route bus service in the rural areas of Berkeley, Charleston, and Dorchester counties. TCL’s service is comprised of 11 deviated fixed routes (operating as a flag stop system) and five commuter routes, of which two routes operate either partially (Fixed Route B102) or fully (Commuter Route CS1) along the study corridor. CS1 originates at the Santee Cooper Park and Ride lot at the north end of Moncks Corner with stops at the park and ride lots at the Berkeley County Administration Building and at 303 N. Goose Creek Boulevard and terminates at the CARTA Melnick Drive/Antler Drive (Rivers Avenue) Park and Ride Lot in North Charleston. There are eight scheduled weekday round trips, with four operating in the morning and four operating in the afternoon/evening. B102 also uses a major portion of US 52 between Moncks Corner and Goose Creek, stopping at the same park and ride lots. This route consists of a single morning trip and a single early afternoon trip. Both routes make connections to other routes on both the north and south ends of the corridor, including routes operated by the urban transit provider, Charleston Area Regional Transportation Authority (CARTA).
6.1 Transit Service for the TOD Scenario
AtransitservicescenariowasdevelopedtocomplementthepreferredTransitOrientedDevelopment(TOD) land use scenario. The growth assumptions made in the TOD scenario influences what transit services can potentially be sustained or accommodated, although there is no one-size-fits-all density formula to ensure project success.1 Residential and employment density thresholds2 are a starting point for collaboration among transit agencies, local governments, communities, and private developers in order to identify an appropriate level and type of transit service. The TOD Scenario could warrant more frequent bus service along the corridor with designated stops, improved passenger amenities such as shelters and benches, and increased frequencies on feeder routes. This more frequent bus service could come in the form of a
1Source: Planning for Transit-Supportive Development: APractitioner’sGuide,FTAReportNo.0057,(June2014)
2Residentialdensitiesexceeding15to20homes/acreandemploymentareaswithdensitiesof50jobsperacreorhigheraretargets forhigherfrequency,highervolumeserviceprovidedbyhigh-capacitytransit.Source: Transit-Supportive Densities and Land Uses,APSRCGuidancePaper(February2015).
31
dedicated Bus Rapid Transit (BRT)3 system on a dedicated busway or via BRT “Lite”, a bus that operates in mixed traffic supported by pedestrian infrastructure such as traffic signals and marked crosswalks. The service and stations would have prominent branding or identity.
A BRT service would have to build off more robust transit service than what currently exists in the corridor as well as changes in current feeder routes. A new, more frequent trunk service that serves the entire length of the US 52 corridor, with the other TCL routes providing support for that route by “feeding” passengers by means of transfer, would have to be first introduced. Building off the trunk line service, other changes to TCL services could be appropriate, including changes to routing and frequency of some of the feeder servicesasexplainedbelow.TCLisalsointerestedinmovingawayfromaflexroutesystemwithinfrequent trips to an on-demand service model. Therefore, it is suggested the feeder routes in the study area that loop in the rural areas north of Moncks Corner be transformed into demandresponseroutes; in moreurban areas, these routes will be changed into arterial (non-deviated) routes to provide more direct and faster service. Once those changes are in place and robust development has taken place, then it would be appropriate to start investigating a BRT service in the corridor.
In addition to introducing a BRT service, service modifications are assumed for current TCL routes serving the corridor. The route changes include changes in service type; many of the routes are proposed to transition to all day service to match the increase in transit demand at the BRT stops. In addition, TCL should transition to set signed stops on feeder routes operating south of Moncks Corner rather than routes stopping anywhere along its alignment using flag stops. Complimentary ADA service would be provided along all (non-deviated) local fixed routes proposed in this plan.
The TOD Scenario assumes that the BRT service would stop at the 11 development nodes proposed in Figure 6-1. Infrastructure improvements including traffic signals, pedestrian crossings, bike paths and additional sidewalks to allow riders to access transit stops from surrounding neighborhoods are critical to transit service success and would have to be implemented at each of these development nodes.
The TOD scenario envisions a further intensity of development around the three TOD nodes—Santee Cooper Park and Ride (Moncks Corner), Cypress Gardens/Strawberry Road(Berkeley County) and US 176 (Goose Creek). To serve additional development and the potential transit riders in the vicinity of the three TOD nodes, an additional transit mode (micro transit)4 can be layered onto the proposed service change to enhance transit connections to the BRT. The micro transit zones proposed cover from two to four square miles around each node. The micro transit zones would be served by a demand response service using a smaller transit vehicle (e.g. a van) that would carry anyone within that area with an advance reservation within an hour or less. Most reservations would be expected to be made through a phone app; regular riders would be able to subscribe and would only need to cancel/change on days they do not plan to ride their regular trip. One stop would anchor the micro transit zone (likely the BRT stop within the TOD), where a person would not need to make a reservation to ride; the vehicle would wait there on a set schedule and frequency coordinated with the mainline BRT schedule.
In addition to these three nodes, the proposed neighborhood/town center node at US 78 area will be an important connection with the proposed Lowcountry Rapid Transit. CARTA and TCL can collaborate to
3BusRapidTransit(BRT),alsocalledabuswayortransitway,isabus-basedpublictransportsystemdesignedtohave bettercapacityandreliabilitythanaconventionalbussystem.Typically,aBRTsystemincludesroadwayswithlanesthatare dedicatedtobuses,andgivesprioritytobusesatintersections
4 Microtransitisaformofdemandresponsivetransport.Thistransitserviceoffersahighlyflexibleroutingand/orhighlyflexible schedulingofminibusvehiclessharedwithotherpassengers
32
increase frequency on routes serving the US 78 development node to serve the population near this park and ride, which is also a proposed LCRT station. The potential for BRT trips in the US 52 corridor to be through-routed between Moncks Corner and downtown Charleston along the proposed Lowcountry Rapid Transit (LCRT) right of way should be considered. This is the operating plan that has been assumed for BRT routes in the corridor in previous studies, such as the I-26 ALT and the Regional Transit Framework Plan.
Table 6-1 shows the suggested changes for each of the routes that would feed into the BRT corridor. For simplicity, the new route designations have been identified by a simple numbering system as shown in column 1 and also shown in Figure 6-2.
33


34
Figure 6-1: Proposed BRT Station Stops
35
New Route Number Former Route Number Description BRT Transfer Location Service Type/Frequency TOD Scenario Service Change 1 B102 Moncks Corner to Jedburg via Jedburg Road and Cooper Store Road Santee Cooper, Old Highway 52 Local (hourly) Increase in trips/frequency 2 B102 Jedburg to Goose Creek via US 176 Peak service via Old Mt. Holly Road and to Naval Base Old Mt Holly Local (hourly— main route), AM/PM Rush (limited—to Old Mt Holly) Increase in trips/frequency 3 CS1 BRT N/A BRT New BRT service 4 B102 Goose Creek to Hanahan via Red Bank Road and Rhett Avenue US 178 Local (hourly) Increase in trips/frequency 5 CS4 Moncks Corner via St. Stephen and Pineville Santee Cooper, Old Highway 52 Local (hourly) Route extended south via Old US 52 to Roper St Francis Berkeley Hospital N/A Moncks Corner Micro transit N/A N/A N/A New micro transit service N/A Strawberry Micro transit N/A N/A N/A New micro transit service N/A Goose Creek Micro transit N/A N/A N/A New micro transit service
Table 6-1: Summary of Route Modifications for TOD Scenarios


36
Figure 6-2: Proposed TOD Scenario Route Modifications5
6.2 Application of Performance Measures
In order to evaluate the TOD Scenario, transit performance measures have been identified as follows:
• Number of additional routes, trips and stations from current TCL service
• Improved transit access to jobs
o Measured by number of jobs within ½ mile of a BRT Lite/BRT stop, ¼ mile from a fixed route, and five miles for park and ride stops
• Improved transit access for people
o Measured by number of people within ½ mile of a stop of a BRT Lite/BRT stop, a ¼ mile from a fixed route, and five miles for park and ride stops
Table 6-2 summarizes the results of the performance measure for the TOD Scenario.
As Table 6-2 indicates, the number of additional routes decreases from the baseline (current) service as low performing, infrequent routes are replaced by general public demand response service. However, service coverage will either remain the same or improve with the introduction of the general demand responseservice. ThenumberofcurrentdailytripsonroutesservingtheUS52corridorhowever,increases. The number of current daily trips is estimated at 59. This number increases to 167 additional trips as the system is built out around the US 52 BRT service.
6 Aonedirectionallooprouteisconsidered2trips
7 Assumesanequivalentof8tripsadayonthedeviatedfixedroutesreplacedbygeneralpublicdemandresponseserviceonroutes northofMoncksCorner;numberofcurrenttripsis59
8 RefertoSection3PerformanceMeasuresforreferenceonestimatingjobsandpopulation
37
Performance Measure TOD Scenario Number of additional routes from current TCL service6 -1 Number of additional trips from current TCL service7 167 Number of additional stations from current TCL service 7 Improved transit access to jobs in 2040 (number of jobs shown)8 227,523 Improved transit access for people in 2040 (projected population shown) 346,242
Table 6-2: Summary of Transit Performance Measure Metric for TOD Scenario
Improved transit access metrics were calculated by using projected jobs and population numbers from Census Bureau Traffic Analysis Zones (TAZ) that were developed for the land use scenario planning analysis. Using this data, a conclusion can be drawn that as the frequency of the routes in the region increases, the “accessibility” to jobs increases as more shift times are met and the utility of using transit to get those jobs also increases. It is much more convenient and feasible to use transit when the frequency and span of service better meets the population’s travel needs. Subsequently, the more frequent the service, the more access people living in the corridor will have to jobs and to activity centers.
7 Traffic & Roadway
7.1 Design Year Volume Development
Twelve segments along the US 52 and Old US 52 corridors, and other major roadways in the project area, were evaluated to calculate growth rates and resultant future year volumes. The CHATS travel demand model was modified to account for the Transit Oriented Development (TOD) land use adjustments within the affected Traffic Analysis Zones. The resultant 2040 TOD forecast for both Average Daily Traffic (ADT) and peak period traffic was compared against the 2020 Base Year volume to establish an annual growthrate to be applied tothe individual intersectionturning movement counts (TMC) conducted in 2020. Table 7-1 outlines each of the 12 segments and their calculated Annual Growth Rates for ADT and peak hours and the selected growth rate used to generate 2040 intersection turning movements.
These 2040 future year turning movements were then balanced across the corridor. Once balanced, the estimated mode shift to Bus Rapid Transit (BRT) was applied as outlined in Table 7-2. Vehicles were removed from the through volume in the southbound direction in the AM peak and northbound in the PM peak between Otranto Road and Moncks Corner.
38
Street Segment Growth Rates Growth Rate Selection Daily AM Peak PM Peak US52northofOldUS52/RembertC.DennisBlvd 3.15% 2.82% 2.64% 2.75% RembertC.DennisBlvdnorthofUS52/OldUS52 2.30% 2.56% 3.02% 2.75% US52northofGaillardRoad 3.17% 2.92% 3.22% 3.00% OldUS52northofGaillardRoad 5.25% 5.88% 4.76% 4.00% OldUS52northofCypressGardensRoad 4.12% 2.02% 4.44% 4.00% US52northofOldUS52 3.93% 5.96% 4.02% 4.00% OldUS52northofUS52 4.45% 6.00% 3.13% 4.00% US52northofUS176 2.95% 0.86% 2.86% 3.00% US52northofUS78 2.28% 4.02% 3.15% 3.00% US176westofUS52 3.49% 3.86% 3.43% 3.50% US52northofOtrantoRoad 1.51% 2.64% 2.60% 2.00% US78westofUS52 2.06% 1.81% 2.06% 2.00%
Table 7-1 – Growth Rates
These adjusted volumes were then used to develop origin-destination (O-D) matrices for the AM and PM peak hours in TransModeler.
To better model the traffic patterns, it was determined that developing an O-D matrix would be the best method to simulate how volumes were loaded into and travel through the network, as was done in the development of the 2020 base year analysis. The O-D matrices for the AM and PM peak hours were developed using the 2020 O-D matrices with the 2040 turning movements in order to estimate 2040 O-D matrices. Manual adjustments were made to account for any imbalance between turning movements upstream and downstream. As was done in the 2020 analysis, the same 13 sink/source centroids were then added to the links between study intersections to account for network imbalances due to multiple driveways/roadways.
Truck Percentages were kept the same in the 2040 future analysis as used in the 2020 base year analysis. The only difference in volume between the 2040 future no build and the 2040 future year build scenarios is the volume displacement as a result of the right in/right out intersection conversion at University Boulevard at Old University Boulevard proposed by the Lowcountry Rapid Transit project.
7.2 Traffic Analysis
The traffic analysis was performed using TransModeler, which simulates the movement of vehicles in a model of the roadway network and reports delay and level of service (LOS) based on the results of the simulation.
The analysis of the existing 2020 traffic volumes revealed that the network operates relatively well, with only a few intersections reporting delays in the LOS E or F range. In the 2040 no-build network, however,
39
Southbound AM Northbound PM Node/Station Passengers Boarding w/10 min. Headways Vehicles to Subtract South of the Node Passengers Alighting w/10 min. Headways Vehicles to Subtract North of the Node SanteeCooperP&R 12 72 72 12 72OldUS52(N) 4 24 96 4 24 72 MountainPineRd 3 18 114 3 18 96 GaillardRd 4 24 138 4 24 114 OakleyRd 3 18 156 3 18 138 CypressGardensRd 9 54 210 9 54 156 OldUS52(S) 3 18 228 3 18 210 OldMtHollyRd 4 24 252 4 24 228 StephanieDr 3 18 270 3 18 252 LibertyHallRd 8 48 318 8 48 270 MelnickDr - 318
Table 7-2 – Traffic Volume Reduction for BRT
with the increase in traffic volumes on the existing network, several additional intersections are projected to operate at LOS E or F, with long queues and periods of network gridlock observed in the simulation. The worst delays on US 52 were observed in the vicinity of the intersection with US 176 (Saint James Avenue) / Red Bank Road and in the at the US 52 intersections with Old Mount Holly Road / Montague Plantation Road and Gaillard Road.
In the build model, several improvements were coded into the network to alleviate bottlenecks observed in the no-build model. In some instances, this resulted in an increase in delay and degradations in LOS at several intersections compared to the no-build model. This phenomenon occurs when one intersection is “fixed” in the model, and subsequently allows vehicles to either enter the network that were otherwise constrained and/or progress to another intersection downstream, causing issues there. Hidden bottlenecks are defined by the FHWA as intersections/areas that appear to operate well because traffic demand is metered by another upstream bottleneck, and an area that would become more congested if only the unconstrained traffic could reach it. In the no-build model, these hidden bottlenecks operated well because a substantial amount of traffic that was supposed to flow to them were stuck in congestion at upstream intersections and were not able to proceed through the entire network. This is further evidenced in the result messages from TransModeler; in the no-build network, several thousand vehicles were queued outside of the roadway network when the simulation ended, so those vehicles never entered the network or contributed delay to interior intersections. In the development of the 2040 build model, far fewer vehicles were queued outside of the network, so there were many more vehicles moving downstream during the simulation, contributing to delays and traffic congestion.
After a number of iterations to improve operations while also allowing more of the traffic demand to enter the network, one of the major improvements identified by the traffic analysis is the need to widen US 52 to six lanes beyond its current narrowing just north of Button Hall Avenue in Goose Creek. The projected traffic volumes are above the capacity of a four-lane roadway. Several of the intersections in this area reported acceptable delay and LOS in the no-build model only because much of the traffic demand are delayed upstream at these hidden bottlenecks. The results of the 2040 No-Build analysis in relation to the 2020 Existing conditions analysis is presented in Table 7-3, but it needs to be recognized that results in the 2040 No Build columns would show longer delays and worse levels of service if it weren’t for these hidden bottlenecks upstream.
40
7.3 Recommended Improvements

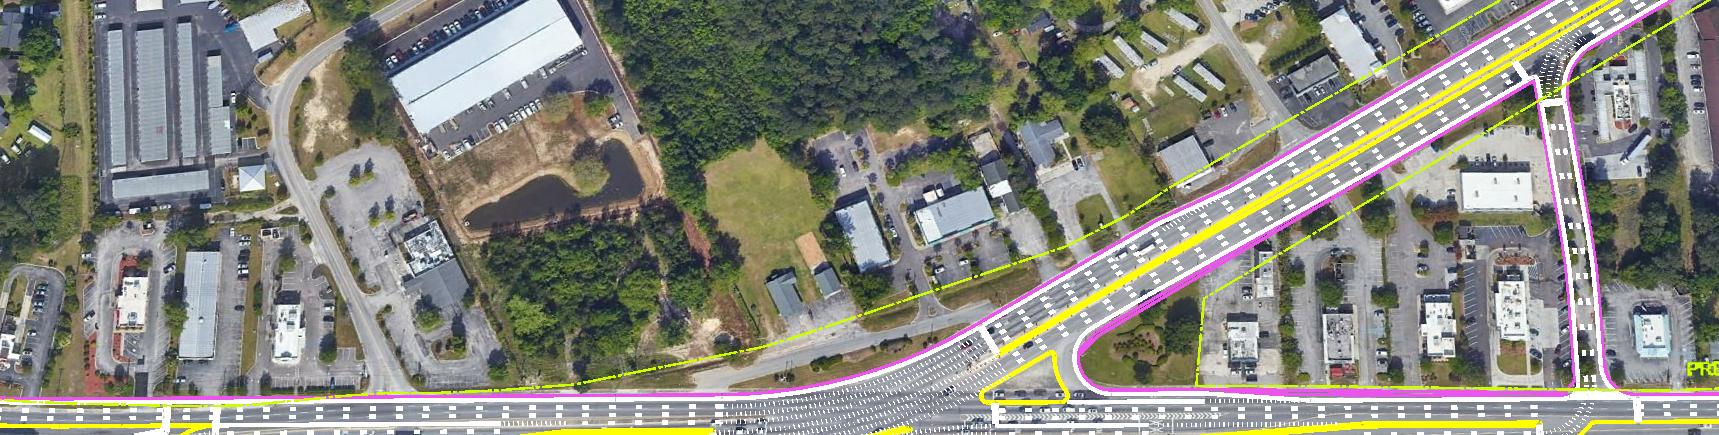
Based on the projected traffic volumes, it is recommended to widen US 52 to a six-lane cross section from north of Button Hall Avenue to north of Foxbank Plantation Blvd, a distance of approximately 6 ½ miles. Further it is recommended to add one through lane in each direction at the intersection of Gaillard Road, beginning approximately 1000 feet before and extending approximately 1500 feet after to accommodate the projected though queue and to provide sufficient distance to merge back to a 4 lane roadway. The example show in Figure 7-1 below illustrates the proposed widening of US 52 to a six-lane roadway at Montague Plantation Road, along with the addition of a high capacity transitway and associated station platform in the median to be discussed in the section below.


41 Table 7-3 – 2040 No Build Levels of Service and Delay
The second major improvement in the network affecting several intersections in Goose Creek is the incorporation of a superstreet at US 52 and US 176 / Red Bank Road. In this configuration, through traffic on US 176 / Red Bank Road traveling across US 52 is restricted and required to turn right. The through movement traffic isthen redirected to turn left at new northern and southern crossovers, which then connect back to US 176 to the north or Red Bank Road to the south. This configuration eliminates the current seven phase signal at the main intersection and replaces it with dual two-phase signals in each direction on US 52, allowing for improved operations and the ability for bi-directional signal coordination. The intersections with the crossovers result in four additional two-phase signals, which spreads out the heavy traffic patterns to different isolated locations and substantially improves operations. Nevertheless, there are still some capacity issues with this configuration, most notably US 52 southbound in the AM peak hour, which continues to queue back through upstream intersections to the north. It should be noted that this network in the build model also receives substantially higher traffic volumes than the no-build model due to the alleviation of upstream hidden bottlenecks described above. Additional widening of US 52 to accommodate the total traffic demand is constrained on the east side by the railroad and on the west side by commercial development. Grade separating the intersection can address the capacity issues, but cost and property impacts make this impractical at this time. Figure 7-2 illustrates this Superstreet concept.


42
Figure 7-1 – Recommended Improvement at US 52 and Montague Plantation Road
In addition to these major improvements, other specific intersection improvements along the corridor include:
• US 52 at Thomason Boulevard / Liberty Hall Road:
o Eastbound right turn lane with 100 feet of storage
o Extension of the westbound left and right turn lanes to 400 feet of storage
o Extension of the northbound left turn lane to 400 feet of storage
o Extension of the southbound left turn lane to 400 feet of storage
o A raised median is also recommended on US 52 when the center lane is striped as a dedicated left turn lane in one direction
• US 52 at Button Hall Road:
o Extension of the northbound left turn lane to 400 feet of storage

o A raised median is also recommended on US 52 when the center lane is striped as a dedicated left turn lane in one direction
• US 52 at Central Avenue:
o Removal of the continuous green-T intersection, which brings northbound US 52 under signal control
o Third through lane in each direction of US 52
o Eastbound dual left and single right turn lanes with 200 feet of storage
o Northbound left turn lane with 300 feet of storage
o Southbound right turn lane with 300 feet of storage
• US 52 at Hollywood Drive:
o Removal of the continuous green-T intersection, which brings southbound US 52 under signal control
o Third through lane in each direction of US 52
o Westbound left turn lane and shared left/right turn lane, each with 300 feet of storage
43
Figure 7-2 – Superstreet at US 52 and US 176/Red Bank Road
• US 52 at Windsor Mill Road / Stephanie Drive:
o Third through lane in each direction of US 52
• US 52 at Montague Plantation Road:
o Background improvements matching with the Henry Brown Blvd project
o Third through lane in each direction of US 52
• US 52 at Old US 52:
o Removal of the continuous green-T intersection, which brings southbound US 52 under signal control
o Third through lane in each direction of US 52
o Westbound dedicated left turn and shared left/right turn lanes with 250 feet of storage
• US 52 at Google Entrance:
o According to SCDOT, the signal at the Google entrance will be removed. It likely therefore, that some left turn traffic will utilize Tom Hill Road to access Mount Holly Commerce Park.
• US 52 at Tom Hill Road:
o The eastbound right turn lane flows uninterrupted into a dedicated lane on US 52 southbound, which then merges south of the intersection
o Third through lane in each direction of US 52
o Monitor future growth within the Mt. Holly Commerce Park to evaluate the need to signalize the intersection.
• US 52 at Cypress Gardens Road:
o Eastbound dual left turn lanes, one with 150 feet of storage and the other with 300 feet of storage (this preserves the westbound left turn lane into the gas station on the southwest corner of the intersection)
o Westbound left turn lane with 150 feet of storage, through lane (existing), and shared through/right turn lane with 350 feet of storage
o Northbound dual left turn lanes with 275 feet of storage; the second westbound lane on Cypress Gardens Road can terminate as a right turn lane at Yorkshire Drive or other new development on the northwest corner of the intersection
o Southbound dual left turn lanes with 275 feet of storage; the second eastbound lane on Cypress Gardens Road can terminate as a right turn lane into the new Publix development
o Third through lane in each direction of US 52
• US 52 at Gaillard Road:
o Eastbound left turn lane with 850 feet of storage and right turn lane with 300 feet of storage
o Westbound left turn lane with 150 feet of storage
o Northbound dual left turn lanes with 350 feet of storage; the second westbound lane on Gaillard Road can terminate into the existing right turn lane at Stoney Creek Way
o Third through lane in each direction of US 52
• US 52 at Old US 52 / Rembert C Dennis Boulevard
o Two eastbound through lanes, dual left turn lanes with 600 feet of storage, and extension of the right turn lane to 300 feet of storage
o Westbound dual left turn lanes with 200 feet of storage
o Northbound left turn lane with 50 feet of storage
o Extension of the southbound free-flow right to 100 feet of storage, which allows right turning vehicles to bypass the queue for the through movement
44
• US 52 at Rembert C Dennis Boulevard / Reid Hill Road
o Redirect eastbound left turns and southbound right turns to use Anglers Drive as part of a modified Quadrant Roadway configuration as illustrated in Figure 7-3 below. Eastbound left turns would enter northbound US 52 using a median acceleration lane, signalizing southbound US 52. Southbound double left turn lanes would be added to turn onto Rembert C. Dennis Blvd. In addition, the northbound channelized right turn from Rembert C. Dennis Blvd would be modified to signal controlled dual right turn lanes.

The results in Table 7-4 below provide the 2040 Build conditions, accounting for the improvements described above.

45
Figure 7-3 – Modified Quadrant Roadway at US 52 and Reid Hill Road
7.4 Proposed Transitway Design Approach

ImplementingreliablehighcapacitytransitservicealongtheUS52Corridorrequiresadedicatedtransitway where feasible, while accommodating operations in mixed traffic segments through traffic signal priority and/or preemption. The preferred Bus Rapid Transit (BRT) design is to add two dedicated bus lanes along the corridor, in coordination with other necessary improvements to improve traffic operations & safety. It is necessary to vary design approaches to mitigate adverse impacts to the adjacent railroad and commercial development, while preserving sufficient right-of-way for improvements. The process included the evaluation of existing conditions, available right-of-way, station locations, complex intersection geometry, projected traffic volumes and levels of service, pedestrian connectivity and other constraints. The study utilized work previously completed for the LCRT project, mimicking similar typical sections with similar conditions as well as account for the recommended traffic and roadway improvements along and south of US 78. Along the US 52 corridor, the following provides details on the proposed typical sections and segments of the corridor that are best suited as well as other considerations that may be applicable.
Mixed-traffic – The BRT is shown to operate with vehicular traffic for several segments that are either operating at an acceptable of service or where the corridor is constrained and would not allow for additional/dedicated transit lanes. The operation of a BRT will rely on signal priority and/or preemption, to either extend the green signal phase for an approaching bus or provide enough advanced detection to preempt the signal, allowing the bus to proceed without delay. At locations where buses must transition from dedicated to mixed traffic, a queue jump phase would be provided to facilitate the bus movement between the median and the right side of the roadway.
46 Table
7-4 – 2040 Build Levels of Service and Delay
Dedicated Transitway – The BRT operates within dedicated transit lanes within the roadway median. Generally, more suitable along the rural segments where the existing depressed median is 32 feet wide or greater. These segments have wider right-of-way, less dense development, and minimal median breaks. Figures 7-4 and 7-5 below are two typical section concepts integrating median dedicated transitways for a 4 lane or 6 lane section. Considerations include improvements at non-signalized intersections along the route and elimination of some median breaks to maintain transit lane continuity. Additional right-of-way is likely at several signalized intersections in Moncks Corner and through Goose Creek to account for the wider cross section necessary to carry the two dedicated transit lanes along with other required intersection improvements and station platforms.


Outside Dedicated Transitway –The BRT operates on the outside in dedicated lanes. The configuration is bestappliedalongRembertC.DennisBoulevardinMoncksCorner,althoughmixedtrafficisalsoafeasible approach as good levels of service and minimal intersection delay are projected north of the intersection with US 52/Old US 52.
Other transitway options considered, but not currently recommended, included the following:
ReversibleTransitway–Shortdistancesthroughanintersectionand/or withinStationlimitswhereauxiliary turn lanes and adjacent development constraints occur. Reversible operation can also be considered across bridges to maintain existing superstructure and/or reduce new bridge or bridge reconstruction costs. Reliance on Intelligent Traffic Systems (ITS), onboard communications and transit signals may be necessary to delay busses at stations and/or approaching reversible lanes to avoid conflicts.
47
Figure 7-4 - 4 Lane Typical Section
Figure 7-5 - 6 Lane Typical Section
Reversible Peak Hour Transitway & Mixed-Traffic – A Peak Hour dedicated transit way allows bus travel in a single dedicated lane in the median in the peak direction avoiding the vehicular congestion. The bus traveling the non-peak direction will navigate in mixed traffic. For example, in the morning the buses traveling southtowards Charleston will travel thetransit way and the same transit way north in the PM peak hours. The configuration will save on infrastructure costs and is best suited in constrained segments. The concept would require adapted stations and ITS to maintain schedules and safety of the BRT system.
Table 7-5 provides the presumed design approach for varying segments for potential BRT design considerations from South to North along the corridor.
Table 7-5 - BRT Transit Way Considerations
Mixed-traffic Segment
US 52 Otranto Road to Camelot Drive
Considerations
• Acceptable LOS during peak hours
• Will not require reconstruction of Goose Creek Bridge
Lowcountry Rapid Transit (LCRT) Connection
• Transition from the current LCRT designed transitway to mixed-traffic north of Otranto Road.
US 52 Camelot Drive to Button Hall Avenue
• Complex at-grade intersection at US 52 & US 176
• Limited Right-of-way and railroad constraints.
• Significant changes to access management.
• Commercial property and parking impacts
Liberty Hall Station –
• Two outside station platforms
• Located on the far side of the intersection to take advantage of right turn lanes for bus priority.
• Dedicated BRT pull-off lanes.
US 52
Button Hall Road to Goose Creek Community Center
US 52
Goose Creek Community Center to North of Foxbank Plantation Blvd.
• Proposed roadway widening to 6 lanes
• Minimum median width is 32 feet.
• Limited R/W and railroad constraint
Windsor Mill Station –
• One median station located south of the intersection.
• Proposed roadway widening to 6 lanes
• Median width is greater than 32 feet
• Limited R/W and railroad constraint (south segment)
• Construct two median bridges over unnamed tributaries of Back River
Montague Plantation Station -
• One median station located north of intersection
Old Highway 52 Station (S) -
• One median station located north of intersection
Cypress Gardens Road Station –
• One median Station located south of intersection
48
Dedicated One-way Transitways within Median Segment Considerations
US 52 North of Foxbank Plantation Blvd. to Old US 52 (Moncks Corner)
• Maintain 4 lane section, except through Gaillard Road where 6 lanes are proposed.
• Median width is greater than 32 feet
• Wider Right-of-way
• Consider reversible transitway over the CSX railroad bridge to reduce infrastructure costs.
Oakley Road Station –
• One median station located north of the intersection.
Gaillard Road Station –
• One median station located north of the intersection
Mountain Pine Station –
• One median station located north of the intersection.
Old Highway 52 Station (N) –
• One median station located south of the intersection.
Mixed Traffic Segment Considerations
Rembert C. Dennis Boulevard
US 52/Old US 52 to US 52/US 17A
7.5 Access Management
• Maintain 2 lane section
• Acceptable LOS during peak hours to run in mixed traffic
Santee Cooper Station –
• Terminal Station and Turnaround at/near Santee Cooper Park and Ride facility or a proposed transit oriented development (TOD).
For the urban segments, change of access is expected along the corridor related to intersection improvements, adding through lanes along the corridor, consolidating driveways to increase separation distances, and restricting left turn maneuvers to improve efficiency. These changes provide a safer corridor and meet the SCDOT Access and Roadside Management Standards (ARMS Manual) for reconstruction projects. A closed median within Goose Creek is preferred and will require accommodations for U-turn movements and negotiations with adjacent property owners through the right-of-way acquisition process. Similar to the recent modifications to US 176 in Goose Creek, the existing two way left turn lane (TWTL) median could be removed along US 52 through Moncks Corner, to reduce left turn movements and associated angle and left turn crashes.
The divided highway segment with a depressed median north of Button Hall Avenue to Old US-52 in Moncks Corner will require fewer access management changes. The exception is the potential to close median breaks for the two-lane transitway and to address driveway spacing requirements associated with other proposed intersection improvements. Any new construction will need to meet or require an exception to the ARMS Manual, which recommends a minimum spacing of 400 feet between full operational drives or intersections with an AADT greater than 2000 (ARMS: Figure 3-7) or 150 feet for a right-in/right-out driveway (ARMS: Figure 3-9). Also, the approximate 10-mile segment between the two Old US 52
49
intersections is a controlled access facility in accordance with construction documents (SCDOT File No. 8.431) dated June 11, 1969. The arterial designation provides no legal right to access except for those pointsidentifiedintheplans, which weregenerallyexisting drivewaysandintersectionsat thetimeor rightof-way acquisition. Any changes to this designation are handled through the SCDOT process for new Application for Encroachment Permit, thereby requiring SCDOT review and approval of any land use changes, adjacent property subdivisions, and/or redevelopment along the corridor.
7.6 Right-of-Way Impacts
As documented in the Existing Conditions Report, the right-way width varies along the corridor with the narrower segments through the City of Goose Creek and adjacent to the 160’ CSX right-of-way. Impacts and new right-of-way needs were evaluated based on recommended design year intersection capacity improvements, implementation of a dedicated transitway, and new bike and pedestrian facilities. The following provides examples of anticipated right-way requirements.
US-52: Otranto Road to US-78 Interchange
Widening and related impacts to right-of-way are associated with the LCRT project and are provided in the LCRT 30% plan documents.
US-52: US 78 Interchange to Camelot Drive
No projected improvements are anticipated. Transit is proposed to operate in mixed traffic and the bike accommodations are currently addressed by a shared use path on the westside of the roadway.
US-52: Camelot Drive to Thomason Boulevard/Liberty Hall Road
ExistingSCDOTright-of-wayisconstrainedbytheadjacentCSXrailright-of-way,isapproximately137.5feet wide, narrowing to 115’ in the vicinity of the US 176 intersection. This segment of the corridor is expected to experience the most significant change to include the reconfiguration of the US 176/Red Bank Road intersection. The roadway is proposed as a curb and gutter section with enclosed drainage and a design exception for narrower inside lanes to keep right of way acquisition to a minimum. It is assumed that due to the rail right-of-way on the east side, the proposed widening between Evatt Drive and Thomason Boulevard/Liberty Hall Road will shift west, impacting commercial development on that side with 10-15’ of new right-of-way and the need for permissions to tie side slopes and reconstruct driveways and parking lots. Providing connectivity of a shared use path will require an additional 10-20’ of new right-of-way. Additional right of way will also need to be acquired to construct the proposed Superstreet connections at the north end, connecting US 52 with US 176, and at the south end, connecting US 52 with Red Bank Road
US-52: Thomason Boulevard/Liberty Hall Road to ½-mile north of Pine Grove Road
North of Liberty Hall Road, the offset to the west is similarly anticipated. Even after widening US 52 from a four-lane to a 6-lane roadway, right-of-way needs on the west side are expected to be less except for auxiliary right turn lane development at major intersections and the transit station locations. Again, a proposed shared use path will require additional right-of-way. It should be noted that it is not possible to avoiding impacting CSX right-of-way and will require careful evaluation and early coordination with the railroad to determine the most cost-effective approach. A NEPA environmental process is recommended to follow federal guidelines and minimize impacts while meeting the purpose and need of the project.
50
US-52: ½-mile north of Pine Grove Road to Old US-52/Rembert C. Dennis Boulevard
The corridor north of where the roadway curves west of the CSX rail line, from approximately ½-mile north of Pine Grove Road to the intersection with Old US-52 in Moncks Corner, the right-of-way width varies from 210’ to 285’ and can accommodate widening to a six-lane section, a shared use path, and a median transitway. The typical section may vary along the segment to a minimize the footprint, however. Options may include segments of enclosed drainage to avoid outside open ditch sections while balancing costs for stormwater infrastructure and new right-of-way needs.
Rembert C. Dennis Boulevard: Old US-52 to US-52/US17A
The existing two-lane roadway segment is within a 90’-100’ right-of-way. Incorporation of dedicated transit lanes on the outside or in the center as a dedicated median alignment, will likely require additional right-of-way alongthe segment. Any widening toaddlanes, transit or otherwise,will likely require araised median, bike lanes and sidewalks, per SCDOT guidelines. The projected traffic level of service will allow for mixed traffic, however. At the intersection with US 52/Old US 52, the development of auxiliary turn lanes and transitway transition into the median will require new right-of-way and associated impacts to the adjacent properties, parking spaces, driveways and circulation through the parking lot.
7.7 Priorities
Several intersections are currently over capacity, operating at levels of service of E or F during one or both peak hours. These include the three intersections shown in Table 7-6
Table 7-6 – Intersections Operating at LOS E or F under Existing Conditions
In the 2040 No Build Condition, these three are shown to continue operating at levels of service of E or F during one or both peak hours, while eight additional intersections are added to that list as shown in Table 7-7
51
Intersection Name 2020 Existing AM PM LOS Delay LOS Delay US 52 & Cypress Gardens Rd D 50.4 E 60.2 US 52 & Liberty Hall Rd/Thomason Blvd C 33.7 E 75.1 US 52 & US 176/Red Bank Rd E 61.8 F 87.2
Developer funded improvements expected at US 52 and Gaillard Road and at US 52 and Cypress Gardens Road should provide some relief in the near term, but additional measures will be required to accommodate year 2040 volumes. Similarly, the improvements proposed at US 52 and Montague Plantation Road as part of the Henry Brown Blvd. project will address anticipated congestion, but additional through lanes on US 52 are required to address the year 2040 demand. Improvements to US 52 at Otranto Road, proposed as part of the Lowcountry Rapid Transit project will provide some relief during the AM peak hour, but PM peak hour will continue to operate at a level of service of F. The remaining intersections are not currently programmed for improvements, so they will continue to degrade without some added capacity.
Priorities should include:
1. Improvements to US 52 and US 176/Red Bank Road
2. Improvements to US 52 and Liberty Hall Road
3. Widening of US 52 from four to six lanes from north of Button Hall Road to north of Foxbank PlantationRoad,which includestheintersectionsof US52 at Central Avenue and US 52 at Cypress Gardens Road
4. Widening of US 52 from four to six lanes through the intersection of Gaillard Road
5. Improvements to US 52 at Reid Hill Road/Rembert C. Dennis Blvd.
Other near and mid-term considerations should include the following:
• Account for the future widening of US 52, including the right-of way requirements for high capacity transit as much as possible in the design and construction of Developer improvements.
• Account for the future widening of US 52, including the right-of way requirements for high capacity transit as much as possible in the design and construction of other improvements, such as the Henry Brown Blvd. project and the proposed traffic signal at US 52 and Foxbank Plantation Road.
• Monitor conditions at US 52 and the Mount Holly Commerce Park to determine if and when a traffic signal may be warranted as the Commerce Park develops.
• Conditions at US 52 and E. Main Street/Main Street Ext. and at US 52 and Heatly/Altman St are impacted by conditions and improvements upstream. While the AM peak hour conditions worsen, delays during the PM peakhour are cut in half. No changes are proposed at thesetwo intersections.

52
Table 7-7
– Intersections Operating at LOS E or F under Future No-Build Conditions
• Other intersection improvements between Button Hall Road and Cypress Gardens Road should be addressed as part of widening US 52 from four to six lanes.
53
