BANKARSTVO


ISSN 2466-5495 l COBISS.SR-ID 109903884 1/2023
Udruženje banaka Srbije
Bankarstvo www.casopisbankarstvo.rs.
reviewers for the purpose of et hical conduct of all part icipants in t he process of Bankarstvo Journal publicat ion can be found at t he Journal’s webpage www.casopisbankarstvo.rs.
Bankarstvo
Polit ical Sciences, wit hin the Ministry of Educat ion, Science and Technological Development, Bankarstvo Journal
All papers undergo double blind peer review.
Bankarstvo je registrovan u bazama / Bankarstvo Journal is registered in t he following databases
SCIndeks
http://scindeks.ceon.rs/journaldetails.aspx?issn=1451-4354
EBSCO
http://www.ebscohost.com/corporate-research/business-source-corporate-plus
DOAJ
https://doaj.org/toc/2466-5495
CEEOL
https://www.ceeol.com/search/journal-detail?id=2494
EconBiz
https://www.econbiz.de/Record/bankarstvo/10010373502 - online
https://www.econbiz.de/Record/bankarstvo/10001863330 - print
ERIH PLUS
https://dbh.nsd.uib.no/publiseringskanaler/erihplus/periodical/info?id=496397
ISSN 2466-5495 (Online)
2
«»
«»
*** ***
Godina izdanja / Year of Publishing 52
Redovni brojevi časopisa, na srpskom i engleskom jeziku, izlaze četiri puta godišnje - tromesečno / Regular issues of the journal, in Serbian and in English, are published four times per year - quarterly
Izdavač / Publisher
Udruženje banaka Srbije p.u. / Association of Serbian Banks b.a.
11000 Beograd, Bulevar kralja Aleksandra 86 bankarstvo@ubs-asb.com www.ubs-asb.com
Glavni i odgovorni urednik / Editor-in-Chief
Marina Papadakis
Redakcioni odbor / Editorial Board
Prof. dr Radovan Kovačević, Ekonomski fakultet Beograd / Faculty of Economics Belgrade
Prof. dr Miloš Božović, Ekonomski fakultet Beograd / Faculty of Economics Belgrade
Prof. dr Dušan Marković, Ekonomski fakultet Beograd / Faculty of Economics Belgrade
Prof. dr Aleksandar Živković, Ekonomski fakultet Beograd / Faculty of Economics Belgrade
Prof. dr Velimir Lukić, Ekonomski fakultet Beograd / Faculty of Economics Belgrade
Prof. dr Vladimir Vučković, Fiskalni savet Republike Srbije / Fiscal Council of the Republic of Serbia
Prof. dr Nebojša Savić, FEFA - Fakultet za Ekonomiju, Finansije i Administraciju / FEFA - Faculty of Economics, Finance and Administration
Prof. dr Goran Pitić, FEFA - Fakultet za Ekonomiju, Finansije i Administraciju / FEFA - Faculty of Economics, Finance and Administration
Prof. dr Snežana Knežević, vanredni profesor, Fakultet organizacionih nauka, Beograd / Associate Professor, Faculty of Organizational Sciences, Belgrade
Prof. dr Vesna Bogojević Arsić, redovni profesor, Fakultet organizacionih nauka, Beograd/ Tenured Professor, Faculty of Organizational Sciences, Belgrade
Prof. dr Tijana Obradović, vanredni profesor, Fakultet organizacionih nauka, Beograd/ Associate Professor, Faculty of Organizational Sciences, Belgrade
Prof. dr Vesna Aleksić, Institut ekonomskih nauka Beograd / Institute of Economic Sciences Belgrade
Dr Jelena Minović, Institut ekonomskih nauka Beograd / Institute of Economic Sciences Belgrade
Prof. dr Miloš Živković, Pravni fakultet Beograd / Faculty of Law Belgrade
Dr Aleksandra Mitrović, Fakultet za hotelijerstvo i turizam, Vrnjačka Banja / Faculty of Hotel Management and Tourism, Vrnjačka Banja
Prof. dr Mlađan Mrđan, EBS Business School, Wiesbaden
Prof. dr Marko Malović, Fakultet poslovne ekonomije, Univerzitet Educons Sremska Kamenica / Faculty of Business, Educons University S. Kamenica
Dr Milko Štimac, Konsultant za finansijska tržišta / Financial markets consultant
Dr Nataša Kožul, Samostalni ekspert i konsultant za investiciono Bankarstvo / Independent expert and investment banking consultant
Dr Miloš Janković, Ekspert za bankarsku i finansijsku regulaciju / Banking and financial regulation expert
Dr Miloš Vujnović, Finansijski konsultant / Financial consultant
Siniša Krneta, Beogradska berza / Belgrade Stock Exchange
Gordana Dostanić, AMS osiguranje / AMS Insurance
Dr Slađana Sredojević, Udruženje banaka Srbije / Association of Serbian Banks
Dr Milan Brković, Udruženje banaka Srbije / Association of Serbian Banks
Prof. dr Milena Ilić, Visoka škola strukovnih studija za informacione tehnologije ITS - Beograd / High School of Vocational Studies for Information Technology ITS - Belgrade
Dr Vesna Matić, Udruženje banaka Srbije, u penziji / Association of Serbian Banks, retired Svetlana Pantelić, Udruženje banaka Srbije, u penziji / Association of Serbian Banks, retired Dr Boško Mekinjić, Komercijalna banka a.d. Banja Luka, BiH
Prof. dr Džafer Alibegović, Ekonomski fakultet Sarajevo, BiH / Faculty of Economics Sarajevo, B&H
Prof. dr Slobodan Lakić, Ekonomski fakultet Podgorica, Crna Gora / Faculty of Economics Podgorica, Montenegro
Prof. dr Žarko Lazarević, Inštitut za novejšo zgodovino Ljubljana, Slovenija / Institute of Contemporary History Ljubljana, Slovenia
Dr Boštjan Ferk, Inštitut za javno-zasebno partnerstvo, Ljubljana, Slovenija / Institute for Public-Private Partnership, Ljubljana, Slovenia
Prof. dr János Száz, Institute for Training and Consulting in Banking, Budapest, Hungary
Andrei Radulescu, Banca Transilvania, Bucharest, Romania
Prof. Roger Claessens, R.J. Claessens & Partners, Luxembourg
Prof. dr Nikolay Nenovsky, CRIISEA, Université de Picardie Jules Verne, Amiens, France
Aaron Presnall, PhD, Jefferson Institute, Washington, USA
Prof. Kovács Levente, Faculty of Economics, University of Miskolc, Secretary General, Hungarian Banking Association
Redakcija/Editorial Office
Marina Kostadinović - Urednik 011 30 20 777
Sonja Grbić - Prevodilac i lektor za engleski jezik / Translator and English Proofreader
Vesna Milkova - Sekretar 011 30 20 541
Svi članci podležu dvema recenzijama / All articles are reviewed by two independent reviewers
3 Bankarstvo
1/2023
SADRŽAJ
Uvodnik
Prof. Radojko Lukić, redovni profesor u penziji Merenje i analiza dinamike profitabilnosti bankarskog sektora u Srbiji na bazi FLMAW-MARCOS metoda
DOI: 10.5937/bankarstvo2301028L
Ljiljana Kontić, vanredni profesor, i Jovan Kontić, magistar ekonomskih nauka Strategijski aspekti održivog razvoja i digitalne transformacije: Istraživanje u internacionalnoj banci
DOI: 10.5937/bankarstvo2301061K
Prof. dr Almir Alihodžić, redovni profesor Trošak kapitala – efekti na vrednost i profitabilnost preduzeća: Evidencija odabrane skupine preduzeća na Sarajevskoj i Banjalučkoj berzi
DOI: 10.5937/bankarstvo2301092A
4
Bankarstvo 2023
8 6 48 74
TABLE OF CONTENTS
Editorial
Prof. Radojko Lukić, PhD, Retired Tenured Professor
Measurement and Analysis of Profitability Dynamics of the Banking Sector in Serbia Based on the FLMAW-MARCOS Method
DOI: 10.5937/bankarstvo2301028L
Ljiljana Kontić, associate professor, and Jovan Kontić, Master of Economics Strategic Aspects of Sustainability and Digital Transformation: A Study in an International Bank
DOI: 10.5937/bankarstvo2301061K
Prof. Almir Alihodžić, PhD, Tenured Professor
Cost of Capital – The Effect to the Firm Value and Profitability of Companies: Evidence of a Selected Group of Companies on the Sarajevo and Banja Luka Stock Exchanges
DOI: 10.5937/bankarstvo2301092A
5
Banking 2023 28 61 92 7
BANKARSKI SEKTOR POTVRĐUJE USPEŠNO POSLOVANJE
Marina Papadakis
Generalni sekretar Udruženja banaka Srbije
Trend koji je prisutan godinama unazad, a koji se i danas potvrđuje jeste da bankarski sektor u Srbiji uspešno rešava različite izazove koji su se pred njim pojavili u prethodnom periodu.
Jedan od pomenutih izazova je svakako i potreba definisanja nove strategije u kadrovskoj politici bankarskog sektora. Pitanje kadrovske osposobljenosti banaka da uspešno odgovore aktuelnim izazovima je jedno od osetljivijih pitanja na koje banke pokušavaju da pronađu adekvatne odgovore –ne samo na našem tržištu, već i na globalnom nivou. Jedan od radova u ovom broju Bankarstva ukazuje na to da je nužno efikasno upravljati ljudskim resursima, jer od toga direktno zavisi i profitabilnost banaka. U drugom radu takođe vidimo podatak da raste fluktuacija zaposlenih, odnosno da je ona bila posebno visoka u 2021. godini.

Još ranije je na mnogim skupovima, poput Kopaonik Biznis Foruma, ukazivano na nove trendove u zapošljavanju i zadržavanju zaposlenih. U tome je posebna osetljivost banaka, koje su sve više digitalizovane. Kao takve one imaju potrebu za većim brojem IT i sličnih profesija, ulazeći direktno u najdelikatniji deo tržišta radne snage.
Ipak, kvalitet bankarskog sektora potvrđuje i istraživanje prof. Radojka Lukića koji je analizirao profitabilnost banaka. Podaci pokazuju da je poslovanje sektora u poslednjim godinama bilo vrlo uspešno, sem 2020. godine koju je u potpunosti obeležila pandemija kovida. To potvrđuje da su banke dobro upravljale aktivom i kapitalom, kao i da su uspešno prodavale svoje proizvode. Naravno, to govori i da je ukupna ekonomska klima bila povoljna za poslovanje, za šta zasluge idu nosiocima monetarne i fiskalne politike. Profesor Lukić sa razlogom podseća da je u cilju poboljšanja profitabilnosti nužno što efikasnije upravljati ljudskim resursima, troškovima, ostalim elementima bankarskog poslovanja i istovremeno se prilagođavati promenama ekonomske klime.
Deo ovog broja Bankarstva je i druga važna tema - digitalna transformacija banaka. Ona je predstavljena kroz istraživanje u jednoj internacionalnoj banci, koje su realizovali Ljiljana i Jovan Kontić. Rad nam ukazuje na to da je digitalizacija ubrzana različitim kriznim momentima, kakva je svakako bila pandemija kovida. Takođe nas podseća da bankarski sektor može da posreduje između ekonomskog razvoja i zaštite životne sredine, kroz promociju ekološki održivih i društveno odgovornih investicija. Zeleno bankarstvo postaje sve značajniji pojam za sve koji rade u finansijskom sektoru.
Na kraju možemo pročitati i kako trošak kapitala deluje na vrednost i profitabilnost preduzeća.
Sve ove aktuelne teme ukazuju nam u kom se pravcu kreće moderno bankarstvo. Trendovi kao što su digitalizacija i zeleno bankarstvo sve su više zastupljeni ne samo u svetu, već i na tržištu Srbije. Takođe, obrađene teme nas podsećaju na usku povezanost bankarstva sa svim aspektima života društvene zajednice. Sa jedne strane to je ekonomski rast izražen kroz privredne pokazatelje, a sa druge tu je i stanovništvo, čiji kvalitet života i standard takođe tesno zavisi od pozicije i kvaliteta bankarskog sektora.
6 Bankarstvo 2023
Uvodnik
THE BANKING SECTOR CONFIRMS SUCCESSFUL OPERATIONS
Marina Papadakis Secretary General
The banking sector in Serbia has been successfully solving the various challenges that it has been faced with in the previous period, which is a trend that has not changed in years.
One of these challenges is certainly the need to define a new strategy in the employment policies of the banking sector. The matter of whether the banks are equipped, in terms of staff, to successfully rise to the current challenges is one of the more elusive questions to which the banks are attempting to find adequate answers – not only on our market, but globally. One of the articles in this issue of Bankarstvo indicates that it is necessary to efficiently manage human resources, because the profitability of banks directly depends on it. Another paper shows that the employee turnover is increasing, i.e., that it was particularly high in 2021.
It has been pointed out many times, at different events, such as the Kopaonik Business Forum, that new trends are immerging in hiring and employee retention. This is a particular vulnerability of banks, which are becoming increasingly digitalised. As such, they need more IT and similar professions, entering directly into the most delicate part of the labour market.
Nevertheless, the quality of the banking sector is confirmed by the research of Prof. Radojko Lukić, who analysed the profitability of banks. The data show that the sector’s operations have been very successful in recent years, except for 2020, which was marked by the Covid pandemic. This confirms that the banks managed their assets and capital well, and that they successfully sold their products. Of course, this also indicates that the overall economic climate was favourable for business, for which we can thank the holders of monetary and fiscal policy. Professor Lukić rightly reminds the readership that in order to improve profitability, it is necessary to manage human resources, costs, and other elements of banking business as efficiently as possible, while also adapting to changes in the economic climate.
This issue of Bankarstvo also covers another important topic, the digital transformation of banks. It was presented through research in an international bank, which was undertaken by Ljiljana and Jovan Kontić. The work shows us that digitalisation was accelerated by different moments of crisis, such as the Covid pandemic. It also reminds us that the banking sector can mediate between economic development and environmental protection, through the promotion of ecologically sustainable and socially responsible investments. Green banking is becoming an increasingly important term for everyone working in the financial sector.
Finally, we can read how the cost of capital affects the value and profitability of a company.
All these current topics indicate the direction in which modern banking is heading. Trends such as digitalisation and green banking are increasingly present, not only globally, but also in the Serbian market. They also remind us of the close connection of banking with all aspects of life in a social community. On the one hand, economic growth is quantified through economic indicators, on the other hand, the population is also affected, as the quality of life and standard also closely depend on the position and quality of the banking sector.
7 Banking 2023
Editorial
Originalni naučni rad
Datum prijema: 22.02.2023. god.
Datum prihvatanja: 26.02.2023. god.
MERENJE I ANALIZA DINAMIKE
PROFITABILNOSTI BANKARSKOG
SEKTORA U SRBIJI NA BAZI
FLMAW-MARCOS METODA
Prof. dr Radojko Lukić redovni profesor u penziji Ekonomskog fakulteta Univerziteta u Beogradu radojko.lukic@ekof.bg.ac.rs
Rezime: Istraživanje dinamike profitabilnosti bankarskog sektora je kontinuirano aktuelno, značajno i složeno. Imajući to u vidu, u ovom radu se vrši merenje i analiza dinamike profitabilnosti bankarskog sektora u Srbiji sa primenom FLMAW-MARCOS metoda. Dobijeni empirijski rezultati primenom date metodologije pokazuju da su pet najboljih godina ostvarene profitabilnosti u bankarskom sektoru u Srbiji u periodu 2008 – 2022. god. po redosledu: 2018, 2017, 2008, 2019. i 2022. god. U 2013. god. ostvarena je najlošija profitabilnost. U poslednje vreme poboljšala se profitabilnost bankarskog sektora u Srbiji. Na to su uticali ekonomska klima, upravljanje ljudskim resursima, aktivom, kapitalom, prodajom bankarskog proizvoda, troškovima i profitom. U tome značajnu ulogu ima i digitalizacija celokupnog poslovanja. Značajan je uticaj i pandemije korona virusa Covid-19, kao i svetske energetske krize. U cilju poboljšanja profitabilnosti bankarskog sektora u Srbiji neophodno je što efikasnije upravljati ljudskim resursima, aktivom, kapitalom, prodajom, troškovima i profitom i prilagođavati se promenama ekonomske klime.
Ključne reči: bankarski sektor, FLMAW-MARCOS metoda, profitabilnost, Srbija
JEL klasifikacija: D40, G21
8 Bankarstvo 2023
DOI: 10.5937/bankarstvo2301028L
Uvod
Problematika merenja i analize faktora dinamike profitabilnosti bankarskog sektora vrlo je aktuelna, značajna i složena. U ovom radu se, s obzirom na to, kao predmet istraživanja, analizira dinamika profitabilnosti bankarskog sektora u Srbiji na bazi FLMAW-MARCOS metoda. Cilj i svrha toga je da se što bolje sagleda dinamika profitabilnosti bankarskog sektora u Srbiji u cilju unapređenja u budućnosti primenom adekvatnih mera.
Literatura posvećena razvoju i značaju primene DEA modela vrlo je bogata (Andersen, 1993; Banker, 1984; Chen, 2021; Chang, 2020; Guo, 2020; Lee, 2011; Lin, 2020; Pendharkar, 2021; Tone, 2002; Podinovski, 2021; Rostamzadeh, 2021; Fenyves, 2020; Tsai, 2021). Oni se vrlo uspešno primenjuju i u analizi efikasnosti banaka i osiguravajućih kompanija (Savić, 2012; Maletić, 2013; Radojičić, 2018; Cvetkoska, 2017, 2020, 2021; Lukić, 2017; 2018a,b, 2021). Isto tako, prilikom analize finansijskih performansi (profitabilnost, likvidnost) i efikasnosti banaka sve više se primenjuju, integralno ili pojedinačno, i različiti metodi višekriterijumskog odlučivanja (Ünlü, 2022; Ali,2022, Lukić, 2022a,b; Demir, 2022). Sva relevantna literatura u ovom radu se koristi kao teorijsko-metodološka i empirijska osnova za analizu dinamike profitabilnosti bankarskog sektora u Srbiji pomoću FLMAW-MARCOS metoda.
Poznato je da samo kontinuirano praćenje finansijskih performansi (profitabilnost, likvidnost) i efikasnosti bankarskog sektora u Srbiji omogućuje unapređenje u budućnosti primenom adekvatnih mera. U tome se manifestuje osnovna istraživačka hipoteza u ovom radu.
U metodološkom smislu te reči, značajnu ulogu u tome ima primena FLMAW-MARCOS metoda. U radu se u izvesnoj meri koristi i statistička analiza.
Potrebni empirijski podaci za istraživanje tretiranog problema u ovom radu su prikupljeni od Narodne banke Srbije, koji su usklađeni sa relevantnim međunarodnim standardima, tako da u pogledu komparacije ne postoje nikakva ograničenja.
Metodologija
Logaritamska metodologija aditivnih težina koristi se za utvrđivanje težinskih koeficijenata i rangiranje alternativa. Fuzzy logaritamska metodologija aditivnih težina (Fuzzy Logarithm Methodology of Additive Weights – FLMAW) je zasnovana na primeni trouglastih fuzzy brojeva (Božanić et al., 2022; Pamučar, 2021; Puška, 2022). FLMAW metoda odvija se kroz šest koraka (Božanić et al., 2022).
9
Prof. dr Radojko Lukić
Merenje i analiza dinamike profitabilnosti bankarskog sektora u Srbiji na bazi FLMAW-MARCOS metoda
Korak 1. Formiranje inicijalne (ekspertske) matrice odlučivanja
U ovom koraku svaki ekspet (e) iz grupe k eksperata (1≤ e ≤ k ) definiše jednu matricu odlučivanja evaluacijom m alternativa A={A_1,A_2,…,A_ u odnosu na n kriterijum C={C_1,C_2,…,C_n }. Dakle, za svakog eksperta dobijena matrica gde _ij predstavlja fuzzy vrednost baziranu na ekspertskoj e vrednosti i-te alternative u odnosu na j-ti kriterijum. Evaluacija je bazirana na kvantitativnim indikatorima ili fuzzy lingvističkih deskriptora u zavisnosti od vrste kriterijuma.


Korak 2. Formiranje inicijalne (agregatne) matrice odlučivanja
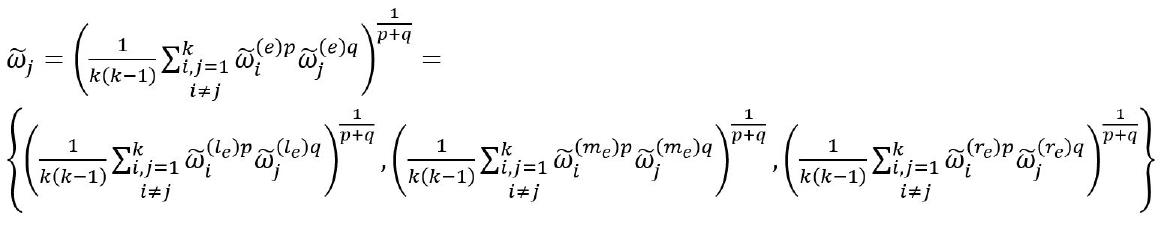
Agregacija početnih (ekspertskih) matrica u jednu agregiranu matricu se vrši primenom Bonferroni agregatora na sledeći način:
gde dpredstavlja agregiranu vrednost dobijenu primenom Bonferroni agregatora; p,q ≥0 stabilizacione parametre Bonferroni agregatora, e - e-tog eksperta 1≤e≤k , l – leva distribucija fuzzy broja, r – desna distribucija fuzzy broja, i m – vrednost pri kojoj je funkcija pripadnosti fuzzy broju jednaka jedan. Pre agregacije vrši se kvantifikacija lingvističkih kriterijuma.
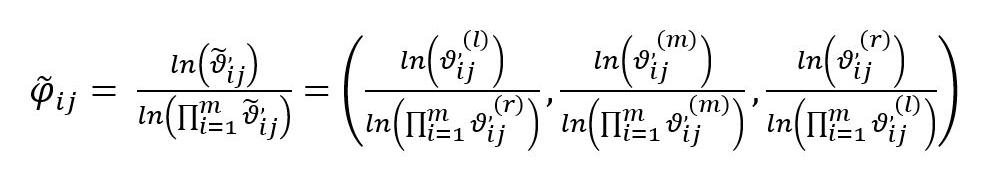
Korak 3. Normalizacija elemenata inicijalne matrice
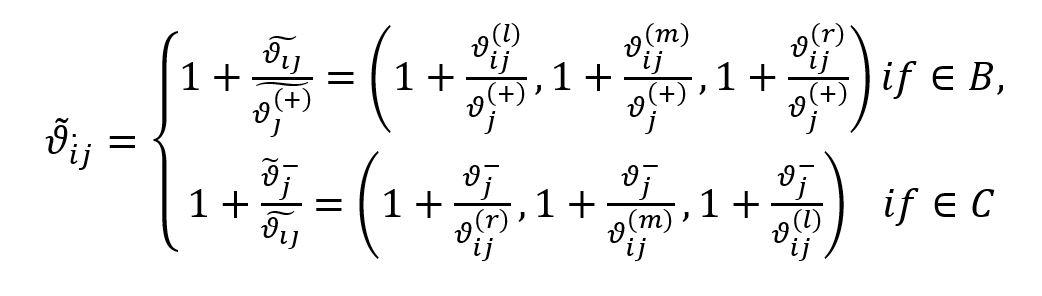
Normalizovana matrica dobija se na sledeći način:
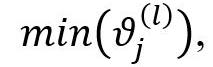
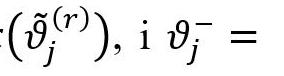
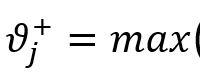
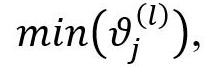
gde ϑ predstavlja normalizovanu vrednost inicijalne matrice odlučivanja, pri čemu je _j^((r) ) ), i ϑ_j^-=mi l - levu distribuciju fuzzy broja, r - desnu distribuciju fuzzy broja, i m - vrednost pri kojoj je funkcija pripadnosti fuzzy broja jednaka jedan.
10
Bankarstvo 2023 (1) (2)
Prof. dr Radojko Lukić
Korak 4. Determinisanje težinskih koeficijenata kriterijuma
U cilju određivanja težinskih koeficijenata kriterijumima treba da budu angažovani određeni eksperti
Korak 4.1 Određivanje prioriteta kriterijuma
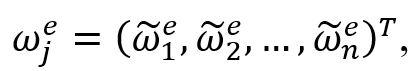
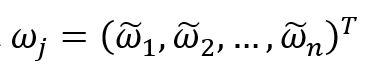
Na osnovu vrednosti unapred definisanoj fuzzy lingvističkoj skali eksperti određuju prioritete kriterijumima C={C1,C2,…,Cn} Pri tom se kriterijumu visokog značaja pripisuje veća vrednost iz fuzzy lingvističke skale, i obrnuto. Na ovaj način definisani su vektori prioriteta P ^e=( _C1^e , posebno za svakog ekspeta, gde _Cn predstavlja vrednost iz fuzzy lingvističke skale koju ekspert e (1≤e≤k) označi za kriterijum n.
Korak 4.2 Definisanje apsolutne fuzzy anti-idealne tačke
Ovu vrednost definiše donosilac odluke, i predstavlja fuzzy broj koji je manji od najmanje vrednosti iz skupa svih vektora prioriteta.
Korak 4.3 Definisanje fuzzy relacionog vektora
Relacija između elemenata vektora proriteta i apsolutne anti-idealne tačke ( AIP) se determiniše primenom sledeće jednačine:
Primenom ove jednačine, relacioni vektor eksperta e(1≤e≤k) dobijen je:


Korak 4.4 Determinisanje težinskih koeficijenata vektora posebno za svakog eksperta
Fuzzy vrednost težinskih koeficijenat kriterijuma za e (1≤e≤k) dobija se primenom sledeće jednačine:
(3) (4)
11
Merenje i analiza dinamike profitabilnosti bankarskog sektora u Srbiji na bazi FLMAW-MARCOS metoda
Prof. dr Radojko Lukić
gde n _ predstavlja element relacionog vektora R^e , n_C levu distribuciju fuzzy vektora prioriteta, n_C desnu distribuciju fuzzy vektora prioriteta, i n_Cn^( vrednost pri kojoj je funkcija pripadnosti fuzzy vektora prioriteta jednaka jedan.


Korak 4.5 Izračunavanje težinskih koeficijenata agregiranih fuzzy vektora
Težinski koeficijenti agregiranih fuzzy vektora određuju se primenom Boneferroni agregatora (Yager, 2009) na sledeći način:
gde p,q≥0 predstavlja stabilizacione parametre Bonoferroni agregatora, težinske koeficijente dobijene na bazi procene e-tog eksperta 1 ≤ e ≤ k , levu distribuciju fuzzy težinskih koeficijenata _j^e, desnu distribuciju fuzzy težinskih koeficijenata, _j^e, pravu vrednost pri kojoj je funkcija fuzzy težinskog koeficijenta jednaka jedan.
Korak 4.6 Izračunavanje konačnih vrednosti težinskih koeficijenata
Izračunavanje finalne vrednosti težinskih koeficijenata kriterijuma vrši se defuzifikacijom na sledeći način:
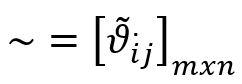
Korak 5. Izračunavanje težinske matrice (N)
Elementi težinske matrice dobijeni su na sledeći način:
12 Bankarstvo 2023
Prof. dr Radojko Lukić
gde je (5) (6) (7) (8)
pri čemu , predstavlja elemente normalizovane matrice ~= [ϑ_ij ]_mx težinske elemente kriterijuma, l – levu distribuciju fauzzy broja, r – desnu distribuciju fuzzy broja, i m - vrednost pri kojoj je funkcija pripadnosti fuzzy broja jednaka jedan.


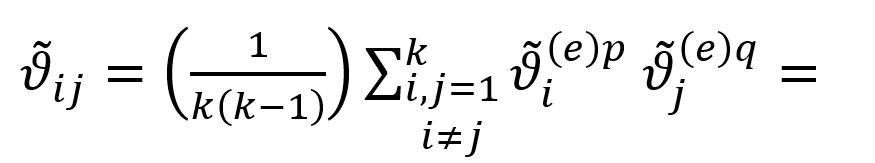
Korak 6. Izračunavanje finalnog indeksa rangiranosti alternativa (Q_i )
Finalni rang alternativa se definiše na bazi vrednosti Q , pri čemu je bolje rangirana alternativa sa većom vrednošću Q . Vrednost Q dobijena je sa defuzikacijom vrednosti Q , pomoću jednačine(6). Vrednost Q izračunava se primenom sledeće jednačine:
gde predstavlja elemente težinske matrice N _ij ]_ , l - levu distribuciju fuzzy broja, r - desnu distribuciju fuzzy broja, i m vrednost pri kojoj je vrednost pripadnosti fuzzy broju jednaka jedan.
MARCOS (measurement alternatives and ranking according to compromise solution) metoda je bazirana na definisanju odnosa između alternativa i referentnih vrednosti (idealna i anti-idealna alternativa). Na osnovu definisanih odnosa, funkcije korisnosti alternativa se određuju i vrši se kompromisno rangiranje u odnosu na idealne i anti-idealne solucije. Preferencije odlučivanja se definišu na osnovu funkcije korisnosti. Funkcije korisnosti predstavljaju poziciju alternative u odnosu na idealne i anti-idealne solucije. Najbolja alternativa je ona koja je najbliža idealnoj i istovremeno najdalja anti-idealnoj referentnoj tački. MARCOS metoda se procesno odvija kroz sledeće korake (Stević, 2020a, b):
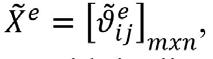
Korak 1: Formiranje inicijalne matrice za donošenje odluka
Multi-kriterijumski model uključuje definisanje skupa n kriterijuma i m alternativa. U slučaju grupnog odlučivanja, formira se skup r eksperta koji procenjuju alternative u odnosu na kriterijume. U tom slučaju, matrice ekspertske evaluacije su agregirane u inicijalne matrice grupnog odlučivanja.
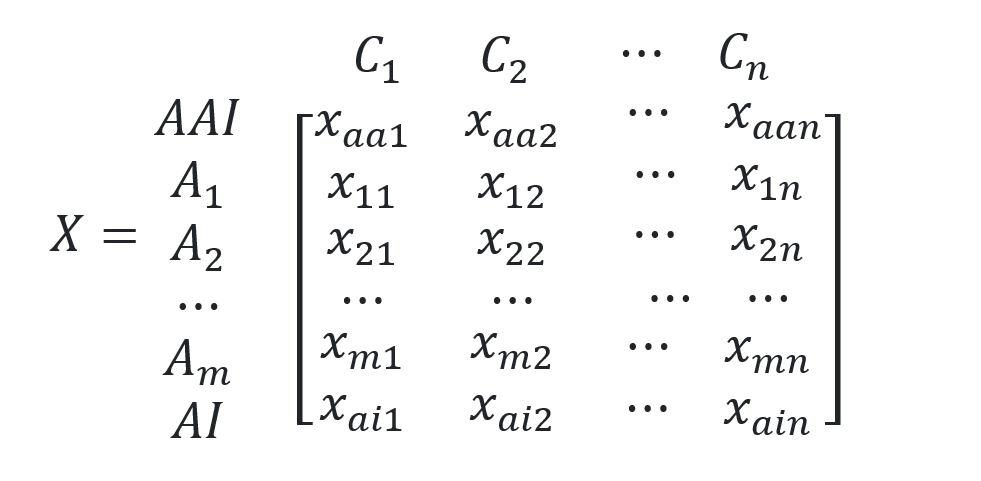
Korak 2: Formiranje proširene inicijalne matrice
U ovom koraku, proširenja inicijalna matrica je definisana sa idealnim (AI) i anti-idealnim (AAI) solucijama.
(9) (10)
13
Merenje i analiza dinamike profitabilnosti bankarskog sektora u Srbiji na bazi FLMAW-MARCOS metoda
Prof. dr Radojko Lukić
Anti-idealna solucija (AAI) je najgora alternativa. Idealna solucija (AI) je, suprotno tome, alternativa sa najboljim karakteristikama. U zavisnosti od prirode kriterijuma, AAI i AI se definišu primenom sledećih jednačina:
gde B predstavlja benefitnu, a C troškovnu grupu kriterijuma.
Korak 3: Normalizacija proširene inicijalne matrice (X)
Elementi normalizovane matrice N= _mx su dobijeni primenom sledećih jednačina:
gde elementi xij i xai predstavljaju elemente matrice X
Korak 4: Definisanje težinske matrice V=[v_ij ]_mxn


Težinska matrica V se dobija množenjem normalizovane matrice N sa težinskim koeficijentima kriterijuma wj primenom sledeće jednačine:
Korak 5: Utvrđivanje stepena korisnosti alternativa
Stepen korisnosti alternativa u odnosu na anti-idealne i idealne solucije se utvrđuje sa primenom sledećih jednačina:
gde Si (i=1,2,..,m) predstavlja sumu elemenata težinske matrice V, prikazano u sledećoj jednačini:
14 Bankarstvo 2023
Prof. dr Radojko Lukić
(11) (13) (14) (15) (16) (18) (12)
Korak 6: Utvrđivanje funkcije korisnosti alternativa f(Ki)
Funkcija korisnosti je kompromis posmatrane alternative u odnosu na idealne i anti-idealne solucije. Funkcija korisnosti alternativa se definiše sa sledećom jednačinom:
gde f(K_i^- reprezentuje funkciju korisnosti u odnosu na anti-idealnu soluciju a (K_i^ reprezentuje funkciju korisnosti u odnosu na idealnu soluciju.

Funkcije korisnosti u odnosu na idealne i anti-idealne solucije se utvrđuju sa primenom sledećih jednačina:
Korak 7: Rangiranje alternativa
Rangiranje alternativa bazirano je na konačnoj vrednosti funkcije korisnosti. Poželjna je ona alternativa koja ima najveću moguću vrednost funkcije korisnosti.
1. Rezultati i diskusija
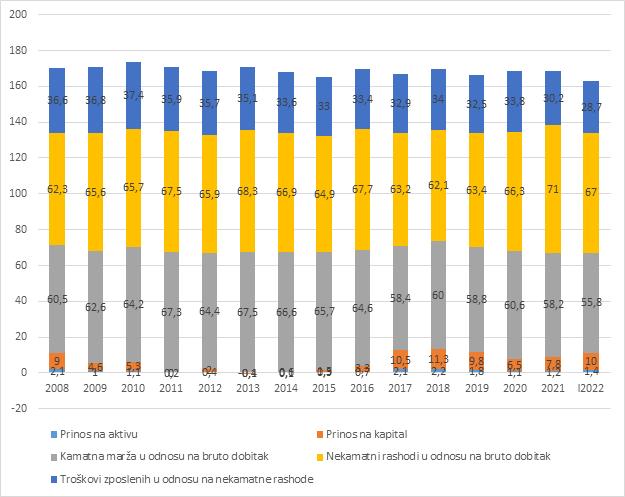
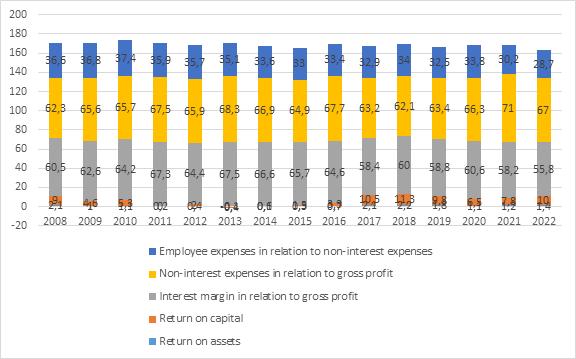
Izabrani kriterijumi za analizu dinamike efikasnosti bankarskog sektora u Srbiji su: C1 - prinos na aktivu, C2 - prinos na kapital, C3 - kamatna marža u odnosu na bruto dobitak, C4 - nekamatni rashodi u odnosu na bruto dobitak i C5 -troškovi zaposlenih u odnosu na nekamatne rashode. Alternative su posmatrane u periodu 2008 – 2022. godine. U Tabeli 1 su prikazani inicijalni podaci.
15
Merenje i analiza dinamike profitabilnosti bankarskog sektora u Srbiji na bazi FLMAW-MARCOS metoda
Prof. dr Radojko Lukić
(19) (20) (21) Prinos na aktivu Prinos na kapital Kamatna marža u odnosu na bruto dobitak Nekamatni rashodi u odnosu na bruto dobitak Troškovi zaposlenih u odnosu na nekamatne rashode C1 C2 C3 C4 C5 A1 2008 2,1 9,0 60,5 62,3 36,6 A2 2009 1,0 4,6 62,6 65,6 36,8 A3 2010 1,1 5,3 64,2 65,7 37,4
Tabela 1 - Inicijalni podaci – pokazatelji profitabilnosti bankarskog sektora u Srbiji
16 A4 2011 0,0 0,2 67,3 67,5 35,9 A5 2012 0,4 2,0 64,4 65,9 35,7 A6 2013 -0,1 -0,4 67,5 68,3 35,1 A7 2014 0,1 0,6 66,6 66,9 33,6 A8 2015 0,3 1,5 65,7 64,9 33,0 A9 2016 0,7 3,3 64,6 67,7 33,4 A10 2017 2,1 10,5 58,4 63,2 32,9 A11 2018 2,2 11,3 60,0 62,1 34,0 A12 2019 1,8 9,8 58,8 63,4 32,5 A13 2020 1,1 6,5 60,6 66,3 33,8 A14 2021 1,2 7,8 58,2 71,0 30,2 A15 2022 1,4 10,0 55,8 67,0 28,7 Statistika Mean 1,0267 5,4667 62,3467 65,8533 33,9733 Std. Error of Mean ,20318 1,06179 ,95966 ,62479 ,62263 Median 1,1000 5,3000 62,6000 65,9000 33,8000 Std. Deviation ,78692 4,11229 3,71673 2,41982 2,41142 Skewness ,108 -,023 -,133 ,188 -,654 Std. Error of Skewness ,580 ,580 ,580 ,580 ,580 Kurtosis -1,238 -1,582 -1,235 ,089 ,315 Std. Error of Kurtosis 1,121 1,121 1,121 1,121 1,121 Minimum -,10 -,40 55,80 62,10 28,70 Maximum 2,20 11,30 67,50 71,00 37,40 Ranks NPar Tests Friedman Test Bankarstvo 2023 Mean Rank Prinos na aktivu 1,07 Prinos na kapital 1,93 Kamatna marža u odnosu na bruto 4,7 dobitak Nekamatni rashodi u odnosu na bruto 4,93 dobitak Troškovi zaposlenih u odnosu na 3,00 nekamatne rashode Test Statistic a
Prof. dr Radojko Lukić
Asymp.
a.
Napomena: Podatak za 2022. god. dat je za prvi kvartal. Autorova izračunata statistika
Izvor: Narodna banaka Srbije
Slika 1 - Indikatori profitabilnosti bankarskog sektora u Srbiji
Izvor: Autorova slika
Između posmatranih statističkih varijabli postoji značajna razlika, tako da se odbacuje nulta hipoteza. U Tabeli 2 je prikazana korelaciona matrica inicijalnih podataka.
Tabela 2 - Korelacija
Korelacija
17 N 15 Chi-Square 58,507 df 4
Sig.
,000
Friedman Test
1 2 3 4 5 Pearson Correlation 1 ,968** -,834** -,637* -,188 Sig. (2-tailed) ,000 ,000 ,011 ,503 N 15 15 15 15 15
1. Prinos na aktivu
Merenje i analiza dinamike profitabilnosti bankarskog sektora u Srbiji na bazi FLMAW-MARCOS metoda
Prof. dr Radojko Lukić
** Korelacija je značajna na nivou 0,01 (2-tailed)
* Korelacija je značajna na nivou 0,05 (2-tailed)
Napomena: Autorovo izračunavanje
Korelaciona matrica pokazuje da postoji jaka korelaciona veza između kamatne marže u odnosu na bruto dobitak i prinosa na aktivu, prinosa na kapital i troškova zaposlenih u odnosu na nekamatne rashode u bankarskom sektoru Srbije na nivo statističke značajnosti. Između kamatne marže u odnosu na bruto dobitak i nekamatnih rashoda u odnosu na bruto dobitak je, međutim, slaba korelaciona veza. Između nekamatnih rashoda u odnosu na bruto dobitak i prinosa na aktivu je značajna korelaciona veza na nivou statističke značajnosti. Između nekamatnih rashoda u odnosu na bruto dobitak i prinosa na kapital, kamatne marže u odnosu na bruto dobitak i troškova zaposlenih u odnosu na nekamatne rashode je, nasuprot tome, slaba korelaciona veza. Između troškova zaposlenih u odnosu na nekamatne rashode i prinosa na aktivu, prinosa na kapital i nekamatnih rashoda u odnosu na bruto dobitak slaba je korelaciona veza. Dakle, u cilju poboljšanja profitabilnosti bankarskog sektora u Srbiji neophodno je što efikasnije upravljati prvenstveno sa troškovnim elementima.
Težinski koeficijenti kriterijuma su utvrđeni korišćenjem FLMAW metode. U Tabeli 3, za te svrhe, prikazana je fuzzy skala prioritizacije kriterijuma.
Fuzzy skala prioritizacije kriterijuma
18 Bankarstvo 2023 Pearson Correlation ,968** 1 -,932** -,495 -,390 Pearson Correlation -,834** -,932** 1 ,245 ,596* Pearson Correlation -,637* -,495 ,245 1 -,297 Pearson Correlation -,188 -,390 ,596* -,297 1 Sig. (2-tailed) ,000 ,000 ,379 ,019 Sig. (2-tailed) ,011 ,060 ,379 ,282 Sig. (2-tailed) ,503 ,151 ,019 ,282 Sig. (2-tailed) ,000 ,000 ,060 ,151 N 15 15 15 15 15 N 15 15 15 15 15 N 15 15 15 15 15 N 15 15 15 15 15
odnosu
bruto dobitak
rashodi
odnosu
bruto dobitak
zaposlenih u odnosu
nekamatne rashode
2. Prinos na kapital 3. Kamatna marža u
na
4. Nekamatni
u
na
5. Troškovi
na
Table 3 - Fuzzy skala prioritizacije kriterijuma
Prof. dr Radojko Lukić
Fuzzy Linguistic Descriptor Abbreviation Fuzzy Number Absolutely Low AL 1 1 1 Very Low VL 1 1,5 2 Low L 1,5 2 2,5 Medium Low ML 2 2,5 3 Equal E 2,5 3 3,5
su težinski koeficijenti vektora.
19 Merenje i analiza dinamike profitabilnosti bankarskog sektora u Srbiji na bazi FLMAW-MARCOS metoda
Radojko
Medium High MH 3 3,5 4 High H 3,5 4 4,5 Very High VH 4 4,5 5 Absolutely High AH 4,5 5 5 VRSTA 1 1 1 -1 -1 C1 C2 C3 C4 C5 P1 AH L VL E VL P2 AH ML AL H AL P3 AH ML AL MH VL P4 AH E AL VH AL P5 AH E AL VH AL C1 C2 C3 C4 C5 P1 9 10 10 3 4 5 2 3 4 5 6 7 2 3 4 P2 9 10 10 4 5 6 2 2 2 7 8 9 2 2 2 P3 9 10 10 4 5 6 2 2 2 6 7 8 2 3 4 P4 9 10 10 5 6 7 2 2 2 8 9 10 2 2 2 P5 9 10 10 5 6 7 2 2 2 8 9 10 2 2 2 YAIP 0.5 0.5 0.5
Napomena: Autorovo izračunavanje Napomena: Autorovo izračunavanje U Tabeli 5 prikazani
Prof. dr
Lukić
Tabela 4 pokazuje ekspertsku evaluaciju kriterijuma Tabela 4 - Evaluacija kriterijuma
Težinski koeficijenti vektora C1 C2 C3 C4 C5 W1j 0,255 0,300 0,366 0,127 0,181 0,256 0,080 0,143 0,220 0,186 0,233 0,309 0,080 0,143 0,220 W2j 0,286 0,312 0,333 0,181 0,218 0,259 0,090 0,094 0,100 0,253 0,282 0,318 0,090 0,094 0,100 W3j 0,266 0,301 0,341 0,168 0,210 0,265 0,084 0,091 0,103 0,217 0,254 0,308 0,084 0,144 0,205 W4j 0,277 0,300 0,317 0,203 0,233 0,268 0,087 0,090 0,095 0,262 0,286 0,317 0,087 0,090 0,095 W5j 0,277 0,300 0,317 0,203 0,233 0,268 0,087 0,090 0,095 0,262 0,286 0,317 0,087 0,090 0,095
Tabela 5 - Težinski koeficijenti vektora
Tabela 6 pokazuje agregirani fuzzy vektor, agregirani fuzzy težinski koeficijenti vektora i finalnu vrednost težinskih koeficijenata.
Tabela 6 - Agregirani fuzzy vektor, agregirani fuzzy težinski koeficijenti vektora i finalna vrednost težinskih koeficijenata
Agregirani fuzzy težinski koeficijenti
Finalna vrednost težinskih koeficijenata
Napomena: Autorovo izračunavanje
U Tabeli 7 je prikazana inicijalna matrica.
Tabela 7 - Inicijalna matrica
20 W1j 0,014 0,018 0,024 0,005 0,008 0,014 0,001 0,003 0,004 0,009 0,013 0,019 0,001 0,003 0,005 W2j 0,015 0,019 0,022 0,006 0,009 0,014 0,002 0,002 0,003 0,012 0,015 0,0200,002 0,002 0,003 W3j 0,015 0,018 0,023 0,006 0,009 0,014 0,001 0,002 0,003 0,010 0,014 0,019 0,001 0,003 0,005 W4j 0,015 0,018 0,021 0,007 0,010 0,014 0,001 0,002 0,002 0,012 0,015 0,020 0,001 0,002 0,003 W5j 0,015 0,018 0,021 0,007 0,010 0,014 0,001 0,002 0,002 0,012 0,015 0,020 0,001 0,002 0,003 SUM 0,074 0,092 0,112 0,031 0,046 0,069 0,007 0,010 0,014 0,056 0,072 0,098 0,007 0,012 0,020 0,272 0,303 0,334 0,176 0,215 0,263 0,086 0,101 0,120 0,236 0,268 0,314 0,086 0,112 0,140 0,303 0,216 0,102 0,270 0,112 Inicijalna matrica težina kriterijuma 0,303 0,216 0,102 0,27 0,112 vrsta kriterijuma 1 1 1 -1 -1 C1 C2 C3 C4 C5 A1 2,1 9 60,5 62,3 36,6 A2 1 4,6 62,6 65,6 36,8 A3 1,1 5,3 64,2 65,7 37,4 A4 0 0,2 67,3 67,5 35,9 A5 0,4 2 64,4 65,9 35,7 A6 -0,1 -0,4 67,5 68,3 35,1 A7 0,1 0,6 66,6 66,9 33,6 A8 0,3 1,5 65,7 64,9 33 A9 0,7 3,3 64,6 67,7 33,4 Bankarstvo 2023
Agregirani fuzzy vector C1 C2 C3 C4 C5
Prof. dr Radojko Lukić
Napomena: Autorovo izračunavanje
21 A10 2,1 10,5 58,4 63,2 32,9 A11 2,2 11,3 60 62,1 34 A12 1,8 9,8 58,8 63,4 32,5 A13 1,1 6,5 60,6 66,3 33,8 A14 1,2 7,8 58,2 71 30,2 A15 1,4 10 55,8 67 28,7 MAX 2,2 11,3 67,5 71 37,4 MIN -0,1 -0,4 55,8 62,1 28,7 Proširena inicijalna matrica težina kriterijuma 0,303 0,216 0,102 0,27 0,112 vrsta kriterijuma 1 1 1 -1 -1 C1 C2 C3 C4 C5 AAI -0,1 -0,4 55,8 71 37,4 A1 2,1 9 60,5 62,3 36,6 A2 1 4,6 62,6 65,6 36,8 A3 1,1 5,3 64,2 65,7 37,4 A4 0 0,2 67,3 67,5 35,9 A5 0,4 2 64,4 65,9 35,7 A6 -0,1 -0,4 67,5 68,3 35,1 A7 0,1 0,6 66,6 66,9 33,6 A8 0,3 1,5 65,7 64,9 33 A9 0,7 3,3 64,6 67,7 33,4 A10 2,1 10,5 58,4 63,2 32,9 A11 2,2 11,3 60 62,1 34 A12 1,8 9,8 58,8 63,4 32,5 A13 1,1 6,5 60,6 66,3 33,8 A14 1,2 7,8 58,2 71 30,2 A15 1,4 10 55,8 67 28,7 AI 2,2 11,3 67,5 62,1 28,7
Napomena: Autorovo izračunavanje Tabela 8 pokazuje proširenu inicijalnu matricu.
Merenje i analiza dinamike profitabilnosti bankarskog sektora u Srbiji na bazi FLMAW-MARCOS metoda Prof. dr Radojko Lukić
Tabela 8 - Proširena inicijalna matrica
U Tabeli 9 je prikazana normalizovana matrica.
Napomena: Autorovo izračunavanje
22
normalizovana matrica Bankarstvo 2023
Težinski
Tabela 9 - Normalizovana matrica
težinski normalizovanu matricu Tabela 10 - Težinski normalizovana matrica Normalizovana matrica težina kriterijuma 0,303 0,216 0,102 0,27 0,112 vrsta kriterijuma 1 1 1 -1 -1 C1 C2 C3 C4 C5 AAI -0,04545 -0,0354 0,826667 0,874648 0,76738 A1 0,9545 0,7965 0,8963 0,9968 0,7842 A2 0,4545 0,4071 0,9274 0,9466 0,7799 A3 0,5000 0,4690 0,9511 0,9452 0,7674 A4 0,0000 0,0177 0,9970 0,9200 0,7994 A5 0,1818 0,1770 0,9541 0,9423 0,8039 A6 0,0000 0,0000 1,0000 0,9092 0,8177 A7 0,0455 0,0531 0,9867 0,9283 0,8542 A8 0,1364 0,1327 0,9733 0,9569 0,8697 A9 0,3182 0,2920 0,9570 0,9173 0,8593 A10 0,9545 0,9292 0,8652 0,9826 0,8723 A11 1,0000 1,0000 0,8889 1,0000 0,8441 A12 0,8182 0,8673 0,8711 0,9795 0,8831 A13 0,5000 0,5752 0,8978 0,9367 0,8491 A14 0,5455 0,6903 0,8622 0,8746 0,9503 A15 0,6364 0,8850 0,8267 0,9269 1,0000 AI 1 1 1 1 1 C1 C2 C3 C4 C5 AAI 0 0 0,08432 0,236155 0,085947 A1 0,2892 0,1720 0,0914 0,2691 0,0878
Tabela 10 pokazuje
Prof. dr Radojko Lukić
Napomena: Autorovo izračunavanje
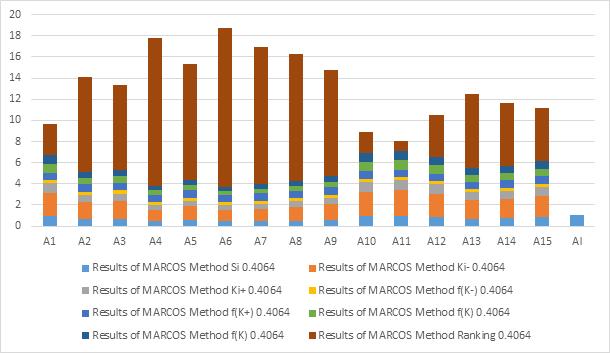
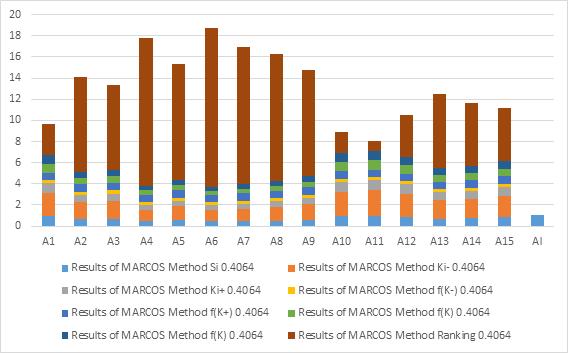
U Tabeli 11 i na Slici 2 su prikazani rezultati MARCOS metode
23
Tabela 11 - Rezultati MARCOS metode A2 0,1377 0,0879 0,0946 0,2556 0,0873 A3 0,1515 0,1013 0,0970 0,2552 0,0859 A4 0,0000 0,0038 0,1017 0,2484 0,0895 A5 0,0551 0,0382 0,0973 0,2544 0,0900 A6 0,0000 0,0000 0,1020 0,2455 0,0916 A7 0,0138 0,0115 0,1006 0,2506 0,0957 A8 0,0413 0,0287 0,0993 0,2584 0,0974 A9 0,0964 0,0631 0,0976 0,2477 0,0962 A10 0,2892 0,2007 0,0882 0,2653 0,0977 A11 0,3030 0,2160 0,0907 0,2700 0,0945 A12 0,2479 0,1873 0,0889 0,2645 0,0989 A13 0,1515 0,1242 0,0916 0,2529 0,0951 A14 0,1653 0,1491 0,0879 0,2362 0,1064 A15 0,1928 0,1912 0,0843 0,2503 0,1120 AI 0,303 0,216 0,102 0,27 0,112 Rezultati MARCOS metode Si AAI 0,4064 Ki- Ki+ f(K-) f(K+) f(K) Ranking 2008 A1 0,9096 2,2382 0,9069 0,2884 0,7116 0,8120 0,8120 3 2009 A2 0,6632 1,6318 0,6612 0,2884 0,7116 0,5920 0,5920 9 2010 A3 0,6910 1,7001 0,6889 0,2884 0,7116 0,6168 0,6168 8 2011 A4 0,4435 1,0911 0,4421 0,2884 0,7116 0,3959 0,3959 14 2012 A5 0,5351 1,3166 0,5335 0,2884 0,7116 0,4777 0,4777 11 2013 A6 0,4391 1,0803 0,4378 0,2884 0,7116 0,3920 0,3920 15 2014 A7 0,4722 1,1618 0,4708 0,2884 0,7116 0,4215 0,4215 13 2015 A8 0,5250 1,2918 0,5235 0,2884 0,7116 0,4687 0,4687 12 2016 A9 0,6010 1,4788 0,5992 0,2884 0,7116 0,5365 0,5365 10 2017 A10 0,9412 2,3158 0,9384 0,2884 0,7116 0,8402 0,8402 2 2018 A11 0,9742 2,3970 0,9713 0,2884 0,7116 0,8697 0,8697 1
Merenje i analiza dinamike profitabilnosti bankarskog sektora u Srbiji na bazi FLMAW-MARCOS metoda
Prof. dr Radojko Lukić
Napomena: Autorovo izračunavanje
Slika 2 - Rangiranje alternativa
Izvor: Autorova slika
Prema tome, pet najboljih godina ostvarene profitabilnosti u bankarskom sektoru u Srbiji u periodu 2008 – 2022. god. po redosledu su: 2018, 2017, 2008, 2019. i 2022. godina. Najlošija profitabilnost je ostvarena u 2013. god. Primetno je da se u poslednje vreme poboljšala profitabilnost bankarskog sektora u Srbiji. Na profitabilnost bankarskog sektora u Srbiji uticali su ekonomska klima, upravljanje ljudskim resursima, aktivom, kapitalom, prodajom bankarskog proizvoda, troškovima i profitom, digitalizacija celokupnog poslovanja, pandemije korona virusa Covid-19 i svetska energetska kriza.
U cilju poboljšanja profitabilnosti bankarskog sektora u Srbiji neophodno je što efikasnije upravljati ljudskim resursima, aktivom, kapitalom, prodajom, troškovima i profitom. Isto tako se blagovremeno prilagođavati promenama ekonomske klime.
Preporuka je da se prilikom analize dinamike profitabilnosti bankarskog sektora u Srbiji istovremeno komparativno koriste nekoliko metoda višekriterijumskog odlučivanja. Na taj način se dobija potpunija slika o dinamici profitabilnosti bankarskog sektora u Srbiji.
24 Bankarstvo 2023 2019 A12 0,8875 2,1836 0,8848 0,2884 0,7116 0,7922 0,7922 4 2012 A13 0,7153 1,7600 0,7132 0,2884 0,7116 0,6386 0,6386 7 2021 A14 0,7449 1,8328 0,7427 0,2884 0,7116 0,6650 0,6650 6 2022 A15 0,8305 2,0435 0,8281 0,2884 0,7116 0,7414 0,7414 5 AI 1,0030
Prof. dr Radojko Lukić
Zaključak
Na osnovu dobijenih empirijskih rezultata primenom date metodologije može se zaključiti sledeće:
1. Pet najboljih godina ostvarene profitabilnosti u bankarskom sektoru u Srbiji u periodu 2008 – 2022. god. po redosledu su: 2018, 2017, 2008, 2019. i 2022. god. Najlošija profitabilnost je zabeležena u 2013. godini. U poslednje vreme poboljšala se profitabilnost bankarskog sektora u Srbiji.
2. Faktori profitabilnosti bankarskog sektora u Srbiji su ekonomska klima, upravljanje ljudskim resursima, aktivom, kapitalom, prodajom bankarskog proizvoda, troškovima i profitom. Značajnu ulogu u tome ima i digitalizacija celokupnog poslovanja. Nije zanemarljiv i uticaj pandemije korona virusa Covid-19, ako i svetske energetske krize. Njihovom adekvatnom kontrolom može se znatno uticati na ostvarenje ciljne profitabilnosti bankarskog sektora u Srbiji.
U cilju poboljšanja profitabilnosti bankarskog sektora u Srbiji neophodno je što efikasnije upravljati ljudskim resursima, aktivom, kapitalom, prodajom, troškovima i profitom. Uz to se blagovremeno prilagođavati promenama ekonomske klime i globalnom okruženju.
Literatura
1. Ali, S.M., Hoq, S.M.N., Bari, A.B.M.M., Kabir, G., Paul, S.K. (2022). Evaluating factors contributing to the failure of information system in the banking industry. PLoS ONE, 17(3): e0265674. https://doi. org/10.1371/journal.pone.0265674
2. Andersen, P.; Petersen, N.C. (1993). A procedure for ranking efficient units in data envelopment analysis. Management Science, 39, 1261-1264.
3. Banker, R.D., Charnes, A. and Cooper, W.W. (1984). Some models for estimating technical and scale inefficiencies in data envelopment analysis. Management Science, 30(9), 1078–1092.
4. Božanić, D., Pamučar, D., Milić,A., Marinković, M.and Komazec, N. (2022). Modification of the Logarithm Methodology of Additive Weights (LMAW) by a Triangular Fuzzy Number and Its Application in Multi-Criteria Decision Making. Axioms, 11(3), 89. https://doi.org/10.3390/axioms11030089
5. Chang, X. and Wang, X. (2020). Research Performance Evaluation of University Based on Super DEA Model. 2020 IEEE 9th Joint International Information Technology and Artificial Intelligence Conference (ITAIC), 1252-1255. doi: 10.1109/ITAIC49862.2020.9339131
6. Chen, Chunhua, Liu, Haohua, Tang, Lijun and Ren, Jianwei. (2021). A Range Adjusted Measure of Super-Efficiency in Integer-Valued Data Envelopment Analysis with Undesirable Outputs. Journal of Systems Science and Information, 9( 4), 378-398. https://doi.org/10.21078/JSSI-2021-378-21
7. Cvetkoska, V., and Savić, G. (2017). Efficiency of bank branches: Empirical evidence from a two-phase research approach. Economic Research-Ekonomska istrazivanja, 30(1), 318–333. doi: 10.1080/1331677X.2017.1305775
8. Cvetkoska, V. and Ciković, K.F.(2020). Assessing the relative efficiency of commercial banks in the Republic of North Macedonia: DEA window analysis. Croatian Operational Research Review 217 CRORR 11, 217-227.
25
Merenje i analiza dinamike profitabilnosti bankarskog sektora u Srbiji na bazi FLMAW-MARCOS metoda Prof. dr Radojko Lukić
9. Cvetkoska, V., Fotova Ciković, K. and Tasheva, M. (2021). Efficiency of Commercial Banking in Developing Countries. Mathematic , 9, 1597. https://doi.org/10.3390/math9141597
10. Demir, G. (2022). Analysis of the financial performance of the deposit banking sector inthe Covid-19 period with LMAW-DNMA methods. International Journal of Insurance and Finance, 2(2), 17-36.https://doi.org/10.52898/ijif.2022.7
11. Fenyves, V. and Tarnóczi, T. (2020). Data envelopment analysis for measuring performance in a competitive market. Problems and Perspectives in Management, 18(1), 315-325. doi:10.21511/ ppm.18(1).2020.27
12. Guo, D. and Cai, Z.Q. (2020). Super-Efficiency Infeasibility in the Presence of Nonradial Measurement. Mathematical Problems in Engineering, 2020, Article ID 6264852, 7 pages. https://doi.org/10.1155/2020/6264852
13. Lee, H.S., Chu, C.W. and J. Zhu, J. (2011). Super-efficiency DEA in the presence of infeasibility. European Journal of Operational Research, 212(1), 141–147.
14. Lin, R. (2020). Cross-efficiency evaluation capable of dealing with negative data: A directional distance function based approach. Journal of the Operational Research Society, 71(3), 505-516.
15. Lukić, R., Sokić, M. & Vojteski Kljenak, D. (2017). Efficiency Analysis Of Banking Sector In Republic Of Serbia. Business Excellence and Management, 7(4), 5-17.
16. Lukić, R. (2018a). Bankarsko računovodstvo. Beograd: Ekonomski fakultet.
17. Lukić, R. (2018d). Analysis of the efficiency of insurance companies. In: Insurance in the post-crisis era, Belgrade: Faculty of Economics, University of Belgrade. ISBN:978-86-403-1548-7.
18. Lukić, R. and Hadrović Zekić, B. (2019). Evaluation of efficiency of trade companies in Serbia using the DEA approach. Proceedings of the 19 th International Scientific Conference Business logistics in modern management October 10-11, Osijek, Croatia, Josip Juraj Strossmaye, 145-162.
19. Lukić, R. (2021). Application of the EDAS method in the evaluation of bank efficiency in serbia. Bankarstvo - Banking, 50(2), 13-24. doi: 10.5937/bankarstvo2102064L
20. Maletić, R., Kreća, M., & Maletić, P. (2013). Application of dea methodology in measuring efficiency in the banking sector. Economics of Agriculture, 60(4), 843–855. https://www.ea.bg.ac.rs/index.php/EA/article/view/423
21. Lukić, R. (2022). Evaluation of the efficiency of banks in Serbia using the MABAC method. Bankarstvo - Banking, 2, 35-60. DOI: 10.5937/bankarstvo2202010L
22. Radojko Lukić, (2022b). Analysis of financial performance and efficiency of banks in serbia using fuzzy LMAW and MARCOS methods. Bankarstvo – Banking, 4, 130-169.
23. Milenković, N., Radovanov, B., Kalaš, B. and Horvat, A.M. (2022). External Two Stage DEA Analysis of Bank Efficiency in West Balkan Countries. Sustainability, 14, 978. https:// doi.org/10.3390/su14020978
24. Pamučar, D., Žižović, M., Biswas, S., Božanić, D. (2021). A new logarithm methodology of additive weights (LMAW) for multi-criteria decision-making: Application in logistics. Facta Univ. Ser. Mech. Eng., 2021, 19, 361–380. https://doi.org/10.22190/FUME210214031P
25. Puška, A., Božanić, D., Nedeljković, M., Janošević, M. (2022). Green Supplier Selection in an Uncertain Environment in Agriculture Using a HybridMCDM Model: Z-Numbers–Fuzzy LMAW–Fuzzy CRADIS Model. Axioms, 11, 427. https://doi.org/ 10.3390/axioms1109042
26. Pendharkar, P.C. (2021). Hybrid radial basis function DEA and its applications to regression, segmentation and cluster analysis problems. Machine Learning with Applications, 6, 100092. https://doi.org/10.1016/j.mlwa.2021.100092.
26 Bankarstvo 2023
Prof. dr Radojko Lukić
27. Peykani, P., Seyed Esmaeili, F.S., Mirmozaffari, M., Jabbarzadeh, A. and Khamechian, M. (2022). Input/Output Variables Selection in Data Envelopment Analysis: A Shannon Entropy Approach. Mach. Learn. Knowl. Extr., 4, 688–699. https://doi.org/10.3390/ make4030032
28. Peykani, P., Gheidar-Kheljani, J., Farzipoor Saen, R., & Mohammadi, E. (2022a).Generalized Robust Window Data Envelopment Analysis Approach for DynamicPerformance Measurement under Uncertain Panel Data. Operational Research, 1-36.https://doi.org/10.1007/s12351-022-00729-7.
29. Podinovski, V.V. and Bouzdine-Chameeva, T. (2021). Optimal solutions of multiplier DEA models. J Prod Anal, 56, 45–68. https://doi.org/10.1007/s11123-021-00610-3
30. Radojičić, M., Savić, G., & Jeremić, V. (2018). Measuring the efficiency of banks: the bootstrapped I-distance GAR DEA approach. Technological and Economic Development of Economy, 24(4), 1581-1605. https://doi.org/10.3846/tede.2018.3699
31. Rostamzadeh, R., Akbarian, O., Banaitis, A., & Soltani, Z. (2021). Application of DEA in benchmarking: a systematic literature review from 2003–2020. Technological and Economic Development of Economy, 27(1), 175-222. https://doi.org/10.3846/tede.2021.13406
32. Savić, G., Radosavljević, M., & Ilievski, D. (2012). DEA Window analysis approach for measuring the efficiency of Serbian banks. Management - časopis za teoriju i praksu menadžmenta, 17(65), 5-14.
33. Stević, Ž., Pamučar, D., Puška, A. and Chatterjee, P. (2020a). Sustainable supplier selection in healthcare industries using a new MCDM method: Measurement of alternatives and ranking according to COmpromise solution (MARCOS). Computers & Industrial Engineering, 140, 106231. https://doi.org/10.1016/j.cie.2019.106231.
34. Stević, Ž. and Brković, N. A. (2020b). Novel Integrated FUCOM-MARCOS Model for Evaluation of Human Resources in a Transport Company. Logistics, 4, 4. https://doi.org/10.3390/logistics4010004
35. Tone, K. (2002). A slacks-based measure of super-efficiency in data envelopment analysis. European Journal of Operational Research, 143, 32-41.
36. Tsai, Chi-Mao; Lee, Hsuan-Shih; and Gan, Guo-Ya (2021). A New Fuzzy DEA Model for Solving the MCDM Problems in Supplier Selection. Journal of Marine Science and Technology: 29(1) , Article 7. DOI: 10.51400/2709-6998.1006
37. Ünlü, U., Yalçın, N. and Avşarlıgil, N. (2022). Analysis of Efficiency and Productivity of Commercial Banks in Turkey Pre- and during COVID-19 with an Integrated MCDM Approach. Mathematics, 10(13), 2300. https://doi.org/10.3390/math10132300
27
Merenje i analiza dinamike profitabilnosti bankarskog sektora u Srbiji na bazi FLMAW-MARCOS metoda
Prof. dr Radojko Lukić
MEASUREMENT AND ANALYSIS OF PROFITABILITY DYNAMICS OF THE BANKING SECTOR IN SERBIA BASED ON THE FLMAW-MARCOS METHOD
Prof. Radojko Lukić, PhD Faculty of Economics, University of Belgrade radojko.lukic@ekof.bg.ac.rs
Summary:Research into the profitability dynamics of the banking sector is continuously current, significant, and complex. Bearing that in mind, this paper measures and analyzes the profitability dynamics of the banking sector in Serbia using FLMAW-MARCOS methods. The empirical results obtained by applying the given methodology show that the five best years of achieved profitability in the banking sector in Serbia in the period 2008 - 2022 are in order: 2018, 2017, 2008, 2019 and 2022. The worst profitability was achieved in 2013. Recently, the profitability of the banking sector in Serbia has improved. It was influenced by the economic climate, management of human resources, assets, capital, sales of banking products, costs, and profits. The digitalization of the entire business plays a significant role in this. The impact of the Covid-19 corona virus pandemic, as well as the global energy crisis, is significant. In order to improve the profitability of the banking sector in Serbia, it is necessary to manage human resources, assets, capital, sales, costs and profits as efficiently as possible and adapt to changes in the economic climate.
Keywords: banking sector, FLMAW-MARCOS method, profitability, Serbia
JEL classification: D40, G21
28 Banking 2023
Original scientific paper Received: 22.02.2023. Accepted: 26.02.2023.
10.5937/bankarstvo2301028L
DOI:
Introduction
The issue of measuring and analyzing factors of banking profitability dynamics is very current, significant and complex. In this paper, considering that, as a subject of research, the profitability dynamics of the banking sector in Serbia is analyzed based on the FLMAW-MARCOS method. The aim and purpose of this is to better understand the profitability dynamics of the banking sector in Serbia with the aim of improving it in the future by applying adequate measures.
The literature devoted to the development and importance of the application of the DEA model is very rich (Andersen, 1993; Banker, 1984; Chen, 2021; Chang, 2020; Guo, 2020; Lee, 2011; Lin, 2020; Pendharkar, 2021; Tone, 2002; Podinovski , 2021; Rostamzadeh, 2021; Fenyves, 2020; Tsai, 2021). They are also very successfully applied in the analysis of the efficiency of banks and insurance companies (Savic, 2012; Maletić, 2013; Radojicic, 2018; Cvetkoska, 2017, 2020, 2021; Lukic, 2017; 2018a,b, 2021). Likewise, when analyzing financial performance (profitability, liquidity) and efficiency, banks are increasingly applying, integrally or individually, different methods of multi-criteria decision-making (Ünlü, 2022; Ali, 2022, Lukic, 2022a,b; Demir, 2022). All relevant literature in this work is used as a theoretical-methodological and empirical basis for the analysis of the profitability dynamics of the banking sector in Serbia using the FLMAW-MARCOS method.
It is known that only continuous monitoring of financial performance (profitability, liquidity) and efficiency of the banking sector in Serbia enables improvement in the future by applying adequate measures. This manifests the basic research hypothesis in this paper.
In the methodological sense of the word, the application of FLMAW-MARCOS methods plays a significant role in this. Statistical analysis is also used to some extent in the work.
The necessary empirical data for the research of the problem treated in this paper were collected from the National Bank of Serbia, which are aligned with the relevant international standards, so that there are no limitations in terms of comparison.
Methodology
The logarithmic methodology of additive weights is used to determine weight coefficients and rank alternatives. Fuzzy Logarithm Methodology of Additive Weights (FLMAW) is based on the application of triangular fuzzy numbers (Božanić et al., 2022; Pamučar, 2021; Puška, 2022). The FLMAW method takes place through six steps (Božanić et al., 2022).
29
1
Prof. Radojko Lukić, PhD
Measurement and Analysis of Profitability Dynamics of the Banking Sector in Serbia Based on the FLMAW-MARCOS Method
Step 1. Formation of the initial (expert) decision-making matrix
In this step, each expert ( e ) from the group of k experts (1≤e≤k)defines a decision matrix by evaluating m alternatives A={A_1,A_2,…,A_ in relation to n criteria C={C_1,C_2,…,C_n }. Therefore, for each expert, a matrix was obtained where it represents a fuzzy value based on the expert value of the i - th alternative in relation to the j -th criterion. The evaluation is based on quantitative indicators or fuzzy linguistic descriptors, depending on the type of criteria.
Step 2. Formation of the initial (aggregate) decision-making matrix
Aggregation of the initial (expert) matrices into one aggregated matrix is performed using the Bonferroni aggregator as follows:
where _ represents the aggregated value obtained by applying the Bonferroni aggregator; p,q ≥0 stabilization parameters of the Bonferroni aggregator, e e -th expert 1≤e≤k, l – left distribution of fuzzy number, r – right distribution of fuzzy number, and m – value at which the membership function of the fuzzy number is equal to one. Linguistic criteria are quantified before aggregation.
Step 3. Normalization of elements of the initial matrix
The normalized matrix ~=[ϑ _ij^.]_ is obtained as follows:
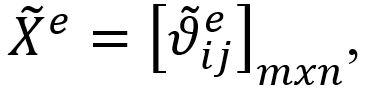
where ϑ represents the normalized value of the initial decision matrix, where ϑ_j^+=ma , i ϑ_j^=min(ϑ_j^((l) ) ), l is the left distribution of the fuzzy number, r is the right distribution of the fuzzy number, and m is the value at which the membership function of the fuzzy number is equal to one.
30 Banking 2023
(1) (2)
Prof. Radojko Lukić, PhD
Step 4. Determining the weighting coefficients of the criteria
In order to determine the weighting coefficients of the criteria, certain experts should be engaged
Step 4.1 Prioritization of criteria
Based on the value of the predefined fuzzy linguistic scale, the experts determine the priorities of the criteria. C={C1,C2,…,Cn} . In that criterion of high importance, a higher value from the fuzzy linguistic scale is assigned, and vice versa. In this way, the priority vectors are defined P _C2^e, , especially for each expert, where it represents the value from the fuzzy linguistic scale that the expert e (1≤e≤k) mark for criterion n
Step 4.2 Defining the absolute fuzzy anti-ideal point ( AIP)
This value is defined by the decision maker, and is a fuzzy number that is smaller than the smallest value from the set of all priority vectors.
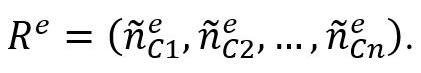
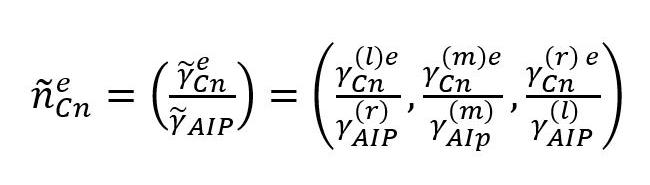
Step 4.3 Defining the fuzzy relational vector R
The relationship between the elements of the priority vector and the absolute anti-ideal point ( is determined by applying the following equation:
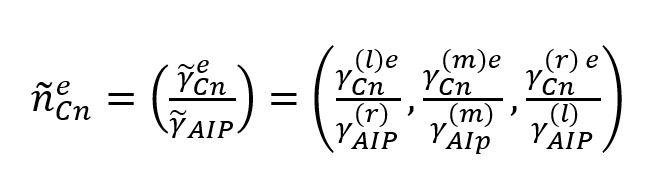
By applying this equation, the expert’s relational vector e(1≤e≤k)is obtained: C1^e,n


Step 4.4 Determining vector weight coefficients especially for each expert
Fuzzy value of weighting coefficients criteria for e (1≤e≤k)is obtained by applying the following equation:
(3) (4)
31
Prof. Radojko Lukić, PhD
Measurement and Analysis of Profitability Dynamics of the Banking Sector in Serbia Based on the FLMAW-MARCOS Method
where n _ erepresents the element of the relational vector the left distribution of the fuzzy priority vector, n_C ethe right distribution of the fuzzy priority vector, and the value at which the membership function of the fuzzy priority vector is equal to one.
Step 4.5 Calculation of weight coefficients of aggregated fuzzy vectors
The weight coefficients of the aggregated fuzzy vectors
Tare determined using the Boneferroni aggregator (Yager, 2009) as follows:
where p,q≥0 it represents the stabilization parameters of the Bonoferroni aggregator, weighting coefficients obtained on the basis of the evaluation of the e -th expert 1≤e≤k, _j^ the left distribution of fuzzy weighting coefficients _j^e, the right distribution of fuzzy weighting coefficients and the right value at which the fuzzy weighting coefficient function is equal to one.
Step 4.6 Calculation of final values of weighting coefficients
The calculation of the final value of the weight coefficients of the criteria is performed by defuzzification as follows:
Step 5. Calculation of the weight matrix ( N )
The elements of the weight matrix were obtained as follows:
32 Banking 2023
gde je (5) (6) (7) (8)
Prof. Radojko Lukić, PhD
where it ϑ , represents the elements of the normalized matrix ~= [ϑ_ij ]_mxn, the weight elements of the criteria, l – the left distribution of the fuzzy number, r – the right distribution of the fuzzy number, and m is the value at which the membership function of the fuzzy number is equal to one.
Step 6. Calculation of the final ranking index of alternatives (Q_i )
The final ranking of the alternatives is defined on the basis of value Q , whereby the alternative with a higher value is ranked better Qi. The value Q was obtained with the defuzzification of the value Q using equation (6). The value Qi is calculated using the following equation:
where represents the elements of the weight matrix , l – the left distribution of the fuzzy number, r – the right distribution of the fuzzy number, im the value at which the value of belonging to the fuzzy number is equal to one.
The MARCOS (measurement alternatives and ranking according to compromise solution) method is based on defining the relationship between alternatives and reference values (ideal and anti-ideal alternatives). Based on the defined relationships, the utility functions of the alternatives are determined, and a compromise ranking is made in relation to ideal and anti-ideal solutions. Decision preferences are defined based on a utility function. Utility functions represent the position of alternatives in relation to ideal and anti-ideal solutions. The best alternative is the one that is closest to the ideal and at the same time furthest from the anti-deal reference point. The MARCOS method proceeds procedurally through the following steps (Stević, 2020a, b):
Step 1: Formation of the initial decision-making matrix
A multi-criteria model involves defining a set of n criteria and m alternatives. In the case of group decision-making, a set of r experts is formed who evaluate the alternatives in relation to the criteria. In that case, the expert evaluation matrices are aggregated into the initial group decision matrices.
Step 2: Forming the expanded initial matrix
In this step, the expansion initial matrix is defined with ideal ( AI ) and anti-ideal ( AAI ) solutions.
33
(9) (10)
Prof. Radojko Lukić, PhD
Measurement and Analysis of Profitability Dynamics of the Banking Sector in Serbia Based on the FLMAW-MARCOS Method
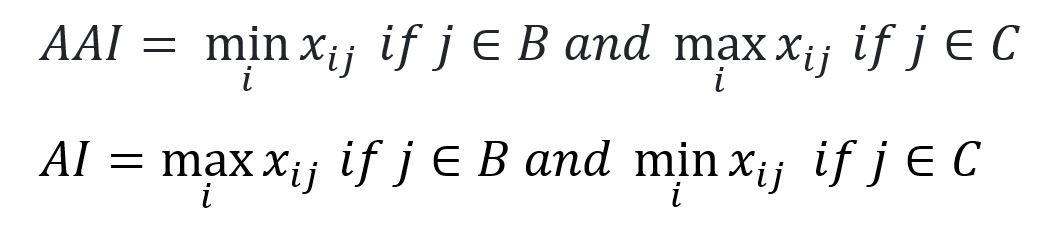
Anti-ideal solution ( AAI ) is the worst alternative. The ideal solution ( AI ) is, on the contrary, the alternative with the best characteristics. Depending on the nature of the criteria, AAI and AI are defined by applying the following equations:
where B represents a benefit and C a cost group of criteria.
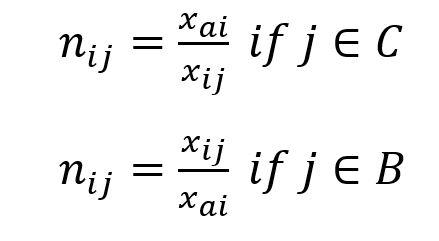
Step 3: Normalization of the expanded initial matrix ( X )
The elements of the normalized matrix are obtained by applying the following equations:
where the elements x ij and x ai represent the elements of the matrix X
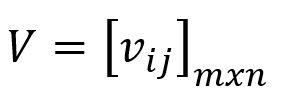
Step 4: Defining the weight matrix V=[v_ij ]_mxn
The weighting matrix V is obtained by multiplying the normalized matrix N with the weighting coefficients of the criterion w using the following equation:
Step 5: Determining the degree of utility of alternatives K and
The degree of usefulness of alternatives in relation to anti-ideal and ideal solutions is determined using the following equations:
where S i ( i=1,2,..,m represents the sum of the elements of the weight matrix V , shown in the following equation:


34 Banking 2023
(11) (13) (14) (15) (16) (18) (12)
Prof. Radojko Lukić, PhD
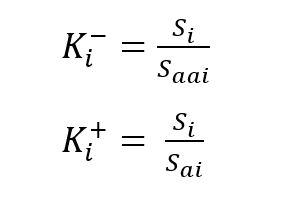
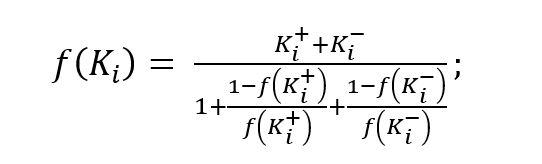
Step 6 : Determining the utility function of alternatives f( K i ).
The utility function is the compromise of the observed alternative in relation to ideal and anti-ideal solutions. The utility function of alternatives is defined by the following equation:
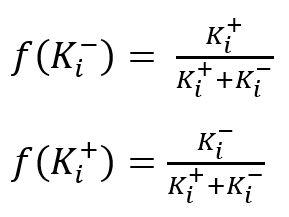
where f(K_i^- represents the utility function in relation to the anti-ideal solution and f(K_i^+ represents the utility function in relation to the ideal solution.

Utility functions in relation to ideal and anti-ideal solutions are determined using the following equations:
Step 7: Ranking of alternatives.
The ranking of alternatives is based on the final value of the utility function. The alternative that has the highest possible value of the utility function is preferred.
Results and Discussion
The selected criteria for analyzing the dynamics of the efficiency of the banking sector in Serbia are: C1 - return on assets, C2 - return on capital, C3 - interest margin in relation to gross profit, C4 - non-interest expenses in relation to gross profit and C5 - employee expenses in relation on non-interest expenses. The alternatives were observed in the period 2008 - 2022. Table 1 shows the initial data.
35
(19) (20) (21) Return on assets Return on capital Interest margin in relation to gross profit Non-interest expenses in relation to gross profit Employee expenses in relation to non-interest expenses C1 C2 C3 C4 C5 A1 2008 2.1 9.0 60.5 62.3 36.6 A2 2009 1.0 4.6 62.6 65.6 36.8 A3 2010 1.1 5.3 64.2 65.7 37.4
Table 1 - Initial Data - Profitability Indicators of the Banking Sector in Serbia
Prof. Radojko Lukić, PhD
Measurement and Analysis of Profitability Dynamics of the Banking Sector in Serbia Based on the FLMAW-MARCOS Method
36 A4 2011 0.0 0.2 67.3 67.5 35.9 A5 2012 0.4 2.0 64.4 65.9 35.7 A6 2013 -0.1 -0.4 67.5 68.3 35.1 A7 2014 0.1 0.6 66.6 66.9 33.6 A8 2015 0.3 1.5 65.7 64.9 33.0 A9 2016 0.7 3.3 64.6 67.7 33.4 A10 2017 2.1 10.5 58.4 63.2 32.9 A11 2018 2.2 11.3 60.0 62.1 34.0 A12 2019 1.8 9.8 58.8 63.4 32.5 A13 2020 1.1 6.5 60.6 66.3 33.8 A14 2021 1.2 7.8 58.2 71.0 30.2 A15 2022 1.4 10.0 55.8 67.0 28.7 Statistics Mean 1.0267 5.4667 62.3467 65.8533 33.9733 Std. Error of Mean .20318 1.06179 .95966 .62479 .62263 Median 1.1000 5.3000 62.6000 65.9000 33.8000 Std. Deviation .78692 4.11229 3.71673 2.41982 2.41142 Skewness .108 -.023 -.133 .188 -.654 Std. Error of Skewness .580 .580 .580 .580 .580 Kurtosis -1.238 -1.582 -1.235 .089 .315 Std. Error of Kurtosis 1.121 1.121 1.121 1.121 1.121 Minimum -.10 -.40 55.80 62.10 28.70 Maximum 2.20 11.30 67.50 71.00 37.40 Banking 2023 Ranks NPar Tests Friedman Test Mean Rank Return on assets 1.07 Return on capital 1.93 Interest margin in relation to gross 4.7 profit Non-interest expenses in relation 4.93 to gross profit Employee expenses in relation to 3.00 non-interest expenses Test Statistic a
Prof. Radojko Lukić, PhD
Note: The data for 2022 is given for the first quarter. Author’s calculated statistics
There is a significant difference between the observed statistical variables, so the null hypothesis is rejected.
Table
shows the correlation matrix of the initial data.
37 N 15 Chi-Square 58.507 df 4 Asymp. Sig. .000
a. Friedman Test
Source: National Bank of Serbia
Figure 1 - Indicators of Profitability of the Banking Sector in Serbia Source: Author’s picture
2
Correlations 1 2 3 4 5 Pearson Correlation 1 .968** -.834** -.637* -.188 Sig. (2-tailed) .000 .000 .011 .503 N 15 15 15 15 15
Table 2 - Correlation
1. Return on assets
Prof. Radojko Lukić, PhD
Measurement and Analysis of Profitability Dynamics of the Banking Sector in Serbia Based on the FLMAW-MARCOS Method
**. Correlation is significant at the 0.01 level (2-tailed).
*. Correlation is significant at the 0.05 level (2-tailed).
Note: Author’s calculation
The correlation matrix shows that there is a strong correlation between interest margin in relation to gross profit and return on assets, return on capital and employee costs in relation to non-interest expenses in the banking sector of Serbia at the level of statistical significance. However, there is a weak correlation between the interest margin in relation to gross profit and non-interest expenses in relation to gross profit. Between non-interest expenses in relation to gross profit and return on assets, there is a significant correlation at the level of statistical significance. In contrast, there is a weak correlation between non-interest expenses in relation to gross profit and return on capital, interest margin in relation to gross profit and employee expenses in relation to non-interest expenses. There is a weak correlation between employee expenses in relation to non-interest expenses and return on assets, return on capital and non-interest expenses in relation to gross profit. Therefore, in order to improve the profitability of the banking sector in Serbia, it is necessary to manage primarily the cost elements as efficiently as possible.
The weight coefficients of the criteria were determined using the FLMAW method. In Table 3, for these purposes, the fuzzy scale of criteria prioritization is presented.
Fuzzy scale for criteria prioritization
38 Banking 2023 Pearson Correlation .968** 1 -.932** -.495 -.390 Pearson Correlation -.834** -.932** 1 .245 .596* Pearson Correlation -.637* -.495 .245 1 -.297 Pearson Correlation -.188 -.390 .596* -.297 1 Sig. (2-tailed) .000 .000 .379 .019 Sig. (2-tailed) .011 .060 .379 .282 Sig. (2-tailed) .503 .151 .019 .282 Sig. (2-tailed) .000 .000 .060 .151 N 15 15 15 15 15 N 15 15 15 15 15 N 15 15 15 15 15 N 15 15 15 15 15 2. Return on capital
Interest margin in relation to gross profit
Non-interest expenses in relation to gross profit
Employee expenses in relation to non-interest expenses
3.
4.
5.
Table 3 - Fuzzy Scale for Criteria Prioritization
Fuzzy Linguistic Descriptor Abbreviation Fuzzy Number Absolutely Low AL 1 1 1 Very Low VL 1 1.5 2 Low L 1.5 2 2.5 Medium Low ML 2 2.5 3 Equal E 2.5 3 3.5
Prof. Radojko Lukić, PhD
Measurement and Analysis of Profitability Dynamics of the Banking Sector in Serbia Based on the FLMAW-MARCOS Method
Table 4 shows the expert evaluation of the criteria.
Note: Author’s calculation
Table 5 shows the vector weight coefficients.
Note: Author’s calculation
39 Medium High MH 3 3.5 4 High H 3.5 4 4.5 Very High VH 4 4.5 5 Absolutely High AH 4.5 5 5 KIND 1 1 1 -1 -1 C1 C2 C3 C4 C5 P1 AH L VL E VL P2 AH ML AL H AL P3 AH ML AL MH VL P4 AH E AL VH AL P5 AH E AL VH AL C1 C2 C3 C4 C5 P1 9 10 10 3 4 5 2 3 4 5 6 7 2 3 4 P2 9 10 10 4 5 6 2 2 2 7 8 9 2 2 2 P3 9 10 10 4 5 6 2 2 2 6 7 8 2 3 4 P4 9 10 10 5 6 7 2 2 2 8 9 10 2 2 2 P5 9 10 10 5 6 7 2 2 2 8 9 10 2 2 2 YAIP 0.5 0.5 0.5
Table 4 - Evaluation of Criteria
Weight Coeffici ents Vector C1 C2 C3 C4 C5 W1j 0.255 0.300 0.366 0.127 0.181 0.256 0.080 0.143 0.220 0.186 0.233 0.309 0.080 0.143 0.220 W2j 0.286 0.312 0.333 0.181 0.218 0.259 0.090 0.094 0.100 0.253 0.282 0.318 0.090 0.094 0.100 W3j 0.266 0.301 0.341 0.168 0.210 0.265 0.084 0.091 0.103 0.217 0.254 0.308 0.084 0.144 0.205 W4j 0.277 0.300 0.317 0.203 0.233 0.268 0.087 0.090 0.095 0.262 0.286 0.317 0.087 0.090 0.095 W5j 0.277 0.300 0.317 0.203 0.233 0.268 0.087 0.090 0.095 0.262 0.286 0.317 0.087 0.090 0.095
Table 5 - Weight Coefficients Vector
Prof. Radojko Lukić, PhD
Table 6 shows the aggregated fuzzy vectors, the aggregated fuzzy weight coefficient vectors, and the final values of the weight coefficients.
Table 6 - Aggregated Fuzzy Vectors, Aggregated Fuzzy Weight Coefficient Vectors, and Final Values of the Weight Coefficients
Note: Author’s calculation
40 Banking 2023 W1j 0.014 0.018 0.024 0.005 0.008 0.014 0.001 0.003 0.004 0.009 0.013 0.019 0.001 0.003 0.005 W2j 0.015 0.019 0.022 0.006 0.009 0.014 0.002 0.002 0.003 0.012 0.015 0.020 0.002 0.002 0.003 W3j 0.015 0.018 0.023 0.006 0.009 0.014 0.001 0.002 0.003 0.010 0.014 0.019 0.001 0.003 0.005 W4j 0.015 0.018 0.021 0.007 0.010 0.014 0.001 0.002 0.002 0.012 0.015 0.020 0.001 0.002 0.003 W5j 0.015 0.018 0.021 0.007 0.010 0.014 0.001 0.002 0.002 0.012 0.015 0.020 0.001 0.002 0.003 SUM 0.074 0.092 0.112 0.031 0.046 0.069 0.007 0.010 0.014 0.056 0.072 0.098 0.007 0.012 0.020 0.272 0.303 0.334 0.176 0.215 0.263 0.086 0.101 0.120 0.236 0.268 0.314 0.086 0.112 0.140 0.303 0.216 0.102 0.270 0.112 Initial Matrix weights of criteria 0,303 0,216 0,102 0,27 0,112 kind of criteria 1 1 1 -1 -1 C1 C2 C3 C4 C5 A1 2.1 9 60.5 62.3 36.6 A2 1 4.6 62.6 65.6 36.8 A3 1.1 5.3 64.2 65.7 37.4 A4 0 0.2 67.3 67.5 35.9 A5 0.4 2 64.4 65.9 35.7 A6 -0.1 -0.4 67.5 68.3 35.1 A7 0.1 0.6 66.6 66.9 33.6 A8 0.3 1.5 65.7 64.9 33 A9 0.7 3.3 64.6 67.7 33.4 Aggregated Fuzzy Vectors C1 C2 C3 C4 C5
Table 7 shows the initial matrix. Table 7 -
Matrix Aggregated Fuzzy Weight Coefficient Vectors Final Values Of The Weight Coefficients
Initial
Prof. Radojko Lukić, PhD
Measurement and Analysis of Profitability Dynamics of the Banking Sector in Serbia Based on the FLMAW-MARCOS Method
Note: Author’s calculation
Table 8 shows the expanded initial matrix.
Table 8 - Expanded Initial Matrix
Note: Author’s calculation
41 A10 2.1 10.5 58.4 63.2 32.9 A11 2.2 11.3 60 62.1 34 A12 1.8 9.8 58.8 63.4 32.5 A13 1.1 6.5 60.6 66.3 33.8 A14 1.2 7.8 58.2 71 30.2 A15 1.4 10 55.8 67 28.7 MAX 2.2 11.3 67.5 71 37.4 MIN -0.1 -0.4 55.8 62.1 28.7 weights of criteria 0.303 0.216 0.102 0.27 0.112 kind of criteria 1 1 1 -1 -1 C1 C2 C3 C4 C5 AAI -0.1 -0.4 55.8 71 37.4 A1 2.1 9 60.5 62.3 36.6 A2 1 4.6 62.6 65.6 36.8 A3 1.1 5.3 64.2 65.7 37.4 A4 0 0.2 67.3 67.5 35.9 A5 0.4 2 64.4 65.9 35.7 A6 -0.1 -0.4 67.5 68.3 35.1 A7 0.1 0.6 66.6 66.9 33.6 A8 0.3 1.5 65.7 64.9 33 A9 0.7 3.3 64.6 67.7 33.4 A10 2.1 10.5 58.4 63.2 32.9 A11 2.2 11.3 60 62.1 34 A12 1.8 9.8 58.8 63.4 32.5 A13 1.1 6.5 60.6 66.3 33.8 A14 1.2 7.8 58.2 71 30.2 A15 1.4 10 55.8 67 28.7 AI 2.2 11.3 67.5 62.1 28.7
Extended Initial Matrix
Prof. Radojko Lukić, PhD
Table 9 shows the normalized matrix.
Note: Author’s calculation
Table 10 shows the weight-normalized matrix. Table 10 - Weighted Normalized Matrix
Weighted Normalized Matrix
42 Banking 2023
Table 9 - Normalized Matrix
Normalized Matrix weights of criteria 0.303 0.216 0.102 0.27 0.112 kind of criteria 1 1 1 -1 -1 C1 C2 C3 C4 C5 AAI -0.04545 -0.0354 0.826667 0.874648 0.76738 A1 0.9545 0.7965 0.8963 0.9968 0.7842 A2 0.4545 0.4071 0.9274 0.9466 0.7799 A3 0.5000 0.4690 0.9511 0.9452 0.7674 A4 0.0000 0.0177 0.9970 0.9200 0.7994 A5 0.1818 0.1770 0.9541 0.9423 0.8039 A6 0.0000 0.0000 1.0000 0.9092 0.8177 A7 0.0455 0.0531 0.9867 0.9283 0.8542 A8 0.1364 0.1327 0.9733 0.9569 0.8697 A9 0.3182 0.2920 0.9570 0.9173 0.8593 A10 0.9545 0.9292 0.8652 0.9826 0.8723 A11 1.0000 1.0000 0.8889 1.0000 0.8441 A12 0.8182 0.8673 0.8711 0.9795 0.8831 A13 0.5000 0.5752 0.8978 0.9367 0.8491 A14 0.5455 0.6903 0.8622 0.8746 0.9503 A15 0.6364 0.8850 0.8267 0.9269 1.0000 AI 1 1 1 1 1 C1 C2 C3 C4 C5 AAI 0 0 0.08432 0.236155 0.085947 A1 0.2892 0.1720 0.0914 0.2691 0.0878
Prof. Radojko Lukić, PhD
Measurement and Analysis of Profitability Dynamics of the Banking Sector in Serbia Based on the FLMAW-MARCOS Method
Note: Author’s calculation
Table 11 and Figure 2 show the results of the MARCOS method.
43
A2 0.1377 0.0879 0.0946 0.2556 0.0873 A3 0.1515 0.1013 0.0970 0.2552 0.0859 A4 0.0000 0.0038 0.1017 0.2484 0.0895 A5 0.0551 0.0382 0.0973 0.2544 0.0900 A6 0.0000 0.0000 0.1020 0.2455 0.0916 A7 0.0138 0.0115 0.1006 0.2506 0.0957 A8 0.0413 0.0287 0.0993 0.2584 0.0974 A9 0.0964 0.0631 0.0976 0.2477 0.0962 A10 0.2892 0.2007 0.0882 0.2653 0.0977 A11 0.3030 0.2160 0.0907 0.2700 0.0945 A12 0.2479 0.1873 0.0889 0.2645 0.0989 A13 0.1515 0.1242 0.0916 0.2529 0.0951 A14 0.1653 0.1491 0.0879 0.2362 0.1064 A15 0.1928 0.1912 0.0843 0.2503 0.1120 AI 0.303 0.216 0.102 0.27 0.112 Results of the MARCOS Method Si AAI 0.4064 Ki- Ki+ f(K-) f(K+) f(K) Ranking 2008 A1 0.9096 2.2382 0.9069 0.2884 0.7116 0.8120 0.8120 3 2009 A2 0.6632 1.6318 0.6612 0.2884 0.7116 0.5920 0.5920 9 2010 A3 0.6910 1.7001 0.6889 0.2884 0.7116 0.6168 0.6168 8 2011 A4 0.4435 1.0911 0.4421 0.2884 0.7116 0.3959 0.3959 14 2012 A5 0.5351 1.3166 0.5335 0.2884 0.7116 0.4777 0.4777 11 2013 A6 0.4391 1.0803 0.4378 0.2884 0.7116 0.3920 0.3920 15 2014 A7 0.4722 1.1618 0.4708 0.2884 0.7116 0.4215 0.4215 13 2015 A8 0.5250 1.2918 0.5235 0.2884 0.7116 0.4687 0.4687 12 2016 A9 0.6010 1.4788 0.5992 0.2884 0.7116 0.5365 0.5365 10 2017 A10 0.9412 2.3158 0.9384 0.2884 0.7116 0.8402 0.8402 2 2018 A11 0.9742 2.3970 0.9713 0.2884 0.7116 0.8697 0.8697 1
Table 11 - Results of the MARCOS Method
Prof. Radojko Lukić, PhD
Therefore, the five best years of achieved profitability in the banking sector in Serbia in the period 2008 - 2022 in order are: 2018, 2017, 2008, 2019 and 2022. The worst profitability was achieved in 2013. It is noticeable that profitability has recently improved the banking sector in Serbia. The profitability of the banking sector in Serbia was affected by the economic climate, management of human resources, assets, capital, sales of banking products, costs and profits, digitization of the entire business, the Covid-19 pandemic, and the global energy crisis.
In order to improve the profitability of the banking sector in Serbia, it is necessary to manage human resources, assets, capital, sales, costs and profits as efficiently as possible. Likewise, timely adaptation to changes in the economic climate.
It is recommended that when analyzing the profitability dynamics of the banking sector in Serbia, several methods of multi-criteria decision-making should be used in a comparative manner. In this way, a more complete picture of the profitability dynamics of the banking sector in Serbia is obtained.
44 Banking 2023 2019 A12 0.8875 2.1836 0.8848 0.2884 0.7116 0.7922 0.7922 4 2012 A13 0.7153 1.7600 0.7132 0.2884 0.7116 0.6386 0.6386 7 2021 A14 0.7449 1.8328 0.7427 0.2884 0.7116 0.6650 0.6650 6 2022 A15 0.8305 2.0435 0.8281 0.2884 0.7116 0.7414 0.7414 5 AI 1.0030
Note: Author’s calculation
Figure 2 - Ranking of Alternatives Source: Author’s picture
Prof. Radojko Lukić, PhD
Conclusion
Based on the empirical results obtained using the given methodology, the following can be concluded:
1. The five best years of achieved profitability in the banking sector in Serbia in the period 2008 - 2022 in order are: 2018, 2017, 2008, 2019 and 2022. The worst profitability was recorded in 2013. Recently, the profitability of the banking sector in Serbia has improved.
2. The profitability factors of the banking sector in Serbia are the economic climate, management of human resources, assets, capital, sales of banking products, costs and profit. Digitization of the entire business has a significant role in this. The impact of the Covid-19 pandemic, as well as the global energy crisis, is not negligible. Their adequate control can significantly influence the achievement of the target profitability of the banking sector in Serbia.
In order to improve the profitability of the banking sector in Serbia, it is necessary to manage human resources, assets, capital, sales, costs and profits as efficiently as possible. In addition, timely adaptation to changes in the economic climate and the global environment.
References
1. Ali, S.M., Hoq, S.M.N., Bari, A.B.M.M., Kabir, G., Paul, S.K. (2022). Evaluating factors contributing to the failure of information system in the banking industry. PLoS ONE, 17(3): e0265674. https://doi. org/10.1371/journal.pone.0265674
2. Andersen, P.; Petersen, N.C. (1993). A procedure for ranking efficient units in data envelopment analysis. Management Science, 39, 1261-1264.
3. Banker, R.D., Charnes, A. and Cooper, W.W. (1984). Some models for estimating technical and scale inefficiencies in data envelopment analysis. Management Science, 30(9), 1078–1092.
4. Božanić, D., Pamučar, D., Milić,A., Marinković, M.and Komazec, N. (2022). Modification of the Logarithm Methodology of Additive Weights (LMAW) by a Triangular Fuzzy Number and Its Application in Multi-Criteria Decision Making. Axioms, 11(3), 89. https://doi.org/10.3390/axioms11030089
5. Chang, X. and Wang, X. (2020). Research Performance Evaluation of University Based on Super DEA Model. 2020 IEEE 9th Joint International Information Technology and Artificial Intelligence Conference (ITAIC), 1252-1255. doi: 10.1109/ITAIC49862.2020.9339131
6. Chen, Chunhua, Liu, Haohua, Tang, Lijun and Ren, Jianwei. (2021). A Range Adjusted Measure of Super-Efficiency in Integer-Valued Data Envelopment Analysis with Undesirable Outputs. Journal of Systems Science and Information, 9( 4), 378-398. https://doi.org/10.21078/JSSI-2021-378-21
7. Cvetkoska, V., and Savić, G. (2017). Efficiency of bank branches: Empirical evidence from a two-phase research approach. Economic Research-Ekonomska istrazivanja, 30(1), 318–333. doi: 10.1080/1331677X.2017.1305775
8. Cvetkoska, V. and Ciković, K.F.(2020). Assessing the relative efficiency of commercial banks in the Republic of North Macedonia: DEA window analysis. Croatian Operational Research Review 217 CRORR 11, 217-227.
45
Prof. Radojko Lukić, PhD
Measurement and Analysis of Profitability Dynamics of the Banking Sector in Serbia Based on the FLMAW-MARCOS Method
9. Cvetkoska, V., Fotova Ciković, K. and Tasheva, M. (2021). Efficiency of Commercial Banking in Developing Countries. Mathematic , 9, 1597. https://doi.org/10.3390/math9141597
10. Demir, G. (2022). Analysis of the financial performance of the deposit banking sector inthe Covid-19 period with LMAW-DNMA methods. International Journal of Insurance and Finance, 2(2), 17-36.https://doi.org/10.52898/ijif.2022.7
11. Fenyves, V. and Tarnóczi, T. (2020). Data envelopment analysis for measuring performance in a competitive market. Problems and Perspectives in Management, 18(1), 315-325. doi:10.21511/ ppm.18(1).2020.27
12. Guo, D. and Cai, Z.Q. (2020). Super-Efficiency Infeasibility in the Presence of Nonradial Measurement. Mathematical Problems in Engineering, 2020, Article ID 6264852, 7 pages. https://doi.org/10.1155/2020/6264852
13. Lee, H.S., Chu, C.W. and J. Zhu, J. (2011). Super-efficiency DEA in the presence of infeasibility. European Journal of Operational Research, 212(1), 141–147.
14. Lin, R. (2020). Cross-efficiency evaluation capable of dealing with negative data: A directional distance function based approach. Journal of the Operational Research Society, 71(3), 505-516.
15. Lukic, R., Sokic, M. & Vojteski Kljenak, D. (2017). Efficiency Analysis Of Banking Sector In Republic Of Serbia. Business Excellence and Management, 7(4), 5-17.
16. Lukić, R. (2018a). Bankarsko računovodstvo. Beograd: Ekonomski fakultet.
17. Lukić, R. (2018d). Analysis of the efficiency of insurance companies. In: Insurance in the post-crisis era, Belgrade: Faculty of Economics, University of Belgrade. ISBN:978-86-403-1548-7.
18. Lukić, R. and Hadrović Zekić, B. (2019). Evaluation of efficiency of trade companies in Serbia using the DEA approach. Proceedings of the 19 th International Scientific Conference Business logistics in modern management October 10-11, Osijek, Croatia, Josip Juraj Strossmaye, 145-162.
19. Lukić, R. (2021). Application of the EDAS method in the evaluation of bank efficiency in serbia. Bankarstvo - Banking, 50(2), 13-24. doi: 10.5937/bankarstvo2102064L
20. Maletić, R., Kreća, M., & Maletić, P. (2013). Application of dea methodology in measuring efficiency in the banking sector. Economics of Agriculture, 60(4), 843–855. https://www.ea.bg.ac.rs/index.php/EA/article/view/423
21. Lukić, R. (2022). Evaluation of the efficiency of banks in Serbia using the MABAC method. Bankarstvo - Banking, 2, 35-60. DOI: 10.5937/bankarstvo2202010L
22. Radojko Lukić, (2022b). Analysis of financial performance and efficiency of banks in serbia using fuzzy LMAW and MARCOS methods. Bankarstvo – Banking, 4, 130-169.
23. Milenkovic, N., Radovanov, B., Kalaš, B. and Horvat, A.M. (2022). External Two Stage DEA Analysis of Bank Efficiency in West Balkan Countries. Sustainability, 14, 978. https:// doi.org/10.3390/su14020978
24. Pamučar, D., Žižović, M., Biswas, S., Božanić, D. (2021). A new logarithm methodology of additive weights (LMAW) for multi-criteria decision-making: Application in logistics. Facta Univ. Ser. Mech. Eng., 2021, 19, 361–380. https://doi.org/10.22190/FUME210214031P
25. Puška, A., Božanić, D., Nedeljković, M., Janošević, M. (2022). Green Supplier Selection in an Uncertain Environment in Agriculture Using a HybridMCDM Model: Z-Numbers–Fuzzy LMAW–Fuzzy CRADIS Model. Axioms, 11, 427. https://doi.org/ 10.3390/axioms1109042
26. Pendharkar, P.C. (2021). Hybrid radial basis function DEA and its applications to regression, segmentation and cluster analysis problems. Machine Learning with Applications, 6, 100092. https://doi.org/10.1016/j.mlwa.2021.100092.
46 Banking 2023
Prof. Radojko Lukić, PhD
27. Peykani, P., Seyed Esmaeili, F.S., Mirmozaffari, M., Jabbarzadeh, A. and Khamechian, M. (2022). Input/Output Variables Selection in Data Envelopment Analysis: A Shannon Entropy Approach. Mach. Learn. Knowl. Extr., 4, 688–699. https://doi.org/10.3390/ make4030032
28. Peykani, P., Gheidar-Kheljani, J., Farzipoor Saen, R., & Mohammadi, E. (2022a).Generalized Robust Window Data Envelopment Analysis Approach for DynamicPerformance Measurement under Uncertain Panel Data. Operational Research, 1-36.https://doi.org/10.1007/s12351-022-00729-7.
29. Podinovski, V.V. and Bouzdine-Chameeva, T. (2021). Optimal solutions of multiplier DEA models. J Prod Anal, 56, 45–68. https://doi.org/10.1007/s11123-021-00610-3
30. Radojičić, M., Savić, G., & Jeremić, V. (2018). Measuring the efficiency of banks: the bootstrapped I-distance GAR DEA approach. Technological and Economic Development of Economy, 24(4), 1581-1605. https://doi.org/10.3846/tede.2018.3699
31. Rostamzadeh, R., Akbarian, O., Banaitis, A., & Soltani, Z. (2021). Application of DEA in benchmarking: a systematic literature review from 2003–2020. Technological and Economic Development of Economy, 27(1), 175-222. https://doi.org/10.3846/tede.2021.13406
32. Savić, G., Radosavljević, M., & Ilievski, D. (2012). DEA Window analysis approach for measuring the efficiency of Serbian banks. Management - časopis za teoriju i praksu menadžmenta, 17(65), 5-14.
33. Stević, Ž., Pamučar, D., Puška, A. and Chatterjee, P. (2020a). Sustainable supplier selection in healthcare industries using a new MCDM method: Measurement of alternatives and ranking according to COmpromise solution (MARCOS). Computers & Industrial Engineering, 140, 106231. https://doi.org/10.1016/j.cie.2019.106231.
34. Stević, Ž. and Brković, N. A. (2020b). Novel Integrated FUCOM-MARCOS Model for Evaluation of Human Resources in a Transport Company. Logistics, 4, 4. https://doi.org/10.3390/logistics4010004
35. Tone, K. (2002). A slacks-based measure of super-efficiency in data envelopment analysis. European Journal of Operational Research, 143, 32-41.
36. Tsai, Chi-Mao; Lee, Hsuan-Shih; and Gan, Guo-Ya (2021). A New Fuzzy DEA Model for Solving the MCDM Problems in Supplier Selection. Journal of Marine Science and Technology: 29(1) , Article 7. DOI: 10.51400/2709-6998.1006
37. Ünlü, U., Yalçın, N. and Avşarlıgil, N. (2022). Analysis of Efficiency and Productivity of Commercial Banks in Turkey Pre- and during COVID-19 with an Integrated MCDM Approach. Mathematics, 10(13), 2300. https://doi.org/10.3390/math10132300
47
Prof. Radojko Lukić, PhD
Measurement and Analysis of Profitability Dynamics of the Banking Sector in Serbia Based on the FLMAW-MARCOS Method
Originalni naučni rad
Datum prijema: 09.02.2023. god.
Datum prihvatanja: 18.04.2023. god.
STRATEGIJSKI ASPEKTI
ODRŽIVOG RAZVOJA I DIGITALNE
TRANSFORMACIJE: ISTRAŽIVANJE U INTERNACIONALNOJ BANCI
Ljiljana Kontić vanredni profesor, Univerzitet MB, Poslovni i pravni fakultet ljiljana.kontic@yahoo.com
Jovan Kontić Magistar ekonomskih nauka jokon@Eunet.rs
Rezime: Osnovni cilj ovoga rada je prikazati rezultate održivog razvoja i digitalne transformacije u jednoj internacionalnoj banci koja posluje u Srbiji. Rad daje doprinos postojećoj literaturi iz oblasti održivog razvoja i digitalne transformacije u zemljama u razvoju. Korišćena je kombinacija metoda tzv. miks metodologija. Kvantitativni podaci prikupljani su od 355 menadžera iz posmatrane banke. Izvori kvalitativnih podataka su javno dostupne informacije za 2020. i 2021. godinu. Rezultati kvantitativnih podataka, obrađenih odgovarajućim statističkim metodama, ukazali su na fazu samoosnaživanja u procesu digitalne transformacije. Analiza indikatora održivosti pokazala je visoke vrednosti bančinog doprinosa „Društvenom proizvodu“, kao i treningu i novom zapošljavanju. U 2021. godini evidentirana je visoka fluktuacija zaposlenih, što ukazuje na potrebu za formulisanjem nove strategije ljudskih resursa. Rezultati daju doprinos postojećoj literaturi iz oblasti održivog razvoja i digitalizacije u kroskulturološkom organizacionom kontekstu. Biće prikazane i praktične preporuke za menadžere.
Ključne reči: strategija održivosti, digitalna transformacija, internacionalna banka, GRI indikatori, Srbija, kros-kulturološki kontekst
JEL klasifikacija: M21, G21, Q56
48 Bankarstvo 2023
DOI: 10.5937/bankarstvo2301061K
Uvod
Bankarski sektor je važan za održivi ekonomski razvoj. Veliki eksterni šokovi koji su dramatično uticali na bankarstvo bili su finansijska kriza 2008. god., Četvrta industrijska revolucija i pandemija Kovid-19. Navedeni eksterni uslovi su ubrzali digitalizaciju i održivu transformaciju banaka (Forcadell et al., 2020). Korelacija između digitalne transformacije i održivosti je istraživana u razvijenim državama, npr. Australija, Kanada, Danska, Francuska, Nemačka, Grčka, Italija, Norveška, Portugal, Španija, Švajcarska, Ujedinjeno Kraljevstvo i Sjedinjene Američke Države. Rezultati longitudinalne studije koja je obuhvatila 112 internacionalnih komercijalnih banaka pokazali su da kombinacija održivosti i digitalne transformacije ima pozitivan uticaj na performanse (Forcadell et al., 2020).
Najveći broj istraživanja čiji je predmet istraživanja bio održivo bankarstvo i digitalna transformacija sproveden je u Španiji, SAD-u, Engleskoj i Kini (Aracil et al., 2021; Diener & Spacek, 2021; Kitsios et al., 2021; Tsindeliani et al., 2021; Yip & Bocken, 2018). Rezultati su pokazali da je u slučaju kineskih banaka postojala pozitivna korelacija između performansi održivosti i finansijskih performansi (Weber, 2017). Rezultati istraživanja iz Nemačke, gde je izveštavanje o održivosti zakonska obaveza, su pokazali da banke delimično, ne u potpunosti digitalizuju poslovanje (Diener & Spacek, 2021). Yip i Bocken (2018) su zaključili da će tehnologija ubrzati procese inovacija u bankarstvu. Rezultati istraživanja u kojem su komparirani poslovni modeli održivog razvoja banaka u Norveškoj, Nemačkoj, Mađarskoj, Španiji, Velikoj Britaniji, Poljskoj, Italiji i Francuskoj pokazali su da najbolje performanse imaju modeli norveških i nemačkih banaka (Nosratabati et al., 2020). U slučaju Grčke, menadžeri u bankama su spremni za digitalnu transformaciju, ukoliko su zaposleni spremni da digitalizacija postane deo njihove dnevne rutine (Kitsios et al., 2021). Digitalizacija u bankarskom sektoru doprineće efektivnoj implementaciji pravila, posebno onih koja štite opšte interese (Tsindeliani et al., 2022).
Nekoliko istraživanja obuhvatilo je zemlje u razvoju (Forcadell & Aracil, 2017; Theiri & Alareeni, 2021). Rezultati jednog istraživanja su pokazali da održivost u zemljama u razvoju obuhvata širok opseg aktivnosti, od klasične filantropije, do integracije i inovacija (Forcadell & Aracil, 2017). U slučaju tunižanskih banaka, jedna studija je ukazala na neophodnost digitalizacije kao tehnike za strategijsko planiranje, inovacije i održivi razvoj. Takođe, može da pomogne u identifikovanju neophodnih aspekata poslovnih procesa i načina da zaposleni prežive krizu izazvanu pandemijom Kovid 19 (Theiri & Alareeni, 2021).
Analizom pregleda literature iz oblasti održivog bankarstva i korišćenjem bibliometrijske tehnike, autori su pronašli 676 članaka publikovanih između 1995-2019 u WOS bazi podataka (Aracil et al., 2021). Iz navedenog istraživanja najvažniji zaključci su sledeći:
1. Najveći broj istraživanja publikovan je u oblasti biznisa, ekonomije i menadžmenta, a značajno manji broj u najuticajnijim časopisima iz oblasti finansija.
2. Prema broju publikacija, Španija je na prvom mestu, slede Sjedinjene Američke Države i Kina, a u svakoj državi je publikovano više od 100 članaka. Manje od pet članaka je publikovano u većini istočnoevropskih država i zemalja u razvoju.
49
1
Ljiljana Kontić Jovan Kontić
Strategijski aspekti održivog razvoja i digitalne transformacije: istraživanje u internacionalnoj banci
Navedena razlika između broja istraživanja u razvijenim, u odnosu na zemlje u razvoju, motivisala je autore ovog rada da sprovedu istraživanje u cilju procene održivosti i digitalne transformacije u jednoj banci koja posluje u Srbiji.
Bankarski sektor može biti medijator između ekonomskog razvoja i zaštite životne okoline putem promocije ekološki održivih i društveno odgovornih investicija. Termin „zeleno bankarstvo“ uveden je pre dvadeset godina i označavao je način poslovanja banaka u kojem se smanjuje ukupna emisija izduvnih gasova (Bhardwaj & Malhotra, 2013).
Digitalna transformacija imala je pozitivne efekte na izveštaje o održivom razvoju banaka u Nemačkoj (Diener & Spacek, 2021). Osnovno istraživačko pitanje glasi: Da li postoji povezanost između digitalne transformacije i održivosti u bankarskom sektoru u Srbiji? Da bismo odgovorili na ovo pitanje, prikazaćemo teorijske pretpostavke, a zatim i kontekst istraživanja. Naredni deo je posvećen metodologiji istraživanja.
U delu rezultati i diskusija glavni nalazi vezani za digitalnu transformaciju i održivost biće predstavljeni u posmatranoj banci. Na kraju, preporuke za bančine menadžere koje se tiču povezanosti između digitalne transformacije i strategije održivosti biće objašnjene.
TEORIJSKE PRETPOSTAVKE
Osnovne faze digitalne transformacije
Autori ukazuju na četiri faze transformacije od tradicionalne ka digitalnoj organizaciji (Bonnet et al. 2015: 7):
1. Faza odugovlačenja karakteristična je po nefleksibilnosti i nemogućnosti da se isporuče rezultati.
2. Faza inicijacije u kojoj organizacije počinju da razvijaju digitalne sposobnosti kroz investiranje u nova znanja i nove odnose.
3. Faza angažovanja u kojoj organizacije imaju različite digitalne sposobnosti i razvijaju internu saradnju.
4. Faza samoosnaživanja specifična je po visokom nivou fleksibilnosti, sposobnosti brze reorganizacije i samoorganizacije.
Preduslovi da postane digitalna organizacija su proaktivno liderstvo i investicije. Prema Bonnet i saradnicima (2015), četiri ključna faktora digitalne transformacije su: mentalni sklop „na prvom mestu digitalno“, digitalizovane prakse, osnaženi talenti, pristup podacima i mehanizmi saradnje. Prvi korak u digitalnoj transformaciji je objašnjavanje koristi svim zainteresovanim grupama. Zatim lider treba da bude model ponašanja zaposlenima, a zatim uvodi novčane i nenovčane nagrade da bi podstakao digitalnu promenu.
50 Bankarstvo 2023
Ljiljana Kontić Jovan Kontić
Timovi iz IT sektora i ljudskih resursa definišu buduće veštine. Zatim sprovode analizu gepa između potrebnih i trenutnih veština zaposlenih. Sledeća faza je prevazilaženje (popunjavanje) gepa i razvoj sistema monitoringa. Neophodne digitalne veštine su: analiza meta-podataka, upotreba društvenih mreža i mobilnih uređaja (Bonnet et al. 2015: 5).
Predstavljeni model zajedno sa ključnim faktorima je osnova za samoevaluaciju digitalne transformacije. S obzirom na različite karakteristike nacionalnih kultura, validnost istraživačke metodologije bila je istražena u Srbiji.
Održivo bankarstvo
Održivo bankarstvo može se definisati kao isporuka „finansijskih proizvoda i usluga koje su kreirane za zadovoljenje potreba klijenata, prema ekološkim standardima i generišu profit“ (Yip & Bocken, 2018:150). Detaljno su analizirani različiti aspekti održivosti bankarskog sektora u razvijenim državama (Care, 2018; Nosratabadi et al., 2020; Bouma et al., 2017; da Silva Inacio & Delai, 2021). Sistematizovani pregled literature ukazao je na potrebu formiranja integrativnog okvira oko tri ključna segmenta Etičke osnove, Održivih proizvoda i Praktičnih primera (Aracil et al., 2021).
Održiva strategija banke ima interne i eksterne elemente. Rezultati istraživanja su pokazali da interni elementi mogu biti sledeći (Shershneva & Kondyukova, 2020):
1. Štedljiva oprema i sortiranje otpada
2. Elektronski protok dokumenata
3. Elektronske usluge klijentima
4. Stvaranje „zelenih” kancelarija
5. Organizovani prevoz zaposlenih.
Eksterni elementi strategije mogu biti sledeći (Shershneva & Kondyukova, 2020):
1. „Zelene“ pozajmice i investicije
2. Poslovanje na „zelenim“ tržištima
3. „Zeleni“ bankarski proizvodi namenjeni građanstvu
4. Ekološki orijentisana sponzorstva i donatorstva
5. „Zeleno“ zajedničko finansiranje.
51
Ljiljana Kontić Jovan Kontić Strategijski aspekti održivog razvoja i digitalne transformacije: istraživanje u internacionalnoj banci
Od 2013. god. banke pripremaju izveštaje o održivom razvoju korišćenjem GRI indikatora poznatih kao G4 Sector Disclosure – Financial services. U ovom vodiču finansijski sektor je podeljen na četiri kategorije: poslovi sa stanovništvom, korporativno bankarstvo, upravljanje sredstvima i osiguranje (GRI, 2013). Smernice obuhvataju ekonomske, ekološke i socijalne performanse banaka. Standardi za izveštavanje o održivom razvoju (eng. Sustainability Reporting Standards - SRS) kreirani su 2016. god. nakon detaljne analize GRI G4 principa. Istraživanje sprovedeno u Nemačkoj pokazalo je pozitivnu vezu između digitalizacije i izveštavanja o održivom razvoju u bankama (Diener & Spacek, 2021). Ako se izveštaji pripreme prema GRI standardima, onda nema značajne razlike između država kao što su Švedska i Finska (Magdalena, 2021).
KONTEKST ISTRAŽIVANJA
Istraživanje je sprovedeno u jednoj internacionalnoj banci koja posluje u Srbiji. Bankarski sektor je izabran iz sledećih ključnih razloga: Bankarski sektor je od vitalne važnosti u nacionalnoj ekonomiji, a kada je konkurentan i efikasan pozitivno utiče na ostale privredne grane. U poslednje tri decenije bankarski sektor u Srbiji doživeo je značajne promene (Kontic & Kontic, 2009, 2012, 2022). Smanjio se broj banaka, likvidirane su male banke, a došlo je do akvizicija. Rezultat ovih procesa je intenzivna konkurencija u bankarskom sektoru. Prilikom izbora banke korišćena su tri kriterijuma: (1) pristup menadžerima, (2) konkurentska pozicija banke, (3) prethodne aktivnosti u pravcu održivog razvoja u Srbiji.
Izabrana Banka je jedna od vodećih finansijskih institucija na srpskom tržištu sa poslovnom mrežom od 126 filijala i 5 korporativnih centara. U decembru 2021. god. Banka je pripojila još jednu banku. Tržišni udeo iznosi 6,5% (National Bank of Serbia, 2021). Banka je kontinuirano posvećena ulaganjima u razvoj lokalne zajednice i nekoliko godina unazad je dobila brojne pohvale i nagrade.
METODOLOGIJA
Uzorak
Uzorak je klasifikovan prema polu, nivou obrazovanja, radnom iskustvu i bančinim regionalnim centrima. 50,3% menadžera su ženskog pola, a 49,7% muškog. 68,2% menadžera imalo je manje od 40 godina, a 31,8% više od 40 godina starosti. Većina menadžera imalo je srednju ili višu školu (53,4%) i visoku (43,6%), više od 10 godina radnog iskustva u bankarskom sektoru. U istraživanju su učestvovali menadžeri iz Beograda (27,7%), Niša (23,4%), Kragujevca (24,1%) i Vojvodine (24, 8%).
Istraživački instrument
Upitnik za samoevaluaciju razvili su Bonnet i saradnici (2015), a sastoji se iz pitanja za procenu faze digitalne transformacije prema modelu objašnjenom u teorijskim pretpostavkama. Upitnik je preveden na srpski jezik, a popunjavalo ga je 355 menadžera banke. Ispitanici su rangirali trenutne stavove na skali od 1-uopšte se ne slažem do 5-potpuno se slažem. Cilj je bio da se utvrdi u kojoj fazi digitalne transformacije je banka.
52 Bankarstvo 2023
Ljiljana Kontić Jovan Kontić
Originalna skala obuhvata skor između 1 i 6 za svaku stavku. Međutim, originalna skala je modifikovana na način da skor između 10-20,5 pripada fazi odugovlačenja; 20,6-30,5 fazi inicijacije; 30,6- 40,5 fazi angažovanja, a od 40,6 do 50 fazi samoosnaživanja.
Korišćen je priručnik iz originalnog istraživanja sa sledećim uputstvom (Capgemini Consulting, 2013: 14):
„1. Procenite od 1 do 5 svaku stavku;
2. Izračunajte skor svakog faktora, kao i aritmetičku sredinu;
3. Zbir aritmetičkih sredina faktora čini ukupan skor Banke;
4. Prema uputstvu odredite kojoj fazi Banka pripada;
5. Odredite kom faktoru su potrebna značajna poboljšanja, i
6. Uporedite aritmetičke sredine pojedinačnih faktora“.
Podaci o održivosti derivirani su iz javno dostupnih informacija (web sajta Banke, godišnjih izveštaja o korporativnoj društvenoj odgovornosti). Analiza sadržaja obuhvatila je sve tri dimenzije održivosti, ekonomsku, ekološku i društvenu.
Istraživanje je sprovedeno u trajanju od 3 meseca (od februara 2022 do aprila 2022. god.). Tokom jednog radnog dana istraživači su direktno distribuirali upitnike u prostorijama Banke. Ostalima su poslali elektronsku verziju putem e-mejla.
Analiza podataka
Analiza podataka izvršena je kvantitativnim i kvalitativnim metodama. Od kvantitativnih metoda koristili smo višestruku regresiju i faktorsku analizu. U ovom istraživanju, ekstrakcija faktora izvršena je analizom glavne komponente. Nakon toga, Promax rotacija sa Kajzerovom normalizacijom je primenjena. Rotacija je izvršena u 25 iteracija. Podaci su analizirani korišćenjem softverskog paketa SPSS Statistics V25. Od kvalitativnih metoda korišćena je analiza sadržaja.
REZULTATI I DISKUSIJA
Rezultati analize podataka iz upitnika su pokazali ukupan skor od 41 od 50 što, prema Bonnet i saradnicima (2015), znači da je Banka u fazi samoosnaživanja u procesu digitalne transformacije.
Rezultati analize pouzdanosti pokazali su da je Upitnik adekvatan za istraživanje digitalne transformacije u bankarskom sektoru u Srbiji. Sva četiri faktora imali su Cronbach Alpha veći od 0,70:
53
Ljiljana Kontić Jovan Kontić Strategijski aspekti održivog razvoja i digitalne transformacije: istraživanje u internacionalnoj banci
• Mentalni sklop „digitalno na prvom mestu“ (Cronbach Alpha je bio 0,741);
• Digitalne prakse (Cronbach Alpha je bio 0,930);
• Osnaživanje talenata (Cronbach Alpha je bio 0,811); i
• Pristup podacima i mehanizmi saradnje (Cronbach Alpha je bio 0,793).
U originalnom Upitniku faktor Mentalni sklop „digitalno na prvom mestu“ se sastoji samo iz dve stavke. Bilo bi dobro da se u narednom istraživanju uključi još stavki. Faktor prakse obuhvata: digitalizovane operacije, odlučivanje na osnovu podataka, učenje kroz saradnju, a objašnjen je sa 12 stavki u Upitniku. Tri stavke faktora Talenti koje obuhvataju iskustvo sa tehnologijom, digitalne veštine i visoko angažovanje su objasnile 66,021% ukupne varijanse. Četiri stavke pristupa podacima i mehanizmi saradnje objasnile su 78,406% ukupne varijanse (Videti Tabelu 1).
Tabela 1 - Rezultati faktorske analize
i stavke Faktor I: Mentalni sklop digitalno na prvom mestu
54 Bankarstvo 2023
Koristimo prednosti digitalizacije kad god je moguće 9,168 Zaposleni razmišljaju o digitalnim tehnologijama kada razmatraju načine unapređenja poslovanja 1,389 Faktor II: Digitalne prakse Ključni procesi su automatizovani 0,775 Zaposleni prate poslovanje u realnom vremenu 0,673 Digitalne transakcije sa dobavljačima 0,521 Procesi su standardizovani 0,481 Odluke se donose na osnovu podataka 0,344 Očekivanja su jasno definisana 0,313 Podaci se sistematski prikupljaju i analiziraju 0,292 Lideri podstiču zajedničko rešavanje problema 1,913 Multidisciplinarna saradnja 1,750 Kultura učenja i eksperimentisanja 0,824 Donošenje odluka decentralizovano-centralizovano 0,624 Jasne vrednosti 0,496 Faktor III Talenti Zaposleni imaju iskustva sa mobilnim uređajima i aplikacijama 4,013 Zaposleni imaju iskustva sa društvenim mrežama 1,411 Zaposleni imaju iskustva sa meta podacima 1,178 Zaposleni imaju iskustva sa veštačkom inteligencijom 0,290 Zaposleni imaju iskustva sa internetom 0,780 Zaposleni imaju digitalne veštine 0,678 Zaposleni imaju veštine neophodne za digitalnu transformaciju 0,826
Faktori
Sume punjenja faktora (total)
Ljiljana Kontić Jovan Kontić
Strategijski aspekti održivog razvoja i digitalne transformacije: istraživanje u internacionalnoj banci
Pandemija Kovid-19 dovela do iniciranja novog modela u Banci. Pokrenuti su sledeći projekti: Pametan rad i projekti za sektor stanovništva. U martu 2020. god. realizovani su sledeći projekti (Bank Report, 2020:67):
• Potpuna automatizacija međunarodnih plaćanja sa periodom izveštavanja od 10 dana;
• Usvajanje mehanizama saradnje;
• Politika vođenja sastanaka; i
• Elektronski protok i potpisivanje internih dokumenata.
Od 2014. godine Izveštaj o održivom razvoju je sastavni deo godišnjeg finansijskog izveštaja Banke. Rezultati održivog razvoja u analiziranoj banci prikazani su u Tabeli 2.
Tabela 2 - GRI indikatori u Banci
GRI INDIKATORI 2020 2021
KATEGORIJA: EKONOMIJA– GRI 200
ASPEKT: EKONOMSKE PERFORMANSE – PRISTUP UPRAVLJANJU GRI 201
ASPEKT: PRAKSE NABAVKE – PRISTUP UPRAVLJANJU GRI 204
ASPEKT: ANTIKORUPCIJA - PRISTUP UPRAVLJANJU GRI 205
KATEGORIJA: ŽIVOTNA SREDINA GRI 300
ASPEKT: ENERGIJA - PRISTUP UPRAVLJANJU GRI 302
302-1 POTROŠNJA ENERGIJE UNUTAR KOMPANIJE
302-3 ENERGETSKA INTENZIVNOSTI
302-4 SMANJENJE POTROŠNJE ENERGIJE
ASPECT: VODA - PRISTUP UPRAVLJANJU GRI 303
ASPECT: EMISIJE - PRISTUP UPRAVLJANJU GRI 305
305-1 DIREKTNE EMISIJE GASOVA STAKLENE BAŠTE (GHG) EMISSIONS (SCOPE 1)*
305-2 INDIREKTNE EMISIJE GASOVA STAKLENE BAŠTE (GHG) EMISSIONS (SCOPE 2)*
55 Zaposleni su samomotivisani 0,620 Zaposleni su veoma kompetentni 0,979 Zaposleni imaju preduzetnički instinkt 0,356 Faktor IV Pristup podacima i mehanizmi saradnje Komunikacija i saradnja su razvijeni 2,844 Fleksibilan pristup podacima 1,082 Podaci o klijentima 0,841 Integrisani podaci o klijentima 0,722 Integrisani finansijski podaci 0,637 Integrisani podaci o performansama poslovanja 0,537 Integrisani podaci o performansama proizvoda/usluga 0,337 Integrisani podaci o lancu vrednosti 0,325 Izvor: Kalkulacija autora
Ljiljana Kontić Jovan Kontić
305-4 INTENZITET EMISIJE GASOVA STAKLENE BAŠTE
ASPEKT: IZLIVANJA I OTPAD - PRISTUP UPRAVLJANJU GRI 306
ASPEKT: PROCENA DOBAVLJAČA -PRISTUP UPRAVLJANJU GRI 308
KATEGORIJA: DRUŠTVO GRI 400
ASPEKT: ZAPOŠLJAVANJE - PRISTUP UPRAVLJANJU GRI 401
401-1 NOVOZAPOSLENI I FLUKTUACIJA ZAPOSLENIH
401-3 PORODILJSKO ODSUSTVO
ASPEKT: ZDRAVLJE I BEZBEDNOST NA RADNOM MESTU GRI 403
ASPEKT: TRENINZI I EDUKACIJE GRI 404
404-1 PROSEČAN BROJ SATI OBUKE PREMA KATEGORIJI ZAPOSLENIH
404-2 PROGRAMI ZA UNAPREĐENJE VEŠTINA ZAPOSLENIH I PROGRAMI ZA
USPEŠNO OKONČANJE RADNOG VEKA
404-3 PROCENAT ZAPOSLENIH KOJI DOBIJAJU REDOVNU PROCENU RADNOG
UČINKA I INDIVIDUALNOG RAZVOJA
ASPEKT: RAZLIČITOST I JEDNAKE MOGUĆNOSTI -PRISTUP UPRAVLJANJU GRI 405
ASPEKT: NEDISKRIMINACIJA -PRISTUP UPRAVLJANJU GRI 412
ASPEKT: LOKALNA ZAJEDNICA - PRISTUP UPRAVLJANJU GRI 413
ASPEKT: MARKETING I OZNAČAVANJE PROIZVODA I USLUGA - PRISTUP
UPRAVLJANJU GRI 417 (uključuje i raniji indikator FS16- Inicijative poboljšanja
finansijske pismenosti prema kategoriji korisnika)
ASPEKT: PRIVATNOST KLIJENATA - PRISTUP UPRAVLJANJU GRI 418
SEKTOR-RELEVANTNI ASPEKTI ZA FINANSIJSKI SEKTOR PREMA GRI SMERNICAMA
ASPEKT: PORTFOLIO PROIZVODA I USLUGA -PRISTUP UPRAVLJANJU (raniji indikatori FS1, FS2, FS3, FS4, FS5)
Izvor: Bank Report (2020): 112-116. Bank Report (2021): 118-122.
Legenda: U potpunosti ispunjeni, Delimično ispunjeni, Nisu ispunjeni
Analiza sadržaja pokazala je da su sledeći aspekti delimično ispunjeni u posmatranoj Banci: smanjenje potrošnje energije, direktni efekti emisije gasova staklene bašte, indirektni efekti emisije gasova staklene bašte, porodiljsko odsustvo, programi za unapređenje veština zaposlenih i programi za uspešno okončanje radnog veka. Svi ostali indikatori su u potpunosti ispunjeni. Nema aspekata koji nisu zadovoljeni. Sledeći važan aspekat je društveni proizvod Banke. Direktnu ekonomsku vrednost koja se stvara i distribuira prikazuje Tabela 3.
Doprinos Banke „Društvenom proizvodu“
56 Bankarstvo 2023
Table 3 - Doprinos Banke „Društvenom proizvodu”
U RSD milionima 2020 2021 Promet 9.482 10.108 Troškovi kamata i naknada -1.518 -1.871 Provizije -1.434 -832
Ljiljana Kontić Jovan Kontić
Izvor: Bank Report (2021):25.
Analiza Izveštaja o održivom razvoju Banke za 2020. i 2021. godinu ukazala je na sledeće indikatore koji su delimično ispunjeni: smanjenje potrošnje energije, direktna i indirektna emisija gasova efekata staklene bašte, porodiljsko odsustvo i programi unapređenja veština zaposlenih. Navedeno je u skladu sa prethodnim istraživanjima (Knezević et al., 2018).
GRI smernice su precizne u oblasti ekologije. Ekološki indikatori odnose se na inpute (npr. materijal, energiju, vodu) i autpute (npr. emisije, izlivanja, otpad). GRI indikatori koji se odnose na energiju prikazani su u Tabeli 4.
Tabela 4 - GRI indikatori u oblasti energije
Izvor: Bank Report (2020): 112-116. Bank Report (2021): 105-107.
Analiza je obuhvatila i podatke o broju novozaposlenih - 139, stopi fluktuacije zaposlenih - 9,5%, ukupnom broju sati treninga - 21.920, kao i prosečnom broju sati treninga po menadžeru - 10,50 i zaposlenom - 11,50 (Bank Report, 2020). Indikatori koji se odnose na treninge i edukacije, kao i uvažavanje različitosti prikazani su u Tabeli 5.
57 I Zaposleni Bruto zarade 2.339 2.547 Zdravstveno i socijalno osiguranje 691 731 Porez na zarade 173 186 Ukupno 3.203 3.464 II Dobavljači 2.995 3.948 III Donacije/Sponzorstva 14 12 IV Država Porez na zarade 71 70 PDV 0 0 Osiguranje depozita 386 414 Zdravstveno i socijalno osiguranje -691 -731 Porez na zarade -173 -186 Ukupno -407 -433 V Profit 725 414 Društveni proizvod 6.530 7.405
GRI OBLAST I INDIKATORI 2020 2021 ASPEKT: ENERGIJA
302 302-1 POTROŠNJA ENERGIJE UNUTAR BANKE 2.962,38 kWh 3.065,44 kWh ASPEKT: VODA - PRISTUP UPRAVLJANJU GRI 303 303-5 POTROŠNJA VODE 6,799 m 9,810 m 3 3
- PRISTUP UPRAVLJANJU GRI
Ljiljana Kontić Jovan Kontić
Strategijski aspekti održivog razvoja i digitalne transformacije: istraživanje u internacionalnoj banci
Tabela 5 - GRI indikatori treninga i edukacije i rodne ravnopravnosti
ASPEKT: TRENING I EDUKACIJA - PRISTUP UPRAVLJANJU GRI 404
404-1 PROSEČAN BROJ SATI TRENINGA PREMA KATEGORIJI ZAPOSLENIH
koji su učestvovali barem u jednom
ASPEKT: RAZLIČITOST I JEDNAKE MOGUĆNOSTI - PRISTUP UPRAVLJANJU GRI 405
Rodna ravnopravnost u Bordu direktora
Rodna ravnopravnost u Izvršnom odboru
Rodna ravnopravnost u komisijama pod nadležnošću Izvršnog odbora
Rodna ravnopravnost u svim upravljačkim strukturama
Source: Bank Report (2021): 88-89.
27,27 žene
72,72 muškarci
40 žene
60 muškarci
31,25 žene
68,75 muškarci
36 žene
64 muškarci
U martu 2020. godine IT sektor je realizovao dva velika projekta (Kontić&Kontić, 2022): Premestili su svu opremu iz prostorija Banke u domove zaposlenih i uključili Banku u projekat Narodne banke Srbije.
ZAKLJUČCI
Bankarski sektor je važan za održivi ekonomski razvoj. Korelacija između digitalne transformacije i održivosti je istraživana u razvijenim državama npr. Australija, Kanada, Danska, Francuska, Nemačka, Grčka, Italija, Norveška, Portugal, Španija, Švajcarska, Ujedinjeno Kraljevstvo i Sjedinjene Američke Države, dok tek nekoliko studija obuhvata zemlje u razvoju. Ovo istraživanje doprinosi boljem shvatanju održivog razvoja i digitalne transformacije u zemljama u razvoju.
Rezultati analize pouzdanosti pokazali su da je Upitnik adekvatan za istraživanje digitalne transformacije u izabranoj Banci. Sve četiri vrednosti Cronbach Alpha su bile iznad 0,70. Metodologija koja je razvijena u jednom kulturološkom kontekstu može se primeniti u različitom.
Potrebno je uključiti više stavki u faktor Mentalni sklop digitalno na prvom mestu. Faktor Prakse obuhvatio je digitalizovane operacije, donošenje odluke na osnovu podataka i učenje putem saradnje objašnjen je sa 12 stavki u Upitniku. Tri stavke faktora Talenti koje su se odnosile na tehnološko iskustvo, digitalne veštine i visok angažman objasnile su 66,021% ukupne varijanse. Četiri stavke faktora Pristup podacima i mehanizmi saradnje objasnile su 78,406% ukupne varijanse.
58 Bankarstvo 2023
GRI OBLAST I INDIKATORI 2020 2021 Procenat
84,86 88,07 % Internih treninga u odnosu na % eksternih treninga 47,91 71,27 % Sati e-učenja 96,64 97,98 Broj sprovedenih treninga 75 127
zaposlenih
treningu
Ljiljana Kontić Jovan Kontić
Banka je bila u fazi Samoosnaživanja u procesu digitalne transformacije. To znači da je Banka „postala digitalna organizacija sposobna da se brzo reorganizuje i iskoristi prednosti digitalizacije“ (Capgemini Consulting, 2013: 15). Strategija koju mogu primeniti menadžeri je da koriste bančine sposobnosti i istražuju nove šanse. Preciznije, kompetentni zaposleni i mentalne šeme menadžera omogućavaju primenu novih tehnologija u Banci. Razvijenost digitalnih praksa omogućava brz odgovor na zahteve klijenata, kao i identifikovanje novih trendova (Capgemini Consulting, 2013). Saradnja omogućava brzo sklapanje partnerstava unutar i izvan Banke.
Rezultati izveštavanja o održivom razvoju Banke ukazali su na nedovoljnu pažnju koja se nije poklanjala smanjenju potrošnje energije, efektima staklene bašte, porodiljskom odsustvu i programima unapređenja veština zaposlenih, kao i programima završetka radnog veka. Navedeni GRI indikatori zahtevaju veću pažnju menadžera u Banci.
Visoka fluktuacija zaposlenih ukazuje na potrebu za formulisanje nove strategije ljudskih resursa. Zajedno sa problematikom rodne ravnopravnosti predstavljaće buduće izazove za menadžment Banke. Rezultati su zasnovani na studiji slučaja. Stoga, istraživanje ima ograničenu primenu, uprkos činjenici da je izbor banke urađen strategijski na osnovu tržišnog učešća i finansijskih performansi. Takođe, prevođenje istraživačkog instrumenta uvek donosi različite lingvističke i kulturološke prepreke. Naredna istraživanja će obuhvatiti veći broj banaka iz Srbije i sličnih kulturoloških okruženja, kao što je Crna Gora, Hrvatska, Bosna i Hercegovina i Makedonija.
Literatura
1. Aracil, E., Nájera-Sánchez, J. J., & Forcadell, F. J. (2021). Sustainable banking: A literature review and integrative framework. Finance Research Letters, 42, 1019-1032.
2. Bank Report (2020). Annual Report & Corporate Responsibility Report 2020. Belgrade. 128pp.
3. Bank Report (2021). Annual Report & Corporate Responsibility Report 2021. Belgrade. 128pp.
4. Bhardwaj, B. R., & Malhotra, A. (2013). Green banking strategies: sustainability through corporate entrepreneurship. Greener Journal of Business and Management Studies, 3 (4), 180-193.
5. Bonnet, D., Puram, A. D., Buvat, J., KVJ, S., & Khadikar, A. (2015). Organizing for digital: why digital dexterity matters. Capgemini Consulting, 16pp. https://www.capgemini.com/consult ing/wp-content/uploads/sites/30/2017/07/digital_orgns_cover_08-12.pdf (access: 22.7.2022)
6. Bouma, J. J., Jeucken, M., & Klinkers, L. (Eds.). (2017). Sustainable banking: The greening of finance. Routledge.
7. Capgemini Consulting (2013). Accelerating Digital Transformation. https://www.capgemini. com/fi-en/wp-content/uploads/sites/27/2017/07/digital_transformation_review_iv_20-05. pdf (access: 23.7.2022)
8. Carè, R. (2018). Sustainable Banking. Issues and challenges. Cham: Palgrave Pivot.
9. da Silva Inacio, L., & Delai, I. (2021). Sustainable banking: a systematic review of concepts and measurements. Environment, Development and Sustainability, 1-39.
10. Diener, F., & Špaček, M. (2021). Digital transformation in banking: A managerial perspective on barriers to change. Sustainability, 13(4), 20-32.
11. Forcadell, F. J., & Aracil, E. (2017). Sustainable banking in Latin American developing countries: Leading to (mutual) prosperity. Business Ethics: A European Review, 26(4), 382-395.
59
Ljiljana Kontić Jovan Kontić
Strategijski aspekti održivog razvoja i digitalne transformacije: istraživanje u internacionalnoj banci
12. Forcadell, F. J., Aracil, E., & Úbeda, F. (2020). The impact of corporate sustainability and digitalization on international banks’ performance. Global Policy, 11, 18-27.
13. Global Reporting Inicitive - GRI (2013). G4-Sector Disclosures- Financial services. https://www. globalreporting.org/.../GRI-G4-Financial-Services (access: 22.7.2022)
14. Kitsios, F., Giatsidis, I., & Kamariotou, M. (2021). Digital transformation and strategy in the banking sector: Evaluating the acceptance rate of e-services. Journal of Open Innovation: Technology, Market, and Complexity, 7(3), 204.
15. Knežević, G., Pavlović, V., & Stevanović, S. (2018). Upgrading waste management and sustainability reporting in banking industry: Evidence from Serbia. Industrija, 46 (3), 163-183.
16. Kontić, J., & Kontić, Lj. (2009). Mergers and acquisitions in banking sector. Bankarstvo, 38(5-6), 90-105.
17. Kontić, Lj., & Kontić, J. (2012). Sustainability and readiness for change: Insights from a banking case study in Serbia. Amfiteatru Economic, 14 (32), 537.
18. Kontić, Lj., & Kontić, J. (2022). Implementation of Balanced scorecard in domestic commercial bank. Bankarstvo, 51 (1), 126-143. https://doi.org/10.5937/bankarstvo2201126K
19. Magdalena, I. M. (2021). Sustainability reporting disclosure within banking industry in Finland and Sweden.
20. National Bank of Serbia (2021). Financial statements of banks. https://nbs.rs/en/finansijske-in stitucije/banke/bilans-stanja/index.html (access on July 21th, 2022).
21. Nosratabadi, S., Pinter, G., Mosavi, A., & Semperger, S. (2020). Sustainable banking; evaluation of the European business models. Sustainability, 12(6), 2314.
22. Shershneva, E. G. E., & Kondyukova, E. S. (2020, February). Green banking as a progressive format of financial activity in transition to sustainable economy. In IOP conference series: Materials science and engineering (Vol. 753, No. 7, p. 072003). IOP Publishing.
23. Theiri, S., & Alareeni, B. (2021). Perception of the digital transformation as a strategic advantage through the Covid 19 crisis? case of Tunisian banks. Journal of Sustainable Finance & Investment, 1-22.
24. Tsindeliani, I. A., Proshunin, M. M., Sadovskaya, T. D., Popkova, Z. G., Davydova, M. A., & Babayan, O. A. (2022). Digital transformation of the banking system in the context of sustainable development. Journal of Money Laundering Control, 25(1), 165-180.
25. Yip, A. W., & Bocken, N. M. (2018). Sustainable business model archetypes for the banking industry. Journal of cleaner production, 174, 150-169.
26. Waller, S. (2017, March 18). Be Digital Ready. Retrieved from Simon Waller: simonwaller.live
27. Weber, O. (2017). Corporate sustainability and financial performance of Chinese banks. Sustainability Accounting, Management and Policy Journal.
60 Bankarstvo 2023
Ljiljana Kontić Jovan Kontić
STRATEGIC ASPECTS OF SUSTAINABILITY AND DIGITAL
TRANSFORMATION: A STUDY IN AN INTERNATIONAL BANK
Ljiljana Kontić associate professor, MB University, Business and Law School ljiljana.kontic@yahoo.com
Jovan Kontić Master of Economics jokon@Eunet.rs
Abstract: The main aim of this paper is to present the results of sustainability reporting and digital transformation in an international bank which operates in Serbia. This paper contributes to the existing literature of sustainability and digital transformation in developing countries. The mix-method has been used. Quantitative data have been collected from 355 managers from the observed bank. The qualitative data were sourced from publicity available information regarding 2020 and 2021. The results of quantitative data, processed by appropriate statistical procedures, pointed to self-reinforcement stage of digital transformation. The analysis of sustainability indicators revealed the higher values of Bank Contribution to the “Social Product”, and training and new employment. In 2021, it is evidenced the higher rate of turnover that implicated to new human resource strategy. The findings add to the existing literature on sustainability and digitization in cross-cultural organizational contexts. The practical implementation suggestions for managers are suggested, too.
Keywords: sustainability strategy, digital transformation, international bank, Global Reporting Initiative indicators, Serbia, cross-cultural context
JEL Classification: M21, G21, Q56
61
Original scientific paper Received: 09.02.2023. Accepted: 18.04.2023.
Strategic Aspects of Sustainability and Digital Transformation: A Study in an International Bank
DOI: 10.5937/bankarstvo2301061K
Introduction
The banking sector is important for sustainable economic development. Major external shocks that have deeply changed the banking industry were the 2008 financial crisis, the Fourth Industrial Revolution, and the COVID-19 pandemic. These environmental conditions are accelerating the digital and sustainable transformation of banks (Forcadell et al., 2020). The correlation between digital transformation and sustainability is well explored in developed countries i.e., Australia, Canada, Denmark, France, Germany, Greece, Italy, Norway, Portugal, Spain, Switzerland, United Kingdom, and United States of America. The results of a longitudinal study of 112 international commercial banks showed that a combination of sustainability and digital transformation had positive influence on performances (Forcadell et al., 2020).
The vast majority of studies that focus sustainable banking and digital transformation have been conducted in Spain, United States, England and China (Aracil et al., 2021; Diener & Spacek, 2021; Kitsios et al., 2021; Tsindeliani et al., 2022; Yip & Bocken, 2018). In the case of Chinese banks, the findings suggested that sustainability performances and financial performance have been correlate positively (Weber, 2017). A study in Germany, where sustainable reporting has been legally mandated, showed that banks are partially, and not fully, concerned with reporting on digitisation (Diener & Spacek, 2021). Yip and Bocken (2018) stated that technology would accelerat the innovation process in the banking industry. The results of a study that compares sustainability models in Norway, Germany, Hungary, Spain, UK, Poland, Italy, and France revealed that the sustainability of the Norwegian and German banks’ business models is higher than in other countries (Nosratabati et al., 2020). In the case of Greece, bank manager are ready for digital transformation if their employees are ready to accept digitalization in their daily job routine (Kitsios et al., 2021). The growth of digitalization in the banking sector would contribute to the effective implementation of prudential rules, including those related to the need to protect public interests (Tsindeliani et al., 2022).
A few studies have included developing countries (Forcadell & Aracil, 2017; Theiri & Alareeni, 2021). The results of one study showed that sustainability in developing countries has evolved a wide range of activities from classical philanthropy to an integration and innovation (Forcadell & Aracil, 2017). In the case of Tunisian banks, one study revealed the necessity of digitization as a tool for strategic planning, innovation and sustainable development. Also, it helps identify the essential aspects of business processes and how they should be implemented to survive and thrive during crises caused by COVID-19 (Theiri & Alareeni, 2021).
With an analysis of a literature review in the field of sustainable banking, using bibliometric techniques, the authors found 676 articles published between 1995 and 2019 in the Web of Science (WoS) database (Aracil et al., 2021). From this research, the main conclusions are as follows:
1. Studies on sustainable banking are more frequent in business, economics, and management journals than in mainstream financial journals.
2. According to number of publications, Spain takes the lead, followed by the United States, England, and China, all of them with more than 100 documents. Fewer than 5 articles have been published in a majority of East European and developing countries.
62 Banking 2023
Ljiljana Kontić Jovan Kontić
The aforementioned disparity between developed and developing countries motivated the authors to conduct this study aimed at assessing sustainability and digital transformation processes in the selected bank that operates in the Serbian market.
The banking sector can be an inter-mediator between economic development and environmental protection by promoting environmentally sustainable and socially responsible investment. Ten years ago, the term green banking has been introduced to refer to the banking business operations that had been conducted in a manner that helps the overall reduction of external carbon emission and internal carbon footprint (Bhardwaj & Malhotra, 2013).
The digital transformation had positive effects on the sustainable reporting in banks in Germany (Diener & Spacek, 2021). The main question is: What is the connection between digital transformation and sustainability in the Serbian banking sector? To answer to this question, a theoretical background will be presented along with the research context. The next section is devoted to research methodology. In the results and discussion section, we will present the main findings about digital transformation in the observed bank and sustainability. Finally, recommendations for bank managers regarding the relationship between digital transformation and sustainability strategy will be explained.
Theoretical Background Main Stages of Digital Transformation
The authors stated that there are four phases from traditional to digital organizations (Bonnet et al. 2015, p. 7):
1. Stalling phase is characterized by inflexibility, and inability to deliver the results.
2. Initiating phase in which organizations start to develop digital capabilities through investments in new knowledge and relationships.
3. Engaging phase in which organizations have various digital capabilities, and developed collaboration across the organization.
4. Self-Reinforcement phase characterized by a high level of flexibility, as well as the ability to quickly conduct reorganization and/or self-organization.
Preconditions for becoming a digital organization are proactive leadership and investment. According to Bonnet et al. (2015), the four key factors of digital transformation are: digital-first mindset, digitized practices, empowered talent, data access and collaboration tools. The first step in building a digital mindset is to explain the benefits of the digital transformation to key stakeholders. The next stage is for leaders to be role models to employees, then to introduce monetary as well as non-monetary rewards to encourage digital change.
63
Strategic Aspects of Sustainability and Digital Transformation: A Study in an International Bank
Ljiljana Kontić Jovan Kontić
The first step is to define future skill requirements conducting by human resources and IT teams. Then they performed gap analysis between desired and current skills of the employees. The next steps are to overcome the gap, followed by development of monitoring system. The necessary digital skills are analysis of meta data, use of social media, and mobile devices (Bonnet et al. 2015, p. 5).
The aforementioned model, along with the key factors, is a base of the Self-Assessment Tool for digital transformation. Bearing in mind the different characteristics of national cultures, the validity of the research methodology in Serbia was researched.
Sustainable Banking
Sustainable banking can be defined as the delivery of “financial products and services, which are developed to meet the needs of people and safeguard the environment while generating profit” (Yip & Bocken, 2018:150). The issue of sustainable banking in developed countries have been analyzed extensively (Care, 2018; Nosratabadi et al., 2020; Bouma et al., 2017; da Silva Inacio & Delai, 2021). Systematic review of literature revealed the need to construct an integrative framework around key issues such as Ethical Foundations, Sustainable Products, and Business-case (Aracil et al., 2021).
The sustainable bank’s strategy has internal and external elements. The results of one study have shown that internal element could be as followed (Shershneva & Kondyukova, 2020):
1. Resource-saving equipment and separate garbage collection
2. Paperless document flow.
3. Remote forms of customer service.
4. Creation of “green” offices.
5. Transportation of employees by corporate transport.
Moreover, the external elements of strategy could be the following (Shershneva & Kondyukova, 2020):
1. “Green” lending and investment.
2. Operations on “green” securities market.
3. “Green” banking products for citizens (payments, affinity cards, deposits).
4. Eco-oriented sponsorship or charity.
5. “Green” crowd-funding.
64 Banking 2023
Ljiljana Kontić Jovan Kontić
Since 2013, banks have been preparing sustainability reports using Global Reporting Initiative (GRI) guidelines known as G4 Sector Disclosure – Financial Services. The financial service sector in those guidelines is subdivided into four categories: retail banking, commercial and corporate banking, asset management and insurance (GRI, 2013). GRI specific guidelines are developed as a general framework for reporting on economic, environmental and social performance of a bank. In 2016, the Sustainability Reporting Standards (SRS) were further elaborated based on the GRI G4 guiding principle. The study conducted in Germany banks showed positive relationship between digitization and sustainable bank reports (Diener & Spacek, 2021). If the sustainability reports have been prepared by GRI standards, there were no significant differences between the compared countries such as Finland and Sweden (Magdalena, 2021).
Research Context
The research was conducted in an international bank that operates in Serbia. The banking sector has been chosen as the research context for the following key reasons: the banking sector is a vital service industry in any economy, and when it is competitive and efficient, it is able to spur positive impact on other industries. Over the past three decades, the banking sector in Serbia has witnessed substantial changes (Kontic & Kontic, 2009; 2012, 2022). There is evidence of a decrease in the number of banks, a dissolution of small, non-viable banks, and acquisitions. As a consequence of this process, competition in the banking sector is highly intensified. In the selection process of a focus bank, three main criteria were used: (1) the access to the bank, (2) bank’s competitive position, (3) previous sustainability activities in Serbia.
The selected Bank is one of the leading financial institutions in the Serbian market, with a network of 126 branches and 5 corporate banking centers. In December 2021, Bank merged another bank. The market share is 6.5% of the lending market in Serbia (National Bank of Serbia, 2021). The Bank is continuously committed to investing in the development of local communities, and has received numerous rewards and commendations.
Methodology Sample
The sample was distinguished by gender; age, education level, work experience, and bank’s region. 50.3% of managers were females and 49.7% were males. 68.2% of managers were aged up to 40, and 31.8% were aged over 40. The majority of observed managers had a high school or college degree (53.4%) and faculty level education (43.6%) as well as over 10 years of experience in banking. In the study, managers from Belgrade (27.7%), Niš (23.4%), Kragujevac (24.1%), and Vojvodina (24.8%) regions participated.
65
Strategic Aspects of Sustainability and Digital Transformation: A Study in an International Bank
Ljiljana Kontić Jovan Kontić
Research Instrument
The self-assessment tool developed by Bonnet et al. (2015) comprises of 32 questions to assess an organization‘s stage in an aforementioned model. The questionnaire was translated into Serbian language and distributed to 355 managers in one bank. Respondents were asked to indicate their current views of internal factors divided by items in their organizations on the scale from 1 - strongly disagree to 5 - strongly agree. The main question was: How digitally mature is your bank?
The original scale comprised a score between 1 to 6 for each item. However, the overall score legend has been modified. Therefore, if the overall score is between 10-20.5 organization is in the stalling stage; from 20.6 to 30.5 in initiating stage; between 30.6-40.5 in the engaging stage, and from 40.6 to 50 in the self-reinforcement stage of digital transformation.
The manual presented by the authors of the original study had been used (Capgemini Consulting, 2013, p. 14):
“1. Assign a score between 1 and 5 for each item;
2. Calculate the score per factor by averaging the scores for items under that factor;
3. Sum the average scores calculated to get the overall score for the Organization;
4. Compare the overall score with the overall score legend to understand the organization’s digital maturity;
5. Identify which factor requires most improvement, and
6. Undertake a relative comparison between the average scores per factor”.
The data about sustainability were sourced from publicity available information (primarily bank Web site, Annual and Corporate social responsibility reports). The content analysis has included all three dimensions of sustainability i.e. economics, environmental and social.
The research took place in a three-month period (from February to April 2022). One day, researchers directly distributed questionnaires in the Bank’s facilities. To other respondents, we sent an electronic version via email.
Data Analysis
For the purpose of data analysis, both quantitative and qualitative methods were computed. We used multiple regression, and factor analysis as quantitative methods. In this study, factors were extracted according to the Principal Component Analysis. After extracting the factors, Promax rotation with Kaiser Normalization was applied. Rotation converged in 25 iterations. Data analysis was conducted using SPSS Statistics V25. In this study, the content analysis has been used as qualitative method.
66 Banking 2023
Ljiljana Kontić Jovan Kontić
Results and Discussion
The results of descriptive statistics showed the overall score was 41 of 50, according to Bonnet et al. (2015), the Bank was in the self-reinforcing stage of digital transformation.
The results of the reliability analysis showed that the questionnaire is adequate for investigating phenomena of digital transformation in the Serbian bank. All four of factors had Cronbach’s Alpha higher than 0.70:
• Digital-first mindset (Cronbach’s Alpha was 0.741).,
• Digitized practices (Cronbach’s Alpha is 0.930),
• Empowered talent (Cronbach’s Alpha is 0.811), and
• Data access and collaboration tools (Cronbach’s Alpha is 0.793).
In the questionnaire, the factor Digital-First Mindset consists of only two items. It will be better if more items are included in the next study. Factor Practices embodied digitized operations, data-driven decisions, and collaborative learning had been explained by 12 items in questionnaire. Three items in the domain of Talents including technology experience, digital skills, and high engagement, explained 66.021% of total variance. Four items of Data Access and Collaboration Tools explained 78.406% of total variance (See Table 1).
67
Factors and items Factor I: Digital-first mindset We take advantage of digital solutions whenever possible 9.168 Employees think of digital technologies when they consider ways to improve. 1.389 Factor II: Practices - digitized operations, data-driven decisions, collaborative learning The core operational processes are automated and digitized 0.775 Employees monitor operations in real time. 0.673 Transactions with suppliers are digitized. 0.521 Processes are standardized. 0.481 We make decisions based on data and analytic 0.344 We define clear expectations and metrics for roles 0.313 We systematically gather and analyze data 0.292 Leaders encourage collaborative problem solving 1.913 Collaborating is multidisciplinary as well as across specialties 1.750 The culture of experimentation and learning are promoted in organization 0.824 We have centralized and decentralized decision-making process 0.624 Our values are transparent and open 0.496
Table 1 - Results of Factor Analysis
Extraction
Sums of Squared Loading (total)
Strategic Aspects of Sustainability and Digital Transformation: A Study in an International Bank
Ljiljana Kontić Jovan Kontić
Factor III Talents - technology experience, digital skills, high engagement
The COVID-19 pandemic introduced initiatives for changing the Bank’s model in the future. Therefore, the following projects have been initiated: Smart Working (i.e. tele-working technology, design of office space, organization redesign, digital communication), retail projects (i.e. network efficiency, self-service banking, predictive analytic, and cost efficiency). In March 2020, the following organizational and operational projects have been realized (Bank Report, 2020, p. 67):
• Full automation of international payments and ten days reporting,
• Adoption of cloud-based collaboration tool,
• Policy for the conduction of meetings,
• Full adoption of electronic workflow system for the internal circulation and signing of documents.
Since 2014, the Bank’s sustainability reports had been added to Annual financial reports. The results of sustainability reporting in the observed bank are presented in Table 2.
Table 2 - Sustainability Reporting at the Bank
GRI AREA AND INDICATORS
CATEGORY: ECONOMICS– GRI 200
ASPECT: ECONOMIC PERFORMANCES –MANAGEMENT APPROACH GRI 201
ASPECT: PROCUREMENT PRACTICES – MANAGEMENT APPROACH GRI 204
ASPECT: ANTI-CORRUPTION - MANAGEMENT APPROACH GRI 205
68
Employees have experience with mobile devices and applications. 4.013 Employees have experience with social media tool and data 1.411 Employees have experience with meta data 1.178 Employees have experience with artificial intelligence 0.290 Employees have experience with the internet 0.780 Employees have digital skills 0.678 Employees have the skills necessary to conduct digital transformation 0.826 Employees are self-motivated 0.620 Employees are highly competent 0.979 Employees have entrepreneurial instincts 0.356 Factor IV Data Access and Collaboration Tools - real-time customer data, integrated operations data Communication and collaboration tools are developed. 2.844 Employees have access to flexible computing power and storage. 1.082 Real-time customer data 0.841 Integrated end-user data 0.722 Integrated financial data 0.637 Integrated operational performance data 0.537 Integrated product/service performance data 0.337 Integrated supply-chain performance data 0.325 Source: Authors’ calculation
Banking 2023
2021
Ljiljana Kontić Jovan Kontić
2020
CATEGORY: ENVIRONMENTAL MANAGEMENT APPROACH GRI 300
ASPECT: ENERGY - MANAGEMENT APPROACH GRI 302
302-1 ENERGY CONSUMPTION WITHIN THE ORGANISATION
302-3 ENERGY INTENSITY
302-4 REDUCTION OF ENERGY CONSUMPTION
ASPECT: WATER - MANAGEMENT APPROACH GRI 303
ASPECT: EMISSIONS - MANAGEMENT APPROACH GRI 305
305-1 DIRECT GREENHOUSE GAS (GHG) EMISSIONS (SCOPE 1)*
305-2 INDIRECT GREENHOUSE GAS (GHG) EMISSIONS (SCOPE 2)*
305-4 GREENHOUSE GAS (GHG) EMISSIONS INTENSITY
ASPECT: EFFLUENTS AND WASTE - MANAGEMENT APPROACH GRI 306
ASPECT: SUPPLIER ENVIRONMENTAL ASSESSMENT -MANAGEMENT APPROACH GRI 308
CATEGORY: SOCIAL – MANAGEMENT APPROACH GRI 400
ASPECT: EMPLOYMENT - MANAGEMENT APPROACH GRI 401
401-1 NEW EMPLOYEE HIRES AND EMPLOYEE TURNOVER
401-3 PARENTAL LEAVE
ASPECT: OCCUPATIONAL HEALTH AND SAFETY -MANAGEMENT APPROACH GRI 403
ASPECT: TRAINING AND EDUCATION - MANAGEMENT APPROACH GRI 404
404-1 AVERAGE HOURS OF TRAINING BY EMPLOYEE CATEGORY
404-2 PROGRAMMES FOR UPGRADING EMPLOYEE SKILLS AND TRANSITION ASSISTANCE PROGRAMMES
404-3 PERCENTAGE OF EMPLOYEES RECEIVING REGULAR PERFORMANCE AND CAREER DEVELOPMENT REVIEWS
ASPECT: DIVERSITY AND EQUAL OPPORTUNITY -MANAGEMENT APPROACH GRI 405
ASPECT: HUMAN RIGHTS ASSESSMENT -MANAGEMENT APPROACH GRI 412
ASPECT: LOCAL COMMUNITIES - MANAGEMENT APPROACH GRI 413
ASPECT: MARKETING AND LABELLING - MANAGEMENT APPROACH GRI 417 (includes former indicator FS16- Initiatives to enhance financial literacy by type of beneficiary)
ASPECT: CUSTOMER PRIVACY - MANAGEMENT APPROACH GRI 418
SECTOR-SPECIFIC ASPECTS ACCORDING TO GRI FINANCIAL SECTOR DISCLOSURES
ASPECT: PRODUCT AND SERVICE PORTFOLIO -MANAGEMENT APPROACH (former indicators FS1, FS2, FS3, FS4, FS5)
Source: Bank Report (2020): 112-116. Bank Report (2021): 118-122.
Legend: Fully met, Partially met, Not met
The content analysis showed that the following aspects have been partially met in the observed bank: reduction of energy consumption, direct greenhouse gas (GHG) emissions (scope 1), indirect greenhouse gas (GHG) emissions (scope 2), parental leave, programmes for upgrading employee skills and transition assistance programmes. Others have been fully met. There were no aspects that have been not met. The next important issue is the social product of the Bank. Direct economic value generated and distributed is presented in Table 3.
69
Strategic Aspects of Sustainability and Digital Transformation: A Study in an International Bank
Ljiljana Kontić Jovan Kontić
Table
The content analysis of the Sustainability Report in 2020 and 2021 showed that in the observed Bank the followed aspects have been partially met: reductions of energy consumption, direct and indirect greenhouse gas emissions, parental leave, and programmes for upgrading employees’ skills and transition assistance programmes. This goes in line with the previous study (Knezevic et al., 2018).
Guidelines are specific in the area of the bank’s impact on environment. Environmental indicators in GRI specific guidelines cover performance related to inputs (e.g., material, energy, water), and outputs (e.g., emissions, effluents, waste). Specific energy GRI indicators are presented in Table 4.
Table 4 - Specific Energy Indicators
Source: Bank Report (2020): 112-116. Bank Report (2021): 105-107.
70
GRI AREA AND INDICATORS 2020 2021 ASPECT: ENERGY - MANAGEMENT APPROACH GRI 302 302-1 ENERGY CONSUMPTION WITHIN THE ORGANISATION 2.962.38 kWh 3.065.44 kWh ASPECT: WATER - MANAGEMENT APPROACH GRI 303 303-5 WATER WITHDRAWAL 6.799 m 9.810 m 3 3 Banking 2023
Ljiljana Kontić Jovan Kontić
Bank’s contribution to the social product In RSD million 2020 2021 Bank turnover 9.482 10.108 Interest and fees expenses -1.518 -1.871 Provisions -1.434 -832 I Employees Gross salaries 2.339 2.547 Health and social insurance 691 731 Income tax 173 186 Total 3.203 3.464 II Suppliers of goods and services 2.995 3.948 III Donations/Sponsorships 14 12 IV State Income tax and other taxes 71 70 VAT 0 0 Deposit insurance 386 414 Health and social insurance -691 -731 Income tax -173 -186 Total -407 -433 V Bank profit 725 414 Social Product 6.530 7.405 Source: Bank Report (2021):25.
3 - Direct Economic Value Generated and Distributed
Based on the Banks Report (2020), the analysis in this study has been included data about new employee hires - 139, turnover rate - 9.5%, total hours of training - 21.920, as well as average hours of training per manager - 10.50 and employee - 11.50. Specific indicators regarding training and education and diversity is presented in Table 5.
Table 5 - Specific training and education and diversity indicators
ASPECT: TRAINING AND EDUCATION - MANAGEMENT APPROACH
Percentage of participation of women/men in committees under the Executive Board
Percentage of women/men in all bodies
Source: Bank Report (2021): 88-89.
In March 2020, two major projects have been implemented by IT professionals (Kontic&Kontic, 2022). They moved all equipment and installation from the Bank’s facilities to employees’ home, and included the Bank into a regulatory project that has been introduced by the National Bank of Serbia.
CONCLUSIONS
The banking sector is important for sustainable economic development. The correlation between digital transformation and sustainability is well explored in developed countries i.e., Australia, Canada, Denmark, France, Germany, Greece, Italy, Norway, Portugal, Spain, Switzerland, the United Kingdom, and the United States of America, contrary to few studies treating developing countries. This study contributes to better understanding sustainability and digital transformation in developing countries.
The results of the Reliability Analysis showed that the questionnaire is adequate for investigating phenomena of digital transformation in the selected bank. All four factors had Cronbach’s Alpha higher than 0.70. Therefore, the methodology developed in one cultural context can be used in a different environment.
71
GRI 404
TRAINING
GRI AREA AND INDICATORS 2020 2021 Percentage of employees who attended at least one training program 84.86 88.07 % of internal training programs compared to % of external programs 47.91 71.27 Percentage of e-learning hours 96.64 97.98 Number of conducted training programs 75 127
DIVERSITY AND EQUAL OPPORTUNITY -MANAGEMENT APPROACH GRI 405
404-1 AVERAGE HOURS OF
BY EMPLOYEE CATEGORY
ASPECT:
of participation of women/men in the Board of Directors 27.27 Women 72.72 Men 40 Women 60 Men
Percentage of participation of women/men in the Executive Board Percentage
Men
Women 64 Men
31.25 Women 68.75
36
Strategic Aspects of Sustainability and Digital Transformation: A Study in an International Bank
Ljiljana Kontić Jovan Kontić
It will be better if more items are included in a subsequent study regarding the Digital-First Mindset factor. The Practices factor embodying digitized operations, data-driven decisions, and collaborative learning had been explained by 12 items in questionnaire. Three items in the domain of Talents including technology experience, digital skills, and high engagement, explained 66.021% of total variance. Four items of Data Access and Collaboration Tools explained 78.406% of total variance.
The Bank was in a self-reinforcing stage of digital transformation. It means that the Bank “has become a digital organization able to rapidly reorganize and self-organize to take advantage of digital opportunities” (Capgemini Consulting, 2013: 15). A strategy for bank’s managers can be summarized as using organizational capabilities to explore new chances. Precisely, competent employees and digital-first mindset enable managers to highlight new technologies in the Bank. Digitized practices enable quick responses to clients’ needs and identifying new trends (Capgemini Consulting, 2013). Also, it is possible to use collaboration within and beyond the bank to quickly form new partnerships.
The results of the sustainability reporting in the observed bank showed a lack of reporting in the domain of reductions of energy consumption, direct and indirect greenhouse gas emissions, parental leave, and programmes for upgrading employees’ skills and transition assistance programmes. These GRI indicators should be better evidenced by the bank’s managers.
The high rate of employees’ turnover points to a need for a new human resources strategy. Together with gender equity issues, this will be one of the future challenges of the Bank’s management.
The results are based on single case study. Therefore, the study has limited generalizability, despite the fact that the selected Bank has been strategically selected based on market share and financial performance. Also, translating sensitive research instruments always involves various linguistic and cultural issues. Future studies will include more banks from the Serbian banking sector and similar environments with a similar cultural background i.e., Montenegro, Croatia, Bosnia and Herzegovina, Macedonia.
References
1. Aracil, E., Nájera-Sánchez, J. J., & Forcadell, F. J. (2021). Sustainable banking: A literature review and integrative framework. Finance Research Letters, 42, 1019-1032.
2. Bank Report (2020). Annual Report & Corporate Responsibility Report 2020. Belgrade. 128pp.
3. Bank Report (2021). Annual Report & Corporate Responsibility Report 2021. Belgrade. 128pp.
4. Bhardwaj, B. R., & Malhotra, A. (2013). Green banking strategies: sustainability through corporate entrepreneurship. Greener Journal of Business and Management Studies, 3 (4), 180-193.
5. Bonnet, D., Puram, A. D., Buvat, J., KVJ, S., & Khadikar, A. (2015). Organizing for digital: why digital dexterity matters. Capgemini Consulting, 16pp. https://www.capgemini.com/ consulting/wp-content/uploads/sites/30/2017/07/digital_orgns_cover_08-12.pdf (access: 22.7.2022)
6. Bouma, J. J., Jeucken, M., & Klinkers, L. (Eds.). (2017). Sustainable banking: The greening of finance. Routledge.
72
Banking 2023
Ljiljana Kontić Jovan Kontić
Strategic Aspects of Sustainability and Digital Transformation: A Study in an International Bank
7. Capgemini Consulting (2013). Accelerating Digital Transformation. https://www.capgemini. com/fi-en/wp-content/uploads/sites/27/2017/07/digital_transformation_review_iv_ 20-05.pdf (access: 23.7.2022)
8. Carè, R. (2018). Sustainable Banking. Issues and challenges. Cham: Palgrave Pivot.
9. da Silva Inacio, L., & Delai, I. (2021). Sustainable banking: a systematic review of concepts and measurements. Environment, Development and Sustainability, 1-39.
10. Diener, F., & Špaček, M. (2021). Digital transformation in banking: A managerial perspective on barriers to change. Sustainability, 13 (4), 20-32.
11. Forcadell, F. J., & Aracil, E. (2017). Sustainable banking in Latin American developing countries: Leading to (mutual) prosperity. Business Ethics: A European Review, 26 (4), 382-395.
12. Forcadell, F. J., Aracil, E., & Úbeda, F. (2020). The impact of corporate sustainability and digitalization on international banks’ performance. Global Policy, 11, 18-27.
13. Global Reporting Inicitive - GRI (2013). G4-Sector Disclosures- Financial services. https://www. globalreporting.org/.../GRI-G4-Financial-Services (access: 22.7.2022)
14. Kitsios, F., Giatsidis, I., & Kamariotou, M. (2021). Digital transformation and strategy in the banking sector: Evaluating the acceptance rate of e-services. Journal of Open Innovation: Technology, Market, and Complexity, 7(3), 204.
15. Knežević, G., Pavlović, V., & Stevanović, S. (2018). Upgrading waste management and sustainability reporting in banking industry: Evidence from Serbia. Industrija, 46 (3), 163-183.
16. Kontić, J., & Kontić, Lj. (2009). Mergers and acquisitions in banking sector. Bankarstvo, 38(5-6), 90-105.
17. Kontić, Lj., & Kontić, J. (2012). Sustainability and readiness for change: Insights from a banking case study in Serbia. Amfiteatru Economic, 14 (32), 537.
18. Kontić, Lj., & Kontić, J. (2022). Implementation of Balanced scorecard in domestic commercial bank. Bankarstvo, 51 (1), 126-143. https://doi.org/10.5937/bankarstvo2201126K
19. Magdalena, I. M. (2021). Sustainability reporting disclosure within banking industry in Finland and Sweden.
20. National Bank of Serbia (2021). Financial statements of banks. https://nbs.rs/en/finansijske-in stitucije/banke/bilans-stanja/index.html (access on July 21th, 2022).
21. Nosratabadi, S., Pinter, G., Mosavi, A., & Semperger, S. (2020). Sustainable banking; evaluation of the European business models. Sustainability, 12(6), 2314.
22. Shershneva, E. G. E., & Kondyukova, E. S. (2020, February). Green banking as a progressive format of financial activity in transition to sustainable economy. In IOP conference series: Materials science and engineering (Vol. 753, No. 7, p. 072003). IOP Publishing.
23. Theiri, S., & Alareeni, B. (2021). Perception of the digital transformation as a strategic advantage through the Covid 19 crisis? case of Tunisian banks. Journal of Sustainable Finance & Investment, 1-22.
24. Tsindeliani, I. A., Proshunin, M. M., Sadovskaya, T. D., Popkova, Z. G., Davydova, M. A., & Babayan, O. A. (2022). Digital transformation of the banking system in the context of sustainable development. Journal of Money Laundering Control, 25(1), 165-180.
25. Yip, A. W., & Bocken, N. M. (2018). Sustainable business model archetypes for the banking industry. Journal of cleaner production, 174, 150-169.
26. Waller, S. (2017, March 18). Be Digital Ready. Retrieved from Simon Waller: simonwaller.live
27. Weber, O. (2017). Corporate sustainability and financial performance of Chinese banks. Sustainability Accounting, Management and Policy Journal.
73
Ljiljana Kontić Jovan Kontić
rad
Datum prijema: 02.03.2023. god. Datum prihvatanja: 28.03.2023. god.
TROŠAK KAPITALA – EFEKTI NA
VREDNOST I PROFITABILNOST
PREDUZEĆA: EVIDENCIJA ODABRANE
SKUPINE PREDUZEĆA NA SARAJEVSKOJ I BANJALUČKOJ BERZI
Prof. dr Almir Alihodžić redovni profesor, Ekonomski fakultet Univerziteta u Zenici almir.dr2@gmail.com
Rezime: Prosečno ponderisana stopa povrata predstavlja stopu koju preduzeća moraju platiti akcionarima i kreditorima. Dakle, to je prilagođena diskontna stopa prema rizicima za novčane tokove preduzeća. U radu će se proračunati prosečna ponderisana stopa povrata za odabranu skupinu preduzeća koja kotiraju na Sarajevskoj i Banjalučkoj berzi hartija od vrednosti, kao i pokazatelji profitabilnosti ROA, ROE i neto profitna marža. Dakle, osnovni cilj ovog rada je da se istraži da li postoji međuzavisnost u kretanju prosečne ponderisane stope povrata i indikatora profitabilnosti odabrane skupine preduzeća u sastavu berzanskih indeksa SASX-30 i BIRS. Rezultati istraživanja pokazuju da se WACC kreće u rasponu od minimalnih 5.11% do maksimalnih 10.87%. Isto tako rezultati istraživanja pokazuju da egzistira negativna povezanost i korelacija između WACC, s jedne strane i odabrane skupine pokazatelja profitabilnosti, sa druge strane.
Ključne reči: trošak akcijskog kapitala, WACC, korelacija, beta koeficijent, ROA, ROE, neto profitna marža.
JEL klasifikacija: G10, G12, G23
74
Pregledni naučni
Bankarstvo 2023
DOI: 10.5937/bankarstvo2301092A
Uvodna razmatranja
Finansije su veoma važne za celi privredni sektor kao i za njegove učesnike, odnosno za opstanak, rast i širenje poslovanja, što su tri glavna cilja svake organizacije. Finansijski učinak je mera koliko dobro preduzeće može da koristi sredstva od svoje glavne delatnosti. Finansiranje nije besplatno jer prouzrokuje oportunitetni trošak za investitora, što svakako predstavlja prihod koji bi on zaradio da je uložio sredstva u sledeću najbolju alternativu.
Najvažniji metod u saopštavanju finansijskih informacija o finansijskom položaju i finansijskom uspehu preduzeća su svakako finansijski izveštaji. Dakle, ako preduzeće želi da prikupi sredstva na međunarodnom tržištu kapitala ili da investira u stranoj zemlji, investitori ili vlasnici preduzeća treba da analiziraju finansijske informacije uz pomoć finansijskih izveštaja.
U ovoj eri globalizacije i konkurentnog poslovnog sveta, odluke o finansiranju igraju značajnu ulogu u održavanju profitabilnosti preduzeća. Iako su se mnoge teorije finansiranja pojavile tokom vremena, nijedna od njih ne može u apsolutnoj meri sugerisati na optimalan nivo strukture kapitala. Izbor strukture kapitala je jedna od najvažnijih odluka za preduzeća jer može uticati na zaradu akcionara i vrednost preduzeća. Preduzeća se pored finansiranja sopstvenim kapitalom finansiraju i zaduživanjem, odnosno pozajmljivanjem finansijskih sredstava, bilo od strane banaka, pojedinaca i ostalih izvora. Na pozajmljeni iznos preduzeće plaća kamate, odnosno plaća cenu svoga zaduživanja. Plaćanje koje preduzeće vrši za kamate, služi mu za smanjenje poreske osnovice jer se kamate priznaju kao rashodi. Oslanjanje u većem obimu na finansiranje putem duga moglo bi povećati rizik preduzeća i konačno troškove stečaja preduzeća. S druge strane, finansiranje izdavanjem akcija i izbegavanjem duga moglo bi poslati pogrešne signale investitorima o finansijskom statusu preduzeća, što bi moglo povećati mogućnost neprijateljskog preuzimanja. Preduzeća pokušavaju da pronađu optimalnu strukturu kapitala koja će uticati da se minimizira ukupni trošak kapitala.
WACC se služi diskontnom stopom za projekte koje je preduzeće preuzelo (Ross, 2007). Obično viša diskontna stopa rezultira manjim novčanim tokovima i to konsekventno rezultira manjim novčanim tokovima, i na kraju implicira nisku neto sadašnju vrednost projekta. Projekat niske neto sadašnje vrednosti dovodi do pada profitabilnosti preduzeća (Miglo, 2012).
Ovo istraživanje će se baviti proračunom prosečne ponderisane stope povrata koju preduzeće mora platiti akcionarima i kreditorima. Za prosečnu ponderisanu stopu povrata obično se kaže da odražava rizik budućih novčanih tokova za kreditore i akcionare. Dato je prihvatljivo, jer je izveden trošak kapitala iz očekivanih budućih plaćanja akcionarima, zatim trošak duga iz stope koju zahtevaju kreditori preduzeća za novac koji pozajmljuju. S tim u vezi se može reći da prosečna ponderisana stopa povrata predstavlja ponderisani prosek rizičnosti novčanih tokova akcionara i kreditora (Vukičević i ostali, 2010). U istraživanju će biti takođe proračunati indikatori profitabilnosti poslovanja odabrane skupine preduzeća koja se kotiraju na Sarajevskoj i Banjalučkoj berzi hartija od vrednosti. Statistički alat koji će se koristiti za pronalaženje uticaja cene kapitala na profitabilnost preduzeća biće korelaciona analiza.
75
Prof. dr Almir Alihodžić
Trošak kapitala – efekti na vrednost i profitabilnost preduzeća: Evidencija odabrane skupine preduzeća na Sarajevskoj i Banjalučkoj berzi
Rad je struktuiran iz pet delova. Prvi deo odnosi se na uvodna razmatranja sa akcentom na opis definicije prosečno ponderisanog troška kapitala. Drugi deo opisuje pregled dosadašnjih istraživanja u kontekstu uticaja prosečno ponderisanog troška kapitala na indikatore profitabilnosti poslovanja. Treći deo opisuje izabranu metodologiju istraživanja, sa posebnim fokusom na potrebne formule za proračun prosečnog ponderisanog troška kapitala i indikatora profitabilnosti. Četvrti deo odnosi se na podatke neophodne za analizu. Peti deo predstavlja dobijene rezultate istraživanja, kao i određena zapažanja i preporuke.
Pregled relevantne literature
Struktura kapitala je način finansiranja imovine preduzeća kroz određenu kombinaciju vlasničkih, dužničkih ili hibridnih hartija od vrednosti. Dakle, struktura kapitala preduzeća je sastav njegovih obaveza (Khadka, 2007). Prema teoriji Modigliani-Miller, vrednost preduzeća se određuje kroz profitabilnost, bez obzira na strukturu kapitala. Ne postoji direktna veza između profitabilnosti i strukture duga, kao i WACC preduzeća (Higgins, 2005). Prema studiji koju su sproveli Hussain i Chakraborty (2010) na primeru 24 komercijalne banke koje su kotirane na berzi u Dhaka u Bangladešu u periodu od januara 2006. godine, do decembra 2008. godine, došli su do zaključka da postoji jaka negativna korelacija između troška kapitala i prinosa komercijalnih banaka.
Profitabilnost ima značajno negativnu vezu sa leveridžom i kratkoročnim finansiranjem kada je izvor samo eksterno finansiranje i kada su dividende fiksne, tako da se profitabilnost negativno menja sa promenom nivoa leveridža (Rajan i Zingales, 1995).
Chowdhury i Chowdhury (2010) su pokušali da objasne odnos strukture kapitala i vrednosti preduzeća u Bangladešu, i otkriju da optimalna ravnoteža duga i kapitala može maksimizirati zahteve akcionara za bogatstvom. Takođe su zaključili da trošak kapitala treba da bude što niži, jer negativno utiče na izbor strukture kapitala.
Prema studiji koju su sproveli Tashfeen and Liton (2010) postoji jaka negativna korelacija između cene kapitala komercijalnih banaka i njihovih prinosa. Analiza je sprovedena na 24 kotirane komercijalne banke na berzi u Daki, Bangladešu u periodu od januara 2006., do decembra 2008. godine.
Momčilović i Vlahović Begović (2020) su ispitivali vezu između prosečne ponderisane cene kapitala i koeficijenata profitabilnosti za četiri kompanije. Autori ističu da iako se očekuje da kompanije sa najnižim WACC imaju najviše ključne koeficijente profitabilnosti, rezultati istraživanja pokazuju drugačije. Takođe, autori ističu da ima smisla koristiti skupe izvore kapitala sve dok se kapital koristi na profitabilan način.
Singapourwoko i El-Wahid (2011) su sproveli istraživanje na 48 kompanija za period od 2003 do 2008. godine, koje kotiraju na Indonežanskoj berzi i pronašli su značajan pozitivan odnos između leveridža i profitabilnosti. S druge strane, Ragil i Solimon (2014) su pronašli različite rezultate sprovodeći studiju na 60 kotiranih preduzeća iste berze. Uzorak su podelili u dva klastera, i to 30 malih preduzeća i 30 velikih preduzeća. Rezultati su pokazali značajan negativan odnos za niži klaster, te beznačajan odnos leveridža i vrednosti preduzeća za gornji klaster, tj. velika preduzeća.
76
Prof. dr Almir Alihodžić Bankаrstvo 2023
Hussain i Islam (2012) su pronašli negativnu korelaciju između prinosa na kapital i ponderisanog prosečnog troška kapitala. U njihovom istraživanju je primenjen ponderisani prosečni trošak kapitala u odnosu na model premije rizika, Gordonov model, kao i Fama-French model na industriju cementa iz Pakistana. Rezultati istraživanja su izmerili uravnotežen uticaj troška kapitala na prinos na kapital u industriji cementa, pod pretpostavkom da nivo menadžerske, kao i operativne kompetencije u svim preduzećima koja posluju u ovoj industrijskoj grani i dalje ostaju nepromenjeni.
Sharma (2012) je uradio analizu troškova kapitala i profitabilnosti telekomunikacijskog sektora. Cilj autora je bio da analizira odnos između cene kapitala i profitabilnosti preduzeća. Autor je otkrio da visoka cena kapitala negativno utiče na profitabilnu poziciju preduzeća. Takođe, autor sugeriše da su finansije važan aspekt za svaki posao, te da se koriste odgovarajući izvori finansiranja, kako bi se osiguralo da je cena kapitala pod odgovarajućom kontrolom. Svakako alati su kalkulacije i formule cene kapitala.
Gilchrist i Zakrajsek (2007) su ispitivali u svojoj studiji odnos ulaganja i cijene kapitala koristeći tržište korporativnih obveznica kao dokaz. Oni su se fokusirali na varijacije koje se javljaju u kamatnim stopama na investicionu potrošnju i njihove efekte na odluke o investiranju. Primenjen je regresioni model i zaključeno je da povećanje cene kapitala za 1 odsto dovodi do smanjenja ulaganja od 50 do 70 poena.
Frank i Goyal (2009) su istraživali strukturu kapitala američkih kompanija za period od 1950 do 2003. godine, i otkrili su doslednost sa modelom kompromisa. Dakle, američka preduzeća koriste kvalitetne eksterne izvore finansiranja za svoje poslovanje, pod uslovom da je trošak kapitala relativno nizak.
Bhayani (2009) je analizirao uticaj finansijske poluge na prosečnu cenu kapitala. Istraživanje je sproveo na odabranom uzorku cementnih preduzeća u Indiji za period od 2000 do 2008. godine. Izračunao je finansijski leveridž i ponderisanu prosečnu cenu kapitala i uporedio ih je koristeći koeficijent korelacije i analizu t-testa. Došao je do zaključka da nema uticaja finansijske poluge na cenu kapitala u industriji cementa u Indiji. Takođe, ustanovio je pozitivnu korelaciju između kompanija sa visokom i niskom polugom u odnosu na cenu kapitala.
Bhatnagar i ostali (2015) istraživali su identifikovanje optimalne strukture kapitala i cene kapitala. Dakle, pokušali su da analiziraju uticaj strukture kapitala i cene kapitala na maksimizaciju bogatstva akcionara proučavajući 12 kompanija sa najvećim neto vrednostima koje kotiraju na berzi. Alate koje su koristili za analizu su regresiona analiza, te korišćenje aritmetičke formule za izračunavanje strukture kapitala, bogatstva akcionara i cene kapitala. Rezultati studije pokazali su da postoji linearnost između cene kapitala i maksimizacije bogatstva akcionara, dok s druge strane ne postoji veza ili linearnost između maksimizacije bogatstva akcionara i strukture kapitala. Autori sugerišu da pri donošenju odluke o maksimizaciji bogatstva akcionara, menadžment mora uzeti u obzir dugoročni uticaj na kompaniju, i mora uzeti u obzir sve one faktore koji su odgovorni za maksimizaciju bogatstva akcionara.
77
Prof. dr Almir Alihodžić
Trošak kapitala – efekti na vrednost i profitabilnost preduzeća: Evidencija odabrane skupine preduzeća na Sarajevskoj i Banjalučkoj berzi
Učkar i Urti (2015) su sproveli istraživanje na 24 preduzeća koja kotiraju na Zagrebačkoj berzi u sastavu berzanskog indeksa CROBEX, za period od 2011 do 2013. godine. Autori su pokušali ovim istraživanjem da dokažu uticaj finansijske strukture na poslovni rezultat, odnosno u kojoj meri struktura kapitala utiče na vrednost preduzeća. Kao varijable uzeli su zaduženost preduzeća, ROE i ROA. Rezultati istraživanja su pokazali kako nema tačnog odgovora koja teorija određuje strukturu kapitala. Sa druge strane utvrđeno je kako postoji negativna povezanost između strukture kapitala i poslovne izvrsnosti. Dakle, negativna povezanost nastaje kada je udeo zaduženosti u strukturi kapitala velik i na taj način utiče na slabljenje poslovne izvrsnosti.
Simmons i Banu (2016) su ispitivali ulogu cene kapitala, leveridža, dividendi i Tobinovog q pri donošenju odluke za korporativno ulaganje. Oni su otkrili vezu između datih nezavisnih varijabli sa investicijama uzimajući kvartalne podatke od 1987 do 2013. Za ispitivanje je korišćena VAR metodologija, gde su na kraju došli do zaključka da leveridž ima pozitivni efekat na investicije, dok trošak kapitala izaziva značajno negativan odgovor na ulaganja.
Bhargav (2017) je imao za cilj da analizira efekat finansijske poluge na cenu kapitala. Sproveo je istraživanje na uzorku od 28 kompanija koje kotiraju na Bombajskoj berzi za period od tri godine, tj. od 2013 do 2015. godine, u okviru berzanskog indeksa Sensex. Proračunao je odnos duga i kapitala i koeficijent pokrića kamata, kako bi analizirao odnos finansijske poluge i cene kapitala. U studiji je otkriveno da su finansijska poluga i cena kapitala u negativnoj korelaciji, jer dug smanjuje cenu kapitala i kamata se odbija od poreza. Otuda je podrazumevano da povećavanjem duga u strukturi kapitala preduzeće može da smanji cenu kapitala.
Parmjit i Neeti (2019) su ispitivali da li je trošak kapitala funkcija strukture kapitala ili ostaje nepromenljiv. Oni su pokušavali da analiziraju odnos između cene sopstvenog kapitala, cene kapitala, vrednosti firme i drugih finansijskih varijabli. Studija je rađena na 500 indijskih kompanija za period od 2008 do 2010. godine. Otkrili su da trošak kapitala ima uticaj na različite poslovne odluke na osnovu prirode delatnosti koja pomaže menadžerima da donose finansijske odluke kompanije da vodi firmu profitabilno. Autori sugerišu da prilikom donošenja odluka za finansijske varijable različiti faktori koji doprinose strateškoj efektivnosti treba, u prvom redu, razmotriti efikasnost preduzeća.
Metodologija istraživanja
Tržište kapitala u Bosni i Hercegovini spada u red malih rubnih tržišta kapitala (engl. frontier markets) koje karakteriše mala tržišna kapitalizacija i likvidnost, kao i relativna otvorenost i dostupnost za strane ulagače, ali i moguća veća ekonomska i politička nestabilnost, te potencijalno veći dugoročni povrat i mala korelacija sa drugim tržištima kapitala (Komisija za hartije od vrijednosti Republike Srpske, 2020). Izračunavanje dnevne stope prinosa na manjim tranzicijskim tržištima kakvo je i tržište kapitala u Bosni i Hercegovini predstavlja jedan od problema, s obzirom da nema jedinstvenog stajališta oko cene koju treba primeniti za proračun. U slučaju kada podaci o trgovanju unutar jednog dana nisu poznati, najčešće se koristi aritmetička sredina između najniže i najviše cene. Na razvijenim tržištima kapitala generalno se primenjuje zadnja cena kojom se trgovalo. Zadnja cena akcija se najčešće bira da bi se smanjila neusklađenost cena u okviru dnevnog trgovanja. Na tržištu kapitala u BiH uzimanje zadnje cene može dati iskrivljenu sliku stvarnih dnevnih događaja.
78
Prof. dr Almir Alihodžić Bankаrstvo 2023
Cene akcija na BiH tržištu u toku dana značajno variraju, gde zadnja cena predstavlja tek jednu od datih oscilacija, a ne korekciju cene kao na razvijenim tržištima kapitala. Još jedan bitan razlog nerealnosti primene zadnje cene je činjenica da sami investitori manipulišu, odnosno podižu zaključnu cenu, s obzirom da se vrednost portfolija po margin kreditima proračunava po zaključnim cenama, tako da se podizanjem zaključne cene izbegava obaveza prenosa dodatnih hartija od vrednosti na akcionarski račun banke, kod koje je podignut margin kredit. Imajući sve u vidu, logičan izbor predstavlja prosečna ponderisana cena. Dakle, prosečna ponderisana cena se dobija zbrajanjem cena pojedinih transakcija tokom dana i njihovim ponderisanjem obimom pojedine transakcije, na sledeći način (Alihodžić, 2011):
gde je:
- prosečna cena hartija od vrednosti;
- cena pri transakciji (i);
- odnos obima transakcija (i) i ukupnog obima trgovine tokom celog dana;
- obim transakcije (i); i

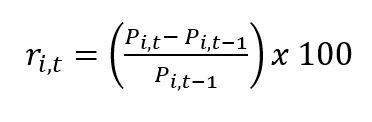
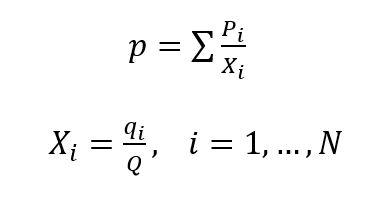
- ukupan obim trgovine tokom celog dana.
Na gore opisan način se dobija najrealnija prosečna cena po kojoj se može vršiti trgovina određenog dana. Ovo istraživanje se bazira na stopama prinosa najlikvidnijih akcija kojima se trguje na Sarajevskoj i Banjalučkoj berzi hartija od vrednosti. Isto tako, ovo istraživanje je zasnovano na dnevnim stopama prinosa u cilju dodatnog smanjenja problema niske likvidnosti. Usled nedostatka podataka o isplatama dividendi, dividende nisu uzete u obzir prilikom izračunavanja dnevnih stopa prinosa odabranih akcija preduzeća. Dnevni prinos pojedine akcije će se računati na sledeći način:
gde je:
- dnevni prinos akcije (i) za dan t;

- cena akcije (i) za dan t i
- cena akcije (i) za dan t-1.
Cene akcija odabranih preduzeća su preuzete sa web sajta Sarajevske berze hartija od vrednosti (www.sase.ba) i Banjalučke berze hartija od vrednosti (www.blberza.com) za period od 01.01.2018 do 31.12.2021. godine. Kao reper za tržišni portfolio u ovom istraživanju se koristi berzanski indeks Sarajevske berze SASX-30, kao i berzanski indeks Banjalučke berze BIRS. Dati indeksi su izabrani, zato što se smatraju visoko diversifikovanim i zato što opisuju stanje na većem delu tržišta kapitala u Bosni i Hercegovini.
79
(1) (2)
Prof. dr Almir Alihodžić
Trošak kapitala – efekti na vrednost i profitabilnost preduzeća: Evidencija odabrane skupine preduzeća na Sarajevskoj i Banjalučkoj berzi
Premija za rizik akcija se generalno definiše kao prosečna razlika stope prinosa na akcije u odnosu na niskorizičnu alternativu u vidu državnih obveznica ili trezorskih zapisa (Božović, 2021). Za premiju tržišnog rizika u ovom istraživanju se koristi premija rizika kapitala u Nemačkoj od 4.72%, što je preuzeto iz Damodoranove baze podataka (http://pages.stern.nyu.edu/~adamodar). Premija rizika u Bosni i Hercegovini koja iznosi 6.30% isto tako preuzeta je iz Damodaranove baze podataka (http://pages. stern.nyu.edu/~adamodar).
Da bi se procenila vrednost preduzeća koja koriste diskontovani novčani tok, potrebno je za prognozu slobodnog novčanog toka koristiti prosečni ponderisani trošak kapitala (engl. weighted average cost of capital- WACC), koji predstavlja oportunitetni trošak sa kojim se investitori suočavaju prilikom ulaganja svojih sredstava u jedan određeni posao, umesto u druge sa sličnim rizikom. Najvažniji princip koji leži u osnovi uspešne implementacije troška kapitala je doslednost između komponenti WACC i slobodnog toka gotovine. Ponderisani prosečni trošak kapitala (WACC) kombinuje stope prinosa koje zahtevaju vlasnici duga i vlasnici kapitala . Za preduzeće koje se finansira isključivo iz duga i kapitala WACC je definisan na sledeći način (Koller i ostali, 2010):
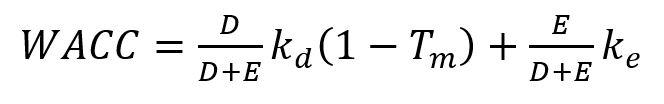
gde se dug (D) i kapital (E) mere korišćenjem tržišnih vrednosti. Iz prethodne jednačine se može primetiti kako je trošak duga smanjen za graničnu poresku stopu T_ . Razlog za ovo je što je poreski štit isključen iz slobodnog novčanog toka. S obzirom da poreski štit na kamatu ima vrednost on mora biti uključen u procenu. Metod diskontovanog novčanog toka prilikom vrednovanja preduzeća vrednuje poreski štit na način da smanjuje prosečni ponderisani trošak kapitala.

Da bi smo odredili ponderisanu prosečnu stopu kapitala za određeno preduzeće, potrebno je da se procene tri komponente WACC, i to: trošak kapitala, trošak duga nakon oporezivanja i ciljna struktura kapitala preduzeća. S obzirom da ni jedna varijabla nije direktno uočljiva koriste se različiti modeli, pretpostavke i aproksimacije za procenu svake komponente. Ovi modeli procenjuju očekivani prinos na alternativne investicije sa sličnim rizikom koristeći tržišne cene. Zbog toga se termin očekivani prinos koristi naizmenično sa troškom kapitala. Kako se trošak kapitala takođe koristi za alokaciju kapitala unutar preduzeća, on se isto može nazvati zahtevanim prinosom ili stopom povrata.
Postoji nekoliko načina za proračun troška trajnog kapitala. Jedan od načina za proračun troška trajnog kapitala je upotreba modela za vrednovanje kapitalne imovine (engl. Capital asset pricing model - CAPM), odnosno za računanje tražene stope povrata. Prema ovom modelu tražena stopa povrata računa se na osnovu sledeće jednačine (Vidučić, 2006):
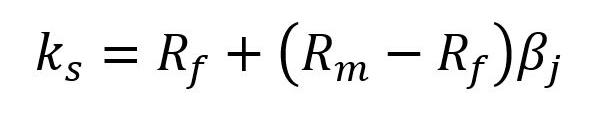
gde je:
– stopa povrata bez rizika;
- stopa povrata na tržišni portfolio i
- mera sistematskog rizika za dato preduzeće.
Prema preporuci Damodarana, trošak akcijskog kapitala za tržišta u razvoju se može proračunati primenom sledeće formule (Damodaran, 2015):
80
(3) (4)
Prof. dr Almir Alihodžić Bankаrstvo 2023
gde je:
r_f – bezrizična stopa na imovinu; _i- beta koeficijent odabrane skupine preduzeća; RP - označava tržišnu riziko premiju; i CRP- označava riziko premiju zemlje za Bosnu i Hercegovinu.

Prema Damodaran-u, premija rizika tržišta u razvoju sa političkim rizikom zemalja Istočne Evrope i Južne Amerike procenjuje se na 8.5% (Damodaran, 2002). Kako u Bosni i Hercegovini ne postoji zvanična statistika praćenja i računanja nerizične stope prinosa, u ovom istraživanju je uzeta prosečno ponderisana kamatna stopa na obveznice Vlade Federacije BiH od 0.75% i prosečna ponderisana kamatna stopa na obveznice Vlade Republike Srpske od 2.70%. Dakle, prosečna ponderisana kamatna stopa u ovom istraživanju iznosiće 1.72% (https://www.mft.gov.ba).
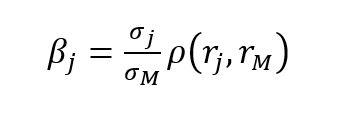

Troškove dugoročnog zaduženja za odabrana preduzeća koja se kotiraju na Sarajevskoj i Banjalučkoj berzi hartija od vrednosti ćemo proračunati na osnovu podataka iz poslednjih finansijskih izveštaja, pomoću sledeće formule (Kočović i ostali, 2016):
Beta koeficijent meri intenzitet promena prinosa na akciju prema promenama prinosa na ukupno tržište akcija. Dakle, beta koeficijent objašnjava za koliko će se promeniti stopa prinosa posmatrane akcije ako se stopa prinosa tržišnog portfolija promeni za 1. Kako je za tržište, odnosno za tržišni portfolio =1, ako akcija preduzeća ima >1 onda će uvećati rizik portfolija, a s druge strane ako ima <1 onda će umanjiti rizik portfolija. Empirijski je potvrđeno da za beta koeficijente važi statistička pojava koja se zove regresija prema sredini. To praktično znači da hartije od vrednosti koje imaju visoku betu, odnosno u jednom periodu, u budućnosti će u principu imati nižu betu. Važi i sledeće, da hartije od vrednosti sa niskom betom, odnosno <1 u budućem periodu će imati višu betu. U ovom istraživanju beta će se prilagoditi da se ocena iz uzorka pomnoži sa 2/3, a vrednost 1,0 sa 1/3, tako da će korigovana beta biti: (Korigovana _istorijska (Bodie i ostali, 2009). U ovom istraživanju beta koeficijent ćemo računati pomoću sledeće formule:
gde je:
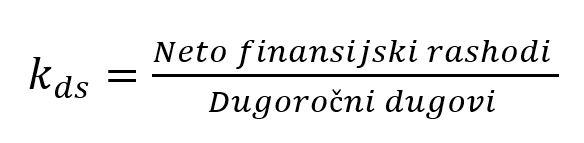
- standardna devijacija hartije od vrednosti j;
- standardna devijacija tržišta; i
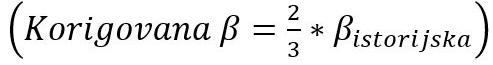


- koeficijent korelacije.

81
(5) (6) (7) 1 1
Simbol emitovanih obveznica Vlade Federacije BiH je FBH60321 i datum emisije je 30.06.2021. godine, dok je simbol emitovanih obveznica Vlade Republike Srpske RSBD-025 i datum emisije 24.03.2021. godine.
Prof. dr Almir Alihodžić
Trošak kapitala – efekti na vrednost i profitabilnost preduzeća: Evidencija odabrane skupine preduzeća na Sarajevskoj i Banjalučkoj berzi
S obzirom da trošak kapitala koristi Nemačku stopu bez rizika, kao i premiju za rizik kapitala koje su date u eurima, trošak kapitala za preduzeća koja su uzeta u razmatranje se procenjuje na sledeći način (Damodaran, 2009):
gde je
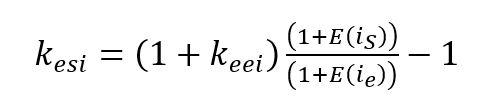
– očekivana inflacija u Bosni i Hercegovini i – očekivana inflacija u EU.
U cilju podrobnijeg analiziranja dobijenih rezultata u ovom istraživanju će pored prosečne stope prinosa i standardne devijacije odabrane skupine preduzeća biti proračunati i analizirani i viši momenti razdiobe oko sredine. Treći momenat oko sredine ili mera asimetrije (engl. skewness) opisuje odstupanja vrednosti numeričke varijable od aritmetičke sredine, kako bi prikazala način razmeštanja vrednosti varijable oko sredine (Lewis, 1973). Dakle, mera asimetrije se može definisati kao odnos trećeg momenta oko sredine i standardne devijacije na treću potenciju. Mera asimetrije se izračunava prema sledećoj formuli:
Pri normalnoj distribuciji mera asimetrije iznosi 0, odnosno jednaka je verovatnoća da se ostvari negativan ili pozitivan prinos. Mera asimetrije se obično kreće u intervalu ±2, a kada se radi o izrazito asimetričnom rasporedu prinosa poprima i veće vrednosti. Zaobljenost u okolini modalnog vrha krivulje distribucije frekvencija predstavlja spljoštenost (engl. kurtosis), koja se definiše kao odnos četvrtog momenta oko sredine i standardne devijacije na četvrtu potenciju (Šoškić i Serdar, 1994). Spljoštenost se u finansijama koristi za opisivanje ekstremnih događaja, odnosno onih događaja koji spadaju u sam rep distribucije. Spljoštenost se izražava pomoću sledeće formule:
U slučaju normalne distribucije spljoštenost iznosi 3. Čest uzrok nesporazuma pri oceni spljostenosti pojedine distribucije korišćenjem kompjuterskih programa za njegovo izračunavanje, jeste u tome što u većini matematičkih softverskih paketa, pa tako i u Microsoft Excelu, iznos spljoštenosti je već apriori umanjen za 3. Kako se mera povrata na ulaganje koristi u širokom spektru oblika sa drugim pokazateljima učinka, kao što je neto profit, ona je ovde ponovo eksplicitnije navedena u varijaciji prinosa na sredstva (ROA). Dakle, povrat sredstava uzima u obzir neto profit preduzeća, kao i troškove kamata i stavlja ih u vezu sa prosečnim ukupnim kapitalom koji obezbeđuju vlasnici kapitala i duga (Schmidlin, 2014):
82
(8) (9) (10) (11)
2023
Prof. dr Almir Alihodžić Bankаrstvo
Povrat na kapital (ROE) pokazuje prinos na kapital koji obezbeđuju akcionari. Da bi se izračunao ovaj važan koeficijent, neto profit se postavlja u odnosu na prosečni akcionarski kapital tokom poslovne godine. U proračunu je važno uneti neto profit i akcionarski kapital nakon što se odbiju manjinski interesi, kako bi se uzele u obzir samo brojke na koje akcionari stvarno imaju pravo.
Ovaj odnos daje investitorima iznos koji se može porediti između različitih preduzeća i mogućnosti ulaganja. Nizak prinos na sopstveni kapital ukazuje na neefikasnu upotrebu kapitala ili precenjenost njegove imovine (a samim tim i akcionarskog kapitala). Zbog svoje veze između neto dobiti i akcionarskog kapitala, prinos na kapital čini centralni koeficijent profitabilnosti za akcionare. Neto profitna marža pokazuje koliko se centi profita ostvaruje po dolaru prodaje. Posebno preduzeća sa odličnom tržišnom pozicijom, strogom kontrolom troškova i niskim nivoom duga pokazuju veoma visoke neto profitne marže. Neto profitna marža se izražava na sledeći način:
Tržišna moć i upravljanje troškovima imaju značajan uticaj na iznos neto profitne marže. Što je izraženija mogućnost prilagođavanja cena i istovremeno niži trošak, to je veća profitna marža. Iz datog razloga, preduzeća koja imaju monopolski ili oligopolski položaj obično pokazuju visoke neto profitne marže.
Podaci za analizu
Deskriptivna statistika u ovom istraživanju obuhvata period od 03. januara 2018. godine do 30. decembra 2021. godine što ukupno iznosi 1.011 dana. Selekcija akcija preduzeća u ovom istraživanju sprovedena je na način da su izabrane najlikvidnije akcije sa visokim prometom i tržišnom kapitalizacijom većom od medijane tržišne kapitalizacije iz različitih sektora delatnosti. Analizirani početni podaci odnose se na mesečno kretanje cena izabranih akcija. Za potrebe tržišnog kretanja prinosa korišćena je analiza bazirana na kretanju berzanskih indeksa SASX-30 i BIRS-a. Kao kriterij za izbor šireg pregleda literature uzet je stepen privrednog razvoja posmatranih zemalja koje se nalaze na sličnom stepenu privrednog razvoja, kao i Bosna i Hercegovina. Dakle, prikazani su rezultati istraživanja odabranih preduzeća iz posmatranih zemalja koje imaju sličnu stopu privrednog rasta kao BiH, a sve u cilju veće uporedivosti i komparativnosti uticaja ponderisane prosečne cene kapitala na indikatore profitabilnosti poslovanja. Berzanski indeks SASX – 30 je cenovni indeks (engl. price index), tj. isplaćene dividende indeksa se ne uzimaju u obzir prilikom kalkulacije indeksa. SASX -30 indeks ima za cilj da investitorima i analitičarima omogući ocenu generalnog kretanja na najlikvidnijem delu Sarajevske berze hartija od vrednosti. U sastav indeksa mogu biti uključeni samo simboli emitenata koji su uvršteni na Primarno slobodno tržište (PST). Početna vrijednost indeksa SASX – 30 (engl. base value) iznosi 1.000 indeksnih poena, dok je početni datum indeksa (engl. base date) 31.03.2009. godine. Sastav indeksa SASX-30 na dan 01.03.2023. godine čine 30 kompanija sa sledećom strukturom:
83
(12) (13) 2 2
Primarno slobodno tržište je subsegment Slobodnog tržišta Sarajevske berze hartija od vrednosti.
Prof. dr Almir Alihodžić
Trošak kapitala – efekti na vrednost i profitabilnost preduzeća: Evidencija odabrane skupine preduzeća na Sarajevskoj i Banjalučkoj berzi
Tabela
84
Kompozicija indeksa SASX-30 R.B. Simbol Emitent 1. BHTSR BH Telecom a.d. Sarajevo 2. BORBRK3 Privredna banka Sarajevo a.d. Sarajevo 3. BSNCR Bosanac a.d. Orašje 4. BSOSRK1 Adriatic osiguranje a.d. 5. BSRSRK2 Bosna Reosiguranje a.d Sarajevo 6. DCNSR TP DC Sarajevo a.d. Sarajevo 7. DCTKR DC Tešanj Kraševo a.d. 8. ENISR Energoinvest a.d. Sarajevo 9. FDSSR Badeco adria a.d. Sarajevo 10. HRCAR Hercegovina auto a.d. Mostar 11. HTKMR JP HT a.d. Mostar 12. IGKCRK3 Igman a.d. Konjic 13. IKBZRK2 ASA banka a.d. Sarajevo 14. INGMRK2 Ingram a.d. Srebrenik 15. ITRTRK1 Interšped a.d. Tuzla 16. JPEMR JP Elektroprivreda HZHB Mostar 17. JPESR JP Elektroprivreda BiH a.d. Sarajevo 18. LSLBRK3 Lječilište Slana banja a.d. 19. MGVSR Magros veletrgovina a.d. Sarajevo 20. RIBNR Riba Neretva a.d. 21. RMUBR RMU Banovići a.d. Banovići 22. RPRZRK2 RMK Promet a.d. Zenica 23. RSTTR Rudnik Soli Tuzla a.d. Tuzla 24. SOSOR Sarajevo osiguranje a.d. Sarajevo 25. STFJR Štamparija Fojnica a.d. Fojnica 26. TBOTRK1 Trgovina Borac a.d. Travnik 27. TCMKR Tvornica cementa Kakanj a.d. Kakanj 28. TRGCR Trgocoop a.d. Ljubuški 29. ZGPSR GP ŽGP a.d. Sarajevo 30. ZVDPR Zavod za vodoprivredu a.d. Izvor: Sarajevska berza vrijednosnih papira (www.sase.ba)
1:
2023
Prof. dr Almir Alihodžić
Bankаrstvo
Berzanski indeks Republike Srpske – BIRS uključuje najkvalitetnije akcije preduzeća i banaka. Formiran je 1. maja 2004. godine. Broj akcija koje ulaze u sastav BIRS–a može varirati od 5 do 15, zavisno o ispunjavanju kriterija za uključivanje akcija u BIRS indeks. Broj emitenata čije akcije ulaze u sastav BIRS–a zavisi od broja emitenata na službenom berzanskom tržištu i broja emitenata koji ispunjavaju uslove za sastav BIRS–a. U sastav BIRS–a mogu da uđu akcije emitenata koji ispunjavaju opšte uslove i kriterijume za uključivanje akcija u BIRS, izuzev akcija investicionih fondova. Sastav indeksa BIRS na dan. 01.03.2023. godine čine 12 kompanija sa sledećom strukturom:
Tabela 2: Kompozicija indeksa BIRS
R.B. Simbol Emitent
1. ALPR-R-A Alpro a.d. Vlasenica
2. BOKS-R-A Boksit a.d. Milići
3. BVRU-R-A ZTC Banja Vrućica a.d. Teslić
4. DEST-R-A Hemijska industrija destilacija a.d. Teslić
5. EKBL-R-A Elektrokrajina a.d. Banjaluka
6. ELDO-R-A Elekto Doboj a.d. Doboj
7. HEDR-R-A Hidroelektrane na Drini a.d Višegrad
8. HELV-R-A Hidroelektrane na Vrbasu a.d. Mrkonjić Grad
9. HETR-R-A Hidroelektrane na Trebišnjici a.d. Trebinje 10. RITE-R-A RITE Gacko a.d. Gacko
RTEU-R-A RITE Ugljevik a.d. Ugljevik 12. TLKM-R-A Telekom Srpske a.d. Banjaluka
Izvor: Banjalučka berza hartija od vrednosti (www.blberza.com)
Rezultati i diskusija
Tabela u nastavku teksta ilustruje dobijene rezultate ostvarenih mesečnih stopa prinosa odabranih akcija i berzanskih indeksa SASX-30 i BIRS za period: 03.01.2018. – 31.12.2021. godine.
Tabela 3: Deskriptivna statistika prosečnih (mesečnih) prinosa i viših momenata razdiobe oko sredine odabranih akcija u sastavu berzanskih indeksa SASX-30 i BIRS za period: 03.01.2018. – 31.12.2021. god.
Proračun autora na osnovu podataka sa Sarajevske i Banjalučke berze hartija od
85
11.
TIK Prosečan prinos Standardna devijacija Mera asimetrije Spljoštenost Min Max BHTSR 0,01 1,86 27,48 0,62 8,22 14,20 JPESR 0,08 2,86 23,54 1,00 7,20 17,81 SOSOR 0,15 2,97 27,59 1,24 4,85 16,01 TCMKR 0,04 0,97 77,94 3,73 22,50 32,90 SASX-30 0,06 0,45 60,10 4,35 961,32 1,778,08 TLKM-R-A 0,04 1,53 60,67 0,41 0,77 1,42 BVRU-R-A 0,06 1,91 71,46 3,00 0,57 1,45 BOKS-R-A 0,03 0,79 203,19 -12,52 0,45 0,71 HETR-R-A 0,06 3,08 25,13 0,42 0,16 0,43 BIRS 0,02 0,89 10,10 -0,36 488,0 733,54
Izvor:
vrednosti
Prof. dr Almir Alihodžić
Trošak kapitala – efekti na vrednost i profitabilnost preduzeća: Evidencija odabrane skupine preduzeća na Sarajevskoj i Banjalučkoj berzi
Upoređujući dobijene prosečne stope prinosa odabranih preduzeća u sastavu berzanskih indeksa SASX-30 i BIRS u posmatranom periodu primetno je vrlo malo odstupanje od vrednosti nula, što je u skladu sa teorijskom pretpostavkom mnogih pristupa i modela za merenje tržišnih rizika, koji sadrže premisu da je dugoročni prosečni dnevni prinos jednak nuli. Najveća prosečna stopa prinosa je zabeležena kod sledećih akcija posmatranih preduzeća: Sarajevo osiguranje a.d. Sarajevo (0,15%), zatim JP Elektroprivreda BiH a.d. Sarajevo (0,08) i ZTC Banja Vrućica a.d. Teslić (0,06). Dakle, ovo su jako niske stope prinosa koje su karakteristične za rubno tržište kapitala, zatim tržište jako niske likvidnosti, isprekidanog trgovanja, odnosno veliki broj dana bez trgovanja što je posebno izraženo na tržištu kapitala Federacije Bosne i Hercegovine. Takođe, uticaj globalne krize izazvane COVID-19 je imalo uticaja na pad likvidnosti i nestabilnosti tražnje, te povlačenje, kako domaćih, tako i inostranih investitora. U kontekstu kretanja vrednosti viših momenata razdiobe oko sredine (mere asimetrije i spoljoštenosti) zabeležene su jako kolebljive i fluktuirajuće vrednosti. Najveće vrednosti mere asimetrije su ostvarene kod sledećih akcija preduzeća: BOKS-R-A (203,19), TCMKR (77,94), BVRU-R-A (71,46), TLKM-R-A (60,67). Ovi rezultati upućuju na zaključak da izabrane akcije odabrane skupine preduzeća imaju značajan asimetrični raspored prinosa. Za razliku od mere asimetrije, mera zaobljenosti tj. spljoštenost u posmatranom periodu vrednosti iznad 3 su ostvarene kod akcija preduzeća TCMKR (3,73) i kod berzanskog indeksa SASX-30 (4,35). Ovi rezultati upućuju na zaključak da distribucija prinosa akcija preduzeća TCMKR i berzanskog indeksa SASX-30 imaju veoma zaobljene „repove“ (rubove) u odnosu na normalnu distribuciju. Visoka vrednost spljoštenosti ukazuje na češće pojavljivanje ekstremnih događaja, pozitivnih ili negativnih, nego što je to pretpostavljeno normalnom distribucijom.
Tabela 4: Kretanje koeficijenta i korigovane za akcije u sastavu berzanskih indeksa SASX-30 i BIRS za period: 03.01.2018. – 31.12.2021. godine
Izvor: Proračun autora
Na osnovu proračuna da se primetiti da samo tri akcije od ukupno osam akcija preduzeća imaju vrednost veću od 1, dok ostale akcije pokazuju sporiju tendenciju promena u odnosu na tržišne promene, jer imaju vrednost bete manju od 1. Akcije kompanija koje imaju vrednost bete veću od 1 su sledeće: Hidroelektrane na Trebišnjici a.d. Trebinje (vrednost bete iznosi 1,87), JP Elektroprivreda BiH a.d. Sarajevo - JPESR (vrednost bete iznosi 1,51), zatim Sarajevo osiguranje a.d. Sarajevo (vrednost bete iznosi 1,02). Takođe, i standardna devijacija kao prva mera rizika za ove tri posmatrane akcije ima visoku vrednost, što prati vrednost bete iznad jedinice. Najnižu vrednost bete su ostvarile akcije preduzeća Boksit a.d. Milići (vrednost bete iznosi samo 0,09) što odgovara manjem sistematskom riziku i negativnoj prosečnoj stopi povrata (tabela 4).
Tabela 5 ilustruje dobijene rezultate troškova duga (proračunatih na osnovu formule 6), troškove akcijskog kapitala (proračunatih na osnovu formula 5 i 8) i WACC (proračunata na osnovu formule 3) odabrane skupine preduzeća. Samo jedno preduzeće iz uzorka (TLKM-R-A) ima značajan udeo duga u ukupnom kapitalu. Trošak duga posmatranih preduzeća iz uzorka je relativno mali i kreće se od minimalnih 0,02% (BVRU-R-A) do maksimalnih 8,49% (BOKS-R-A). Posmatrano sa druge strane, trošak kapitala za preduzeća iz uzorka kreće se od minimalnih 4,95% (akcije preduzeća BOKS-R-A) do maksimalnih 11,41% (akcije preduzeća HETR-R-A), dok se WACC kreće od minimalnih 5,11% (akcije preduzeća TCMKR) do maksimalnih 10,87% (akcije preduzeća HETR-R-A).


86
BHTSR JPESR SOSOR TCMKR TLKM-R-A BVRU-R-A BOKS-R-A HETR-R-A koeficijent 0,73 1,51 1,02 0,14 0,62 0,58 0,09 1,87 korigovana 0,82 1,34 1,01 0,43 0,75 0,72 0,39 1,58
Prof. dr Almir Alihodžić Bankаrstvo 2023
Iz prethodne tabele je evidentno da su najveće vrednosti prosečne ponderisane cene kapitala zabeležile sledeće akcije preduzeća: akcije preduzeća Hidroelektrane na Trebišnjici a.d. TrebinjeHETR-R-A (10,87%), zatim akcije preduzeća JP Elektroprivreda BiH a.d. Sarajevo – JPESR (9,34%) i akcije preduzeća Sarajevo osiguranje a.d. Sarajevo – SOSOR (8.19%). Dakle, sva tri posmatrana i analizirana preduzeća u sastavu berzanskih indeksa SASX-30 i BIRS su za posmatrani vremenski period imala vrednosti beta iznad jedinice, što navodi na zaključak da se njihove cene kreću u istom smeru kao i tržište (ali su neznatno volatilnije od tržišta), odnosno sa preuzimanjem većeg sistematskog rizika ostvaruju i pozitivne stope povrata. Ilustracije radi, preduzeće Hidroelektrane na Trebišnjici a.d. Trebinje je u 2021. godini ostvarilo neto dobit oko 3.06 miliona eura što predstavlja relativno povećanje za oko 3,878% u odnosu na prethodnu godinu. Takođe, i preduzeće JP Elektroprivreda BiH a.d. Sarajevo je u 2021. godini ostvarilo neto dobit u iznosu od oko 23,17 miliona eura, što predstavlja relativno povećanje za oko 194% u odnosu na prethodnu godinu. Preduzeće Sarajevo osiguranje a.d. Sarajevo je u 2021. godini ostvarilo neto dobit u iznosu od oko 781 hiljadu eura, što predstavlja relativno povećanje za oko 914% u odnosu na prethodnu godinu. Struktura kapitala posmatranih preduzeća izražena kroz WACC može biti kumulativni rezultat prethodnih pokušaja preduzeća, kao što je izdavanje akcija, ili bi mogla biti pod uticajem privremene fluktuacije u troškovima kapitala.
Tabela 6: Analiza kretanja vrednosti indikatora WACC, ROA, ROE i NPM odabrane skupine preduzeća zaključno sa 31.12.2021. godine (u%)
87
SASX-30 i
BHTSR JPESR SOSOR TCMKR TLKM-R-A BVRU-R-A BOKS-R-A HETR-R-A kd(%) 1,83 0,54 1,77 2,04 2,91 0,02 8,49 0,77 beta 0,73 1,51 1,02 0,14 0,62 0,58 0,09 1,87 rf (%) 0,0172 0,0172 0,0172 0,0172 0,0172 0,0172 0,0172 0,0172 RP(%) 4,72 4,72 4,72 4,72 4,72 4,72 4,72 4,72 CRP(%) 6,30 6,30 6,30 6,30 6,30 6,30 6,30 6,30 kee(%) 9,76 13,44 11,13 6,98 9,24 9,05 6,74 15,14 kes(%) 7,29 10,11 8,33 5,14 6,88 6,73 4,95 11,41 E/(E+D) 0,92 0,92 0,98 0,99 0,63 0,92 0,82 0,95 D/(E+D) 0,08 0,08 0,02 0,01 0,37 0,08 0,18 0,05 WACC (%) 6,83 9,34 8,19 5,11 5,30 6,19 5,43 10,87 Izvor: Proračun autora
Tabela 5: Trošak duga, akcijskog kapitala i WACC za odabranu skupinu akcija u sastavu berzanskih indeksa
BIRS zaključno sa 31.12.2021. godine
WACC ROA ROE NPM BHTSR 6,83 2,17 6,37 11,82 JPESR 9,34 1,29 0,41 8,51 SOSOR 8,19 1,22 3,29 2,52 TCMKR 5,11 6,62 14,18 25,64 TLKM-R-A 5,30 5,79 10,85 17,33 BVRU-R-A 6,19 7,44 8,86 27,80 BOKS-R-A 5,43 0,14 0,23 0,31 HETR-R-A 10,87 0,60 0,65 10,44
Izvor: Proračun autora
Prof. dr Almir Alihodžić
Trošak kapitala – efekti na vrednost i profitabilnost preduzeća: Evidencija odabrane skupine preduzeća na Sarajevskoj i Banjalučkoj berzi
Iz tabele se može zaključiti da za određena preduzeća ne postoji direktna korelacija i povezanost između indikatora prosečno ponderisanog troška kapitala i indikatora profitabilnosti poslovanja preduzeća. Preduzeća kao što su TCMKR i TLKM-R-A imaju jako nisku vrednost prosečno ponderisanog troška kapitala, ali sa druge strane jako visoke vrednosti indikatora profitabilnosti. Izuzev datih preduzeća, preduzeće BOKS-R-A ima takođe nisku vrednost prosečno ponderisanog troška kapitala, ali isto tako i jako niske vrednosti indikatora profitabilnosti. Razloge za različito kretanje indikatora profitabilnosti pre svega treba tražiti u vrednosti osnovnog kapitala, zatim broju akcionara, stabilnosti poslovanja, grani delatnosti i drugim faktorima. Različite vrednosti prosečno ponderisanog troška kapitala su pre svega posledica i uticaj različitog kretanja vrednosti beta koeficijenta i uticaja sistematskog rizika. Određena preduzeća odabranog uzorka (BOKS-R-A, TCMKR i TLKM-R-A) imaju povećano učešće neto finansijskih rashoda u dugoročnim dugovima, što znači da koriste skupe izvore kapitala na način da ih uposle na profitabilan način.
Tabela 7: Pearsonov koeficijent korelacije između varijabli: ROA, ROE,NPM, WACC za odabranu skupinu preduzeća
Izvor: Proračun autora
Dobijeni rezultati korelacione analize iz prethodne tabele ukazuju da je prisutna negativno signifikantna korelacija između prosečno ponderisanog troška kapitala, sa jedne strane i svih indikatora profitabilnosti, s druge strane. Dobijeni rezultati se slažu da rezultatima Hussain i Islam (2012), Syed i ostalih (2012), kao i sa rezultatima Momčilović i ostali (2021).
Zaključak
Sa stanovišta investitora svi investitori žele da njihov kapital bude uložen u ono preduzeće u kojem mogu da imaju maksimalan prinos na svoja ulaganja, u protivnom se neće dugo zadržati u datom preduzeću. Dakle, preduzeće treba da održava svoj profit i da pokuša da ga poboljša. Ukoliko stopa prinosa nije veća od cene kapitala, onda preduzeće ne može da preživi i u tom slučaju će akcionari prodati svoje akcije i prebaciti se u drugo preduzeće u cilju dobijanja bolje koristi. Prema tome, preduzeće treba da kreira takvu strategiju u kontekstu da se njegove profitne marže mogu maksimizirati i da mogu dati beneficije svojim akcionarima u obliku dividendi u gotovini. Prosečna ponderisana cena kapitala je važna odrednica profitabilnosti poslovanja preduzeća. Investicione odluke preduzeća u velikoj meri zavise od troškova poslovanja. Dakle, vrlo je važno razumeti kako prosečno ponderisana cena kapitala utiče na profitabilnost poslovanja.
88
ROA ROE NPM WACC Pearson Correlation 1,000 0,887 0,930 - 0,576 Sig (2-tailed) - 0,03 0,01 0,01 Pearson Correlation 0,887 1,000 0,811 -0,666 Sig (2-tailed) 0,03 - 0,01 0,03 Pearson Correlation 0,930 0,811 1,000 -0,358 Sig (2-tailed) 0,01 0,01 - 0,03 Pearson Correlation -0,576 -0,666 -0,358 1,000 Sig (2-tailed) 0,01 0,03 0,03 -
ROA ROE NPM WACC
Prof. dr Almir Alihodžić Bankаrstvo 2023
Ova studija je sprovedena da analizira i interpretira empirijske dokaze o uticaju troška kapitala i efektima učinka na profitabilnost. Dakle, ovo istraživanje je imalo za cilj da proračuna prosečni ponderisani trošak kapitala za odabranu skupinu preduzeća u sastavu berzanskih indeksa SASX-30 i BIRS sa najvećim prometom, te da nakon toga utvrdi da li postoji uzajamna uslovljenost i korelacija između odabranih indikatora profitabilnosti (ROA, ROE i NPM) i WACC. Prosečni ponderisani trošak kapitala u ovom istraživanju za odabranu skupinu preduzeća je iznosio oko 7,16%. Najveća vrednost WACC zabeležena je kod akcija preduzeća HETR-R-A (10,87%), dok je sa druge strane najniža vrednost ostvarena kod akcija preduzeća TCMKR (5,11%). Visina WACC direktno dolazi i zavisi od vrednosti troška kapitala, a indirektno zavisi od vrednosti beta koeficijenata. Takođe dobijeni rezultati pokazuju da između WACC, s jedne strane i ROA, ROE i NPM sa druge strane, postoji negativna korelacija. Ovo je pre svega rezultat činjenice da određena skupina preduzeća koriste skupe izvore kapitala, ali kapital upošljavaju profitabilno, te s tim u vezi imaju visok WACC i indikatore profitabilnosti.
U poređenju sa prethodnim studijama može se zaključiti da su dobijeni rezultati u kontekstu uticaja WACC na indikatore profitabilnosti za odabranu skupinu preduzeća u BiH identični rezultatima dobijenih u istraživanjima Hussain i Islam (2012), Sharma (2012), Hussain i Chakraborty (2010) i Tashfeen i Liton (2010). Ovo je pre svega rezultat istog stepena privrednog razvoja posmatranih zemalja i Bosne i Hercegovine. Takođe, veći broj zemalja iz relevantnog pregleda literature kao i Bosna i Hercegovina imaju visoku tržišnu riziko premiju, kao i riziko premiju zemlje.
Kako je uzorak istraživanja relativno mali ovo istraživanje bi trebalo dodatno proširiti, kako bi se dobila adekvatnija zaključna razmatranja. Takođe, prilikom izbora preduzeća treba imati u vidu sledeće faktore koji karakterišu rubno tržište kapitala u BiH: niska likvidnost, isprekidano trgovanje, niske stope prinosa, niska tržišna kapitalizacija, i drugi faktori. Dakle, prilikom uključivanja dodatnih preduzeća u analizu treba uzeti u obzir ona preduzeća koja imaju najveći promet i veći broj dana aktivnog trgovanja.
Nalazi ovog istraživanja dopunjuju i unapređuju postojeću literaturu u vezi sa efektom i uticajem troška kapitala na finansijski učinak preduzeća, i mogu poslužiti menadžerima posmatranih preduzeća da bolje planiraju profitabilnost svoga poslovanja u kontekstu korišćenja i uticaja troškova sopstvenog i pozajmljenog kapitala. Rezultati ove analize mogu se koristiti kao referenca za buduća istraživanja koja se odnose na slične teme istraživanja. Razmatranje drugih faktora profitabilnosti skupa sa WACC-om obezbediće prostor za razumevanje relativnog uticaja WACC na profitabilnost poslovanja.
Upravljanje finansijskom strukturom preduzeća svakako predstavlja kontinuirani posao koji zavisi od mnogobrojnih internih i eksternih faktora, tako da zaključke dobijene ovim istraživanjem ne treba shvatiti kao konačne. S tim u vezi, preporuka je ovog istraživanja da se data problematika konstantno istražuje kroz analizu većeg broja preduzeća, varijabli i dužeg vremenskog perioda.
Reference
1. Alihodžić, A. (2011). Portfolio analiza - teorijsko metodološki aspekti investiranja u vrijednosne papire. Univerzitet u Zenici - Ekonomski fakultet Zenica.
2. Alihodžić, A. (2013). Primjena CAPM modela u vrednovanju finansijske imovine na tržištu kapitala BiH, Ekonomske teme, Vol. 51(1), str. 139-154.
89
Prof. dr Almir Alihodžić
Trošak kapitala – efekti na vrednost i profitabilnost preduzeća: Evidencija odabrane skupine preduzeća na Sarajevskoj i Banjalučkoj berzi
3. Bhargav, P. (2017). Association of Financial Leverage with Cost of Capital and Shareholder Value: An Empirical Study of BSE Sensex Companies, Nmims. Journal of Economics and Public Policy. Volume 2, Issue 1.
4. Bhatnagar, V.K., Kumari, M., Sharma, N. (2015). Impact of Capital Structure & Cost of Capital on Shareholders’ Wealth Maximization - A Study of BSE Listed Companies in India, Chanakya International Journal of Business Research, Vol. 1(1), pp. 28-36.
5. Bhayani, S. (2009). Impact of Financial Leverage on Cost of Capital and Valuation of Firm: A Study of Indian Cement Industry. PARADIGM, Vol. XIII., Issue 2, pp.44-49.
6. Bodie, Z., Kane, A., Marcus, A.J. (2009). Osnovi investicija. DATA STATUS, Beograd.
7. Božović, M. (2021). Empirijski izazovi finansijske teorije. Centar za izdavačku delatnost Ekonomskog fakulteta u Beogradu. Beograd.
8. Chowdhury, A., Chowdhury, S.P. (2010). Impact of Capital Structure on Firm’s Value: Evidence from Banladesh. Business and Economic Horizons, Vol.3., No.3., pp. 111-122.
9. Damodaran, A. (2002). Investment valuation: Tools and techniques for determining the value of any asset. New York: John Wiley and Sons, Inc.
10. Damodaran, A. (2009). Volatility Rules: Valuing Emerging Companies. Retrivered from https://pages.stern.nyu.edu/~adamodar/pdfiles/papers/emergmkts.pdf
11. Damodaran, A. (2015). Applied Corporate Finance (4th Ed.). Hoboken, NJ: John Wiley & Sons Inc.
12. Fama, E. F., French, K. R. (2002). Testing trade-off and pecking order prediction, about dividends and debt. Review of Financial Studies, 15(1), pp.1–33.
13. Frank, M. Z., Goyal, V. K. (2009). Capital structure decisions: Which factors are Reliability important? Financial Management, 38, pp. 1-38.
14. Gilchrist, S., Zakrajsek, E. (2007). “Investment and the cost of capital: New evidence from the corporate bond market”. National Bureau of Economic Research Cambridge, Mass. USA. Working Paper No. 13174.
15. Gordon, M. (1962). The Investment, Financing, and Valuation of the Corporation. Homewood, III: Irwin, 1962.
16. Higgins, R.C. (2005). Analysis of Financial Management. 3rd Edition, McGraw-Hill Irwin.
17. Hussain, S. A. G., Islam, Z. (2012). Impact of WACC on Corporate Profitability: A case study of cement industry of Pakistan Journal of Risk and Diversification.
18. Hussain, T., Chakraborty, L. (2010). Is the cost of capital animportant determinant of market performance of private commercial banks in Bangladesh? In Proceedings of ASBBS, ASBBS Annual Conference: Las Vegas ,Vol. 17, No. 1, pp. 389-399.
19. Khadka, H. B.(2007). Leverage and the Cost of Capital: Some Tests Using Nepalese Data. Journal of Nepalese Business Studies, 3(1), pp. 85–91.
20. Kočović, J., Paunović, M., Jovanović, M. (2016). Determining the Discount Rate: The Case of Oil Industry in Serbia. Ekonomika preduzeća, 64 (5-6), pp. 371-381.
21. Koller, T., Goedhart, M., Wessels, D. (2010). Valuation Measuring and Managing the Value of Companies, fifth edition, John Wiley & Sons, Inc.
22. Komisija za hartije od vrijednosti Republike Srpske (2020). Izvještaj o stanju na tržištu hartija od vrijednosti za 2020. godinu. Dospuno na: https://www.secrs.gov.ba/Documents/ Izvjestaji/a9ea9f9f-e960-41b4-b51f-f12207032022_sr-Latn-CS.pdf.
23. Lewis, E.E. (1973). Methods of Statistical Analysis in Economics and Business. Boston: Houghton Miflin Company.
90
Prof. dr Almir Alihodžić Bankаrstvo 2023
24. Miglo, H. (2012). Corporate Finance: Basic Theory and Advances Topics. 11th Ed. Xlibris Corporation.
25. Momčilović, M., Begović, S.V., Jovin, S. (2021). Research of the relationship between the weighted average cost of capital and selected profitability ratios of companies in the Republic of Serbia. International Journal of Economic Practice and Policy, Vol. XVIII, Issue 2, pp. 141-155.
26. Momčilović, M., Vlaović Begović, S. (2020). The Relationship between Weighted Average Cost of Capital and Profitability of Companies in Serbia: Case Study. Economic development and competitivenes of European countries: Challenges of economic integration, pp. 98-102.
27. Parmjit, K., Neeti, K. (2019). Relationship of Cost of Capital, Cost of Equity Capital, Value of Firm & other Financial Variables: Panel Data & Simultaneous Equation Analysis of Indian Companies. Finance India. Vol. 33. No. 2., pp. 21-58.
28. Ragil, S., Solimon, H. (2014). The Influence of Company Size and Capital Structure towards Liqudity, Corporate Performance and Firm Value, for Large and Small Group Companies. European Journal of Business and Management, Vol. 6., No.18, pp. 148-156.
29. Rajan, R., Zingales, L. (1995). What do we know about capital structure - Some evidences from international data. Journal of Finance. No. 50, pp. 1421-1460.
30. Ross, A.A. (2007). Modern Financial Management. 7th Ed. McGrawHill Irwin.
31. Schmidlin, N. (2014). The Art of Company Valuation and Financial Statement Analysis. John Wiley & Sons Ltd.
32. Sharma, A. (2012). Cost of Capital and Profitability Analysis - A Case Study of Telecommunication Industry. Journal of Commerce and Accounting Research. Volume 1. Issue 4.
33. Simmons, S., Banu. (2016). “Cost of capital and US investment: Does financing matter after all?”. The Quarterly Review of Economics and Finance, 60, pp. 86-93.
34. Singapurwoko, A., El-Wahid, M.S. (2011). The Impact of Financial Leverage to Profitability, Study of Non-Financial Companies Listed in Indonesia Stock Exchange. European Journal of Economics, Finance, and Administrative Sciences, No. 32, pp.136-148.
35. Syed, W.H., Ghayanfar, A., Zia, U.I. (2012). Impact of WACC on Corporate Profitability. Impact of Risk and Diversification, No. 4, pp.1-7.
36. Šoškić, I., Serdar, V. (1994). Uvod u statistiku, Školska knjiga, Zagreb.
37. Tashfeen, H., Liton, C. (2010). Is The Cost of Capital an Important Determinant of Market Performance of Private Commercial Banks in Bangladesh?”, Proceedings of ASBBS, ASBBS Annual Conference: Las Vegas , Volume 17, Number 1, pp.389-399.
38. Učkar, D., Urti, J. (2015). Utjecaj finansijske strukture na profitabilnost hrvatskih preduzeća. Oeconomica Jadertina, Vol.5. No.2, pp. 13-25.
39. Vidučić, Lj. (2006). Finansijski menadžment, V. Izdanje. Zagreb: RriF Plus.
40. Vukičević, M., Gregurek, M., Odobašić, S., Grgić, J. (2010). Finansijski menadžment u MS Excelu. Golden marketing - Tehnička knjiga, Zagreb.
91
Prof. dr Almir Alihodžić
Trošak kapitala – efekti na vrednost i profitabilnost preduzeća: Evidencija odabrane skupine preduzeća na Sarajevskoj i Banjalučkoj berzi
COST OF CAPITAL – THE EFFECT TO THE FIRM VALUE AND PROFITABILITY OF COMPANIES: EVIDENCE OF A SELECTED
GROUP OF COMPANIES ON THE SARAJEVO AND BANJA LUKA STOCK EXCHANGES
Prof. Almir Alihodžić, PhD
Tenured Professor, Faculty of Economics, University of Zenica
almir.dr2@gmail.com
Summary: The weighted average cost of capital is the rate that companies must pay to shareholders and creditors. Therefore, it is a risk-adjusted discount rate for the company‘s cash flows. The paper will calculate the weighted average cost of capital for a selected group of companies listed on the Sarajevo and Banja Luka Stock Exchanges, as well as profitability indicators such as: ROA, ROE and net profit margin. Therefore, the main goal of this paper is to investigate whether there is interdependence in the movement of the weighted average cost of capital and profitability indicators of the selected group of companies in the stock market indices SASX-30 and BIRS. The research results show that the WACC ranges from a minimum of 5.11% to a maximum of 10.87%. Likewise, the research results show that there is a negative connection and correlation between WACC on the one hand and a selected group of profitability indicators on the other hand.
Keywords: cost of equity, WACC, correlation, beta coefficient, ROA, ROE, net profit margin.
JEL classification: G10, G12, G23
92
Banking 2023 Scientific review article Received: 02.03.2023. Accepted: 28.03.2023.
10.5937/bankarstvo2301092A
DOI:
Introduction
Finances are very important for the entire economic sector as well as for its participants, i.e., for the survival, growth and expansion of business, which are the three main goals of every organization. Financial performance is a measure of how well a company can use funds from its main activity. Financing is not free because it causes an opportunity cost for the investor, which is certainly the income they would have earned if they had invested in the next best alternative.
The most important method in communicating financial information about the financial position and financial success of the company is certainly financial reports. Therefore, if a company wants to raise funds in the international capital market or invest in a foreign country, investors or business owners should analyze financial information with the help of financial statements.
In this era of globalization and the competitive business world, financing decisions play a significant role in maintaining the profitability of a company. Although many financing theories have emerged over time, none of them can absolutely suggest the optimal level of capital structure. The choice of capital structure is one of the most important decisions for companies because it can affect the earnings of shareholders and the value of the company. In addition to financing with their own capital, companies are also financed by borrowing, that is, by borrowing financial resources, either from banks, individuals or other sources. The company pays interest on the borrowed amount, that is, it pays the price of their debt. The payment made by the company for interest serves to reduce the tax base because the interest is recognized as an expense. Greater reliance on debt financing could increase enterprise risk and ultimately the costs of a company bankruptcy. On the other hand, equity financing and debt avoidance could send the wrong signals to investors about the company’s financial status, which could increase the possibility of a hostile takeover. Companies try to find an optimal capital structure that will minimize the total cost of capital.
WACC is used as a discount rate for projects undertaken by the company (Ross, 2007). Usually, a higher discount rate results in lower cash flows and this consequently results in lower cash flows, and ultimately implies a low net present value of the project. A project with a low net present value leads to a decline in the company’s profitability (Miglo, 2012).
This research will deal with the calculation of the weighted average cost of capital that a company must pay to shareholders and creditors. The weighted average cost of capital is usually said to reflect the risk of future cash flows to creditors and shareholders. The given is acceptable because the cost of capital is derived from expected future payments to shareholders, then the cost of debt is derived from the rate demanded by the company creditors for the money they lend. In this regard, it can be said that the average weighted cost of capital is the weighted average of the riskiness of cash flows of shareholders and creditors (Vukičević et al. 2010). The research will also calculate business profitability indicators of a selected group of companies listed on the Sarajevo and Banja Luka Stock Exchanges. The statistical tool that will be used to find the impact of the cost of capital on the profitability of the company will be correlation analysis.
93
Prof. Almir Alihodžić ,PhD
Cost of Capital – The Effect to the Firm Value and Profitability of Companies: Evidence of a Selected Group of Companies on the Sarajevo and Banja Luka Stock Exchanges
The paper is structured in five parts. The first part refers to introductory considerations with an emphasis on the description of the definition of weighted average cost of capital. The second part describes an overview of previous research in terms of the influence of the weighted average cost of capital on business profitability indicators. The third part describes the selected research methodology, with a special focus on the necessary formulas for calculating the weighted average cost of capital and profitability indicators. The fourth part refers to the data necessary for the analysis. The fifth part presents the obtained research results, as well as certain observations and recommendations.
Review of Relevant Literature
Capital structure is a way of financing company assets through a certain combination of equity, debt or hybrid securities. Therefore, the capital structure of a company is the composition of its liabilities (Khadka, 2007). According to the Modigliani-Miller theory, the value of the company is determined through profitability, regardless of the capital structure. There is no direct relationship between profitability and debt structure, as well as the company WACC (Higgins, 2005). According to a study conducted by Hussain and Chakraborty (2010) on the example of 24 commercial banks listed on the Dhaka Stock Exchange in Bangladesh in the period from January 2006 to December 2008., came to the conclusion that there is a strong negative correlation between the cost of capital and the returns of commercial banks.
Profitability has a significantly negative relationship with leverage and short-term financing when the source is only external financing and when dividends are fixed, so profitability changes negatively with the change in the level of leverage (Ryan and Zingales, 1995).
Chowdhury and Chowdhury (2010) attempted to explain the relationship between capital structure and firm value in Bangladesh, and found that an optimal balance of debt and equity can maximize shareholders wealth requirements. They also concluded that the cost of capital should be as low as possible because it negatively affects the choice of capital structure.
According to a study conducted by Tashfeen and Liton (2010), there is a strong negative correlation between the cost of capital of commercial banks and their returns. The analysis was conducted on 24 listed commercial banks in Dhaka, Bangladesh in the period from January 2006 to December 2008.
Momčilović and Vlahović Begović (2020) examined the relationship between the weighted average cost of capital and profitability ratios for four companies. The authors point out that although companies with the lowest WACC are expected to have the highest key profitability ratios, the research results show otherwise. Also, the authors point out that it makes sense to use expensive sources of capital as long as the capital is used in a profitable way.
Singapourwoko and El-Wahid (2011) conducted a study on 48 companies for the period from 2003 to 2008, listed on the Indonesian Stock Exchange and found a significant positive relationship between leverage and profitability. On the other hand, Ragil and Solimon (2014) found different results by conducting a study on 60 listed companies of the same stock exchange. They divided the sample into two clusters, namely 30 small companies and 30 large companies. The results showed a significant negative relationship for the lower cluster, and an insignificant relationship between leverage and company value for the upper cluster, i.e., large enterprises.
94
Prof. Almir Alihodžić, PhD Banking 2023
Singapourwoko and El-Wahid (2011) conducted a study on 48 companies for the period from 2003 to 2008, listed on the Indonesian Stock Exchange and found a significant positive relationship between leverage and profitability. On the other hand, Ragil and Solimon (2014) found different results by conducting a study on 60 listed companies of the same stock exchange. They divided the sample into two clusters, namely 30 small companies and 30 large companies. The results showed a significant negative relationship for the lower cluster, and an insignificant relationship between leverage and company value for the upper cluster, i.e., large enterprises.
Hussain and Islam (2012) found a negative correlation between return on equity and weighted average cost of capital. In their research, weighted average cost of capital in relation to risk premium model, Gordon model as well as Fama-French model was applied to the cement industry of Pakistan. The results of the research measured the balanced impact of the cost of capital on the return on capital in the cement industry, assuming that the level of managerial as well as operational competence in all companies operating in this industry still remains unchanged.
Sharma (2012) analyzed the cost of capital and profitability of the telecommunications sector. The author’s goal was to analyze the relationship between the cost of capital and the profitability of the company. The author found that the high cost of capital negatively affects the profitable position of the company. Also, the author suggests that finance is an important aspect of any business, and that appropriate sources of financing are used to ensure that the cost of capital is under proper control. Certainly, the tools are calculations and formulas of the cost of capital.
Gilchrist and Zakrajsek (2007) examined in their study the relationship between investment and the cost of capital using the corporate bond market as evidence. They focused on variations in interest rates on investment spending and their effects on investment decisions. A regression model was applied, and it was concluded that an increase in the cost of capital by 1 percent leads to a decrease in investment of 50 to 70 points.
Frank and Goyal (2009) investigated the capital structure of US companies for the period from 1950 to 2003, and found consistency with the trade-off model. Therefore, American companies use quality external sources of financing for their operations, provided that the cost of capital is relatively low.
Bhayani (2009) analyzed the impact of financial leverage on the average cost of capital. He conducted the research on a selected sample of cement companies in India for the period from 2000 to 2008. He calculated financial leverage and weighted average cost of capital and compared them using coefficient of correlation and t-test analysis. He came to the conclusion that there is no leverage effect on the cost of capital in the cement industry in India. Also, he established a positive correlation between companies with high and low leverage in relation to the cost of capital.
Bhatnagar et al. (2015) investigated identifying the optimal capital structure and cost of capital. Therefore, they attempted to analyze the impact of capital structure and cost of capital on shareholder wealth maximization by studying the 12 companies with the highest net worth listed on the stock exchange. The tools they used for analysis are regression analysis, and the use of arithmetic formulas to calculate capital structure, shareholder wealth and cost of capital. The results of the study showed that there is linearity between the cost of capital and shareholder wealth maximization, while on the other hand there is no relationship or linearity between shareholder wealth maximization and capital structure. The authors suggest that when making a decision to maximize shareholder wealth, management must consider the long-term impact on the company, and must consider all those factors that are responsible for maximizing shareholder wealth.
95
Prof. Almir Alihodžić, PhD
Cost of Capital – The Effect to the Firm Value and Profitability of Companies: Evidence of a Selected Group of Companies on the Sarajevo and Banja Luka Stock Exchanges
Učkar and Urti (2015) conducted research on 24 companies listed on the Zagreb Stock Exchange as part of the CROBEX stock index, for the period from 2011 to 2013. With this research, the authors tried to prove the influence of the financial structure on the business result, that is, to what extent the capital structure affects the value of the company. They took the company’s indebtedness, ROE and ROA as variables. The research results showed that there is no correct answer as to which theory determines the capital structure. On the other hand, it was determined that there is a negative relationship between capital structure and business excellence. Therefore, a negative correlation occurs when the share of indebtedness in the capital structure is large and thus affects the weakening of business excellence.
Simmons and Banu (2016) examined the role of cost of capital, leverage, dividends and Tobin’s q in corporate investment decision making. They discovered the relationship between the given independent variables with investments by taking quarterly data from 1987 to 2013. The VAR methodology was used for the investigation, where they finally came to the conclusion that leverage has a positive effect on investments, while the cost of capital causes a significantly negative response to investments.
Bhargav (2017) aimed to analyze the effect of financial leverage on the cost of capital. He conducted research on a sample of 28 companies listed on the Bombay Stock Exchange for a period of three years, i.e., from 2013 to 2015, within the stock index Sensex. He calculated the debt-to-equity ratio and the interest coverage ratio, in order to analyze the relationship between financial leverage and the cost of capital. The study found that leverage and the cost of capital are negatively correlated because debt reduces the cost of capital and interest is tax deductible. Hence, it goes without saying that by increasing the debt in the capital structure, the company can reduce the cost of capital.
Parmjit and Neeti (2019) examined whether the cost of capital is a function of capital structure or remains constant. They tried to analyze the relationship between the cost of equity capital, the cost of capital, the value of the firm and other financial variables. The study was done on 500 Indian companies for the period from 2008 to 2010. They found that the cost of capital has an impact on various business decisions based on the nature of the activity that helps managers make financial decisions of the company to run the firm profitably. The authors suggest that when making decisions for financial variables, the various factors that contribute to strategic effectiveness should first consider the efficiency of the company.
Research Methodology
The capital market in Bosnia and Herzegovina belongs to the group of small frontier capital markets characterized by small market capitalization and liquidity, as well as relative openness and accessibility for foreign investors, but also possible greater economic and political instability, and potentially greater long-term return and low correlation with other capital markets (Republic of Srpska Securities Commission, 2020). Calculating the daily rate of return on smaller transition markets, such as the capital market in Bosnia and Herzegovina, is one of the problems, given that there is no single point of view regarding the price that should be applied for the calculation. In the case when the trading data within one day is not known, the arithmetic mean between the lowest and the highest price is most often used. In developed capital markets, the last traded price is generally applied. The last price of the stock is usually chosen to reduce the price mismatch within the daily trading. In the capital market in Bosnia and Herzegovina, taking the last price can give a distorted picture of the actual daily events.
96
2023
Prof. Almir Alihodžić, PhD Banking
Share prices on the B&H capital market fluctuate significantly during the day, where the last price represents only one of the given oscillations, and not a price correction as in developed capital markets. Another important reason for the unreality of applying the last price is the fact that the investors themselves manipulate, i.e., raise the closing price, given that the value of the portfolio based on margin loans is calculated according to the closing prices, so that raising the closing price avoids the obligation to transfer additional securities to the shareholders account the bank where the margin loan was raised. All in all, the weighted average price is the logical choice. Therefore, the average weighted price is obtained by adding the prices of individual transactions during the day and weighting them by the volume of an individual transaction, as follows (Alihodžić, 2011):
Where in:
p - average price of securities;
P_i - transaction price (i);
X_i - the ratio of the volume of transactions (i) to the total volume of trade throughout the day;
q_i - volume of transaction (i); and
- total trading volume throughout the day.
In the way described above, the most realistic average price at which trading can be done on a given day is obtained. This research is based on the rate of return of the most liquid shares traded on the Sarajevo and Banja Luka Stock Exchanges. Likewise, this research is based on daily rates of return in order to further reduce the problem of low liquidity. Due to the lack of data on dividend payments, dividends were not taken into account when calculating daily rates of return of selected company shares. The daily rate of return an individual share will be calculated as follows:
Where in:
r_(i, - daily stock return (i) for day t;

P_(i - share price (i) for day t; and
P_(i, - share price (i) for day t-1.
The share prices of the selected companies were taken from the websites of the Sarajevo Stock Exchange (www.sase.ba) and the Banja Luka Stock Exchange (www.blberza.com) for the period from 01 January 2018 to 31 December 2021.
The Sarajevo Stock Exchange stock index - SASX-30 as well as the Banja Luka Stock Exchange stock index - BIRS were used as a benchmark for the market portfolio in this research. These indices were chosen because they are considered highly diversified and because they describe the state of the capital market in Bosnia and Herzegovina.
97
(1)
(2)
Prof. Almir Alihodžić, PhD
Cost of Capital – The Effect to the Firm Value and Profitability of Companies: Evidence of a Selected Group of Companies on the Sarajevo and Banja Luka Stock Exchanges
The risk premium for shares is generally defined as the average difference in the rate of return on shares compared to a low-risk alternative in the form of government bonds or treasury bills (Božović, 2021). For the market risk premium in this research, the capital risk premium in Germany of 4.72% is used, which is taken from Damodoran database (http://pages.stern.nyu.edu/~adamodar). The country risk premium in Bosnia and Herzegovina, which is 6.30%, was also taken from Damodaran database (http://pages.stern.nyu.edu/~adamodar).
In order to estimate the value of companies that use discounted cash flow, it is necessary to use the weighted average cost of capital (WACC) to forecast the free cash flow, which is the opportunity cost that investors face when investing their funds in one particular business instead of others with similar risk. The most important principle underlying the successful implementation of the cost of capital is consistency between the components of WACC and free cash flow. The weighted average cost of capital (WACC) combines the rates of return required by debt holders and equity holders _e ). For a company financed exclusively by debt and equity, the WACC is defined as follows (Koller et al., 2010):
where debt (D) and equity (E) are measured using market values. From the previous equation, it can be seen that the cost of debt is reduced by the marginal tax rate T_( . The reason for this is that the tax shield is excluded from free cash flow. Since the interest tax shield has value, it must be included in the assessment. The discounted cash flow method when valuing a company values the tax shield in such a way as to reduce the weighted average cost of capital.
In order to determine the weighted average cost of capital for a particular company, it is necessary to evaluate the three components of the WACC, namely: the cost of capital, the after-tax cost of debt and the target capital structure of the company. Given that none of the variables are directly observable, different models, assumptions and approximations are used to estimate each component. These models estimate the expected return on alternative investments with similar risk using market prices. This is why the term expected return is used interchangeably with cost of capital. As the cost of capital is also used to allocate capital within the firm, it can also be called the required return or rate of return.
There are several ways to calculate the cost of permanent capital. One way to calculate the cost of permanent capital is to use the Capital Asset Pricing Model (CAPM), i.e., to calculate the required rate of return. According to this model, the required rate of return is calculated based on the following equation (Vidučić, 2006):
Where in:
R_f – risk-free rate of return;
R_ - rate of return on the market portfolio; and
_j - a measure of systematic risk for a given company.
According to Damodaran recommendation, the cost of equity capital for emerging markets can be calculated using the following formula (Damodaran, 2015):
98
(3) (4)
Prof. Almir Alihodžić, PhD Banking 2023
Where in:
r_f – risk-free rate on assets;
_ - beta coefficient of the selected group of companies; RP - denotes the market risk premium; and CRP - denotes the country risk premium for Bosnia and Herzegovina.
According to Damodaran, the risk premium of developing markets with the political risk of the countries of Eastern Europe and South America is estimated at 8.5% (Damodaran, 2002). As there are no official statistics for monitoring and calculating the risk-free rate of return in Bosnia and Herzegovina, in this research the weighted average interest rate on bonds of the Government of the Federation of B&H of 0.75% and the average weighted interest rate on bonds of the Government of the Republic of Srpska of 2.70% were taken. Therefore, the average weighted interest rate in this research will be 1.72% (https://www.mft.gov.ba). We will calculate the costs of long-term debt for selected companies listed on the Sarajevo and Banja Luka Stock Exchanges based on data from the latest financial reports, using the following formula (Kočović et al. 2016):
The beta coefficient measures the intensity of changes in the return on a share according to changes in the return on the overall share market. Therefore, the beta coefficient explains how much the rate of return of the observed stock will change if the rate of return of the market portfolio changes by 1.
How is it for the market, i.e., for the market portfolio =1, if the company stock has >1 , then it will increase the risk of the portfolio, on the other hand, if there is <1, then it will reduce the risk of the portfolio. It has been empirically confirmed that for beta coefficients there is a statistical phenomenon called regression towards the mean. This practically means that securities that have a high beta, i.e., >1 in one period, will in principle have a lower beta in the future. The following also applies, that securities with a low beta, i.e., < 1 will have a higher beta in the future. In this research the beta will be adjusted to multiply the sample score by 2/3 and the value of 1.0 by 1/3 so the adjusted beta will be: (Adjusted _h (Bodie et al. 2009). In this research, we will calculate the beta coefficient using the following formula:
Where in:
_j - standard deviation of security j;
_ - standard deviation of the market; and - the coefficient of correlation.


99
(5) (6) (7) 1
The symbol of the issued bonds of the Government of the Federation of B&H is FBH60321 and the issue date is 30 June 2021., while the symbol of the issued bonds of the Government of the Republic of Srpska is RSBD-025 and the issue date is 24 March 2021.
1
Prof. Almir Alihodžić, PhD
Cost of Capital – The Effect to the Firm Value and Profitability of Companies: Evidence of a Selected Group of Companies on the Sarajevo and Banja Luka Stock Exchanges
Given that the cost of capital uses the German risk-free rate as well as the capital risk premium given in euros, the cost of capital for the companies considered is estimated as follows (Damodaran, 2009):
Where in:
E(i_S ) – expected inflation in Bosnia and Herzegovina; and E(i_e ) – expected inflation in the EU.
In order to analyze the obtained results in more detail in this research, in addition to the average rate of return and standard deviation of the selected group of companies, higher moments of the distribution around the middle will also be calculated and analyzed. The third moment around the mean or skewness describes the deviation of the value of a numerical variable from the arithmetic mean, in order to show the way the value of the variable is distributed around the mean (Lewis, 1973). Therefore, the skewness can be defined as the ratio of the third moment about the mean and the standard deviation to the third power. The skewness is calculated according to the following formula:
In the case of a normal distribution, the skewness is 0, that is, there is an equal probability of achieving a negative or positive return. The skewness usually ranges in the interval ±2, and when it comes to a highly asymmetric return distribution, it takes on even higher values. Roundness around the modal peak of the frequency distribution curve represents kurtosis, which is defined as the ratio of the fourth moment around the center and the standard deviation to the fourth power (Šoškić and Serdar, 1994).
Kurtosis is used in finance to describe extreme events, that is, those events that fall into the very tail of the distribution. Kurtosis is expressed using the following formula:
In the case of a normal distribution, the kurtosis is 3.
A frequent cause of misunderstandings when assessing the kurtosis of a particular distribution using computer programs for its calculation is that in most mathematical software packages, including Microsoft Excel, the amount of kurtosis is already reduced by 3 a priori. As the return-on-investment measure is used in a wide variety of forms with other performance indicators such as net profit, it is again more explicitly stated here in the variation of return on assets (ROA). Therefore, the return on assets takes into account the company net profit as well as interest costs and relates them to the average total assets of the balance sheet (Schmidlin, 2014):
100
(8) (9) (10) (11) Prof.
,PhD Banking 2023
Almir Alihodžić
Return on equity (ROE) shows the return on equity provided by shareholders. To calculate this important ratio, net profit is set against the average shareholders’ equity during the business year. In the calculation, it is important to enter the net profit and shareholders’ equity after deducting the minority interests in order to take into account only the figures to which the shareholders are actually entitled.
This ratio gives investors an amount that can be compared between different companies and investment opportunities. A low return on equity indicates an inefficient use of capital or an overvaluation of its assets (and therefore shareholders’ equity). Because of its connection between net profit and shareholders’ equity, return on equity constitutes the central coefficient of profitability for shareholders. Net profit margin shows how many cents of profit are made per dollar of sales. Companies with an excellent market position, strict cost control and a low level of debt especially show very high net profit margins. The net profit margin is expressed as follows:
Market power and cost management have a significant impact on the amount of net profit margin. The more pronounced the possibility of adjusting prices and at the same time lower costs, the higher the profit margin. For this reason, monopolistic or oligopolistic firms usually show high net profit margins.

Data for Analysis
Descriptive statistics in this research cover the period from 03 January 2018 to 30 December 2021, which is a total of 1.011 days. The selection of company shares in this research was carried out in such a way that the most liquid shares with high turnover and market capitalization higher than the median market capitalization from different sectors of activity were selected. The analyzed initial data refers to the monthly movement of the prices of the selected shares. For the purposes of the market movement of returns, an analysis based on the movement of the SASX-30 and BIRS stock market indices was used. The level of economic development of the observed countries, which are at a similar level of economic development as Bosnia and Herzegovina, was taken as a criterion for the selection of a wider literature review. Therefore, the results of the research of selected companies from the observed countries that have a similar rate of economic growth as B&H are presented, all with the aim of greater comparability and comparability of the impact of the weighted average cost of capital on business profitability indicators. The stock exchange index SASX - 30 is a price index, i.e., index dividends paid are not taken into account when calculating the index. The SASX -30 index aims to enable investors and analysts to assess the general trend on the most liquid part of the Sarajevo Stock Exchange. Only symbols of issuers listed on the Primary Free Market (PFM) can be included in the composition of the index. The initial value of the index SASX - 30 (base value) is 1.000 index points, while the initial date of the index (base date) is 31.03.2009. Composition of the SASX-30 index as of 1 March 2023 consists of 30 companies with the following structure:
101
(12) (13) 2 2
The primary free market is a sub-segment of the Free Market of the Sarajevo Stock Exchange.
Prof. Almir Alihodžić, PhD
Cost of Capital – The Effect to the Firm Value and Profitability of Companies: Evidence of a Selected Group of Companies on the Sarajevo and Banja Luka Stock Exchanges
102
No. Symbol Issuer 1. BHTSR BH Telecom a.d. Sarajevo 2. BORBRK3 Privredna banka Sarajevo a.d. Sarajevo
BSNCR Bosanac a.d. Orašje 4. BSOSRK1 Adriatic osiguranje a.d. 5. BSRSRK2 Bosna Reosiguranje a.d Sarajevo 6. DCNSR TP DC Sarajevo a.d. Sarajevo 7. DCTKR DC Tešanj Kraševo a.d. 8. ENISR Energoinvest a.d. Sarajevo 9. FDSSR Badeco adria a.d. Sarajevo 10. HRCAR Hercegovina auto a.d. Mostar 11. HTKMR JP HT a.d. Mostar 12. IGKCRK3 Igman a.d. Konjic 13. IKBZRK2 ASA banka a.d. Sarajevo 14. INGMRK2 Ingram a.d. Srebrenik 15. ITRTRK1 Interšped a.d. Tuzla 16. JPEMR JP Elektroprivreda HZHB Mostar 17. JPESR JP Elektroprivreda BiH a.d. Sarajevo 18. LSLBRK3 Lječilište Slana banja a.d. 19. MGVSR Magros veletrgovina a.d. Sarajevo 20. RIBNR Riba Neretva a.d. 21. RMUBR RMU Banovići a.d. Banovići 22. RPRZRK2 RMK Promet a.d. Zenica 23. RSTTR Rudnik Soli Tuzla a.d. Tuzla 24. SOSOR Sarajevo osiguranje a.d. Sarajevo 25. STFJR Štamparija Fojnica a.d. Fojnica 26. TBOTRK1 Trgovina Borac a.d. Travnik 27. TCMKR Tvornica cementa Kakanj a.d. Kakanj 28. TRGCR Trgocoop a.d. Ljubuški 29. ZGPSR GP ŽGP a.d. Sarajevo 30. ZVDPR Zavod za vodoprivredu a.d.
Table 1: Composition of the SASX-30 Index
3.
Stock
Source: The Sarajevo
Exchange (www.sase.ba)
2023
Prof. Almir Alihodžić, PhD Banking
The stock market index of Republika Srpska - BIRS includes the highest quality shares of companies and banks. It was formed on 1 May 2004. The number of shares included in BIRS can vary from 5 to 15, depending on the fulfillment of the criteria for including shares in the BIRS index. The number of issuers whose shares are included in BIRS depends on the number of issuers on the official stock market and the number of issuers that meet the requirements for BIRS membership. Shares of issuers that meet the general conditions and criteria for inclusion of shares in BIRS can be included in BIRS, with the exception of shares of investment funds. Composition of the BIRS index as of 01 March 2023 consists of 12 companies with the following structure:
Results and discussion
The table below illustrates the obtained results of the realized monthly rates of return of selected shares and stock market indices SASX-30 and BIRS for the period: 03 January 2018. – 31 December 2021.
Table 3: Descriptive Statistics of Average (Monthly) Returns and Higher Moments of Distribution
Around the Middle of the Selected Shares in the Stock Market Indices SASX-30 and BIRS for the Period: 03 January 2018 – 31 December 2021
Source: Calculation by the author based on data from the Sarajevo and Banja Luka Stock Exchanges
103
No. Symbol Issuer 1. ALPR-R-A Alpro a.d. Vlasenica 2. BOKS-R-A Boksit a.d. Milići 3. BVRU-R-A ZTC Banja Vrućica a.d. Teslić 4. DEST-R-A Hemijska industrija destilacija a.d. Teslić 5. EKBL-R-A Elektrokrajina a.d. Banjaluka 6. ELDO-R-A Elekto Doboj a.d. Doboj 7. HEDR-R-A Hidroelektrane na Drini a.d Višegrad 8. HELV-R-A Hidroelektrane na Vrbasu a.d. Mrkonjić Grad 9. HETR-R-A Hidroelektrane na Trebišnjici a.d. Trebinje 10. RITE-R-A RITE Gacko a.d. Gacko 11. RTEU-R-A RITE Ugljevik a.d. Ugljevik 12. TLKM-R-A Telekom Srpske a.d. Banjaluka
Banja Luka Stock Exchange (www.blberza.com)
Table 2: Composition of the BIRS Index
Source:
TIK Average re-turn Standard devi-ation Skewness Kurtosis Min Max BHTSR 0.01 1.86 27.48 0.62 8.22 14.20 JPESR 0.08 2.86 23.54 1.00 7.20 17.81 SOSOR 0.15 2.97 27.59 1.24 4.85 16.01 TCMKR 0.04 0.97 77.94 3.73 22.50 32.90 SASX-30 0.06 0.45 60.10 4.35 961.32 1.778.08 TLKM-R-A 0.04 1.53 60.67 0.41 0.77 1.42 BVRU-R-A 0.06 1.91 71.46 3.00 0.57 1.45 BOKS-R-A 0.03 0.79 203.19 -12.52 0.45 0.71 HETR-R-A 0.06 3.08 25.13 0.42 0.16 0.43 BIRS 0.02 0.89 10.10 -0.36 488.0 733.54
Prof. Almir Alihodžić ,PhD
Cost of Capital – The Effect to the Firm Value and Profitability of Companies: Evidence of a Selected Group of Companies on the Sarajevo and Banja Luka Stock Exchanges
Comparing the obtained average rates of return of selected companies in the composition of the SASX-30 and BIRS stock market indices in the observed period, a very small deviation from the value of zero is noticeable, which is in accordance with the theoretical assumption of many approaches and models for measuring market risks, which contain the premise that long-term average daily return equal to zero. The highest average rate of return was recorded for the following shares of the observed companies: Sarajevo osiguranje (0.15%), followed by JP Elektroprivreda B&H (0.08) and ZTC Banja Vrućica (0.06). Therefore, these are very low rates of return that are characteristic of the frontier capital market, then a market of very low liquidity, intermittent trading, i.e. a large number of days without trading, which is especially pronounced in the capital market of the Federation of Bosnia and Herzegovina. Also, the impact of the global crisis caused by COVID-19 had an impact on the drop in liquidity and instability of demand, and the withdrawal of both domestic and foreign investors. In terms of the movement of the values of the higher moments of the distribution around the center (skewness and kurtosis), very fluctuating values were recorded. The highest values of the skewness were achieved in the following company shares: BOKS-RA (203.19), TCMKR (77.94), BVRU-RA (71.46), TLKM-RA (60.67). These results point to the conclusion that the selected shares of the selected group of companies have a significant asymmetric distribution of returns. Unlike the skewness, the kurtosis in the observed period, values above 3 were realized in the shares of the company TCMKR (3.73) and in the stock index SASX-30 (4.35). These results point to the conclusion that the distribution of the returns of TCMKR shares and the stock index SASX-30 have very rounded „tails“ (edges) compared to the normal distribution. A high value of kurtosis indicates a more frequent occurrence of extreme events, positive or negative, than assumed by a normal distribution.
Table 4: Movement of the β Coefficient and Corrected β for Shares in the Stock Market Indices SASX-30 and BIRS for the Period: 03 January 2018 – 31 December 2021
Source: Calculation by the author
Based on the calculation, it should be noted that only three shares out of a total of eight shares of the company have a beta value greater than 1, while the other shares show a slower tendency to change in relation to market changes because they have a beta value less than 1. Shares of companies with a beta value greater than 1 are as follows: Hidroelektrane Trebišnjica – HETR-R-A (beta value is 1.87), JP Elektroprivreda BiH - JPESR (beta value is 1.51), then Sarajevo osiguranje - SOSOR (beta value is 1.02). Also, the standard deviation as the first measure of risk for these three observed shares has a high value, which follows a beta value above unity. The lowest beta value was achieved by the shares of the company Boksit Milići (beta value is only 0.09), which corresponds to a lower systematic risk and a negative average rate of return (table 4).
Table 5 illustrates the obtained results of debt costs (calculated on the basis of formula 6), costs of equity capital (calculated on the basis of formulas 5 and 8) and WACC (calculated on the basis of formula 3) of the selected group of companies. Only one company from the sample (TLKM-RA) has a significant share of debt in total capital. The cost of debt of the observed companies from the sample is relatively small and ranges from a minimum of 0.02% (BVRU-RA) to a maximum of 8.49% (BOKSRA). On the other hand, the cost of capital for the companies in the sample ranges from a minimum of 4.95% (shares of BOKS-RA) to a maximum of 11.41% (shares of HETR-RA), while the WACC ranges from a minimum of 5.11% (shares of TCMKR) to maximum 10.87% (shares of HETR-RA company).
104
BHTSR JPESR SOSOR TCMKR TLKM-R-A BVRU-R-A BOKS-R-A HETR-R-A coefficient 0.73 1.51 1.02 0.14 0.62 0.58 0.09 1.87 corrected 0.82 1.34 1.01 0.43 0.75 0.72 0.39 1.58
Prof. Almir Alihodžić, PhD Banking 2023
From the previous table, it is evident that the highest values of the weighted average cost of capital were recorded by the following company shares: shares of the company Hidroelektrana TrebišnjicaHETR-RA (10.87%), then shares of the company JP Elektroprivreda B&H - JPESR (9.34%) and shares the company Sarajevo osiguranje - SOSOR (8.19%). Therefore, all three observed and analyzed companies in the stock market indices SASX-30 and BIRS had beta values above unity for the observed time period, which leads to the conclusion that their prices move in the same direction as the market (but are slightly more volatile than the market), that is, with taking on a higher systematic risk, they also achieve positive rates of return. For example, the company Hidroelektrane Trebišnjica achieved a net profit of around 3.06 million euros in 2021, which represents a relative increase of around 3.878% compared to the previous year. Also, in 2021, JP Elektroprivreda B&H achieved net profit in the amount of about 23.17 million euros, which represents a relative increase of about 194% compared to the previous year. In 2021, the company Sarajevo osiguranje achieved a net profit in the amount of about 781 thousand euros, which represents a relative increase of about 914% compared to the previous year. The capital structure of the observed firms expressed through WACC may be the cumulative result of the firms’ previous attempts, such as issuing shares, or it may be influenced by temporary fluctuations in the cost of capital.
Table 6: Analysis of Trends in the Values of the WACC, ROA, ROE and NPM Indicators of the Selected Group of Companies as of 31 December 2021 (in %)
105
BHTSR JPESR SOSOR TCMKR TLKM-R-A BVRU-R-A BOKS-R-A HETR-R-A kd(%) 1.83 0.54 1.77 2.04 2.91 0.02 8.49 0.77 beta 0.73 1.51 1.02 0.14 0.62 0.58 0.09 1.87 rf (%) 0.0172 0.0172 0.0172 0.0172 0.0172 0.0172 0.0172 0.0172 RP(%) 4.72 4.72 4.72 4.72 4.72 4.72 4.72 4.72 CRP(%) 6.30 6.30 6.30 6.30 6.30 6.30 6.30 6.30 kee(%) 9.76 13.44 11.13 6.98 9.24 9.05 6.74 15.14 kes(%) 7.29 10.11 8.33 5.14 6.88 6.73 4.95 11.41 E/(E+D) 0.92 0.92 0.98 0.99 0.63 0.92 0.82 0.95 D/(E+D) 0.08 0.08 0.02 0.01 0.37 0.08 0.18 0.05 WACC (%) 6.83 9.34 8.19 5.11 5.30 6.19 5.43 10.87
Table 5: Cost of Debt, Equity Capital and WACC for a Selected Group Of Shares in the SASX-30 and BIRS Stock Market Indices as of 31 December 2021
Source: Calculation by the author
WACC ROA ROE NPM BHTSR 6.83 2.17 6.37 11.82 JPESR 9.34 1.29 0.41 8.51 SOSOR 8.19 1.22 3.29 2.52 TCMKR 5.11 6.62 14.18 25.64 TLKM-R-A 5.30 5.79 10.85 17.33 BVRU-R-A 6.19 7.44 8.86 27.80 BOKS-R-A 5.43 0.14 0.23 0.31 HETR-R-A 10.87 0.60 0.65 10.44
Source: Calculation by the author
Prof. Almir Alihodžić, PhD
Cost of Capital – The Effect to the Firm Value and Profitability of Companies: Evidence of a Selected Group of Companies on the Sarajevo and Banja Luka Stock Exchanges
From the table it can be concluded that for certain companies there is no direct correlation and connection between the indicator of the weighted average cost of capital and the indicator of the profitability of the company operations. Companies such as TCMKR and TLKM-RA have a very low value in terms of the weighted average cost of capital, but on the other hand very high values of the profitability indicator. Except for these companies, BOKS-RA also has a low value in terms of the weighted average cost of capital, but also very low values of profitability indicators. The reasons for the different movement of the profitability indicators should first of all be sought in the value of the basic capital, then the number of shareholders, the stability of the business, the branch of activity and other factors. The different values of the weighted average cost of capital are primarily the consequence and influence of the different movement of the value of the beta coefficient and the influence of systematic risk. Certain companies of the selected sample (BOKS-RA, TCMKR and TLKM-RA) have an increased share of net financial expenses in long-term debts, which means that they use expensive sources of capital in a way to employ them in a profitable way.
Table 7: Pearson Coefficient of Correlation Between Variables:
the Selected Group of Companies
The obtained results of the correlation analysis from the previous table indicate that there is a negatively significant correlation between the weighted average cost of capital on the one hand and all profitability indicators on the other hand. The obtained results agree with the results of Hussain and Islam (2012), Syed et al. (2012), as well as with the results of Momčilović et al. (2021).
Conclusion
From the point of view of investors, all investors want their capital to be invested in the company where they can have the maximum return on their investment, otherwise they will not stay in the given company for long. Therefore, the company should maintain its profit and try to improve it. If the rate of return is not higher than the cost of capital, then the company cannot survive and in that case the shareholders will sell their shares and transfer to another company in order to get a better profit. Therefore, a company should create such a strategy so that its profit margins can be maximized and can give benefits to its shareholders in the form of cash dividends. The weighted average cost of capital is an important determinant of the profitability of a company’s operations. Investment decisions of companies depend to a large extent on operating costs. Therefore, it is very important to understand how the weighted average cost of capital affects the profitability of the business.
106
ROA, ROE, NPM, WACCfor
ROA ROE NPM WACC Pearson Correlation 1.000 0.887 0.930 - 0.576 Sig (2-tailed) - 0.03 0.01 0.01 Pearson Correlation 0.887 1,000 0.811 -0.666 Sig (2-tailed) 0.03 - 0.01 0.03 Pearson Correlation 0.930 0.811 1.000 -0.358 Sig (2-tailed) 0.01 0.01 - 0.03 Pearson Correlation -0.576 -0.666 -0.358 1.000 Sig (2-tailed) 0.01 0.03 0.03 -
Source: Calculation by the author
ROA ROE NPM WACC
Prof. Almir Alihodžić, PhD Banking 2023
This study was conducted to analyze and interpret empirical evidence on the impact of cost of capital and performance effects on profitability. Therefore, this research aimed to calculate the average weighted cost of capital for a selected group of companies in the stock market indices SASX-30 and BIRS with the highest turnover, and then to determine whether there is mutual conditioning and correlation between the selected indicators of profitability (ROA, ROE and NPM) and WACC. The average weighted cost of capital in this research for the selected group of companies was about 7.16%. The highest value of WACC was recorded for the shares of the company HETR-RA (10.87%), while on the other hand, the lowest value was achieved for the shares of the company TCMKR (5.11%). The height of the WACC directly comes from and depends on the value of the cost of capital, and indirectly depends on the value of the beta coefficients. The obtained results also show that there is a negative correlation between WACC on the one hand and ROA, ROE and NPM on the other hand. This is primarily the result of the fact that a certain group of companies use expensive sources of capital, but employ capital profitably, and in this connection have a high WACC and profitability indicators.
In comparison with previous studies, it can be concluded that the results obtained in terms of the influence of WACC on profitability indicators for a selected group of companies in Bosnia and Herzegovina are identical to the results obtained in the research of Hussain and Islam (2012), Sharma (2012), Hussain and Chakraborty (2010) and Tashfeen and Lytton (2010). This is primarily the result of the same degree of economic development of the observed countries and Bosnia and Herzegovina. Also, a large number of countries from the relevant literature review, as well as Bosnia and Herzegovina, have a high market risk premium, as well as the country risk premium.
As the research sample is relatively small, this research should be further expanded in order to obtain more adequate conclusions. Also, when choosing a company, you should keep in mind the following factors that characterize the frontier capital market in Bosnia and Herzegovina: low liquidity, intermittent trading, low rates of return, low market capitalization, and other factors. Therefore, when including additional companies in the analysis, should be taken into account those companies with the highest turnover and the largest number of active trading days.
The findings of this research supplement and improve the existing literature regarding the effect and influence of the cost of capital on the financial performance of the company, and can serve the managers of the observed companies to better plan the profitability of their business in terms of the use and influence of the costs of own and borrowed capital. The results of this analysis can be used as a reference for future research related to similar research topics. Consideration of other profitability factors together with WACC will provide space for understanding the relative impact of WACC on business profitability.
Management of the financial structure of the company certainly represents a continuous job that depends on numerous internal and external factors, so the conclusions obtained from this research should not be understood as final. In this regard, the recommendation of this research is that this issue is constantly investigated through the analysis of a larger number of companies, variables and a longer period of time.
107
Prof. Almir Alihodžić, PhD
Cost of Capital – The Effect to the Firm Value and Profitability of Companies: Evidence of a Selected Group of Companies on the Sarajevo and Banja Luka Stock Exchanges
References
1. Alihodžić, A. (2011). Portfolio analiza - teorijsko metodološki aspekti investiranja u vrijednosne papire. Univerzitet u Zenici - Ekonomski fakultet Zenica.
2. Alihodžić, A. (2013). Primjena CAPM modela u vrednovanju finansijske imovine na tržištu kapitala BiH, Ekonomske teme, Vol. 51(1), str. 139-154.
3. Bhargav, P. (2017). Association of Financial Leverage with Cost of Capital and Shareholder Value: An Empirical Study of BSE Sensex Companies, Nmims. Journal of Economics and Public Policy. Volume 2, Issue 1.
4. Bhatnagar, V.K., Kumari, M., Sharma, N. (2015). Impact of Capital Structure & Cost of Capital on Shareholders’ Wealth Maximization - A Study of BSE Listed Companies in India, Chanakya International Journal of Business Research, Vol. 1(1), pp. 28-36.
5. Bhayani, S. (2009). Impact of Financial Leverage on Cost of Capital and Valuation of Firm: A Study of Indian Cement Industry. PARADIGM, Vol. XIII., Issue 2, pp.44-49.
6. Bodie, Z., Kane, A., Marcus, A.J. (2009). Osnovi investicija. DATA STATUS, Beograd.
7. Božović, M. (2021). Empirijski izazovi finansijske teorije. Centar za izdavačku delatnost Ekonomskog fakulteta u Beogradu. Beograd.
8. Chowdhury, A., Chowdhury, S.P. (2010). Impact of Capital Structure on Firm’s Value: Evidence from Banladesh. Business and Economic Horizons, Vol.3., No.3., pp. 111-122.
9. Damodaran, A. (2002). Investment valuation: Tools and techniques for determining the value of any asset. New York: John Wiley and Sons, Inc.
10. Damodaran, A. (2009). Volatility Rules: Valuing Emerging Companies. Retrivered from https://pages.stern.nyu.edu/~adamodar/pdfiles/papers/emergmkts.pdf
11. Damodaran, A. (2015). Applied Corporate Finance (4th Ed.). Hoboken, NJ: John Wiley & Sons Inc.
12. Fama, E. F., French, K. R. (2002). Testing trade-off and pecking order prediction, about dividends and debt. Review of Financial Studies, 15(1), pp.1–33.
13. Frank, M. Z., Goyal, V. K. (2009). Capital structure decisions: Which factors are Reliability important? Financial Management, 38, pp. 1-38.
14. Gilchrist, S., Zakrajsek, E. (2007). “Investment and the cost of capital: New evidence from the corporate bond market”. National Bureau of Economic Research Cambridge, Mass. USA. Working Paper No. 13174.
15. Gordon, M. (1962). The Investment, Financing, and Valuation of the Corporation. Homewood, III: Irwin, 1962.
16. Higgins, R.C. (2005). Analysis of Financial Management. 3rd Edition, McGraw-Hill Irwin.
17. Hussain, S. A. G., Islam, Z. (2012). Impact of WACC on Corporate Profitability: A case study of cement industry of Pakistan Journal of Risk and Diversification.
18. Hussain, T., Chakraborty, L. (2010). Is the cost of capital animportant determinant of market performance of private commercial banks in Bangladesh? In Proceedings of ASBBS, ASBBS Annual Conference: Las Vegas ,Vol. 17, No. 1, pp. 389-399.
19. Khadka, H. B.(2007). Leverage and the Cost of Capital: Some Tests Using Nepalese Data. Journal of Nepalese Business Studies, 3(1), pp. 85–91.
20. Kočović, J., Paunović, M., Jovanović, M. (2016). Determining the Discount Rate: The Case of Oil Industry in Serbia. Ekonomika preduzeća, 64 (5-6), pp. 371-381.
108
Prof. Almir Alihodžić, PhD Banking 2023
21. Koller, T., Goedhart, M., Wessels, D. (2010). Valuation Measuring and Managing the Value of Companies, fifth edition, John Wiley & Sons, Inc.
22. Komisija za hartije od vrijednosti Republike Srpske (2020). Izvještaj o stanju na tržištu hartija od vrijednosti za 2020. godinu. Dospuno na: https://www.secrs.gov.ba/Documents/ Izvjestaji/a9ea9f9f-e960-41b4-b51f-f12207032022_sr-Latn-CS.pdf.
23. Lewis, E.E. (1973). Methods of Statistical Analysis in Economics and Business. Boston: Houghton Miflin Company. 24. Miglo, H. (2012). Corporate Finance: Basic Theory and Advances Topics. 11th Ed. Xlibris Corporation.
25. Momčilović, M., Begović, S.V., Jovin, S. (2021). Research of the relationship between the weighted average cost of capital and selected profitability ratios of companies in the Republic of Serbia. International Journal of Economic Practice and Policy, Vol. XVIII, Issue 2, pp. 141-155.
26. Momčilović, M., Vlaović Begović, S. (2020). The Relationship between Weighted Average Cost of Capital and Profitability of Companies in Serbia: Case Study. Economic development and competitivenes of European countries: Challenges of economic integration, pp. 98-102.
27. Parmjit, K., Neeti, K. (2019). Relationship of Cost of Capital, Cost of Equity Capital, Value of Firm & other Financial Variables: Panel Data & Simultaneous Equation Analysis of Indian Companies. Finance India. Vol. 33. No. 2., pp. 21-58.
28. Ragil, S., Solimon, H. (2014). The Influence of Company Size and Capital Structure towards Liqudity, Corporate Performance and Firm Value, for Large and Small Group Companies. European Journal of Business and Management, Vol. 6., No.18, pp. 148-156.
29. Rajan, R., Zingales, L. (1995). What do we know about capital structure - Some evidences from international data. Journal of Finance. No. 50, pp. 1421-1460.
30. Ross, A.A. (2007). Modern Financial Management. 7th Ed. McGrawHill Irwin.
31. Schmidlin, N. (2014). The Art of Company Valuation and Financial Statement Analysis. John Wiley & Sons Ltd.
32. Sharma, A. (2012). Cost of Capital and Profitability Analysis - A Case Study of Telecommunication Industry. Journal of Commerce and Accounting Research. Volume 1. Issue 4.
33. Simmons, S., Banu. (2016). “Cost of capital and US investment: Does financing matter after all?”. The Quarterly Review of Economics and Finance, 60, pp. 86-93.
34. Singapurwoko, A., El-Wahid, M.S. (2011). The Impact of Financial Leverage to Profitability, Study of Non-Financial Companies Listed in Indonesia Stock Exchange. European Journal of Economics, Finance, and Administrative Sciences, No. 32, pp.136-148.
35. Syed, W.H., Ghayanfar, A., Zia, U.I. (2012). Impact of WACC on Corporate Profitability. Impact of Risk and Diversification, No. 4, pp.1-7.
36. Šoškić, I., Serdar, V. (1994). Uvod u statistiku, Školska knjiga, Zagreb.
37. Tashfeen, H., Liton, C. (2010). Is The Cost of Capital an Important Determinant of Market Performance of Private Commercial Banks in Bangladesh?”, Proceedings of ASBBS, ASBBS Annual Conference: Las Vegas , Volume 17, Number 1, pp.389-399.
38. Učkar, D., Urti, J. (2015). Utjecaj finansijske strukture na profitabilnost hrvatskih preduzeća. Oeconomica Jadertina, Vol.5. No.2, pp. 13-25.
39. Vidučić, Lj. (2006). Finansijski menadžment, V. Izdanje. Zagreb: RriF Plus.
40. Vukičević, M., Gregurek, M., Odobašić, S., Grgić, J. (2010). Finansijski menadžment u MS Excelu. Golden marketing - Tehnička knjiga, Zagreb.
109
Prof. Almir Alihodžić, PhD
Cost of Capital – The Effect to the Firm Value and Profitability of Companies: Evidence of a Selected Group of Companies on the Sarajevo and Banja Luka Stock Exchanges
BAROMETAR/BAROMETER
MAJ 2022 – APRIL 2023. /MAY 2022. - APRIL 2023
1.PROMET / TURNOVER
110
Belgrade Stock Exchange Banking 2023 Mesec/Month Listing Open Market MTP/MTF Ukupno/Total Regulisano tržište/Regulated market Broj transakcija/Number of transactions Maj 2022 9.919.443.195 304.783.345 10.224.226.540 41.664.773 10.265.891.313 2.788 Jun 2022 1.934.625.257 200.481.199 2.135.106.456 142.514.877 2.277.621.333 2.299 Jul 2022 354.339.606 178.637.741 532.977.347 53.487.861 586.465.208 1.775 Avgust 2022 4.479.060.082 459.733.906 4.938.793.988 29.345.450 4.968.139.438 2.300 Septembar 2022 850.312.236 92.472.647 942.784.883 22.516.108 965.300.991 1.774 Oktobar 2022 1.382.479.554 84.339.714 1.466.819.268 440.877.757 1.907.697.025 1.642 Novembar 2022 3.393.942.645 134.121.872 3.528.064.517 182.919.377 3.710.983.894 2.090 Decembar 2022 2.706.540.040 38.091.892 2.744.631.932 173.968.399 2.918.600.331 1.957 Januar 2023 1.855.816.964 69.718.707 1.925.535.671 482.820 1.926.018.491 1.426 Februar 2023 496.636.474 140.492.064 637.128.538 83.060 637.211.598 2.261 Mart 2023 465.898.836 121.447.122 587.345.958 202.110 587.548.068 2.282 April 2023 2.580.251.497 302.197.746 2.882.449.243 114.300 2.882.563.543 1.424 30.419.346.385 2.126.517.955 32.545.864.340 1.088.176.892 33.634.041.232 24.018
*RSD
2.INDEKSI
111 Barometar/Barometer
/ INDICES
3. TRŽIŠNA KAPITALIZACIJA / MARKET CAPITALISATION
PARTICIPATION
4. UČEŠĆE STRANIH INVESTITORA / FOREIGN INVESTORS
BELEX15 BELEXline Poslednja vrednost / Last value 904,49 1.806,97 Promena (abs) / Change (abs) 79,88 67,11 Promena (%) / Change (%) 9,69% 3,86% Najviša vrednost / Maximum value 911,05 1.815,11 Najniža vrednost / Minimum value 775,14 1647,62 Istorijski max / History maximum value 3.335,20 5.007,34 Istorijski min / History minimum value 347,46 841,99 Vrednost prometa / Value of turnover 145.334.312,00 149.326.626,00 Maj/May 2022. April/ April 2023 Maj/May 2022. April/ April 2023 NOVEMBAR DECEMBAR JANUAR Ukupna tržišna kapitalizacija/ Total market capitalisation Regulisano tržište/Regulated Market Listing Prime Listing – akcije/ Prime Listing – shares Standard Listing – akcije/ Standard Listing - shares Open Market MTP/MTF BELEX15 BELEXline 431.522.019 436.036.727 433.739.843 421.214.173 425.743.377 423.446.494 208.954.075 212.520.188 219.369.187 212.260.099 213.223.189 204.077.307 10.307.846 10.293.349 10.293.349 251.657.167 255.722.120 259.689.196 263.681.542 267.566.924 272.656.407
Belgrade Stock Exchange
Participation total 63,24% b-FIS 62,76% s-FIS 63,73% FIS FIB 1,61% FIT 22,85%
Učešće stranih investitora/Foreign Investors
*u hiljadama RSD / in RSD thousands
112 Belgrade Stock Exchange Banking 2023
Datum BELEX15 BELEXLine BELEX15 BELEXLine 4.5.2022 820,36 1.659,22 BELEX15 BELEXLine 5.5.2022 819,36 1.658,21 BELEX15 BELEXLine 6.5.2022 820,11 1.660,18 BELEX15 BELEXLine 9.5.2022 827,42 1.669,56 BELEX15 BELEXLine 10.5.2022 825,02 1.664,14 BELEX15 BELEXLine 11.5.2022 819,91 1.655,95 BELEX15 BELEXLine 12.5.2022 821,23 1.655,02 BELEX15 BELEXLine 13.5.2022 818,16 1.647,98 BELEX15 BELEXLine 16.5.2022 817,26 1.649,90 BELEX15 BELEXLine 17.5.2022 818,28 1.648,40 BELEX15 BELEXLine 18.5.2022 820,02 1.651,65 BELEX15 BELEXLine 19.5.2022 818,11 1.650,37 BELEX15 BELEXLine 20.5.2022 821,79 1.654,29 BELEX15 BELEXLine 23.5.2022 815,90 1.647,62 BELEX15 BELEXLine 24.5.2022 817,12 1.649,39 BELEX15 BELEXLine 25.5.2022 819,40 1.652,64 BELEX15 BELEXLine 26.5.2022 816,56 1.651,50 BELEX15 BELEXLine 27.5.2022 819,05 1.653,79 BELEX15 BELEXLine 30.5.2022 823,34 1.658,11 BELEX15 BELEXLine 31.5.2022 830,92 1.669,36 BELEX15 BELEXLine 1.6.2022 832,79 1.673,44 BELEX15 BELEXLine 2.6.2022 835,67 1.680,09 BELEX15 BELEXLine 3.6.2022 838,03 1.689,22 BELEX15 BELEXLine 6.6.2022 842,89 1.701,00 BELEX15 BELEXLine 7.6.2022 835,82 1.692,93 BELEX15 BELEXLine 8.6.2022 830,79 1.675,50 BELEX15 BELEXLine 9.6.2022 830,51 1.674,40 BELEX15 BELEXLine 10.6.2022 827,32 1.666,31 BELEX15 BELEXLine 13.6.2022 826,64 1.671,40 BELEX15 BELEXLine 14.6.2022 827,78 1.675,74 BELEX15 BELEXLine 15.6.2022 826,17 1.673,22 BELEX15 BELEXLine 16.6.2022 820,39 1.668,64 BELEX15 BELEXLine 17.6.2022 819,51 1.668,97 BELEX15 BELEXLine 20.6.2022 836,00 1.687,39 BELEX15 BELEXLine 21.6.2022 832,97 1.678,96 BELEX15 BELEXLine 22.6.2022 831,67 1.679,12
Indeks_Belex15 Indeks_BELEXLine
113 Barometar/Barometer Belgrade Stock
BELEX15 BELEXLine 23.6.2022 830,78 1.678,47 BELEX15 BELEXLine 24.6.2022 834,46 1.682,61 BELEX15 BELEXLine 27.6.2022 836,43 1.684,43 BELEX15 BELEXLine 28.6.2022 835,58 1.683,26 BELEX15 BELEXLine 29.6.2022 839,27 1.690,11 BELEX15 BELEXLine 30.6.2022 839,62 1.690,07 BELEX15 BELEXLine 1.7.2022 837,51 1.686,34 BELEX15 BELEXLine 4.7.2022 838,45 1.682,39 BELEX15 BELEXLine 5.7.2022 843,81 1.687,95 BELEX15 BELEXLine 6.7.2022 844,08 1.688,22 BELEX15 BELEXLine 7.7.2022 841,77 1.680,86 BELEX15 BELEXLine 8.7.2022 842,55 1.680,82 BELEX15 BELEXLine 11.7.2022 852,32 1.691,50 BELEX15 BELEXLine 12.7.2022 860,74 1.700,44 BELEX15 BELEXLine 13.7.2022 863,94 1.710,29 BELEX15 BELEXLine 14.7.2022 858,19 1.704,14 BELEX15 BELEXLine 15.7.2022 854,71 1.696,71 BELEX15 BELEXLine 18.7.2022 845,48 1.690,21 BELEX15 BELEXLine 19.7.2022 839,43 1.678,98 BELEX15 BELEXLine 20.7.2022 836,92 1.678,25 BELEX15 BELEXLine 21.7.2022 832,03 1.675,55 BELEX15 BELEXLine 22.7.2022 841,39 1.688,98 BELEX15 BELEXLine 25.7.2022 833,31 1.679,60 BELEX15 BELEXLine 26.7.2022 836,01 1.689,42 BELEX15 BELEXLine 27.7.2022 835,2 1.692,66 BELEX15 BELEXLine 28.7.2022 833,01 1.687,08 BELEX15 BELEXLine 29.7.2022 835,74 1.692,16 BELEX15 BELEXLine 1.8.2022 839,44 1.693,66 BELEX15 BELEXLine 2.8.2022 841,19 1.693,75 BELEX15 BELEXLine 3.8.2022 841,27 1.693,90 BELEX15 BELEXLine 4.8.2022 842,51 1.695,66 BELEX15 BELEXLine 5.8.2022 843,48 1.698,15 BELEX15 BELEXLine 8.8.2022 846,08 1.698,28 BELEX15 BELEXLine 9.8.2022 840,98 1.691,71 BELEX15 BELEXLine 10.8.2022 838,66 1.688,76 BELEX15 BELEXLine 11.8.2022 846,91 1.699,07 BELEX15 BELEXLine 12.8.2022 845,94 1.697,10
Exchange
114 Belgrade Stock Exchange Banking 2023 BELEX15 BELEXLine 15.8.2022 843,61 1.692,08 BELEX15 BELEXLine 16.8.2022 845,17 1.694,25 BELEX15 BELEXLine 17.8.2022 841,61 1.687,20 BELEX15 BELEXLine 18.8.2022 846,18 1.701,87 BELEX15 BELEXLine 19.8.2022 847,74 1.701,28 BELEX15 BELEXLine 22.8.2022 848,40 1.700,93 BELEX15 BELEXLine 23.8.2022 849,62 1.702,59 BELEX15 BELEXLine 24.8.2022 851,58 1.705,50 BELEX15 BELEXLine 25.8.2022 850,50 1.705,50 BELEX15 BELEXLine 26.8.2022 850,76 1.705,75 BELEX15 BELEXLine 29.8.2022 851,05 1.704,82 BELEX15 BELEXLine 30.8.2022 852,57 1.707,94 BELEX15 BELEXLine 31.8.2022 848,18 1.705,64 BELEX15 BELEXLine 1.9.2022 848,50 1.712,98 BELEX15 BELEXLine 2.9.2022 852,62 1.725,95 BELEX15 BELEXLine 5.9.2022 855,80 1.729,68 BELEX15 BELEXLine 6.9.2022 855,70 1.724,66 BELEX15 BELEXLine 7.9.2022 851,36 1.724,57 BELEX15 BELEXLine 8.9.2022 849,71 1.718,43 BELEX15 BELEXLine 9.9.2022 847,97 1.715,01 BELEX15 BELEXLine 12.9.2022 845,04 1.712,11 BELEX15 BELEXLine 13.9.2022 847,71 1.725,08 BELEX15 BELEXLine 14.9.2022 842,58 1.721,72 BELEX15 BELEXLine 15.9.2022 848,00 1.727,29 BELEX15 BELEXLine 16.9.2022 846,67 1.727,35 BELEX15 BELEXLine 19.9.2022 849,82 1.732,64 BELEX15 BELEXLine 20.9.2022 848,57 1.735,12 BELEX15 BELEXLine 21.9.2022 847,98 1.734,24 BELEX15 BELEXLine 22.9.2022 846,01 1.731,69 BELEX15 BELEXLine 23.9.2022 841,23 1.729,95 BELEX15 BELEXLine 26.9.2022 831,50 1.719,18 BELEX15 BELEXLine 27.9.2022 831,60 1.717,41 BELEX15 BELEXLine 28.9.2022 823,55 1.707,73 BELEX15 BELEXLine 29.9.2022 827,24 1.716,82 BELEX15 BELEXLine 30.9.2022 827,37 1.716,95 BELEX15 BELEXLine 3.10.2022 825,65 1.715,19 BELEX15 BELEXLine 4.10.2022 827,77 1.726,17
115 Barometar/Barometer Belgrade
BELEX15 BELEXLine 5.10.2022 829,66 1.730,09 BELEX15 BELEXLine 6.10.2022 828,07 1.712,97 BELEX15 BELEXLine 7.10.2022 829,85 1.714,81 BELEX15 BELEXLine 10.10.2022 828,92 1.713,78 BELEX15 BELEXLine 11.10.2022 831,29 1.716,30 BELEX15 BELEXLine 12.10.2022 834,94 1.727,97 BELEX15 BELEXLine 13.10.2022 829,34 1.744,95 BELEX15 BELEXLine 14.10.2022 827,92 1.722,48 BELEX15 BELEXLine 17.10.2022 808,50 1.695,37 BELEX15 BELEXLine 18.10.2022 808,75 1.698,33 BELEX15 BELEXLine 19.10.2022 803,29 1.694,41 BELEX15 BELEXLine 20.10.2022 808,37 1.723,56 BELEX15 BELEXLine 21.10.2022 805,48 1.739,00 BELEX15 BELEXLine 24.10.2022 808,00 1.779,35 BELEX15 BELEXLine 25.10.2022 809,36 1.781,38 BELEX15 BELEXLine 26.10.2022 804,39 1.776,11 BELEX15 BELEXLine 27.10.2022 803,83 1.775,43 BELEX15 BELEXLine 28.10.2022 797,94 1.760,75 BELEX15 BELEXLine 31.10.2022 794,31 1.751,59 BELEX15 BELEXLine 1.11.2022 793,79 1.753,39 BELEX15 BELEXLine 2.11.2022 788,17 1.745,31 BELEX15 BELEXLine 3.11.2022 779,84 1.731,05 BELEX15 BELEXLine 4.11.2022 779,85 1.726,01 BELEX15 BELEXLine 7.11.2022 787,52 1.734,08 BELEX15 BELEXLine 8.11.2022 786,56 1.730,79 BELEX15 BELEXLine 9.11.2022 793,61 1.732,94 BELEX15 BELEXLine 10.11.2022 780,00 1.712,96 BELEX15 BELEXLine 14.11.2022 789,32 1.725,11 BELEX15 BELEXLine 15.11.2022 800,46 1.747,93 BELEX15 BELEXLine 16.11.2022 808,22 1.762,68 BELEX15 BELEXLine 17.11.2022 808,93 1.754,84 BELEX15 BELEXLine 18.11.2022 806,89 1.754,92 BELEX15 BELEXLine 21.11.2022 803,41 1.749,16 BELEX15 BELEXLine 22.11.2022 806,57 1.750,18 BELEX15 BELEXLine 23.11.2022 807,14 1.750,28 BELEX15 BELEXLine 24.11.2022 811,95 1.759,80 BELEX15 BELEXLine 25.11.2022 816,51 1.764,71
Stock Exchange
116 Belgrade Stock Exchange Banking 2023 BELEX15 BELEXLine 28.11.2022 813,97 1.756,89 BELEX15 BELEXLine 29.11.2022 814,97 1.761,58 BELEX15 BELEXLine 30.11.2022 815,83 1.768,97 BELEX15 BELEXLine 1.12.2022 812,91 1.768,29 BELEX15 BELEXLine 2.12.2022 813,97 1.769,42 BELEX15 BELEXLine 5.12.2022 810,29 1.764,61 BELEX15 BELEXLine 6.12.2022 811,69 1.767,78 BELEX15 BELEXLine 7.12.2022 814,66 1.770,84 BELEX15 BELEXLine 8.12.2022 815,60 1.772,38 BELEX15 BELEXLine 9.12.2022 811,54 1.766,33 BELEX15 BELEXLine 12.12.2022 809,16 1.759,04 BELEX15 BELEXLine 13.12.2022 810,28 1.760,12 BELEX15 BELEXLine 14.12.2022 810,59 1.763,12 BELEX15 BELEXLine 15.12.2022 811,58 1.764,22 BELEX15 BELEXLine 16.12.2022 809,33 1.760,72 BELEX15 BELEXLine 19.12.2022 810,14 1.762,12 BELEX15 BELEXLine 20.12.2022 808,95 1.760,85 BELEX15 BELEXLine 21.12.2022 808,92 1.761,01 BELEX15 BELEXLine 22.12.2022 811,25 1.763,45 BELEX15 BELEXLine 23.12.2022 808,73 1.765,64 BELEX15 BELEXLine 26.12.2022 809,51 1.766,47 BELEX15 BELEXLine 27.12.2022 809,77 1.767,33 BELEX15 BELEXLine 28.12.2022 811,27 1.723,50 BELEX15 BELEXLine 29.12.2022 824,61 1.739,86 BELEX15 BELEXLine 9.1.2023 820,82 1.739,12 BELEX15 BELEXLine 10.1.2023 839,12 1.762,76 BELEX15 BELEXLine 11.1.2023 839,09 1.772,70 BELEX15 BELEXLine 12.1.2023 839,93 1.773,56 BELEX15 BELEXLine 13.1.2023 842,93 1.778,74 BELEX15 BELEXLine 16.1.2023 841,16 1.773,99 BELEX15 BELEXLine 17.1.2023 843,22 1.776,19 BELEX15 BELEXLine 18.1.2023 831,64 1.749,76 BELEX15 BELEXLine 19.1.2023 833,05 1.754,45 BELEX15 BELEXLine 20.1.2023 833,56 1.755,53 BELEX15 BELEXLine 23.1.2023 838,01 1.750,84 BELEX15 BELEXLine 24.1.2023 841,96 1.757,94 BELEX15 BELEXLine 25.1.2023 851,88 1.768,42
117 Barometar/Barometer Belgrade
BELEX15 BELEXLine 26.1.2023 840,76 1.742,27 BELEX15 BELEXLine 27.1.2023 852,41 1.759,49 BELEX15 BELEXLine 30.1.2023 854,89 1.759,23 BELEX15 BELEXLine 31.1.2023 860,34 1.765,65 BELEX15 BELEXLine 1.2.2023 857,36 1.762,79 BELEX15 BELEXLine 2.2.2023 861,61 1.755,78 BELEX15 BELEXLine 3.2.2023 865,76 1.761,33 BELEX15 BELEXLine 6.2.2023 865,18 1.748,55 BELEX15 BELEXLine 7.2.2023 864,04 1.748,52 BELEX15 BELEXLine 8.2.2023 868,66 1.753,42 BELEX15 BELEXLine 9.2.2023 872,16 1.768,84 BELEX15 BELEXLine 10.2.2023 878,54 1.775,49 BELEX15 BELEXLine 13.2.2023 872,23 1.763,70 BELEX15 BELEXLine 14.2.2023 869,08 1.752,40 BELEX15 BELEXLine 17.2.2023 875,94 1.762,03 BELEX15 BELEXLine 20.2.2023 876,33 1.768,56 BELEX15 BELEXLine 21.2.2023 877,61 1.770,12 BELEX15 BELEXLine 22.2.2023 877,73 1.765,34 BELEX15 BELEXLine 23.2.2023 882,70 1.773,90 BELEX15 BELEXLine 24.2.2023 874,54 1.767,25 BELEX15 BELEXLine 27.2.2023 878,85 1.775,83 BELEX15 BELEXLine 28.2.2023 876,22 1.776,33 BELEX15 BELEXLine 1.3.2023 878,79 1.784,55 BELEX15 BELEXLine 2.3.2023 880,08 1.785,46 BELEX15 BELEXLine 3.3.2023 891,48 1.815,11 BELEX15 BELEXLine 6.3.2023 890,58 1.798,22 BELEX15 BELEXLine 7.3.2023 889,95 1.795,77 BELEX15 BELEXLine 8.3.2023 889,17 1.791,22 BELEX15 BELEXLine 9.3.2023 892,16 1.795,70 BELEX15 BELEXLine 10.3.2023 894,40 1.799,18 BELEX15 BELEXLine 13.3.2023 894,45 1.795,53 BELEX15 BELEXLine 14.3.2023 894,51 1.796,74 BELEX15 BELEXLine 15.3.2023 892,05 1.792,73 BELEX15 BELEXLine 16.3.2023 897,31 1.799,69 BELEX15 BELEXLine 17.3.2023 897,50 1.799,08 BELEX15 BELEXLine 20.3.2023 895,28 1.799,81 BELEX15 BELEXLine 21.3.2023 896,98 1.802,34
Stock Exchange
118 Belgrade Stock Exchange Banking 2023 BELEX15 BELEXLine 22.3.2023 894,64 1.798,01 BELEX15 BELEXLine 23.3.2023 898,95 1.799,7511 BELEX15 BELEXLine 24.3.2023 891,15 1.790,20 BELEX15 BELEXLine 27.3.2023 894,17 1.794,92 BELEX15 BELEXLine 28.3.2023 891,87 1.792,56 BELEX15 BELEXLine 29.3.2023 889,26 1.789,62 BELEX15 BELEXLine 30.3.2023 888,41 1.789,03 BELEX15 BELEXLine 31.3.2023 891,29 1.798,01 BELEX15 BELEXLine 3.4.2023 888,04 1.791,65 BELEX15 BELEXLine 4.4.2023 885,72 1.789,55 BELEX15 BELEXLine 5.4.2023 883,79 1.780,31 BELEX15 BELEXLine 6.4.2023 885,58 1.783,31 BELEX15 BELEXLine 7.4.2023 883,38 1.781,00 BELEX15 BELEXLine 10.4.2023 878,48 1.780,13 BELEX15 BELEXLine 11.4.2023 868,31 1.767,80 BELEX15 BELEXLine 12.4.2023 870,24 1.770,23 BELEX15 BELEXLine 13.4.2023 878,88 1.781,13 BELEX15 BELEXLine 18.4.2023 886,66 1.792,94 BELEX15 BELEXLine 19.4.2023 888,05 1.794,36 BELEX15 BELEXLine 20.4.2023 889,28 1.794,39 BELEX15 BELEXLine 21.4.2023 893,45 1.796,99 BELEX15 BELEXLine 24.4.2023 903,11 1.802,13 BELEX15 BELEXLine 25.4.2023 895,82 1.792,35 BELEX15 BELEXLine 26.4.2023 903,82 1.798,06 BELEX15 BELEXLine 27.4.2023 910,59 1.813,13 BELEX15 BELEXLine 28.4.2023 904,49 1.806,97 700,00 750,00 800,00 850,00 900,00 950,00 1.550,00 1.600,00 1.650,00 1.700,00 1.750,00 1.800,00 1.850,00
BELEXLine BELEX15


119 Barometar/Barometer
2022 Ukupno/Total ORS/RS Bonds Obveznice preduzeća Akcije/Shares maj.22 10.265.891.313 2.701.476.264 0 7.564.415.049 jun.22 2.277.621.333 1.884.010.963 0 393.610.370 jul.22 586.465.208 305.113.671 0 281.351.537 avg.22 4.968.139.438 4.415.054.752 0 553.084.686 sep.22 965.300.991 829.521.701 0 135.779.290 okt.22 1.907.697.025 1.361.147.451 0 546.549.574 nov.22 3.710.983.894 3.173.524.753 0 537.459.141 dec.22 2.918.600.331 2.633.372.307 0 285.228.024 jan.23 1.926.018.491 1.808.427.047 0 117.591.444 feb.23 637.211.598 227.809.312 0 409.402.286 mar.23 587.548.068 251.378.033 336.170.035 apr.23 2.882.563.543 2.453.909.769 428.653.774 0,0 2,0 4,0 6,0 8,0 10,0 12,0 maj.22 jun.22 jul.22 avg.22 sep.22 okt.22 nov.22 dec.22 jan.23 feb.23 mar.23 apr.23 Billions Ukupno/Total ORS/RS Bonds Obveznice preduzeća Akcije/Shares jan 2022- jan 2023. U mlrd dinarima / RSD
Belgrade Stock Exchange
Udruženje banaka Srbije
UPUTSTVO ZA AUTORE
Radovi za časopis Bankarstvo moraju biti originalni i prethodno neobjavljivani. Autor odgovara za podatke objavljene u tekstu.
Radovi se klasifikuju kao: originalni naučni, pregledni i stručni.Uredništvo zadržava pravo da tekst koji ne odgovara datim kriterijumima vrati autoru kao neodgovarajući ili radi izmena i dopuna. Drugim rečima, nijedan rad neće biti poslat na recenziju ukoliko nisu ispoštovana sva pravila data u Uputstvu.
Radovi domaćih autora, što se odnosi i na autore iz Bosne i Hercegovine, Crne Gore i Hrvatske, primaju se na srpskom i engleskom jeziku. Ukoliko nedostaje jedan od navedenih jezika, rad će biti vraćen autoru. Strani autori radove predaju na engleskom jeziku.
Uz rad obavezno dostaviti popunjen formular „Podaci o autoru”, koji se nalazi na našem sajtu: www. casopisbankarstvo.rs/uputstvo-za-autore-i-recenzente.
U tekstu ne navoditi nikakve lične podatke pošto se rad šalje na anonimnu recenziju. Prva stranica rada treba da sadrži: naslov rada, rezime i ključne reči.
JEL klasifikaciju određuje redakcija u skladu sa klasifikacijom Journal of Economic Literature.
Postupak testiranja na plagijat obaviće se nakon pozitivnih recenzija rada. Radovi će biti odbijeni ukoliko se utvrdi plagijat, autoplagijat ili lažno autorstvo.
Radove dostavljati isključivo u elektronskom obliku na mejl adresu: bankarstvo@ubs-asb.com

120
Banking 2023
Uputstvo
Molimo da rad pripremite pridržavajući se obavezno sledećih uputstava koja se podjednako odnose na tekst i na srpskom i na engleskom jeziku:
• Rad treba da bude u A4 formatu, sve margine 20 mm.
• Dužina rada najviše 10 strana uključujući grafikone, tabele, literaturu i ostale priloge. Ukoliko rad po obimu prevazilazi date propozicije, na uredništvu je odluka da li će ga publikovati ili ne.
• Font i veličina fonta za ceo rad: isključivo Times New Roman, latinica, 10pt, razmak između redova single.
• Naslov rada mora da bude kratak i jasan.
• Posle naslova rada napisati rezime dužine do 150 reči.
• Posle rezimea dati do 10 ključnih reči, pogodnih za indeksiranje i pretraživanje.
• Osim glavnog naslova (naslova rada) koristiti u tekstu do dva nivoa naslova, bez numeracije.
• Početak pasusa kucati od početka kolone (bez tabulatora).
• Ukoliko uz tekst idu šeme ili grafikoni, označiti u radu gde treba da budu i napraviti ih isključivou programu Word, Excel ili PowerPoint.
• Ukoliko rad sadrži fotografije, označiti u radu gde one treba da stoje i priložiti svaku kao poseban fajl u formatu .eps ili .tiff, rezolucija 300 dpi.
• Tabela po širini ne sme da prelazi margine, a po dužini ne sme biti duža od jedne stranice i mora imati naslov i izvor.
• U tekstu i tabelama ne koristiti tekst boksove.
• Web adrese kucati kao tekst, a ne kao hiperlink.
• Ispraviti sve gramatičke i greške u kucanju.
• Nazivi institucija se, prilikom prvog pominjanja, navode u prevodu a u zagradi originalni naziv i skraćenica.
• Fusnote nisu predviđene (reference navesti u tekstu i obavezno u literaturi).
• Reference se u tekstu navode tako što se u zagradi navedu prezime autora i godina izdanja. Citirani delovi teksta navode se u radu tako što se u zagradu stave prezime autora, godina izdanja i broj strane sa koje je citat. Ukoliko se radi o dva autora, imenuju se oba uz godinu izdanja, a ako ima tri i više autora, navodi se samo prvi (prezime prvog autora + i saradnici sa godinom izdanja).
Svaka referenca se mora navesti i u popisu literature
121 Uputstvo za autore
Udruženje banaka Srbije
• Literaturu grupisati na kraju rada po sledećem principu: - Knjige: Klasens R. (2006). Sprečavanje pranja novca. Beograd: Udruženje banaka Srbije
- Časopisi: Pantelić S. (2013). Flavije Valerije Konstantin (306-337). Bankarstvo 42 (4), 136-145. (prilikom citiranja iz elektronskih verzija časopisa na kraju dodati: doi broj citiranog članka, ako ga ima, odgovarajući internet link i datum pristupa)
- Ostali izvori - vebsajtovi (internet adresa i datum pristupa), disertacije (prezime, ime, naslov, institucija gde je doktorska disertacija odbranjena, godina), službene publikacije (naziv publikacije/organizacije/ustanove, naslov, mesto izdavanja, izdavač, broj, godina).
Postupak recenzije
Radove recenziraju dva stručna, nezavisna recenzenta.
Recenzenti dobijaju radove bez ličnih podataka autora. Posle recenzije popunjavaju formular o kvalitetu rada za časopis Bankarstvo (koji se nalazi na našem sajtu: www.casopisbankarstvo.rs/uputstvo-za-autore-i-recenzente) i dostavljaju ga Redakciji u roku od 30 dana.
U delu koji se odnosi na napomene i preporuke obaveza je recenzenata da objasne date ocene i preporuče da li je rad za objavljivanje, ispravku ili odbijanje. Radovi će biti prihvaćeni za objavljivanje ili poslati na ispravku isključivo ako su obe recenzije pozitivne.
Konačnu odluku o tome da li će rad biti publikovan ili ne donosi glavni i odgovorni urednik.
122
Udruženje banaka Srbije
Banking 2023
for the authors
INSTRUCTIONS FOR THE AUTHORS
Papers sent to Bankarstvo Journal must be original and previously unpublished. The author is liable for the data published in the text.
The papers are classified as: original scientific papers, scientific review articles and expert articles.
The Editorial Office retains the right to return to the author the text which does not meet the set criteria, as inappropriate or requiring additional changes and amendments. In other words, no paper will undergo review unless it fulfils all the rules defined in the Instructions.
Papers by domestic authors, including the authors from Bosnia and Herzegovina, Montenegro and Croatia, are to be submitted in Serbian and in English. If the paper in either of these languages is missing, the paper will be returned to the author altogether. Foreign authors submit their papers in English.
Along with the paper, it is obligatory to submit the completed Author’s Personal Data form, to be found on our website: www.casopisbankarstvo.rs/en/instructions-for-authors-and-reviewers.The text itself should not contain any personal data since it is to be sent for anonymous review.
The first page must contain: the title, abstract, and keywords.
JEL classification is determined by the Editorial Office pursuant to the classification of the Journal of Economic Literature.
Plagiarism testing is performed after the paper gets positive reviews. The paper will be rejected if there is a detected case of plagiarism, auto-plagiarism or false authorship.
Papers are to be submitted exclusively in electronic form to: bankarstvo@ubs-asb.com
123
Association of Serbian Banks
Instructions
Instructions
We kindly ask you to prepare your papers strictly in accordance with the following instructions, which equally refer to the texts in Serbian and in English:
• The paper should be in A4 format, all margins 20mm.
• The paper should be maximum 10 pages long, including charts, tables, bibliography and other appendices. If the paper exceeds the given proportions in volume, the Editorial Office decides whether to publish it or not.
• Font and font size for the entire paper: exclusively Times New Roman, 10pt, with single spacing.
• The title of the paper should be short and concise.
• Below the title the author is to write an abstract of up to 150 words.
• The abstract is to be followed by up to 10 keywords, suitable for indexing and search purposes.
• In addition to the main title (title of the paper), use up to two levels of titles in the text, without numeration.
• Each paragraph is to be typed from the beginning of the column (without tabulator).
• If the text is accompanied with graphs or charts, please designate where in the paper they should be placed, and enclose each of them exclusively in Word, Excel or PowerPoint.
• The author should also designate where in the paper photographs should be placed, submitting each of them as a separate file in the .eps or .tiff format, resolution 300 dpi.
• A table must not exceed the margins in width, must not be longer than one page and must have the title and the source.
• Text boxes are not to be used either in the text or in the tables.
• Websites are to be typed as a text, not as a hyperlink.
• Please, correct all grammatical or typing errors.
• When mentioned for the first time, the names of institutions are translated and the original name and abbreviation are given in brackets.
• Footnotes are not to be used (please, state all references directly in the text and in the bibliography at the end of the paper).
• References in the text are given by putting the last name of the author and the year of publishing in brackets. The quoted parts of the text are marked by putting the last name of the author, year of publishing and number of the page from which the text is quoted in brackets. If there are two authors, they are both mentioned along with the year of publishing, and if there are three or more authors, only the first one is mentioned (last name of the first author + et al, along with the year of publishing). Each reference has to be cited in the bibliography, too
124
Association of Serbian Banks Banking 2023
• Bibliography is to be listed at the end of the paper, according to the following citation style:- Books: Claessens R. (2006). Prevention of Money Laundering. Belgrade: Association of Serbian Banks -Journals: Pantelić S. (2013). Flavije Valerije Konstantin (306-337). Bankarstvo 42, (4), 136-145. (when citing from electronic journals, the authors must add: the doi number of the cited article, if available, the appropriate web link and date of access)
- Other sources: web pages (web link and date of access), dissertations (last name, first name, title,institution in which the PhD dissertation was presented, year), official publications (name of publication/organization/institution, title, place of publishing, publisher, issue, year).
Reviewing Procedure
The papers are reviewed by two peer, independent reviewers.
The reviewers receive the papers without any personal data on the authors. Upon reviewing,they fill in the form on paper quality for Bankarstvo Journal (to be found on our website: www.casopisbankarstvo.rs/en/instructions-forauthors-and-reviewers) and submit it to the Editorial
Office within 30 days.
In the section intended for reviewers’ comments and recommendations, the reviewers are obliged to elaborate on the given grades and recommend whether the paper is to be: published, amended or rejected. The papers will be accepted for publication or sent to be amended only if both reviews are positive.
The final decision about whether the paper will be published or not is made by the Editor-In-Chief
125
Association of Serbian Banks
Instructions for the authors
126
