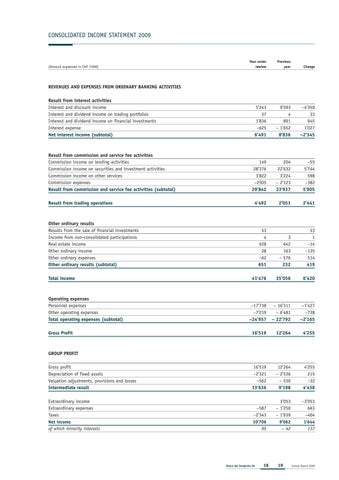
CONSOLIDATED INCOME STATEMENT 2009
Year under rewiew
Previous year
Change
5’243 37 1’836 –625 6’491
9’593 4 891 – 1’652 8’836
–4’350 33 945 1’027 –2’345
149 28’376 3’822 –2505 29’842
204 22’632 3’224 – 2’123 23’937
–55 5’744 598 –382 5’905
4’492
2’051
2’441
53 4 628 28 –62 651
3 642 163 – 576 232
53 1 –14 –135 514 419
41’476
35’056
6’420
–17’738 –7’219 –24’957
– 16’311 – 6’481 – 22’792
–1’427 –738 –2’165
16’519
12’264
4’255
16’519 –2’321 –562 13’636
12’264 – 2’536 – 530 9’198
4’255 215 –32 4’438
Extraordinary income Extraordinary expenses Taxes
–587 –2’343
3’053 – 1’250 – 1’939
–3’053 663 –404
Net income
10’706
9’062
1’644
95
– 42
137
(Amount expressed in CHF 1’000)
REVENUES AND EXPENSES FROM ORDINARY BANKING ACTIVITIES Result from interest activities Interest and discount income Interest and dividend income on trading portfolios Interest and dividend income on financial investments Interest expense Net interest income (subtotal)
Result from commission and service fee activities Commission income on lending activities Commission income on securities and investment activities Commission income on other services Commission expenses Result from commission and service fee activities (subtotal) Result from trading operations
Other ordinary results Results from the sale of financial investments Income from non-consolidated participations Real estate income Other ordinary income Other ordinary expenses Other ordinary results (subtotal) Total income
Operating expenses Personnel expenses Other operating expenses Total operating expenses (subtotal) Gross Profit
GROUP PROFIT Gross profit Depreciation of fixed assets Valuation adjustments, provisions and losses Intermediate result
of which minority interests
Banca del Sempione SA
18
19
Annual Report 2009
