The State of Video Gaming in 2026 | Matthew Ball & Epyllion
By Matthew Ball
The State of Video Gaming in 2026 (Or “Growth and Where to Find It”)
Last Update: February 17, 2026
Chapter I: Spending Growth but More Retrenchment and Margin Struggles in 2025 [Pages 2 –14]
Chapter II: Why Growth is Scarcer Than Headlines Suggest [Pages 15 –41]
Chapter III: Video Games Are Losing the Attention War in the “Major Market 8” [Pages 42 –64]
Chapter IV: The Novel Interactive Competitors Taking Attention, Time, and Spend from Video Games [Pages 65 –86]
Chapter V: The Five Biggest Areas of Revenue Growth in the Video Game Industry in 2026 [Pages 87 –155]
Chapter VI: Closing Thoughts on the “Industry” and Finding Growth in 2026 [Pages 156 –162]
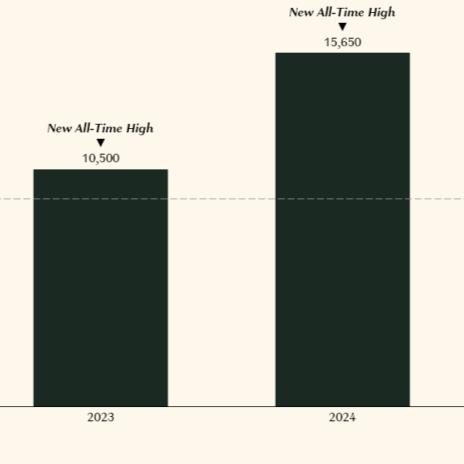
Global video game content sales had a strong 2025, growing 5.3% year -over-year and hitting a new all -time high of about $195.6B ($10B more than the prior high in 2021)
EARLY ACCESS (2.18.2026)
Worldwide Consumer Spending on Video Game Content
(Nominal Prices; Console + PC + Mobile; Excludes Hardware & Accessories; Includes Game Sales, DLC, Microtransactions, Subscri pti ons, and Services)
And fortunately, 2025 as with years prior, boasted several new hit franchises and studios, while many older franchises and studios achieved new heights
EARLY ACCESS (2.18.2026)
Epyllion’s
But despite three straight years of industry growth, a new record high for revenues, and a smattering of new hits each year, private funding for gamemakers fell another 55% in 2025
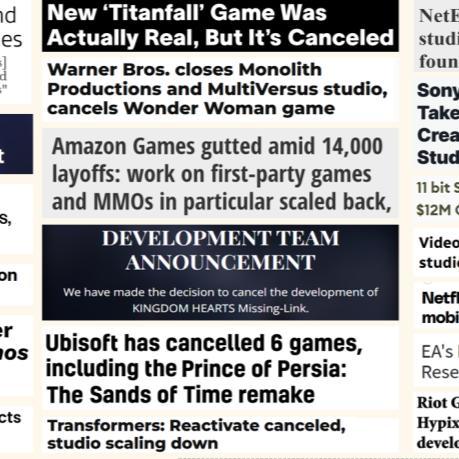
The major gamemakers also continued to whittle their portfolios, cancelling even more of their pipeline in 2025 and shutting down scores of still -operating titles
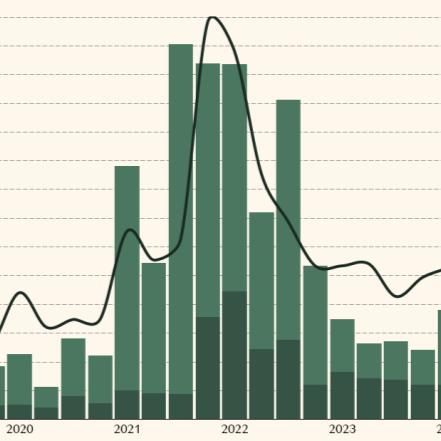
With budgets cut and funding scant, layoffs continued. 2025 was 40% lighter than 2024, but the year still saw some 9,200 losses and brought the four -year total to nearly 44,000
Annual Gross Reported Layoffs in the Video Game Industry (Not Net of Hiring)
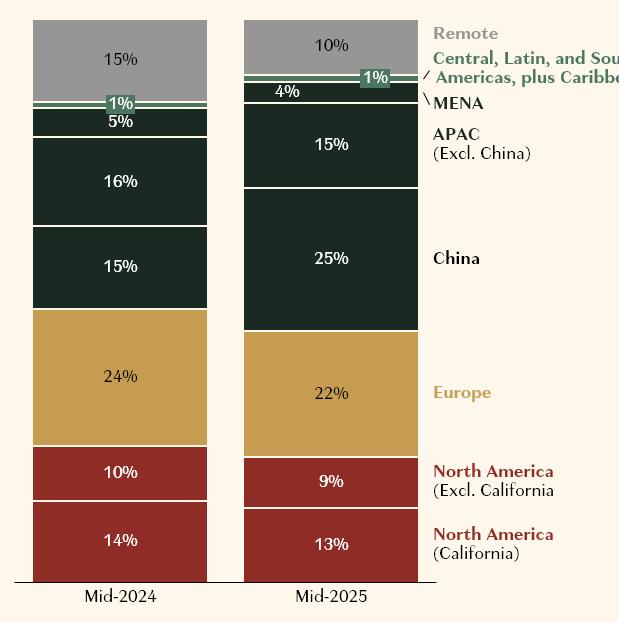
And while hiring has returned (ASGC tracked over 13,000 open postings at the end of 2025), these jobs are highly and increasingly concentrated in lower cost markets
ACCESS (2.18.2026)
Video Game Industry Layoffs (Global; 2022 –2025; As Tracked)
Video Game Industry: Open Roles (Global; As Tracked)
Sources:
Moreover, an increasing share of new content investment goes to external development partners that can offer lower talent costs, shorter commitments, and more flexible contracts
in
Content Development
In sum, the video gaming industry (overall) continued its restructuring and retreat despite revenue growth
Private studio and publisher funding fell another 55%+ by dollars and deal count
Even more games and studios were cut outright or had budgets trimmed
Another 9,000+ layoffs (following 35,000 from 2022 -2024)
Hiring further concentrated in (lower cost) foreign markets
New content investment further concentrated in external development
Which resulted in…
In 2025, content investment as a share of net revenues hit a (non -pandemic) 7 -year low. From 2019 –2022, annual content spend grew $11B (+39%). 2022 –2025 was only $2.3B (+6%)
Total Video Game Content Development Spend
Content Dev Spend as a Share of Net Revenue
Sudden drop due to unexpected surge in consumer spend in the pandemic
Market growth resumes while pipelines and budgets are trimmed
Record uptick caused by post -COVID drop in consumer spend, matched with post -COVID investment increases and cost growth
Even so, the operating margins of standalone gamemakers (i.e., those not owned by game platforms) outside China are far below pre -pandemic levels and struggling to grow
EARLY ACCESS (2.18.2026)
Adj Operating Income as a Share of Net Revenue: 34 Non -China, Non -Platform Video Game Publishers with Accessible P&Ls
(Worldwide; All Platforms; Sample set covers $59B in net revenue in 2025)
In fact, the erosion in margins is so great that total operating profits have declined since 2019 despite consumer spending surging 40%+ (equivalent to $56 billion a year)
(2.18.2026)
Adjusted Operating Income: 33 Non -China, Non -Platform Video Game Publishers with Accessible P&Ls (Worldwide; All Platforms; Sample set covers $59B in net revenue in 2025)
Source:
Chapter I: Spending Growth but More Retrenchment and Margin Struggles in 2025
Chapter II: Why Growth is Scarcer Than Headlines Suggest
Chapter III: Video Games Are Losing the Attention War in the “Major Market 8”
Chapter IV: The Novel Interactive Competitors Taking Attention, Time, and Spend from Video Games
Chapter V: The Five Biggest Areas of Revenue Growth in the Video Game Industry in 2026
Chapter VI: Closing Thoughts on the “Industry” and Finding Growth in 2026
While global consumer spend is now at all -time highs, these topline headlines cover up what has really been a shrinking pool of revenue for most developers/publishers. Why?
China Is Eating the Video Gaming Industry
Net Growth in Console Is Growth in Platform Subscriptions
Brightness in PC Is Only Just Enough (& Might Dim?)
Roblox Is Stealing Share and Growing Its Own Garden
Decline in Home Markets
Industry Competition Is Growing but Appetites Remain Unchanged
Price Increases Are Helping Drive Growth, But Not All Titles Have Pricing Power
China : 20% of global player spend, but now 38% of growth (v. 15% in 2019). If a gamemaker wants to “match” global growth, they must win in China (or grow 1.6x the market elsewhere!)
China : 84% of its player spend goes to Chinese -made games. And foreign gamemakers net only a quarter of the remaining 16% spent on imports after local publishing and distribution
Chinese (Excl. foreign subsidiaries, e.g., Riot, Supercell)
Chinese Publisher Total (Inc. Share of Imports)
Chinese Publisher Share (Direct Game Sales)
China : Chinese gamemakers have also grown their annual share of the non -China market from 10.7% to 14% in six years, thereby grabbing 24% of total non -China growth since 2019
China : While the Chinese market is only 20% of global player spending and “only” 38% of growth, Chinese publishers have captured ~50% of global player spending growth since 2019
ACCESS (2.18.2026)
Global Consumer Spending on Video Games
(PC + Console + Mobile; Spend on Content + Services; Chinese Game Buys Using VPN are Tallied Outside China)
Publisher: Chinese Gamer: Chinese
Publisher: Chinese Gamer: Non -Chinese
Publisher: Non -Chinese Gamer: Chinese (Chinese Publisher’s Cut)
Publisher: Non -Chinese Gamer: Chinese (Foreign Publishers’ Cut)
Publisher: Non -Chinese Gamer: Non -Chinese
Console : By 2025, the category had more than recovered from its post -pandemic sales pullback, hitting an all -time high of $41.6B (2.3% or $570MM above the 2020 high)
Worldwide Consumer Spending on Console Video Game Content (Including Software and Subscriptions)
Console : Yet 119% of net spending growth since 2020 has gone to platform services. Total spending on game sales and transactions is down nearly $3.7B per year (or 11%)
Worldwide Consumer Spending on Console Video Game Content (Including Software and Subscriptions)
Sources:
Console : And as Chinese sales are >150% of total spending growth since 2020, the actual market for gamemakers has shrunk by ~$4.6B (and is up only 8% since 2019!)
Worldwide Consumer Spending on Console Video Game Content
Sources:
PC : Not only did it skip a post -pandemic decline, but annual PC content sales have also grown by a remarkable 30% (or $9.4B) since 2020, roughly 16x as much dollar growth as console
EARLY ACCESS (2.18.2026)
Worldwide Consumer Spending on PC Video Game Content (Including Software and Subscriptions)
PC/Console : But PC’s growth only just outstripped console’s decline. Together and excluding China, the category is +$2.1B (+3.7%) since 2020, well under the +$10B (+14%) headline
ACCESS (2.18.2026)
Consumer Spending on PC & Console Video Game Content
: Note, too, that much of the recent growth in non -Chinese spending was actually
Chinese users who use VPNs to access (and pay for) Steam through foreign markets
ACCESS (2.18.2026)
Top Two User Languages on Steam 1 (Worldwide; Trailing 90 Day Average; Based on Client Language Setting, Rather than First or Most Used Language)
PC : And in 2025, Chinese -language PC users disengaged from Steam (to local alternatives, presumably), finishing the year with the lowest share of the total since May 2022
EARLY ACCESS (2.18.2026)
Top Two User Languages on Steam 1 (Worldwide; Trailing 90 Day Average; Based on Client Language Setting, Rather than First or Most Used Language)
Sources: Valve, Epyllion analysis
Roblox : This singular industry expander was over 4.5% of non -China spend in 2025 and has captured (or created) 60% of net growth since 2021
The Realized Market for Non -Chinese Gamemakers : Up only $1B (or +0.9%) since 2020, even though the total market is up $24B (+14%). And since 2021, the realized market shrunk 1.8%
EARLY ACCESS (2.18.2026)
Worldwide Consumer Spending on Console Video Game Content (Including Software and Subscriptions)
Publisher: Chinese Gamer: Chinese
Publisher: Non -Chinese Gamer: Chinese (Chinese Publisher Cut)
Publisher: Non -Chinese Gamer: Chinese (Chinese Publisher Cut)
Console Platform Subscriptions
Roblox
Publisher: Non -Chinese Gamer: Chinese (Non -Chinese Publisher Cut)
Rest of Market (I.e. Captured by Non -Chinese Publishers)
Home Markets : Meanwhile, the countries that are typically prioritized by major gamemakers have declined outright; it’s smaller and less familiar markets that are growing global revenues
EARLY ACCESS (2.18.2026)
Consumer Spending on Video Game Content in U.S. + Japan + South Korea + Germany + U.K. + France + Canada + Italy
Industry Competition : Despite revenue stagnations, annual releases have surged since 2019: PC is up 150% since 2019 and console 330%. And platform catalogues are +270% and +175%
Steam Game Releases by Year (Released in any Market)
Game Releases by Year (Released in any Market)
Industry Competition : The top PC/Console franchises (each 9 -33 years old) hold a stable 45% of all player hours. And where share has been lost, it’s mostly to other 5 –25-year-old hits
Share of PS/Xbox Console Engagement Hours (Worldwide; Users 18+; 37 Markets excluding India and China)
Share of PC Engagement Hours (Worldwide; Users 18+; 37 Markets excluding India and China)
Industry Competition : New PC/Console games get only 4 –7% of total playtime (and half goes to just four titles). Steam reports higher, but “new” includes each year’s NBA 2K, FC, COD, etc.
EARLY ACCESS (2.18.2026)
Share of Time Spent: PC, PlayStation, & Xbox (Worldwide; Users 18+; 37 Markets excluding India and China)
Share of Time Spent: Steam (Global; Includes Handhelds)
Sources:
Industry Competition : Mobile spend is five years flat and new releases are at a decade low share of spend and downloads as old giants strengthen and UA costs crowd out discovery
Global Mobile Games Revenue by Game Age (Total Dollars; Excludes Android China and non -store IAP payment methods)
Global Mobile Game Installs by Game Age (Excludes Android China and non -OS Platform Stores)
Sources: Sensor Tower, Epyllion analysis
Pricing : Lastly, many of the leaders that have grown or sustained revenue have done so by successfully raising price, not from growing players, purchases, or play time
Share of PlayStation Plus Subs (Share by FY; U.S. prices; Annual plan listed) Top Selling Nintendo Platform Game (By Gen; U.S. Prices; Excludes Forced Bundles)
And so while global player spend has firmly rebounded since 2022, where, when, and how this sum is spent has changed drastically… and thus so too have many developer’s prospects
Chinese Publishers
Captured 50% of Global Spend Growth Since 2019
Net of Platform Subscription Services, Console Spend is Down 13% since 2020
The Net Decline in Console Since 2020 Offsets 68% of PC Growth
Roblox is 60% of Spend Growth
Outside China
Since 2021
In the “ Major Market 8 ,” Spend Is Still Down 4.5% Since 2021
PC/Console Release are up 1.5-3.3x Since 2019 but Share is Captive; New Mobile Releases Are At Record Low Shares
Only the Top Franchises Tend to Have Pricing Power
With growth so elusive (despite record revenues) and margins falling (despite cost cuts), stock prices make more sense. A few names are up 4% or even 200% since the trough…
Indexed Share Prices of Major Non -China Video Game Companies, 2023 –2025 (Indexed to Closing Price of Last Trading Day of 2022 or IPO Closing Price; Based on USD Price)
Indexed to 2021, the picture is even more dire. Only Konami beat the S&P, other “top” performers grew only 4 -24% in five years, most names fell, and many lost 50 -95%
Indexed Share Prices of Major Non -China Video Game Companies, 2021 –2025 (Indexed
Chapter I: Spending Growth but More Retrenchment and Margin Struggles in 2025
Chapter II: Why Growth is Scarcer Than Headlines Suggest
Chapter III: Video Games Are Losing the Attention War in the “Major Market 8”
Chapter IV: The Novel Interactive Competitors Taking Attention, Time, and Spend from Video Games
Chapter V: The Five Biggest Areas of Revenue Growth in the Video Game Industry in 2026
Chapter VI: Closing Thoughts on the “Industry” and Finding Growth in 2026
Prior to the pandemic, eight “developed” countries constituted over 60% of consumer spending on PC, Console, and Mobile content spending
Share of Global Consumer Spend on Video Game Content in 2019
(PC + Console + Mobile; Includes Packaged Games + Microtransactions/DLC + Services & Subscriptions)
(China ranked #2, Russia #9, Mexico #10)
And in the years since the pandemic, the “Mature Market 8” have encountered a severe, persistent, and surprising reality: they are losing in the War for Attention.
Share of Global Consumer Spend on Video Game Content in 2019
(PC + Console + Mobile; Includes Packaged Games + Microtransactions/DLC + Services & Subscriptions)
(China ranked #2, Russia #9, Mexico #10)
U.S. (#1 market by consumer spend globally) : Surveys consistently report that the share of the population that plays games has fallen by 2.5 –4 points since before the pandemic
Canada (#8) : Though irregularly polled, the Canadian trade association’s last report showed that roughly one in six adult players were lost from 2018 to 2022 despite the lockdowns
Canada: Video Gaming Participation Rate (Population 18+)
Canada: Video Gaming Participation by Platform (Population 18+)
South Korea (#4) : The share of the population that plays video games has fallen by 15 points compared to the 2017 –2019 average (and down 22 points since the pandemic high )
South Korea: Video Gaming Participation Rate (Population 10 –64)
South Korea: Video Gaming Participation by Platform (Population 10 –64)
Mobile Console PC
Italy: Video Gaming Participation Rate (Population 6 –64)
Italy (#11) : The share of adults who regularly play video games has shrunk by over 5 points since 2019, with mobile up a point, console down a point, PC down 6.5 points Source:
Italy: Video Gaming Participation by Platform (Population 6 –64)
U.K. (#6) : The overall participation rate grew 21 percentage points in 2020, but a third of these gains has been lost over the four subsequent years, with each platform down
U.K.: Video Gaming Participation Rate (Population 16+)
U.K.: Video Gaming Participation by Platform (Population 16+)
France (#7) : Though participation rates are stable after COVID -19, they have flatlined overall since 2016 at ~52.5% (and individually, each platform has shrunk)
France: Video Gaming Participation Rate (Population 10 –80)
France: Video Gaming Participation by Platform (Population 10 –80)
Source: Syndicat des Editeurs de Logiciels de Loisirs (SELL)
Mobile
Console PC
Germany (#6) : A rare “up” market in terms of participation rates, Germany gained only four players per hundred in the eight years from 2016 to 2024
Germany: Video Gaming Participation Rate (Population 6 –69)
Germany: Video Gaming Participation by Platform (Population 6 –69)
Japan (#3) : With participation rates up 11 points since 2019, Japan is an MM8 outlier.
Though its modest (and shrinking population) means only 6MM new players since 2019
Japan: Video Gaming Participation Rate (Population 5 –59)
Japan: Video Gaming Participation by Platform (Population 5 –59)
Source: Kadokawa
One might argue that the loss of a percent — or two, or three — of players is not that big of a problem for the video gaming industry
If… a player stopped playing altogether
Then… they probably weren’t big gamers
And so… how much revenue or “value” is really lost?
But in practice, all player loss is a compounding problem.
The network effects of all games and gaming platforms are impaired, which in turn impairs the satisfaction and spending rates of all remaining players 5 4 3 2 1 6
Growth can only come from greater monetization of (ever fewer) remaining players
This can come from prices being forced up, players buying more, ads, or serving other business models (e.g., Amazon Prime, Google Cloud, etc.)
If players don’t spend more, all new investments (e.g., hiring, raises, new games, etc.)
must be borne by existing players, or otherwise reduce publisher profits
(Of course, the more likely the latter outcome, the less likely publishers are to do the former)
Individual games can only grow by stealing other games’ players, playtime, or spend
An eat-or-be-eaten market means growing one title involves shrinking one or more others
It’s even harder for new games to break through
New players and markets are always the greatest opportunity for new studios and games
If some players have stopped playing altogether, many are likely playing less, too
Player loss is the clearest signal, but it’s just the “smoke” behind a bigger fire
U.S. (#1) : PC/Console content spend is down 8% since 2020/2021 (or -$2.3B); Mobile’s annual growth flattened out in 2025, but is +12% since 2020 and now outstrips PC/Console
U.S. (#1) : Is not just down on spend, either. Mobile game installs are at a 12 -year low, hours played have tumbled, and even time spent watching video game streaming is flatlined.
EARLY ACCESS (2.18.2026)
U.S. Mobile Game Installs (iOS and Android)
U.S. Mobile Gaming Hours Played (iOS and Android)
Hours Watched of Game Streams (Mostly Twitch, YouTube Gaming, Kick)
Source: Sensor Tower, Stream Hatchet
Canada (#8) : After five years, Canadian PC/Console sales are still 1.5% below 2020’s levels, while mobile is up only 0.7%. Growth is tough when customers are diminishing.
Canada: PC/Console Video Game Content Spend (Packaged Sales + Microtransactions + Subscriptions/Services)
Canada: Mobile Video Game Content Spend (Packaged Sales + Microtransactions + Subscriptions/Services)
U.K. (#5) : PC/Console has flatlined from 2021 –2024 ; Mobile, which has held most of its post -pandemic playerbase , is still growing at a 4.2% CAGR since 2020
Korea (#4) : PC/Console shrank 10% from 2021 –2024 and mobile dropped 4%; USD/KRW
ForEx has been a big headwind, but Q1 –Q3 2025 KRW preliminaries are down 5%+ in Won
ACCESS (2.18.2026)
S. Korea: PC/Console Video Game Content Spend (Packaged Sales + Microtransactions + Subscriptions/Services)
S. Korea: Mobile Video Game Content Spend (Packaged Sales + Microtransactions + Subscriptions/Services)
France (#7) : 2024 saw a 7 -year low in PC/Console; mobile has been mostly sideways since 2020 but is finally starting to edge up, growing 13% from 2020 to 2024
ACCESS (2.18.2026)
France: PC/Console Video Game Content Spend (Packaged Sales + Microtransactions + Subscriptions/Services)
France: Mobile Video Game Content Spend (Packaged Sales + Microtransactions + Subscriptions/Services)
Germany (#5) : Despite minor participation rate growth , PC/Console has declined 8.2% since 2021 and mobile is up only 0.9%
Germany: PC/Console Video Game Content Spend (Packaged Sales + Microtransactions + Subscriptions/Services)
Germany: Mobile Video Game Content Spend (Packaged Sales + Microtransactions + Subscriptions/Services)
Italy (#11) : PC/Console software surged 22% during the pandemic, but four years later, sales were down 20% and 2% under 2019. Mobile is up 9% from 2021 to 2024
Italy: PC/Console Video Game Content Spend (Packaged Sales + Microtransactions + Subscriptions/Services)
Italy: Mobile Video Game Content Spend (Packaged Sales + Microtransactions + Subscriptions/Services)
Japan (#3) : PC/Console is 42% in JPY since 2021, but publishers have been unable to raise prices to net JPY/USD decline, resulting in a 6% fall. Mobile is flat since 2021, thus -27%
Japan: PC/Console Video Game Content Spend (Packaged Sales + Microtransactions + Subscriptions/Services)
Japan: Mobile Video Game Content Spend (Packaged Sales + Microtransactions + Subscriptions/Services)
“Mature Market 8 :” Total PC/Console software sales shrank by 8% from 2021 -2024 ( -$4.2B per year). Mobile is down 3.8% ( -$2.3B), though five of eight markets are at all -time highs
EARLY ACCESS (2.18.2026)
MM8: PC/Console Video Game Content Spend (Packaged Sales + Microtransactions + Subscriptions/Services)
MM8: Mobile Video Game Content Spend (Packaged Sales + Microtransactions + Subscriptions/Services)
Chapter I: Spending Growth but More Retrenchment and Margin Struggles in 2025
Chapter II: Why Growth is Scarcer Than Headlines Suggest
Chapter III: Video Games Are Losing the Attention War in the “Major Market 8”
Chapter IV: The Novel Interactive Competitors Taking Attention, Time, and Spend from Video Games
Chapter V: The Five Biggest Areas of Revenue Growth in the Video Game Industry in 2026
Chapter VI: Closing Thoughts on the “Industry” and Finding Growth in 2026
Interactivity is still ascendant… but that’s video gaming’s challenge. Interactive experiences continue to emerge and offer novel forms of skill mastery, progression loops, and social play
Video Games
Social Video : In just the U.S., consumption of TikTok is up 39 million hours a day compared to the second half of 2020 and first half of 2021 (i.e., after COVID normalization)
Average Daily Hours of TikTok Watched in the U.S. (Total population)
Sources: Emarketer , Epyllion analysis
Social Media
: TikTok’s growth hasn’t come from direct competitors. Americans now use 122
million more hours social media per day than in 2020/21 (~21 mins for each of 341MM people)
Average Daily Hours of Use in the U.S. (Total population)
Sources: Emarketer , Epyllion analysis
Creator Porn : In 2025, Americans spent ~$5B on OnlyFans (up from $215MM in 2019) in exchange for pay -to -access images and video, as well as intimate/parasocial direct messaging
Annual OnlyFans User Spending by Reported Region (USD; Year -End November 30)
Crypto : Crypto always siphoned hours and spend from video gaming, but crypto’s first boom coincided with video gaming’s COVID surge; the second hit during video gaming’s stagnation
EARLY ACCESS (2.18.2026)
Installs of Dedicated Cryptocurrency Trading Apps
(Excludes finance apps with crypto trading, but which are not crypto -focused)
Memecoin Transaction Value: pump.fun + PumpSwap
(These platforms are an inexhaustive but indicative measure of total volumes)
AI Apps : Consumer -centric apps, including those for role play, erotica, and art, have also soared in the years since video gaming stalled (and didn’t exist during gaming’s highs)
EARLY ACCESS (2.18.2026)
Quarterly Installs of Consumer AI/Assistant Apps
(Excludes applications which feature AI/assistants, but are not primarily classified as such)
The second -largest increase in weekly ChatGPT downloads occurred in the two weeks after its viral “Ghibli” art trend in late March 2025
Prediction Markets : In Q4, users placed 1.5MM bets a day, averaging $300 in notional value, with untold hours of research, tracking, and social engagement around these bets
Quarterly Bets on Top Prediction Markets (Global;
Quarterly Notional Value Bet on Prediction Markets (Global; Where Legal)
Annual U.S. Online Sports Betting Lawful GGR by Years Since Launched
(2 States Launched)
iGaming : Only recently legal in parts of the U.S., and sometimes called “ iCasinos ” or “Real Money Gaming,” refers to digital games in which players bet and can cash out money
EARLY ACCESS (2.18.2026)
U.S. iGaming Categories buy Net Player Outlays
(By GGR; Excludes black market/unlicensed betting)
Operating Requirements
(U.S. Example; Non -Exhaustive)
• Secure state license
• Limit operations and advertising to licensed states
• Use client -side geolocation software (PC) and device -side GPS (mobile) software (PC) to ensure customer playing in licensed location
• Deploy Know -Your-Customer (KYC) protocols to ensure user has right to play
• Manage robust anti -money laundering protocols
• Submit to recurring audits of platform operations, security, liquidity, KYC, and luck/odds systems by regulatory authorities
• Deploy “responsible gaming” systems (e.g., deposit limits, selfexclusion capability, long session or large loss reminders)
Singleplayer Table Games (Rendered or Live Camera to a Set)
Multiplayer Poker
Singleplayer Slots
iGaming : Though legal in only 7 states (each growing 22 -117% a year), iGaming is already 2x the size of the mobile casino game category, and 21% of all U.S. video game spend
EARLY ACCESS (2.18.2026)
U.S. iGaming GGR by State (GGR)
U.S. iGaming v Mobile Casino Spend (GGR as a Share of Consumer Spend)
iGaming as Share of U.S. Gaming (GGR as a Share of Consumer Spend)
: Despite (ever fewer) bans in top markets (China, Korea, Japan), players now lose $54B a year in legal markets (up from $11B in 2019), roughly 45% of video game spend
Global iGaming GGR
iGaming : Though the category might seem too distinct to compare to traditional video games, India is a clear case study on how it can squeeze the growth of the latter
Consumer Spending on Video Games in India, Including iGaming (Excluding VAT; Excludes black market/unlicensed betting)
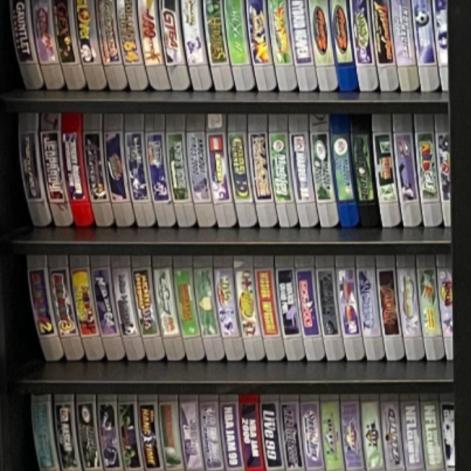
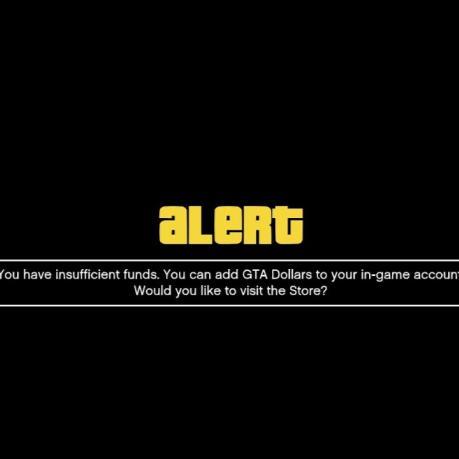
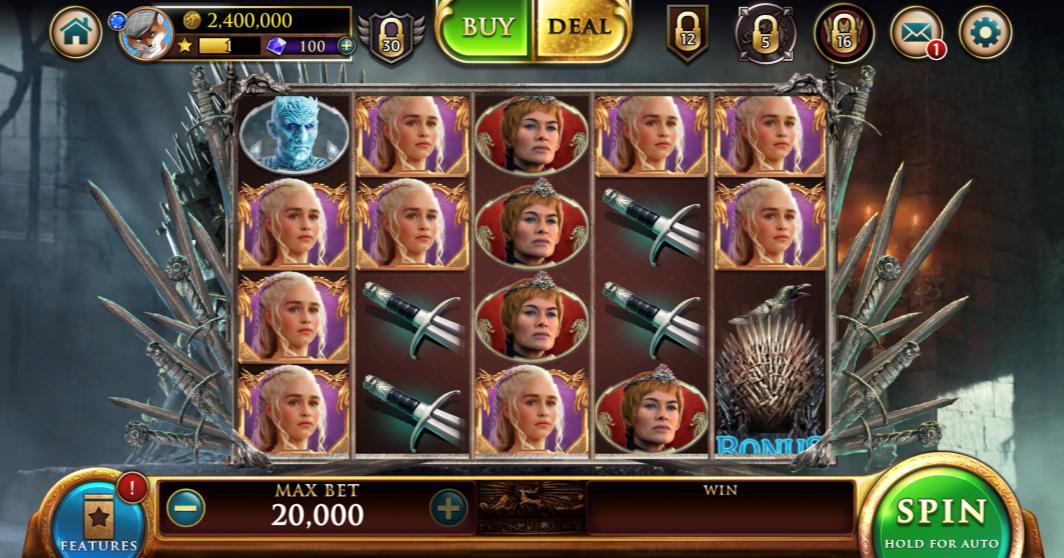
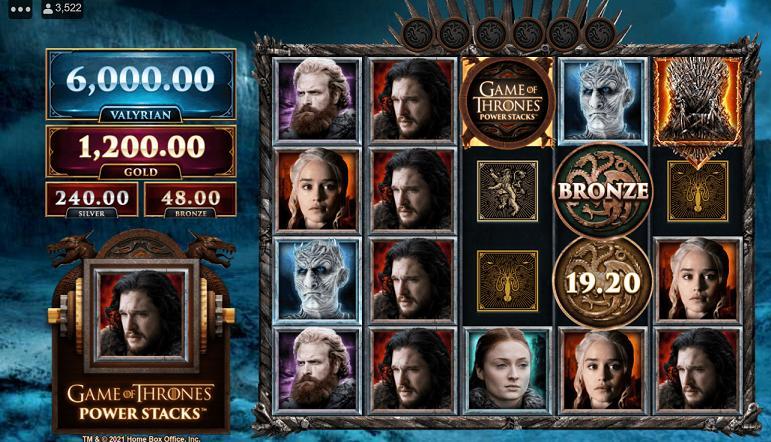
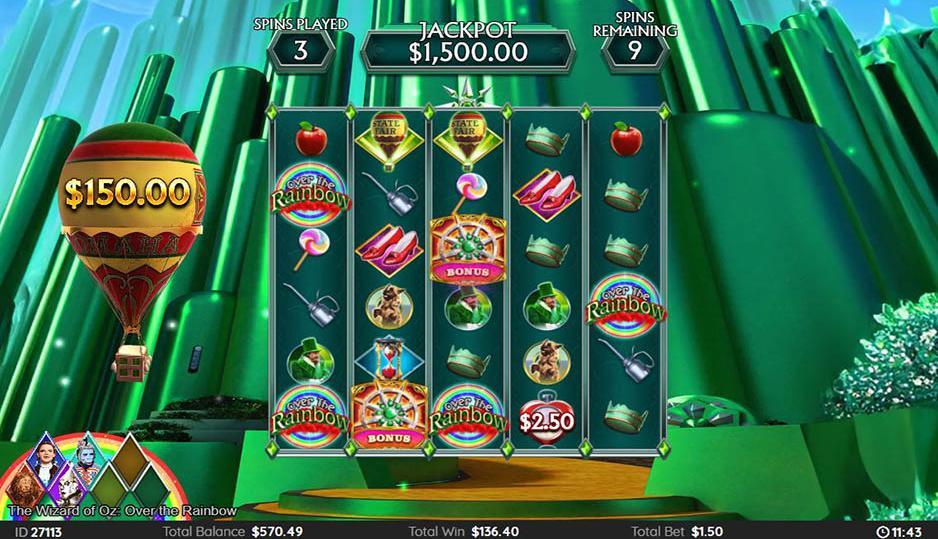
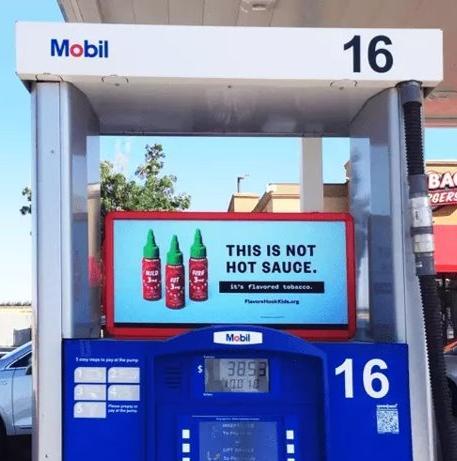
iGaming : In mechanics, design, and IP, there’s little difference between “mobile gaming” slots and ‘ iCasino ” slots. And if a player’s $20 goes in and never returns, how different is it?
EARLY ACCESS (2.18.2026)
Traditionally Defined Video Games (i.e., “No Money Out” Casino Slots)
Pictured: Take -Two / Zynga’s Game of Thrones Slots Casino and Wizard of Oz Slots
iGaming (i.e., “Real Money Gaming Casino Slots”)
Pictured: Microgaming’s Game of Thrones: Power Stacks and Light & Wonder’s Wizard of Oz Slots
iGaming : And while the “traditional” (i.e. no cashout) mobile casino genre long outpaced total mobile gaming growth, the genre is now shrinking as whale players depart for iCasinos
Casino Genre Share of Mobile Gaming Revenues (International excludes China; Alt Payments Revenue is Estimated)
Casino Genre Share of Mobile Gaming Growth (International excludes China; Alt Payments Revenue is Estimated)
Sources: Sensor Tower, Epyllion analysis
iGaming : With iGaming, U.S. growth from 2021 to 2025 increases from -0.4% to +12.0%.
Non -China international goes from +10% to +30%. And this is all despite widespread bans
U.S. Consumer Spending on Video Games
Non -U.S./China Consumer Spending on Video Games
Since 2019, American have increased their annual expenditure on video game content and software from $38.8B to $51.8B, a $12.9B increase
In parallel, Americans:
• Increased their spend on OnlyFans + Online Sports Betting + iGaming from $1.2B to $32.8B in total, a $31.6B increase
• Adopted new and costly pass -times that defy specific attribution, such as cryptocurrency and memecoin trading, AI assistants, AI art, and AI erotica, and prediction markets
• Scaled their social video consumption by 205 hundred hours a day (34 minutes per person)
These are nationwide figures, but much of this spend is concentrated on the same few Americans
• It’s not quite true “Americans” lost say, $17B on sports betting; ~30MM Americans did
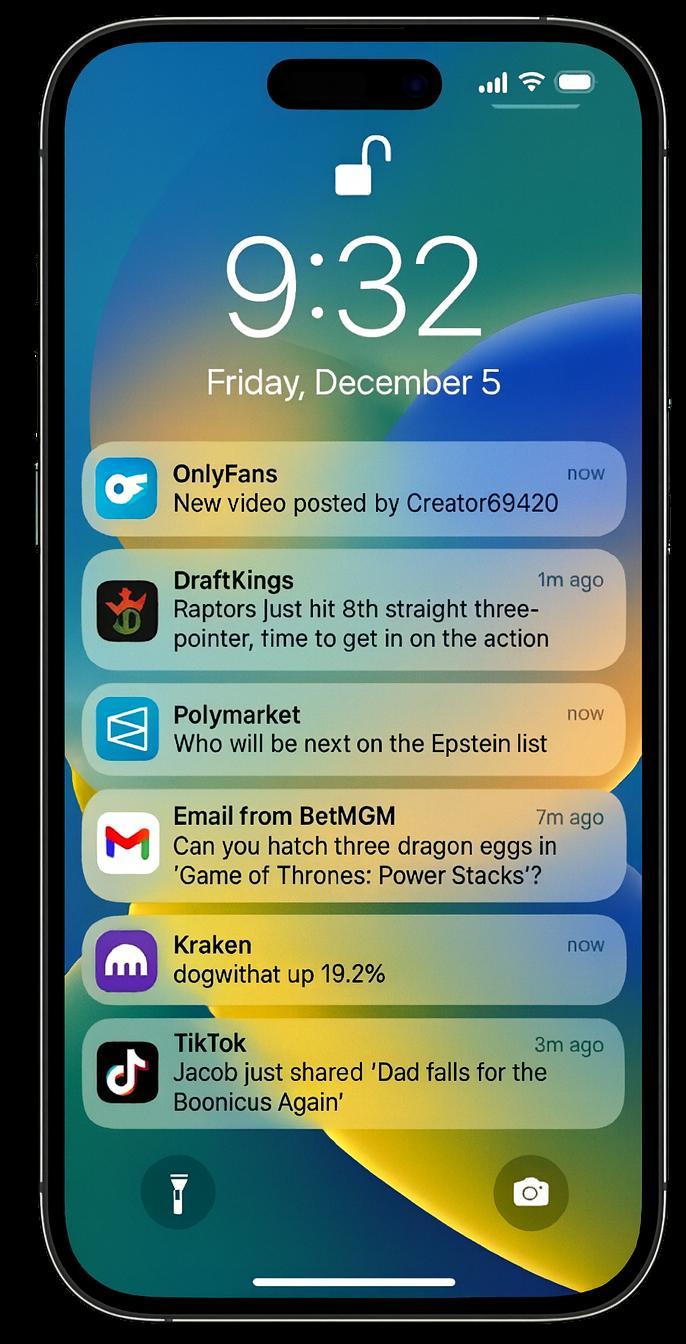
Video games not only compete with many new interactive substitutes, but video gamers face a barrage of new, interruptive, and irresistible notifications for these substitutes Sources: Circana , Eilers & Krejcik Gaming, Fenix International, Ipsos, Epyllion
… And these users massively over -index to video gaming, and especially high -revenue -generating platforms (console and PC) and genres (shooters, sports sims)
Video gaming’s post -pandemic problem isn’t that players choose to watch TikTok instead of buy a AAA game, or subscribe to OnlyFans instead of buying a PlayStation; it’s that on a Friday evening, players are placing a growing share of their time and spend elsewhere
American Men 18 –35 are 1.4 –2.0x as likely to play video games… and up to 3.6x as likely to use short -form video, OnlyFans, AI, and prediction markets, trade crypto, sports bet, and iGame
EARLY ACCESS (2.18.2026)
Question: How frequently do you engage in the following; Answer: Multiple Times a Week or Daily (U.S. Only)
(Ipsos Consumer Tracker; Surveyed January 13 -14, 2026)
Playing video games on a mobile device
Playing video games on a PC or console
Watching short form videos (e.g., TikTok, YouTube Shorts, Instagram Reels)
Using GenAI assistants/apps (e.g., ChatGPT, Claude)
Using AI for chatting or companionship (e.g., Character.ai, Replika , etc.)
Playing iGaming/ iCasino games (e.g., digital gambling games to win real money)
Betting on or reviewing prediction markets (e.g., Polymarket , Kalshi)
Using creator pornography (e.g. OnlyFans, Fansly )
Altogether, Men 18 –34 are 15% of the U.S. adult population but 21% of mobile gamers and 29% of PC/Console gamers… and 18 –49% of regular users of novel interactive apps/services
EARLY ACCESS (2.18.2026)
Total Share of Regular U.S. Users 18+ by Gender and Age
(Ipsos Consumer Tracker; Surveyed January 13 -14, 2026; Use at Least Weekly)
Total Population 18+
Playing video games on a mobile device
Playing video games on a PC or console
Watching short form videos (e.g., TikTok, YouTube Shorts, Instagram Reels)
Using GenAI assistants/apps (e.g., ChatGPT, Claude)
Using AI for chatting or companionship (e.g., Character.ai, Replika , etc.)
Playing iGaming/ iCasino games (e.g., digital gambling games to win real money)
Betting on or reviewing prediction markets (e.g., Polymarket , Kalshi) Using creator pornography (e.g. OnlyFans, Fansly )
Source: IPSOS, Epyllion
And while 46 of every 100 Americans say they play games less than they used to (76 of whom still play), 59 of every 100 Americans 18 –45 have cut back (92 of whom still play)
EARLY ACCESS (2.18.2026)
Question: “I am playing video games less often than I used to” (U.S. Only)
(Ipsos Consumer Tracker; Surveyed January 13 -14, 2026)
New competition for time and spend, and which concentrates on key gamer demographics, helps to explain several ongoing and interrelated challenges to revenue growth
Gamers Playing Few Games Overall
• The median Steam user plays only four games a year across their entire catalogue of new and old games (down from five in 2022) 1
Buying/Trying Few Games
• Only 3.1 -7.4% of global PC, PlayStation, & Xbox time goes to new, non -annual releases (and five games get half that time) 2
• 46% of U.S. gamers buy fewer than one game a year; 86% buy between none and four 3
• The average Steam user installs 3.8 games per year (down from 4.2 -5.2 pre -pandemic) 4
• Annual mobile game installs are now at a twelveyear low in the U.S. 5
Concentrating Time on the Same Games
• Since January 2021, the same games (each 9 to 27 years old) have held 33 -56% of total PlayStation and Xbox hours every month 2
• Since January 2021, the same five titles (each 9 to 26 years old) have held 28 -40% of total PC 2
Concentrating Time on Free -to -Play
• Since January 2021, free -to-play games average 45% of all PlayStation and Xbox time 2
• Since January 2021, free -to-play games average 55% of all PC gaming time 2
Chapter I: Spending Growth but More Retrenchment and Margin Struggles in 2025
Chapter II: Why Growth is Scarcer Than Headlines Suggest
Chapter III: Video Games Are Losing the Attention War in the “Major Market 8”
Chapter IV: The Novel Interactive Competitors Taking Attention, Time, and Spend from Video Games
Chapter V: The Five Biggest Areas of Revenue Growth in the Video Game Industry in 2026
Chapter VI: Closing Thoughts on the “Industry” and Finding Growth in 2026
The Five Biggest Revenue Growth Areas in Video Gaming in 2026
Roblox
The Five Biggest Revenue Growth Areas in Video Gaming in 2026
Roblox
If the “Mature Market 8” have been flat -to -down since 2021, but the global market is up, then the industry’s growth must have come from so -called “non -core” countries
Sources:
Since 2021, the “Mature Market 8” have shrunk by $5.1B (or -4.5%), but China is up $3.3B (+7.3%) and “non -core countries” are up $11.8B (or 41%)!
(2.18.2026)
China : Previously reviewed, but note that the world’s second largest market still has a lot of headroom in player participation rates (especially PC and console)
China: Video Gaming Participation Rate (Population 5+)
China: Video Gaming Participation by Platform (Population 5+)
Source:
China : Not only the fastest -growing major market in both dollars and percentage, but over 25% of growth since 2022 is in PC/Console, making the market a true outlier
China: PC/Console Video Game Software Sales (Packaged Sales + Microtransactions + Subscriptions/Services)
China: Mobile Video Game Software Sales (Packaged Sales + Microtransactions + Subscriptions/Services)
Mexico : While participation rates tumble in the U.S. and Canada, Mexico continues to grow
0.5–1.0 points each year. Mobile is up 11 points since the pandemic, Console and PC both +2
Mexico: Video Gaming Participation Rate (Population 12+)
Mexico: Video Gaming Participation by Platform (Population 12+)
Source: Competitive Intelligence Unit (Mexico)
Mobile PC
Console
Mexico : With PC/Console up a third since 2020 and mobile nearly doubled, the country now ranks 10th globally, beating the former #10 (Italy) by over 10%
ACCESS (2.18.2026)
Mexico: PC/Console Video Game Software Sales (Packaged Sales + Microtransactions + Subscriptions/Services)
Mexico: Mobile Video Game Software Sales (Packaged Sales + Microtransactions + Subscriptions/Services)
Brazil : With 73 –80% of those age 16+ playing regularly, Brazil boasts a leading and durably high participation rate
Brazil: Video Gaming Participation Rate (Population 16+)
Brazil: Video Gaming Participation by Platform (Population 16+)
Source: GoGamers (Pesquisa Game Brasil )
Brazil : Over the last three years, the PC/Console market has averaged over 6% annual growth and mobile 7% (by some estimates, Brazil is now a top 10 market globally)
ACCESS (2.18.2026)
Brazil: PC/Console Video Game Software Sales (Packaged Sales + Microtransactions + Subscriptions/Services)
Brazil: Mobile Video Game Software Sales (Packaged Sales + Microtransactions + Subscriptions/Services)
Spain : Unlike many of its European peers, Spanish participation rates have continued to grow – and across all device platforms, and faster since the pandemic
Spain: Video Gaming Participation Rate (Population 6 –64)
Spain: Video Gaming Participation by Platform (Population 6 –64)
Source: Asociación Española de Videojuegos (AEVI)
Spain : From 2020 to 2024, Spanish PC/Console spend grew nearly 50% (or +$450MM per year), while Mobile grew 27% (or $135MM)
Spain: PC/Console Video Game Software Sales (Population 18+)
Spain: Mobile Video Game Software Sales (Population 18+)
Source: Asociación Española de Videojuegos (AEVI)
Across Southeast Asia and the Middle East & North Africa , more players continue to come online — and overall player participation rates tend to lead the world
Sources:
There are not just “more” players in Southeast Asia and the Middle East & North Africa , there’s also a lot more revenue and growth.
EARLY ACCESS (2.18.2026)
Annual Video Game Content & Software Sales
(SEA -5: Indonesia + Malaysia + Philippines + Thailand + Vietnam; MENA -3: Egypt, Saudi Arabia, United Arab Emirates)
Sources: Niko Partners, IMF, Epyllion analysis
During 2024 and 2025, Roblox’s hours have exploded globally, but this growth has not been led by the “home market.” APAC and ROW are now 78% and 51% greater than UCAN
ACCESS (2.18.2026)
UCAN Hours (By Quarter)
European Hours (By Quarter)
APAC Hours (By Quarter)
ROW Hours (By Quarter)
Source: Roblox
Roblox
Roblox
Roblox
Roblox
All global gaming growth helps the overall video gaming industry, but the benefits don’t automatically accrue. Specific choices are needed. Operating for
Prioritizing Foreign Cultures Over “Local” Ones
As smartphones advance, there is a tremendous desire to “design up” to newer specs, thereby enabling richer graphics, animations, concurrent on -screen activities, etc.
Approximate Geekbench 6 Score for Core iPhone Models (Excludes Entry Editions, Special Editions, Pro/Max Editions, etc.)
Yet many of the most popular games globally, even fast -twitch shooters, are designed to play well on iPhones 10 -14 generations old (some older than the PlayStation 4!)
EARLY ACCESS (2.18.2026)
Annual iPhone Releases and Scope of Current Device Support for Top Mobile Games (Global; as of December 15, 2025)
5S, 6, and 6S dropped summer of 2025 due to Apple’s “forced upgrade cycle” for Xcode 16
High -End Models Only
Assassin’s Creed, Resident Evil, etc.
Fortnite and Call of Duty Warzone: Mobile (iOS 17+)
Pokémon Go and eFootball (iOS 15+)
Clash Royale (iOS 14+)
Genshin Impact, Roblox, PUBG Mobile, Call of Duty: Mobile, Mon. Go (iOS 13+)
Candy Crush and Honor of Kings (iOS 12+)
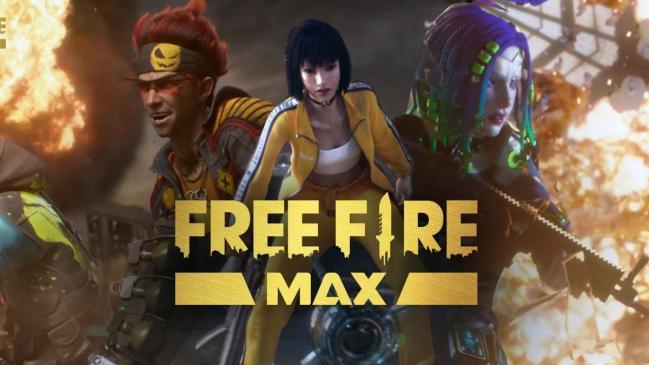
Free Fire and Delta Force (iOS 11+)
Peacekeeper Elite , also known as “PUBG Mobile China” (iOS 10+)
To ensure every player has the best possible experience, Free Fire offers two app “versions,” both of which play and cross -play into the same “game,” but with different optimizations
EARLY ACCESS (2.18.2026)
Fire Fire – Android App Specs (As at Q4 2025)
meters Map Draw Distance
Acoustic Audio Mapping
Static Menu
• Manual downloads of outfit packs (or opponents appear as stock Adam/Eve)
• No special animations (e.g. reload, sprint)
• Special effects degrade at 20 meters
Player Avatars
Fire Fire MAX – Android App Specs (As at Q4 2025)
meters (+100%)
• Pre-cached and/or smart downloaded to ensure full support and at any visible distance
Sources: Google Play, Garena, Epyllion analysis
Why? Globally, 65% of Google Play video game revenue worldwide comes from low and mid -tier devices. In markets such as LATAM, it’s 90%!
Share of 2024 Google Play Games Revenue by Device Type (Excludes transactions not billed by the Play store)
Source: Google / Mariusz Gąsiewski
Japan, Korea, Hong Kong, Taiwan
North America
Western Europe APAC (Excl. Japan, Korea, Hong Kong, Taiwan)
Eastern & Central Europe, Middle East & Africa LATAM
Another challenge stems from operating economics. Companies must be set up to profit on, and practically invest behind, customers with a fraction of “major market” ARPU
Source: Roblox
Globally, average revenue per player by country per year can vary by as much as 200x, with most of the “mature markets” at $150 –275, and “ROW” reaching the low single digits
EARLY ACCESS (2.18.2026)
Average Annual Spending on Video Game Content per Gamer per Year
(Most recent of 2025 or 2024; Some markets are Populations 5+, 10+, 18+, etc., which causes both sample bias and inflates or deflates ARPU)
Sources: KOCCA, Kadokawa, Circana , Niko Partners, UKIE, Game Germany,
,
Garena’s Free Fire has over 650 million quarterly players, about 9.5% of whom pay ~$12 per quarter (thus the average user is only $0.40 a month), totaling roughly $3B per year
ACCESS (2.18.2026)
Garena Quarterly Active Users and Quarterly Payers (Garena only reports QAUs, not MAUs of DAUs; Substantially all Free Fire)
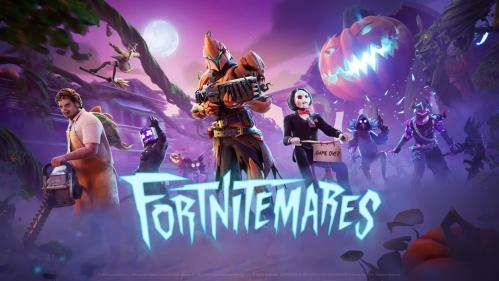
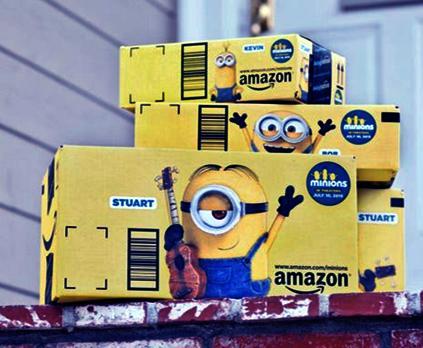
Moreover, non -Western also prioritize these different (and generally less valuable) players by investing in content and experiences that are for them (and not for most Western players) Fortnite
And prioritization is the operative word; events and integrations are not infinite, nor are the creative and commercial resources that support them
Fortnite IP Events
Call of Duty IP Events
PUBG Events (2025; Meaningfully Integrated)
Free Fire IP Events
(2025; Meaningfully Integrated)
(2025; Meaningfully Integrated)
(2025; Meaningfully Integrated)
Despite the post -pandemic industry slump, PUBG, already one of the world’s bigger games, has been able to grow considerably through its PC, Mobile, and APAC -centric development
EARLY ACCESS (2.18.2026)
Krafton Quarterly Revenue by Platform (USD)
$650MM
$600MM
$550MM
$500MM
$450MM
$400MM
$350MM
$300MM
$250MM
$200MM
$150MM
$100MM
$50MM
$0MM
Krafton Quarterly Revenue by Reporting Region (USD)
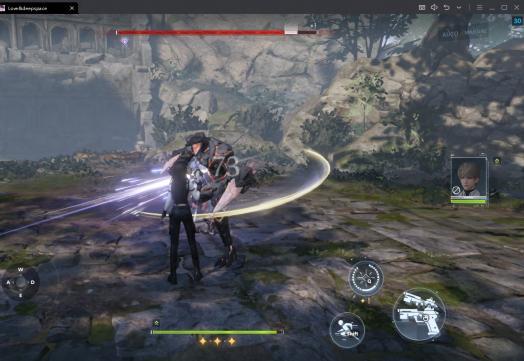
And beyond the Genshins and Wukongs are market -specific creations that defy Western conventions and expectations… but have generated $400MM in two years in those markets
Love and Deepspace : Estimated Global Gross Revenue (IAP Only; Excludes D2C/ Webshop Payments)
Love and Deepspace Summary
Love and Deepspace is story -based live service romance game in the sci -fi action RPG genre. Users have five primary love interests and can unlock intimate memories and dates, while using their superhuman powers to combat alien monster invaders. A 2025 update added a period tracker for players.
The “ROW” opportunity is the positive way to view current hiring trends. It’s frustrating that hiring regions don’t match layoffs, but encouraging that they finally match revenues
The Five Biggest Revenue Growth Areas in Video Gaming in 2026
Roblox
For years, it has been essentially absurd to tabulate industry revenue without ads. Outside of China, mobile game ads nearly match total consumer spending on PC/Console software
Annual Video Game Software Revenues (Excl. -China) (PC + Console + Mobile; Spend on Content + Services; Programmatic Ads Only)
Since 2021, mobile ads have been 37 –145% of annual industry growth. Without ads, the market (excluding China) is up only $6.8B (or +4.8%), but with them, its +$35B (or +20%)
EARLY ACCESS (2.18.2026)
Ads’ Share of Video Game Content Revenue Growth (Worldwide Non -China Market; Including Ads in Denominator)
Video Game Content Revenue, Including Ads (Worldwide Non -China Market)
Note, though, that 20 –30% of gross revenue from mobile game in -app advertising is collected by ad exchanges such as AppLovin , IronSource , Google, etc., or ~$15B in 2025
Worldwide Gross Revenue from Programmatic In -App Advertising in Mobile Games, Excluding China (Blended Rate Across Exchanges/Stacks Varies by Year)
Source: McKinsey
And tens of billions in ad revenue in mobile games is… ad spend from other mobile games.
“Your ad revenue is my UA; your UA is my revenue” (net of exchange fees and non -mobile UA)
Mobile Gaming User Acquisition Spend by Channel (Global, Excluding China)
Annual Mobile Gaming UA as Share of Net Revenue (Global, Excluding China)
In fact, mobile gaming UA expenses have exceeded the app store fees on consumer spending since 2020 – and by 2027, ad exchange fees on ad revenue will likely pass them, too
ACCESS (2.18.2026)
Largest Costs for Mobile Game Publishers (Worldwide excluding China; USD) $0.0B
Network/Exchange Cuts
Sources: Sensor Tower, CADPA, Niko Partners and CODA, McKinsey, Epyllion analysis
Yet not all mobile gamemakers spend 32% of net revenues on UA, nor do all generate a third of revenues from ads
UA Share of Net Revenue, Select Mobile Publishers
(Most Recent Fully Fiscal Year of 2024 and 2025; Zynga 2021 -2022)
Ads Share of Net Revenue, Select Mobile Publishers
(Most Recent Fully Fiscal Year of 2024 and 2025)
Sources: Sensor Tower, CADPA, Niko Partners and CODA, McKinsey, the companies, Epyllion analysis
Hungry Studio SciPlay Stillfront
Zynga
Tripledot
Consider the fact that Royal Match , the 2nd highest grossing new game since 2020, had $1.1B in net revenue in 2023 and… spent $1.1B on UA!
Dream Games’ 2023 P&L (USD; Last Year Publicly Available)
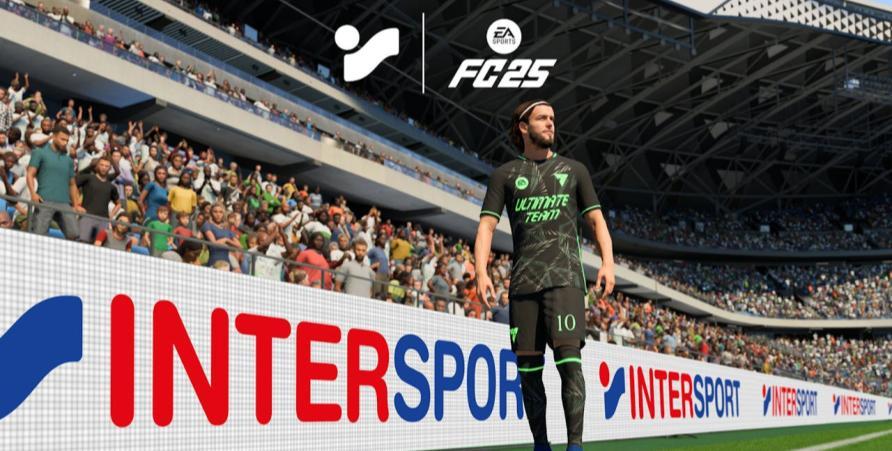
Today, ads remain rare among PC/Console games and services (with the exception of ondevice/in -store ad units). But eventually, ads reach all addressable surface areas.
EARLY ACCESS (2.18.2026)
Epyllion’s
And advertising is (and has been) starting to come to PC and console gaming.
EARLY ACCESS (2.18.2026)
And in markets with decline players, flattened spend, free -to -play dominance, publishers will need to improve the monetization of low spenders and monetize non -spenders
Mature Market 8: Mobile Game Content Spend (Packaged Sales + Microtransactions + Subscriptions/Services)
Sources:
The Five Biggest Revenue Growth Areas in Video Gaming in 2026
Roblox
Of the $136B in content sales outside of China and excluding 1st -party platform games and services, store fees consumed $33.7B of gross revenues that might otherwise go to publishers
EARLY ACCESS (2.18.2026)
Global Non -China Video Game Content/Software Platform Fees (Exc -1st -Party Platform Titles and Services)
(Excludes alternative billing solutions such as direct payments, webshops , carrier billing, etc.)
As a revenue opportunity, annual (non -China) platform fees rival many top markets combined, global investment in video game content, and is likely 150% of (non -China) profits
Sources: Ampere, CADPA, IDG Intelligence, McKinsey, Microsoft, Morgan Stanley, Nintendo, Newzoo , Niko Partners, Sensor Tower, Sony, Video Game Insights, Epyllion analysis
Many mobile publishers are already redirecting substantial and growing shares of their gross revenues to alternative (typically D2C) payment channels with far lower commissions
EARLY ACCESS (2.18.2026)
Share of Total Player Spend Generated via Direct -to -Consumer Channels (Global)
In fact, D2C stores are partly why topline mobile growth has slowed; gamemakers discount gross prices to encourage D2C/ webshop adoption that offer better net sales economics
(Millions; USD; Excludes Ads)
(Millions; USD; Excludes Ads)
Source:
Across five mobile publishers with leading D2C adoption (and ~$4.4B in total player spend), gross sales are down 1% since Q1’23 but (more important) net sales are up 4%
ACCESS (2.18.2026)
Player Gross Revenue of 5 Mobile Publishers
(Playtika , ScfiPlay , Stillfront , Huuuge , Ten Square)
But to maximize D2C adoption, publishers must do more than offer valuable discounts, fun perks, and simple user journeys. They must also support scores of payment solutions
AppCharge Transaction Value by Payment (USD; December 24, 2024 to June 22, 2025)
Total Market Transaction Value by Payment (2025; USD)
In Q4 2021, only about 12.7% of Roblox’s revenues were D2C, resulting in platform fees devouring 27% of gross revenues. Today, the former is up to 30% and latter down to 22%
Roblox Cost of Revenue as a Share of Gross Revenue (As Reported)
Roblox Estimated Share of Revenue That’s D2C (Assuming Non -Platform Store Costs at ~4.5%)
Sources: Roblox, Epyllion analysis
Roblox’s improvements in alternative payment share since Q4 2021 have saved it roughly $420MM in payment fees (over $50MM in Q4 2025 alone)
Cumulative Increase in Net Revenue from Alternative Payment Share Gains Since Q1 2022 (Global)
Sources: Roblox, Epyllion analysis
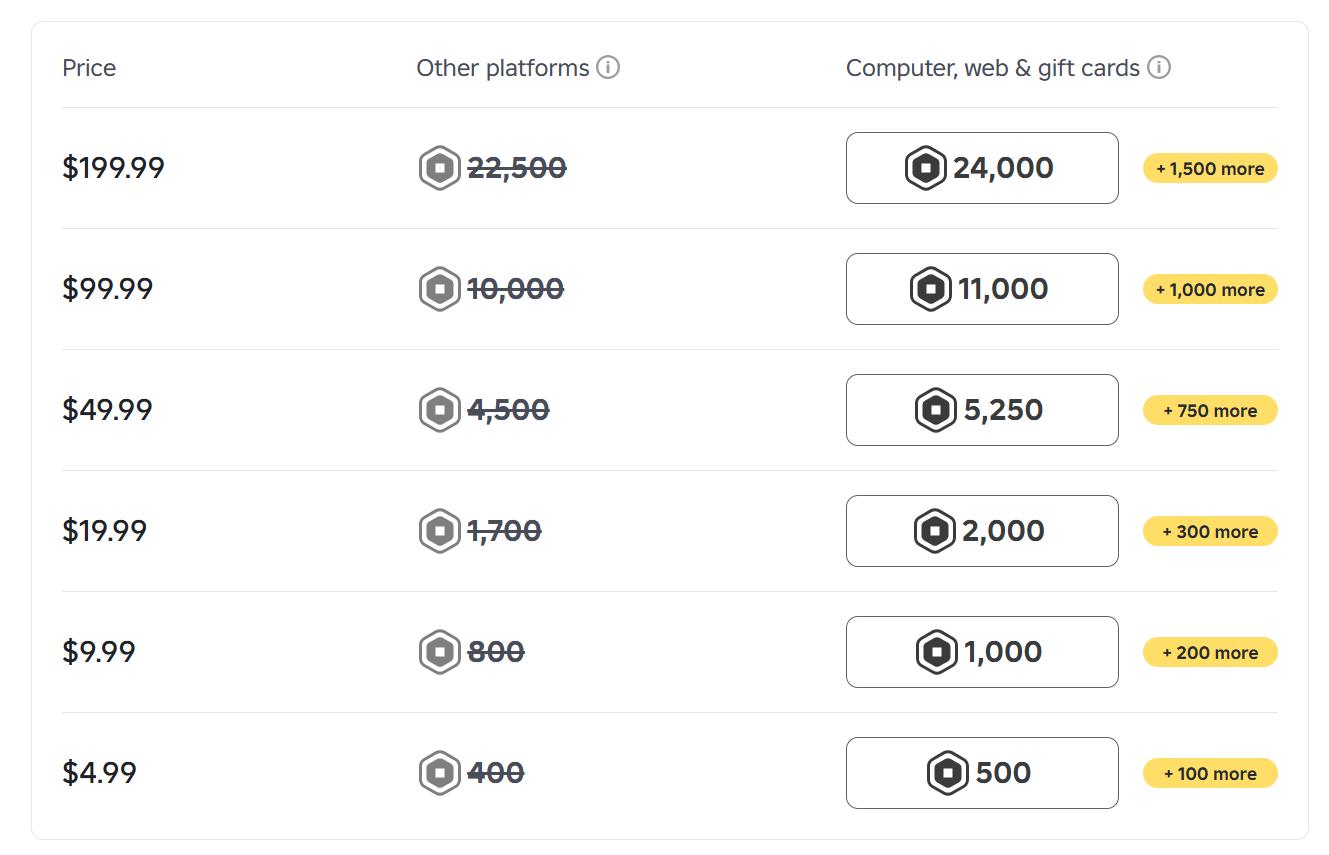
Behind Roblox’s D2C success is not just large D2C discounts, but lucrative D2C -only Robux subscriptions (which many parents use for allowance) that effectively boxes out in -app buys
EARLY ACCESS (2.18.2026)
Roblox D2C/Gift Card Extra Robux versus IAP
(As of January 2026)
D2C and Gift Card customers get up to 25% more Robux per dollar than in -app buyers
Premium subscribers can get 35% more Robux per dollar out of IAP
Roblox Premium Membership SKUs
(As of January 2026)
Cheapest & highest value monthly Robux subscriptions are only available D2C/online
Monthly Robux Subscribers Get +10% Robux on additional Robux purchases + item trading
At Epic Games Store on PC, IAP fees are only 12% (and often less), but a growing share of publishers use their own billing solutions. In 2025, 35% of 3 rd-Party hours were direct
ACCESS (2.18.2026)
Epic Games Store: Billions of Hours of Playtime on 3 rd-Party Content
(Excludes 1 st-Party titles and platforms such as Fortnite, Rocket League, UEFN, etc.)
The Five Biggest Revenue Growth Areas in Video Gaming in 2026
Roblox
In 2025, outsourcing held a record 35.5% share of total content investment spend, up from 30.6% in 2017 and roughly 31.5% during the COVID -19
Content Development Spend by Type (Worldwide; PC + Console + Mobile + VR)
Outsourcing’s recent growth stems from a near -doubling of its share of net new content investment, representing ~65% from 2022 –2025 (versus 33% from 2018 –2022)
Growth in Video Game Content Development Spend
Outsourced Share of Total YoY Increase
Behind outsourcing growth is mostly not QA, localization, or testing, but an increasing reliance on outside partners for core creative work (art, game design, game engineering, etc.)
Growth in Outsourcing by Work Type (Worldwide; PC + Console + Mobile + VR)
Growth in Outsourcing by Work Type $0.0B
Upstream (Art & Animation, Game Engineering, Coding, and Design)
Downstream (Localization, Player Support) (Worldwide; PC + Console + Mobile + VR)
Why Developers/Publishers Report Working With External Development Service Providers
(2025; Respondents to the XDS Summit’s Annual Survey)
Gamemakers also report substantial increases in the share of their engineering work that’s outsourced, with most categories up 5 percentage points since 2023
Proportion of Work Outsourced Among Outsource Users – Engineering and Co -Development Activities (Respondents to the XDS Summit’s Annual Survey)
Source:
In creative disciplines, many outsource users report 60 -95% of total work on animations, audio, environmental design, weapons, etc., is outsourced, up 4 -5 points in two years
Proportion of Work Outsourced Among Outsource Users – Creative Disciplines (Respondents to the XDS Summit’s Annual Survey)
Furthermore, many of the most creatively and commercially successful titles of the last few years have been substantial users of external development
Internal Team Cherry Credits : 3
External Credits : 94
Excluding unnamed contributors
Internal Pocketpair Credits : 97
External Credits : 93 (80 from Keywords Studios)
Excluding unnamed contributors
EARLY ACCESS (2.18.2026)
The Five Biggest Revenue Growth Areas in Video Gaming in 2026
Roblox
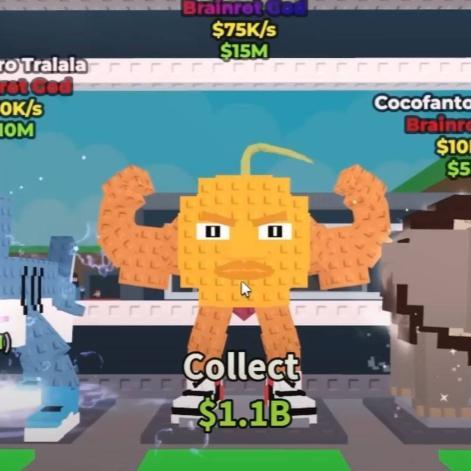
As reviewed earlier, Roblox is now a singular driver of the total video gaming market. In 2025, it was over 4.5% of non -China spend and 67% of net growth (67%!)
At the end of 2024, Roblox had more DAU than PlayStation, Switch, or Xbox. A year later, DAU were up another 69% (with 3x as many DAU added as in the first year of COVID)
Roblox Average DAUs by Age by Quarter (Global)
Roblox Average DAUs by region by Quarter (Global)
Source: Roblox
And Roblox’s engagement surged even more than DAU. In just Q3 2025, Roblox amassed more hours of use than it achieved in the entire first year of the pandemic
Roblox Avg. Monthly Hours of Engagement (Launch to Date; Excludes Off -Platform Engagement such as YouTube and Twitch; Mobile Share of Engagement by Year Average)
Sources: Roblox, Epyllion analysis
Indeed, Roblox’s average quarterly engagement is now as large as that of Steam, PlayStation, and Fortnite combined.
EARLY ACCESS (2.18.2026)
Monthly Hours of Engagement, 2025 (2024 Where Noted)
(Worldwide; Excludes Off -Platform Engagement Such as Watching PlayStation or Fortnite Streams on YouTube, Twitch, TikTok, etc.)
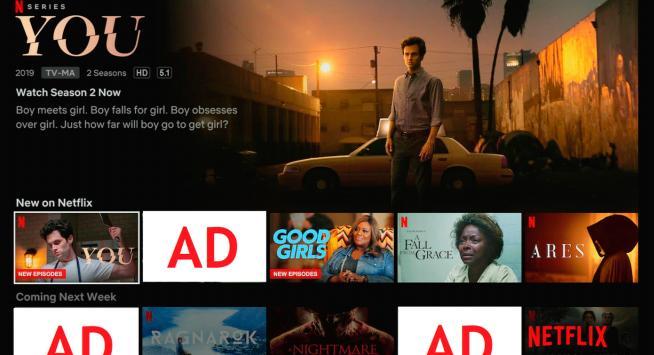
In fact, Roblox is starting to challenge Netflix for total hours of use. In 2025, Roblox hit 65% of Netflix’s hours (82% in Q3), and while Netflix grows ~1% a year, Roblox manages 25 –70%
ACCESS (2.18.2026)
Roblox Avg. Monthly Hours of Engagement
(Launch to Date; Excludes Off -Platform Engagement such as YouTube and Twitch; Mobile Share of Engagement by Year Average)
Sources: Roblox, Epyllion analysis
What’s more, Roblox’s top titles now match the top non -Roblox games and even publishers in monthly engagement despite having a tiny fraction of the budget and staff
EARLY ACCESS (2.18.2026)
Average Monthly Hours of Engagement, Select Standalone Games/Publishers vs. Top 10 Roblox Titles (Worldwide; Excludes Off -Platform Engagement Such as Watching PlayStation or Fortnite Streams on YouTube, Twitch, TikTok, etc.)
Sources:
Roblox Titles (Months in Market if Launched Mid -Year)
And these developers are now taking home $1.5B pear year, with Q4 2025 hitting $477MM, up more than 70% year -over-year
Roblox
ACCESS (2.18.2026)
Quarterly Developer Payments (Worldwide)
Source: Roblox
Overall, Roblox exhibits classic creative disruption. It has built outstanding scale, network effects, revenues, and now profits while monetizing a fraction of the market average
Roblox’s growth is also supported by an unprecedented $1.6B in annual R&D expenditures
– an investment that continues to grow while shrinking rapidly as a percentage of revenue
Roblox Quarterly R&D Expense and R&D Expense as TTM Share of net Revenue (GAAP)
Source: Roblox
Chapter I: Spending Growth but More Retrenchment and Margin Struggles in 2025
Chapter II: Why Growth is Scarcer Than Headlines Suggest
Chapter III: Video Games Are Losing the Attention War in the “Major Market 8”
Chapter IV: The Novel Interactive Competitors Taking Attention, Time, and Spend from Video Games
Chapter V: The Five Biggest Areas of Revenue Growth in the Video Game Industry in 2026
Chapter VI: Closing Thoughts on the “Industry” and Finding Growth in 2026
To Find Growth, We Have to Acknowledge:
There is No “Video Gaming Industry”
To Find Growth, We Have to Acknowledge:
There is No “Video Gaming Industry” There are Many.
There are many ways to cut the video game industry, each facing its own dynamics and subdynamics, and not all offer similar opportunities or adjacencies
EARLY ACCESS (2.18.2026)
Global ‘TAM’ for Video Game Content by Various Categories/Definitions
(Nominal Prices; Console + PC + Mobile; Excludes Hardware & Accessories; Includes Game Sales, DLC, Microtransactions, Subscri pti ons, and Services, and Ads)
Ampere,
Some segments are growing at a fraction of the size of the overall market, while others are growing at multiples of it
EARLY ACCESS (2.18.2026)
Global ‘TAM’ for Video Game Content by Various Categories/Definitions, Plus Growth Rates Relative To Total Market
(Nominal Prices; Console + PC + Mobile; Excludes Hardware & Accessories; Includes Game Sales, DLC, Microtransactions, Subscri pti ons, and Services, and Ads)
And each sub -cut represents a very different share of growth.
EARLY ACCESS (2.18.2026)
Global ‘TAM’ for Video Game Content by Various Categories/Definitions, Plus Share of Growth in Categories/Definitions
(Nominal Prices; Console + PC + Mobile; Excludes Hardware & Accessories; Includes Game Sales, DLC, Microtransactions, Subscri pti ons, and Services, and Ads)
The result is that different companies in the “video gaming industry” exist in very different universes and experience fundamentally different growth prospects
ACCESS (2.18.2026)
Global ‘TAM’ for Video Game Content by Various Categories/Definitions
(Nominal Prices; Console + PC + Mobile; Excludes Hardware & Accessories; Includes Game Sales, DLC, Microtransactions, Subscri pti ons, and Services, and Ads)
Strategic Consulting Speeches, Events, Offsites, and Workshops
Special thanks to the firms below for supporting custom analysis for this presentation. (Placement order is based on an RNG weighted to total citations)