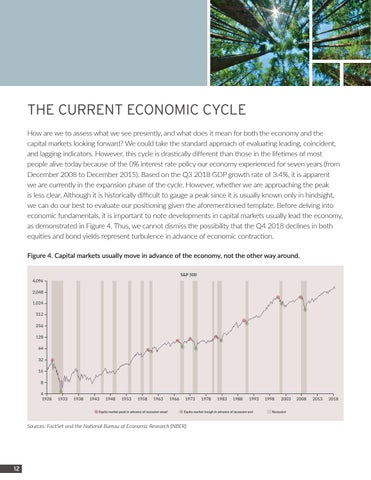
THE CURRENT ECONOMIC CYCLE How are we to assess what we see presently, and what does it mean for both the economy and the capital markets looking forward? We could take the standard approach of evaluating leading, coincident, and lagging indicators. However, this cycle is drastically different than those in the lifetimes of most people alive today because of the 0% interest rate policy our economy experienced for seven years (from December 2008 to December 2015). Based on the Q3 2018 GDP growth rate of 3.4%, it is apparent we are currently in the expansion phase of the cycle. However, whether we are approaching the peak is less clear. Although it is historically difficult to gauge a peak since it is usually known only in hindsight, we can do our best to evaluate our positioning given the aforementioned template. Before delving into economic fundamentals, it is important to note developments in capital markets usually lead the economy, as demonstrated in Figure 4. Thus, we cannot dismiss the possibility that the Q4 2018 declines in both equities and bond yields represent turbulence in advance of economic contraction. Figure 4. Capital markets usually move in advance of the economy, not the other way around. S&P 500 4,096 2,048 1,024 512 256 128 64 32
16 8 4 1928
1933
1938
1943
1948
1953
1958
1963
Equity market peak in advance of recession onset
1966
1973
1983
1988
1993
Equity market trough in advance of recession end
Sources: FactSet and the National Bureau of Economic Research (NBER)
12
1978
1998
2003
Recession
2008
2013
2018