

My name is Anuradha and I currently work as User Experience Designer.
I graduated with a Bachelor’s degree in Architecture and eventually worked on Architecture, Interior, Retail Design, Graphic, and User Experience Design projects.
In this portfolio, you will find the some projects that were done in and outside of my work.
KASTEN
A solution showcasing & marketing portal (Professional work)

GREENTY
Project and payment tracker app for freelancers (Individual work)
SURGER
Case study of surges & surge monitoring dashboard for Uber (Individual work)


Brief:
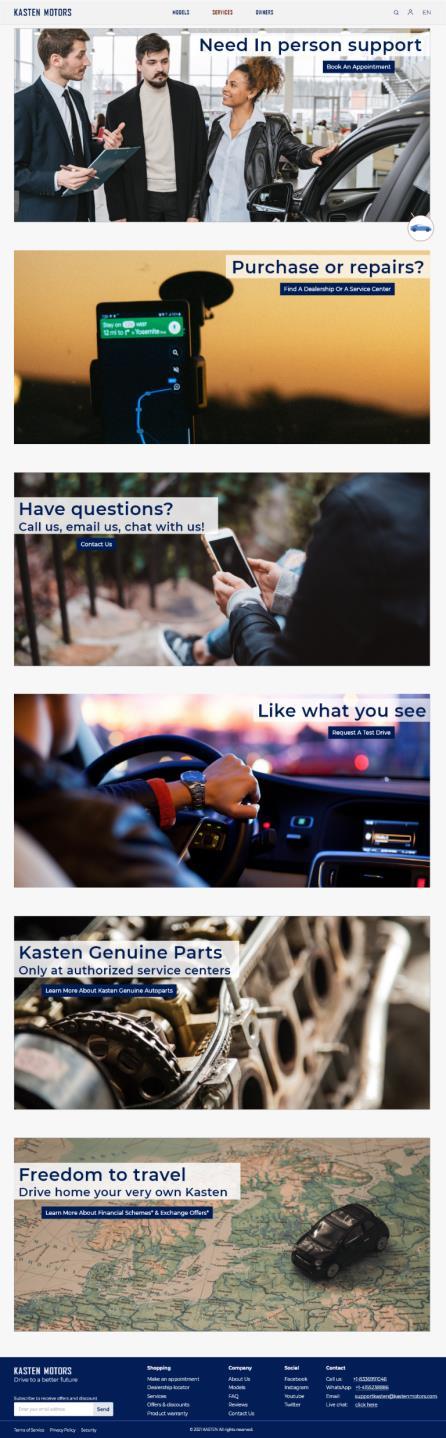
To showcase customer engagement solutions built by Movate (my current employer), the idea was to build a fictive brand (Kasten Motors) and build a website that appeals to automotive brands so that we can embed all possible B2C solutions including Virtual assistant (an advanced Chatbot feature), Appointment creation to show integration with Customer Relationship Management, campaign management, and propensity analytics into it.
Role:
• Visual identity of the brand and the solutions embedded
• Web design
• User research and layout development
• Information architecture
• Rapid interactive prototyping for usability studies
• Frontend development coordination
• Testing
Skills:
• Web design
• Information Architecture
• Visual design and brand identity
• Rapid prototyping using Adobe Xd, HTML & CSS.
• Photoshop for presentation and documentation
A solution showcasing & marketing portal (Movate office work)
Status: Completed (2021)

Design Process:
Define:
Build a portal (a website or an app) where the solutions designed and built by the team are strategically compiled so that it becomes easier to demonstrate to clients (automotive brands).


Research:
Investigating how automotive manufacturers like Hyundai, Kia, and Jeep have incorporated various support and service tools on their websites. The websites are always minimalist, the customers have easy access to all services. And in the case of a new customer, they have appointment pages to schedule a test drive and request a callback.


Ideate:
Build a website reminiscent of an automotive brand website. It should have some car models and their information to maintain authenticity, however, the priority is to show how an existing customer could use this website to access support and other services associated with their vehicle. All of this is linked to a CRM portal that maintains a database of customer activity.
Prototype & Presentation:
It took me 6 days (including revisions) to build the High-Fi prototype. The Prototype had to show which solutions of Movate were incorporated and how a demo for a client would work. This prototype also acted as a brief for front and backend developers.
A solution showcasing & marketing portal (Movate office work)
Why this project?
This project’s primary intention was marketing, to show how solutions made by Movate can be implemented across a brand. This, however, didn’t stop it from being a full web design exercise. The intent was to give the user (client and demonstrator) the authentic experience of trying to navigate through a Motor company website.

Through this website, we were able to show some of the following solutions, thus making this project a multi-faceted endeavour.
Virtual assistant: A “chatbot” that incorporates the latest technologies of bot design, from context awareness to NLPbased search and direct connectivity to an agent along with self-help tools.


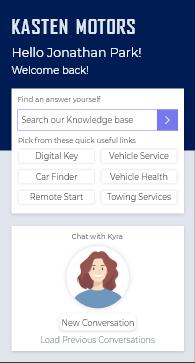


Omni-channel support: All support requested by a customer via any channel (Email, Call, Message or website) is captured in the CRM and all the cases are readily available for a customer to access and see the status of the queries.
Propensity analytics: Based on the customer’s vehicle history, the website proposes actions to be taken by the customer, thus reducing selection bias and analysis paralysis (If a customer purchased a vehicle on a particular date and logs in to their account, a pop up automatically informs them of the due date to get their vehicle serviced, and allows them to book an appointment).


solution
What’s with the name?
Kasten is a fictive name that comes from the reverse of the word “Netstack’ another fictive networking equipment manufacturing brand made to exhibit solutions appealing to similar brands.


Project and payment tracker app for freelancers (Individual Work)
Brief:
Freelancers constantly struggle with managing multiple timed deliverables of a project and ensuring that in the end don’t have to chase clients to get their payments. Hence the overall idea was to create an app, which allows freelancers to add projects and tasks associated with the project so that the payments are linked to deliverables. When the client intends to download the file, they pay the amount attached to the deliverable.
Empathize
As a freelancer, constantly chasing clients to get payment for the delivered contracted work is not only a hassle but also a mentally draining process.
Define:
To get payments on time, for the finished task, it would be easier if we could link the payment to the task. If my deliverables are digital files, I can easily link payment to the file so it becomes mandatory to pay to open the file.
Ideate:
We can build an app (including a progressive web app) that allows freelancers to add submittals and attach payments to each deliverable. Once the project is onboarded, every task/ deliverable is linked to a payment. The client pays for the file and then proceeds to download and evaluate it. Regardless of the outcome of the evaluation by the client, the hours put in by the freelancer don’t go to waste.

Role:
• Conceptualization and ideation
• Wireframing
• Brand development
• Prototyping
Design Process:
User Research
Project and payment tracker app for freelancers (Individual Work)
Problem Statement
Ideation
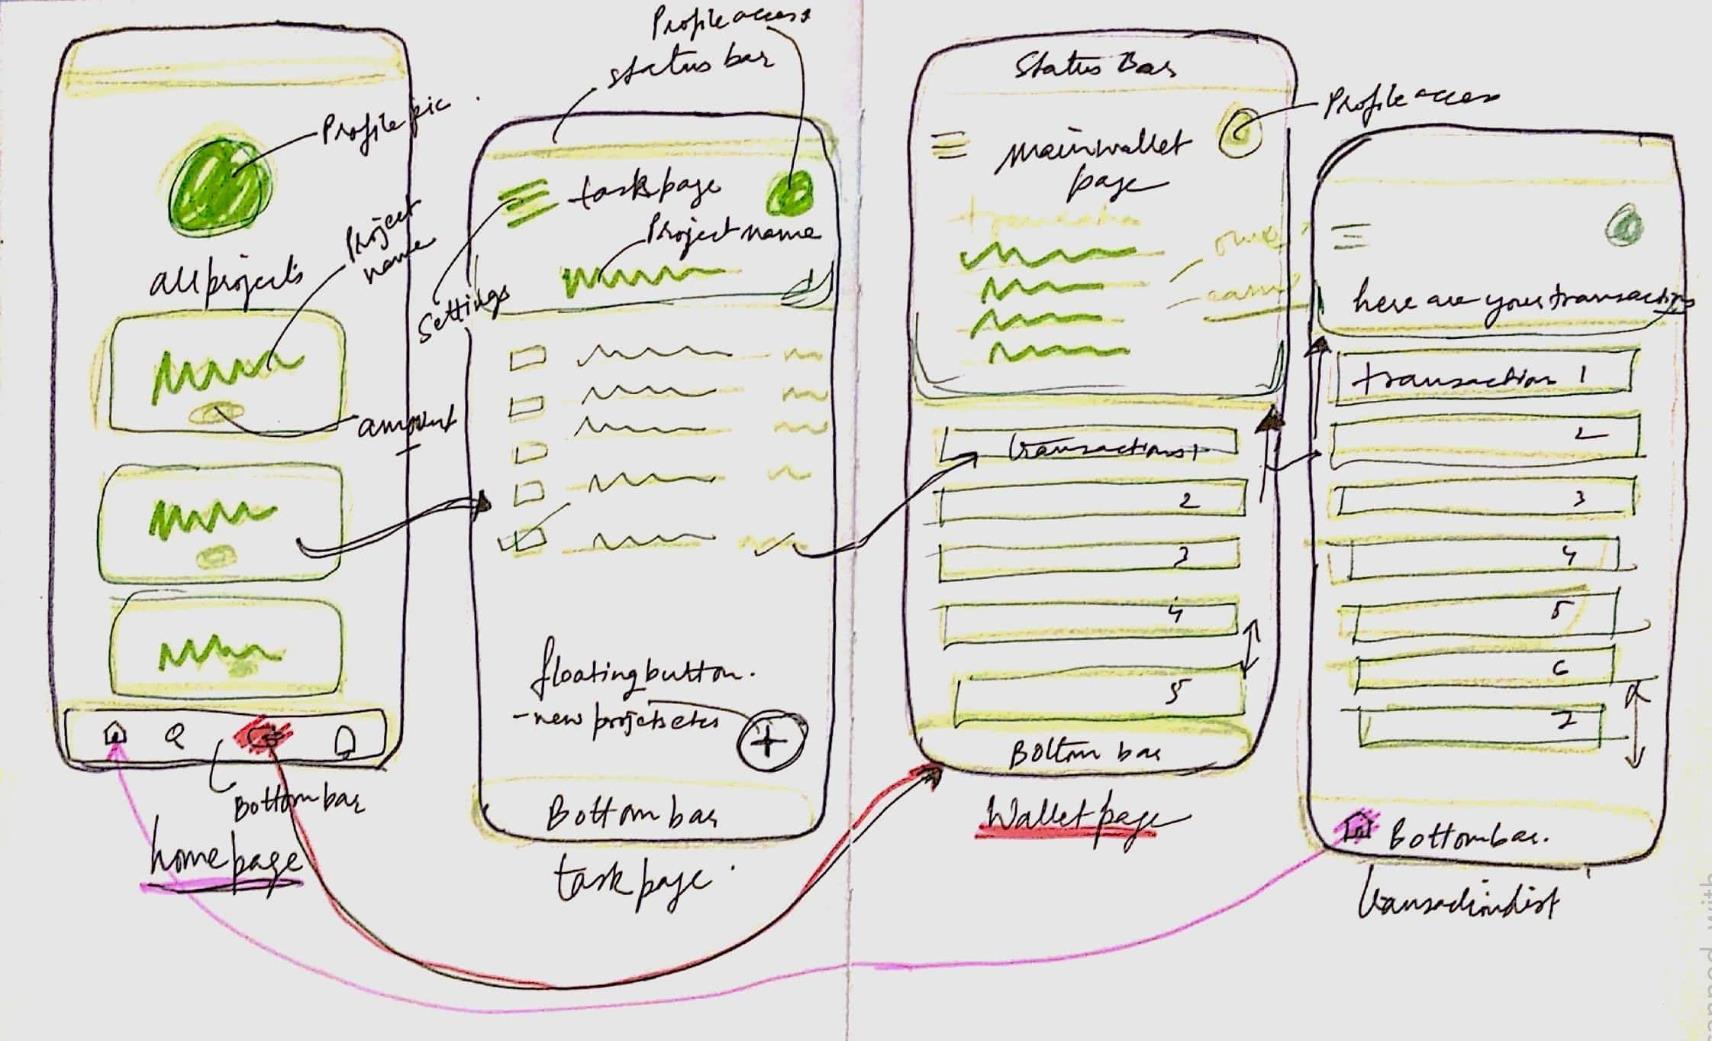
Wireframe sketches
Usability Testing
High-Fi Prototype
Iterations
Mid-Fi Prototype
Current Status
User Research: After documenting my issues and challenges, I called 6 of my fellow freelancers of various fields (Graphic designers and Interior designers) to ask them what are the issues they face with client interaction and how are those interactions affecting their work and incomes.
Problem Statement: Taking all the above inputs I learned that not only is getting paid for your work difficult, continuous revisions requested by clients often go unpaid and increases the workload on freelancers. The intent was to make the number of revisions permitted clear (each revision is a task) and clients should be penalized if they ask for revisions beyond the agreement.
Ideation: The initial idea was to make a simple app where, once a user sends an email to their client, they go to this app and click on a box that notifies the client and requests the payment. However, we realized that wouldn’t work as the client can ignore the notification, download the file and the tasks remain unpaid. So the app evolved from a task manager app to a file-sharing app linked to payment methods.
Wireframe sketches and Mid-Fi Prototype: The initial sketch were inspired by payment apps and how they list transactions. When a project is onboarded with the final amount mentioned in the contract, the idea was to divide the entire amount into all the tasks listed so for every task fulfilled the freelancer gets paid by the client to download the file and review it. This led to Mid-Fi prototyping, the first version of which is what you see in this portfolio.
Current Status: The review and iterations of above mentioned Mid-Fi prototype into a High-Fi Prototype, along with developing a PWA and usability testing is the cycle currently being followed. The usability testing provides valuable feedback that helps us improve iterations and the prototype. The front and backend development is being handled by another team.
Project and payment tracker app for freelancers (Individual Work)
Possibilities:
The app can help freelancers manage their money and even interact with other freelancers to involve them in a project.

Challenges & limitations:
• This is a great monitoring, approving, and secondary device app. The primary device for this application would be a desktop or a laptop. This app has to coexist with a progressive web app (not covered here) as most people work and send files using emails from their computers.
• The app is also limited to tasks that involve file sharing.
Skills:
• Balsamic
• Figma
• Adobe Photoshop
Status: Prototyping & Testing (Initiation 2021)
Project and payment tracker app for freelancers (Individual Work)
Why this project?
The idea came to me while struggling to get my payments from my client. My initial research showed that there are apps that are similar but the onboarding process of a client and freelancer is very difficult; the users feel discouraged to use such tools.
The intent to add this project to my portfolio was multi-layered.
Firstly I wanted to emphasize my observation and empathy skills which extended to my other fellow freelancers.
Secondly, as we progress into a complex information-sharing and communication world, it is mandatory to look at apps as Omnichannel tools, that allow users to seamlessly move from one device to other. Hence the concept is for mobile and web applications.
Lastly, branding. I intended to show how the interface for such an app can look, what themes and patterns it can follow, and how it will fit perfectly under the idea of “Time is Money”.

What’s with the name?
Greenty comes from the convergence of two words “Green” & “Time”. Time is money, in the essence that time spent by a freelancer has value, but also the green comes from the old currency. In this digital world, currency usage is rapidly declining but the idea was what drove the name and the brand identity.

Case study of surges & surge monitoring dashboard for Uber (Individual work)
Intent:
Uber has a surge pricing system wherein they dynamically increase the fares in some locations based on demand. One reason why this is done is to attract more drivers to reach that location so that Uber can meet the customer demand. They do this by highlighting the “surge fare” areas in the driver’s app while they are on duty. But how do Uber engineers predict and monitor a surge so that they can notify drivers in advance?

Brief:
James is a senior data analyst at Uber who is working on a project wherein he wants to predict possible areas of surge pricing at specific times of the day and show it to *top performing* drivers 30 mins in advance. For that, he and his team need a software that would show them the required data. This data will help the team take the decision about upcoming possible surge price areas and send notifications to top drivers. (Yes, assume they must send notifications to drivers manually / semi-automatic)
Tasks:
• Build at least one main screen, A web-based dashboard which will show all the required information and allow James and his team to send notifications to drivers.
• Visualize a UI based on Uber’s existing design language.
• Document the process in brief.
Identity:
It’s a standard uber product that will be implemented company-wide so it didn’t make much sense to design a separate interface language hence, I used Uber's brand book to access their existing design language which provided:
The Logo Colour Composition
Iconography
Typography
How Surge works
Demand for rides increases Prices go up Riders pay more or wait
Process:
Proto Persona study:

Case study of surges & surge monitoring dashboard for Uber (Individual work)
The development of this software directly correlates to the income of the drivers and the service quality of the riders. If this process isn’t done (automated or manual) there is barely an incentive to use the product (Uber) as a whole. At the end of the day, people (Engineers at Uber) are going to use this product to help other people (drivers) in the link. And thus, the proto persona study will help the designer (me) put people before products, processes, protocol & profit.
Define:
A tool that allows engineers to monitor realtime surges and predict surges (within a time range of 20-30 min and or 45-60 min), making it easier for them to notify top drivers in advance. It can use historic data to analyze and show it in a format that is quick to understand and easy to act against.
Assumptions for solution:
• Not considering from where and how they are getting the data, but how the data is represented and how it is being used (the data used in the assignment is arbitrary, the real numbers and time might be very different)
• Considering only Uber X requests for the software development (we can have a simple dropdown menu feature for different products or other solutions depending on the complexity)


• Not getting into how surge rates are determined but just that the surge needs to be applied (surge rates can be determined via data collection, surveys, etc and simple solutions like more demand higher the surge rate, etc)
• Considering only upcoming surges and not live surges. (however, this can be just an added feature to access the information)

Case study of surges & surge monitoring dashboard for Uber (Individual work)
Ideation:
We need data to predict a surge, but how do we know what we need? Why can’t there be a simple surge responder, every time there is a huge demand for cabs? We all know San Francisco’s Financial District (the assumed location for the study) gets a huge number of requests at end of the workday. Then why aren’t we simplifying the process?
Data needed for a solution:
Day – data varied from day to day
Time Range – data varied between time ranges
Number of requests – the more requests the more drivers we need in the area
Type of request – Uber has multiple ride options
Average rating (driver and rider) – the higher the rating the better service is required to retain customers and get more drivers in the area
Location – locations are based on existing spatial indexing format (Google s2 that is used by uber to locate and measure distances)
Average wait time – reduced average wait time would mean more drivers in the area are ready to provide service, also better service quality
Prototype:
• A simple interface compiling the aforementioned data in a way that can be understood by a beginner, so James doesn’t have to train everyone
• The data can be toggled between history (to understand how we got this info), Realtime (what is happening now), upcoming (prediction using historic data)
• The number of requests, number of drivers, and average wait time are prime factors that help determine whether a surge is needed or not (the higher wait time indicated more requests, fewer drivers and thus low service quality indicated in red color, when the wait time goes down within the same time frame, it is evident the solution worked, and the indication goes to green)
• The data used are the highest recorded metrics in Uber’s documented history with respect to the requested time, simply to predict that similar numbers might appear.
Reference Link for brand identity: https://developer.uber.com/docs/riders/guides/design-guidelines https://wolffolins.com/case-study/uber
Research and development reference links: https://www.uber.com/us/en/drive/driver-app/how-surgeworks/#:~:text=How%20are%20surge%20prices%20calculated,not%20change%20during%20surge%20pricing https://economicsforlife.ca/wp-content/uploads/2015/10/effects_of_ubers_surge_pricing.pdf
https://medium.com/locale-ai/how-does-uber-do-price-surge-using-location-data-cfee03415022
Brand Identity
Tabs to monitor historic & upcoming surges (data derived from predictive analytics)
Realtime data to monitor active surges

