Bus Transit-Oriented Design
Advancing Equity in the Trinity Metro System In Fort Worth
Ayushi Mavuduru PLAN 4395 Green Cities and Transportation
How can principles of multimodal transportation, transitoriented design, and mixeduse development improve the connectivity provided by and perception of safety of Fort Worth's Trinity Metro bus lines?
The Trinity Metro System
of Planning and Development 2022)
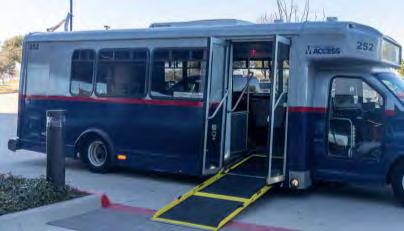

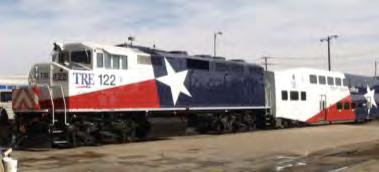
Fixed-Route
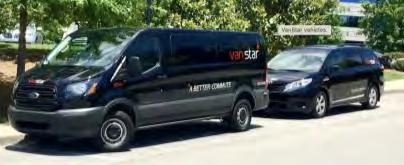
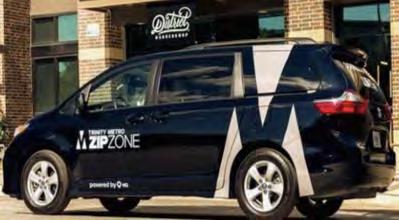
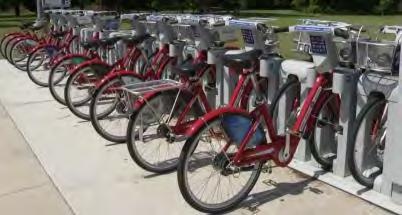
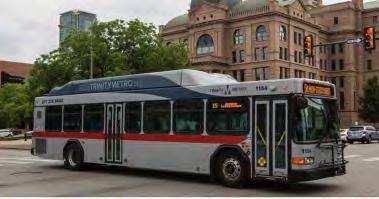
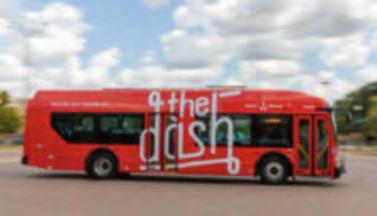
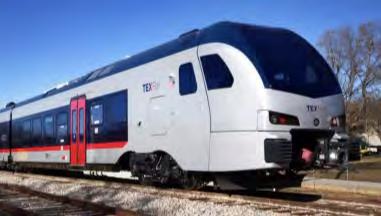
ACCESS TexRail Trinity Railway Express "Molly the Trolley" The DASH Vanpool Zipzone Fort Worth Bike Sharing Fixed Route On Demand
Circulators Rideshare
Bus
(Department
(Trinity Metro 2020)
(Fitzgerald 2019)
(Trinity Metro 2021)
(Trinity Metro 2019)
(Harbor 2010)
(Trinity Metro 2023)
(Vanstar Vehicles 2019)
(Trinity Metro 2022)
(Sakmari 2020)
The Trinity Metro System
Fixed-Route Bus ACCESS TexRail Trinity Railway Express "Molly the Trolley" The DASH Vanpool Zipzone Fort Worth Bike Sharing Fixed Route On Demand
Circulators Rideshare Leading Annual Ridership, Annual Passenger Miles, and Annual Vehicle Revenue Miles Mode Ridership Passenger Miles Vehicle Revenue Miles Bus 2,952,079 23,000,000 5,386,660 ACCESS 213,987 2,000,000 2,211,603 TRE 800,000 22,0000 154,718 Texrail 304,545 4,600,000 125,398 Vanpool 129,919 5,000,000 21,308 Bikeshare 84,073 421,063 8,760 Performance
(Department of Planning and Development 2022)
By Mode FY 2021
Suitability of BTOD To Fort Worth
(Currie 2006)
Adaptability of routes
(Transit Moves Fort Worth 2019)
Lack of Basic Amenities at Bus Stops Population and employment densities too low to support high frequency buses
(Transit Moves Fort Worth 2019)
of Fort Worth's Land area is dense enough to support some level of fixed service
Lower construction and operating costs
Mimic "many to many" character of suburban transit patterns
Spatial inequities in road and sidewalk conditions hinders first/ last mile connectivity to buses
(City of Fort Worth 2022)
Limitations of
Existing Bus
System in Fort Worth
90% 78% 76% 40% 47% 41%
31%
Addressing the Negative Perception of Bus Transit
Racialized association with "dependent riders"
Texrail expansion into biomedical research and health education village south of downtown, and TCU campus area
(Spieler 2020) (Currie 2006)
Perceived as less enduring, and therefore less economically viable
Bike share growth in recreational and educational areas like TCU campus, Southside, and Stockyards District
(Department of Planning and Transportation 2022)
Proposed BRT line along East Lancaster Avenue faces opposition from business leaders
(Department of Planning and Transportation 2022) (Sadek
2023)
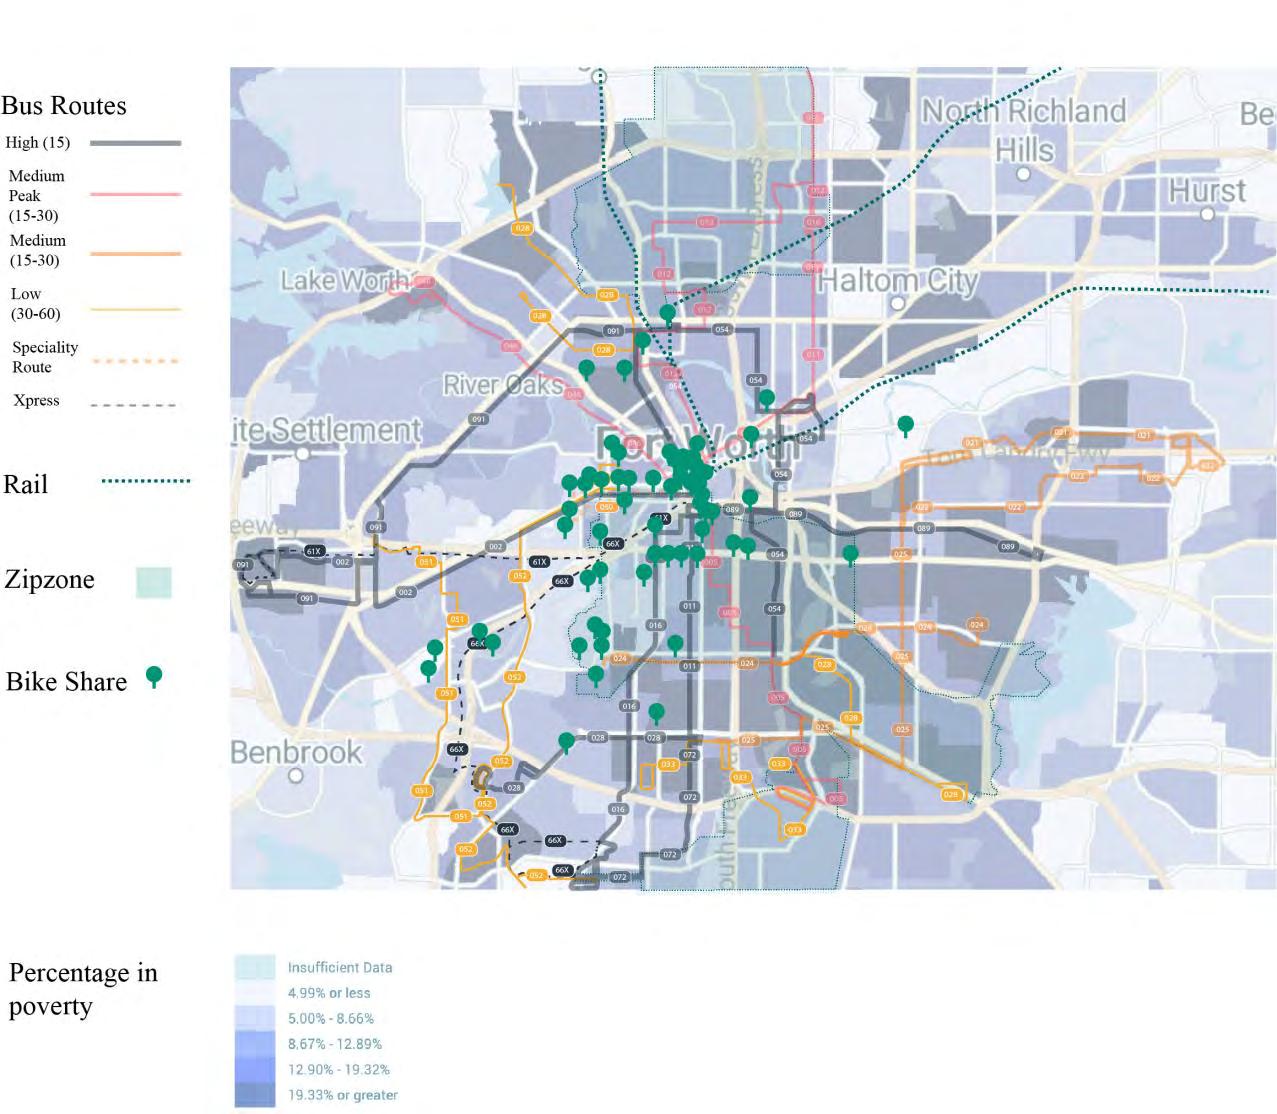
Routes
Mobility Assessment
Performanceand Demographics
Population Density
(2023-2026 Title VI Assessment) (EPA Smart Location Database)
Total Passengers per hour across transfer routes
(2023-2026 Title VI Assessment)
National Walkability Index
Poverty
Race/Ethnicity
(H+T Index)
Transit + Housing Cost as a Percentage of Income
30-minute transit shed
Transit Use Propensity
Job Access Disparity
(H+T Index) (H+T Index) (2020 US ACS) (2020 ACS) (2020 ACS) (Transit Moves Fort Worth 2019)
2023)
Jobs by Car – Jobs By Transit Jobs by Car 100
(USDOT
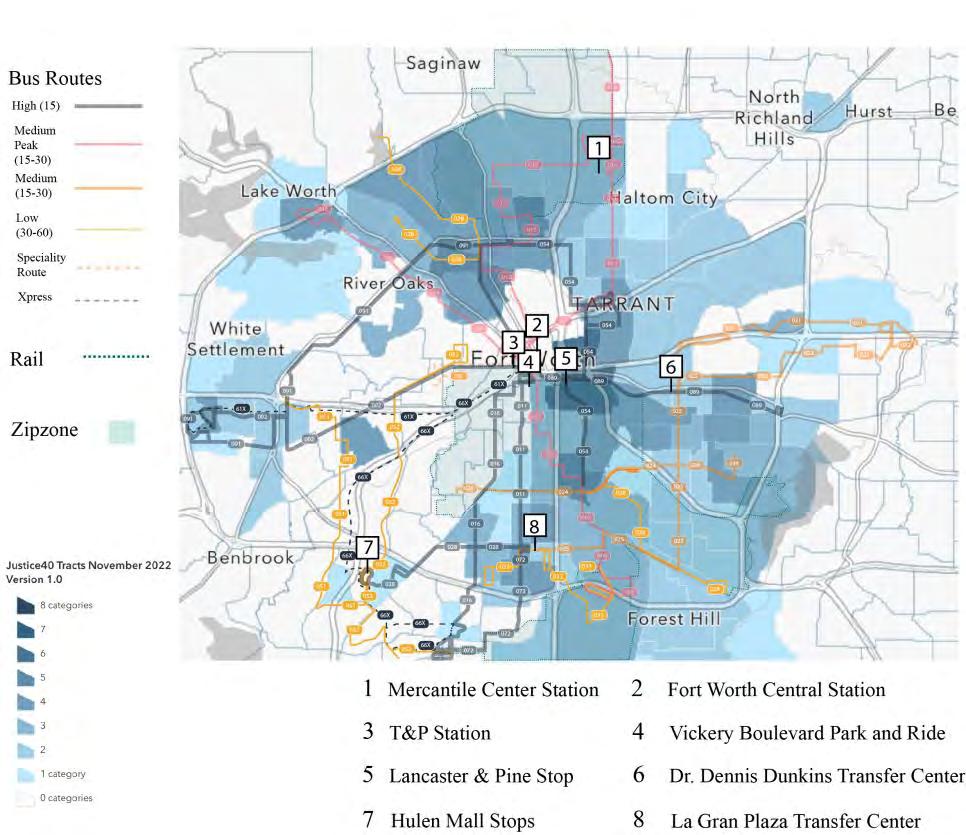
Justice 40 Initiative
Mobility Assessment
SelectedStations, Transfers,and Stops
Routes 1, 2, 5, 6, 11, 12, 46, 89, 19,50 21, 22, 25, 89 1, 5, 6, 19, 61, 66 1, 29, 25, 33, 72
Station Dr.
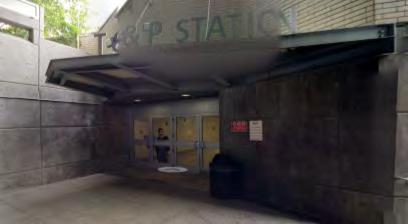
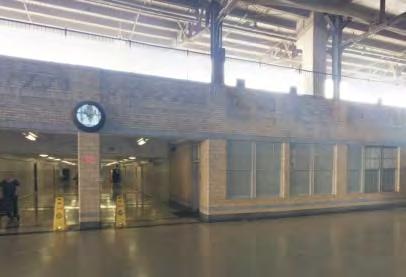
T&P Station
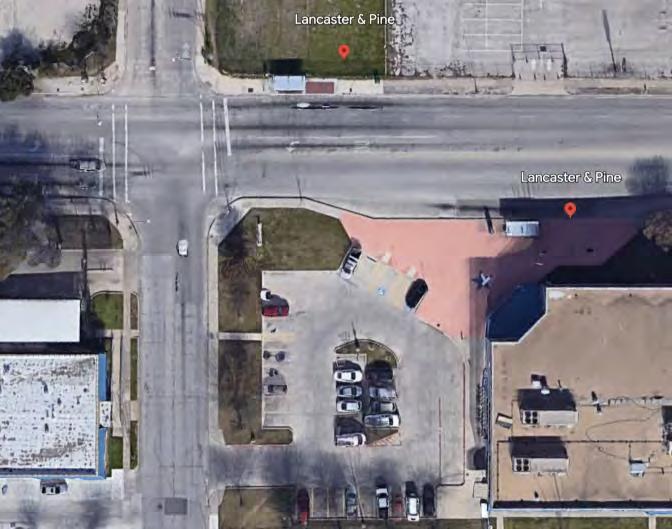
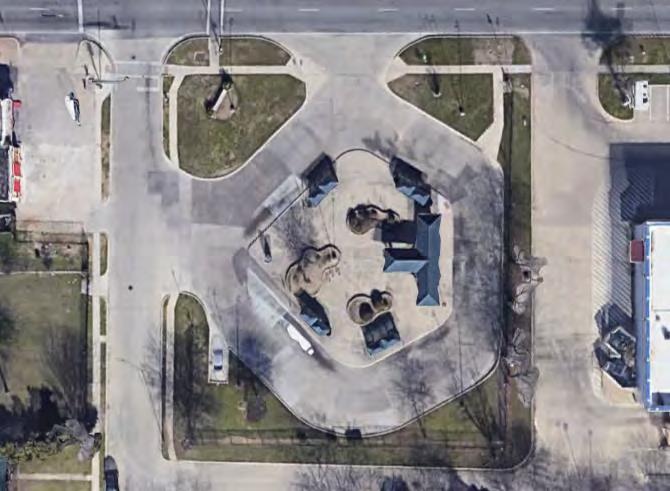
Lancaster
Vickery
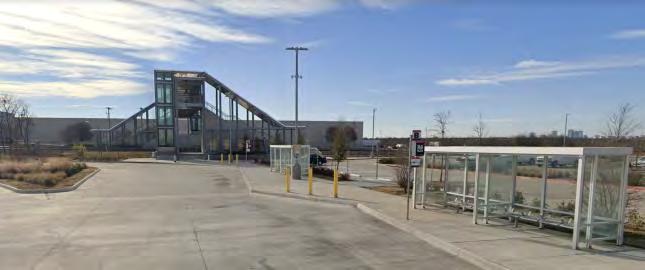
Mercantile
54, 89 21, 29, 51, 52 5, 6 11, 12, 16 Passengers /Hr 89.91 58.02 49.98 45.3 34 28.15 25.81 16.88 30-minute Transit Shed 118 74 118 66 98 57 91 56 Job Access Disparity 7.17% 21.59% 7.17% 31.37% 65.30% 50.61% 71.64% 69.86% Transit+ Housing % of Income 12+28% 20+17% 12+28% 20+15% 15+8% 15+17% 15+16% 20% Walkability 18.17 13.83 (16.33) 18.17 15(17) 13.92 15.5 15.25 (17.83) 7 Population density 8,327.04 (21,327.55) 4,701.1 (6,018.91) 8,327.04 (21,327.55) 4,122.04 1,943.14 2,576.73 (1,695.22) 826.45 3,680.71 Race/ Ethnicity W 53.15% B 30.56% H 76.36% W 53.15% B 30.56% H 95.28% B 37.91% H 26.9% W 31.8% B 28.9% H 22.6% H 37.5% W 34.61% H 77.61% Poverty 12.74% 13.18% 12.74% 24.61% 55.99% 12.05% 32.44% 18.61% Transit Dependence Low High Low High High Low High Medium J-40 Tract 0 2 0 4 6 0 3 3
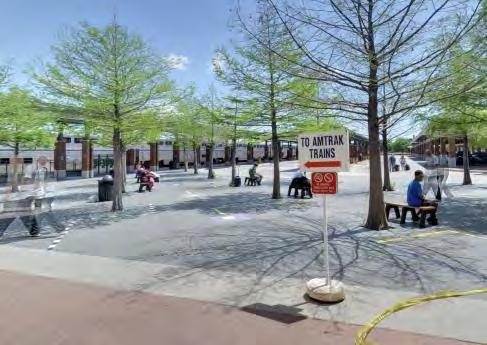
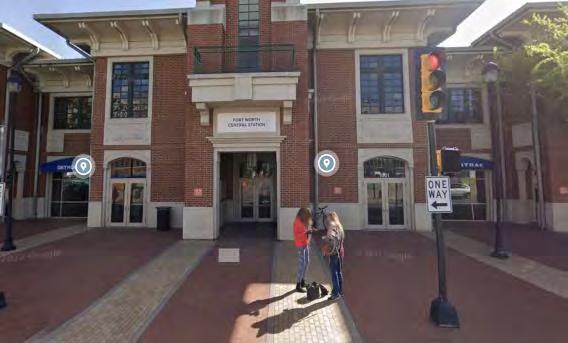
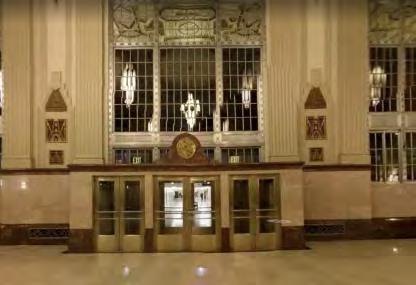
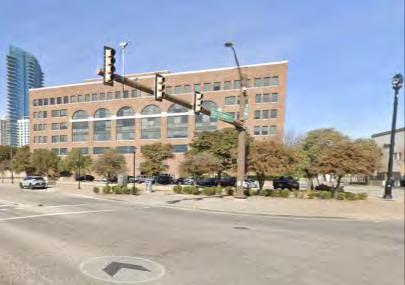
Location Fort Worth Central
Dennis Dunkins
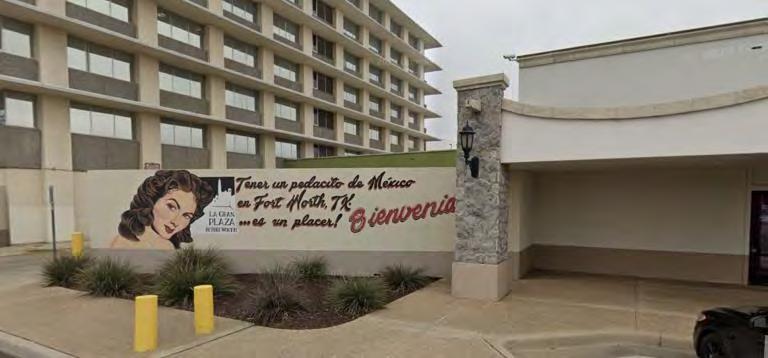
Gran Plaza
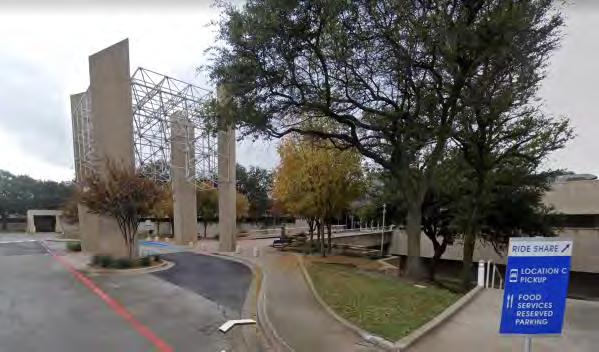
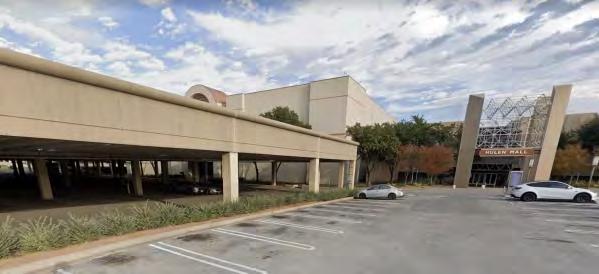
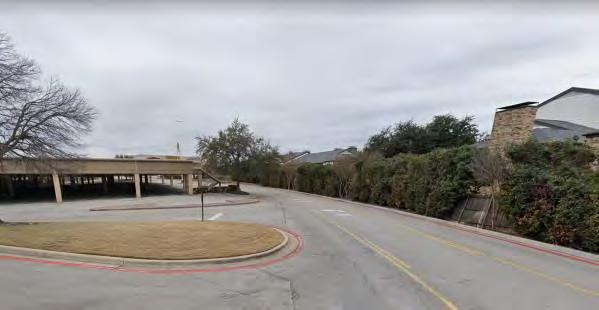
& Pine Hulen Mall
Blvd
Station
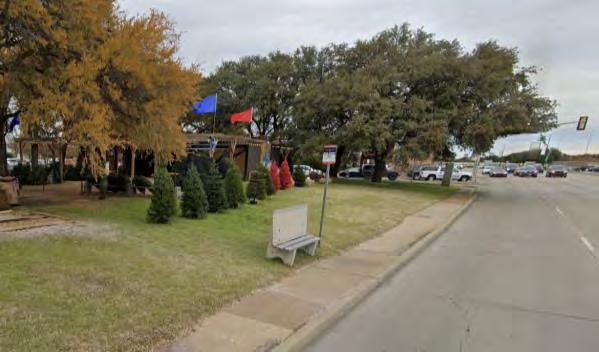
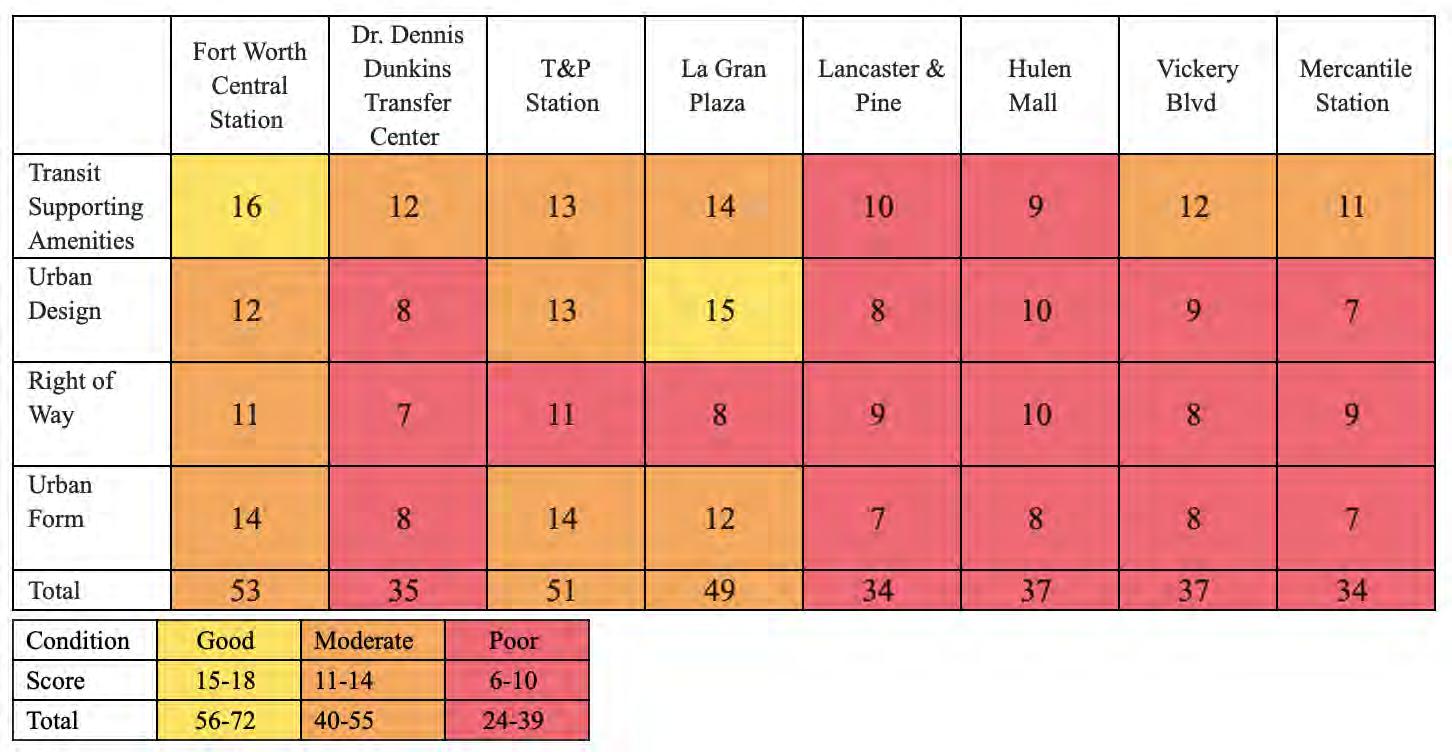
Transit supportive amenities
Lighting Sidewalk
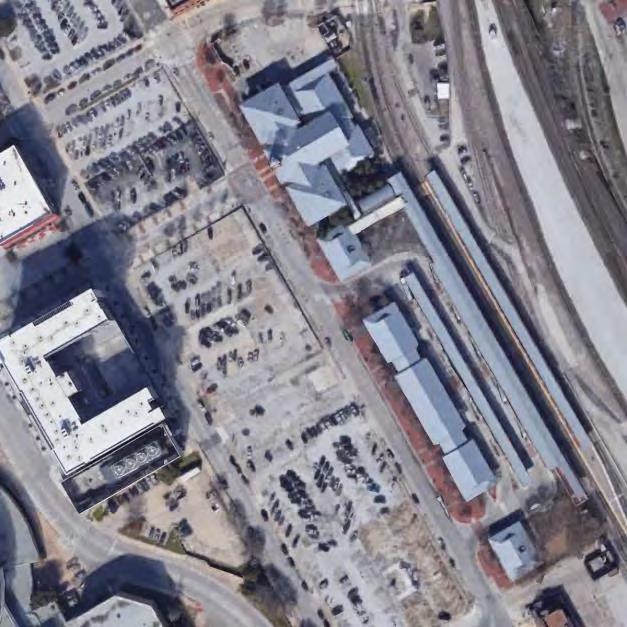
Mobility Assessment
BuiltEnvironment Attributes
Using Google Earth
Street View &Satellite
Imagery
Trash Receptacles
Water Fountains
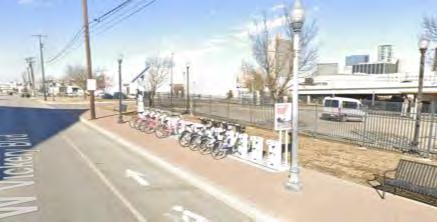
Bike Racks Bus Stop
Right of Way
Road Condition
Traffic Calming Devices
Traffic Signals
Bike Lanes Crosswalk Parking
Urban design Elements
Place Signs
Street Furniture
Public Art
Overhangs & Vegetation
Sight Lines
Street Life
Urban Form
Public Space
Historic Buildings
Diversity of Uses
Contiguous street wall
1st Floor Windows
Façade Design Variety
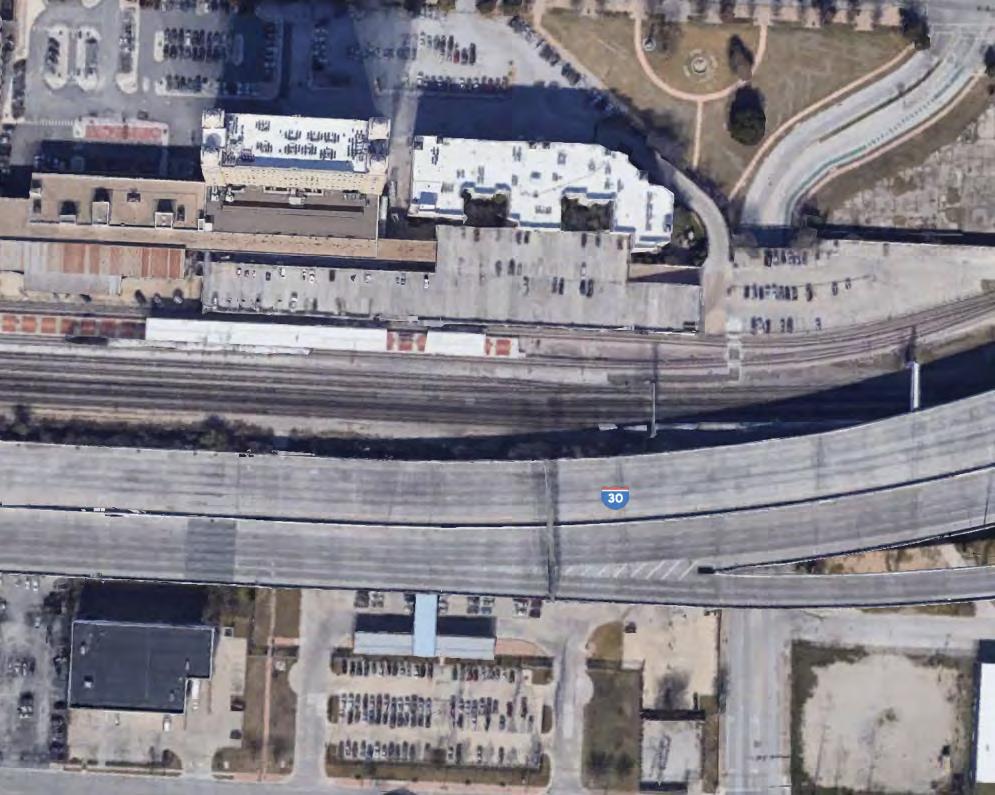
Fort Worth Central Station+ Mercantile Center Station


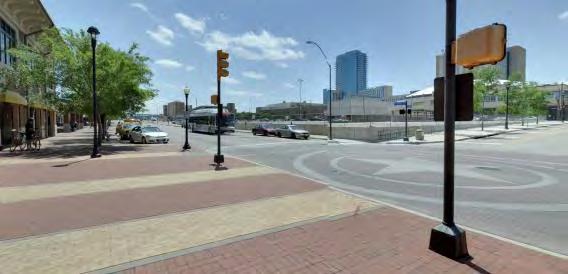

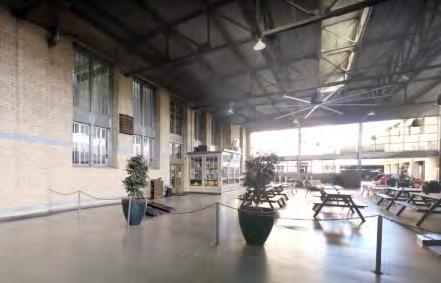
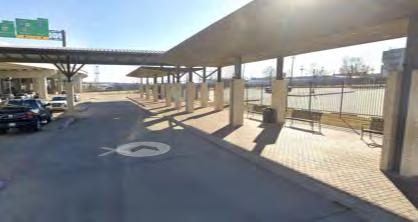
T&P Station+
Vickery Blvd Transfer Center


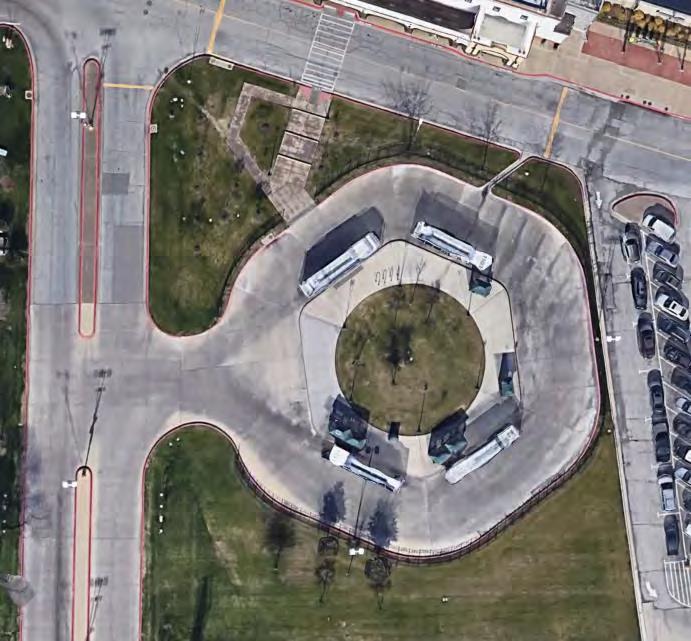
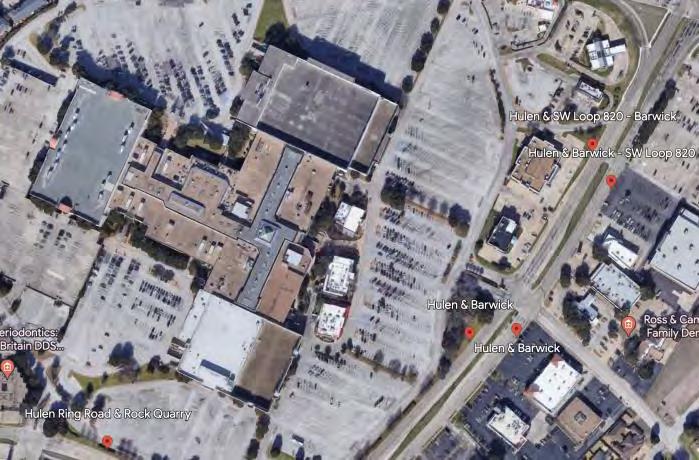
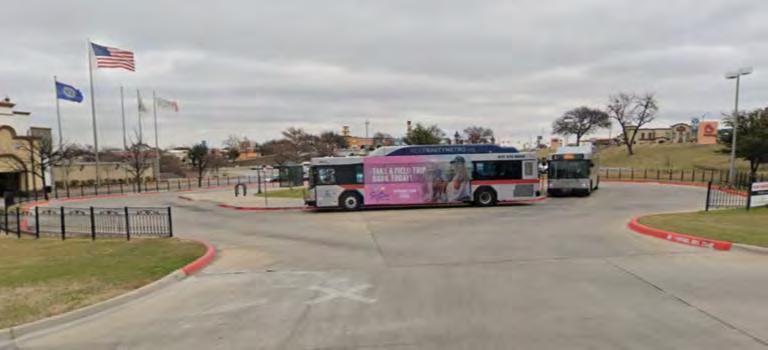
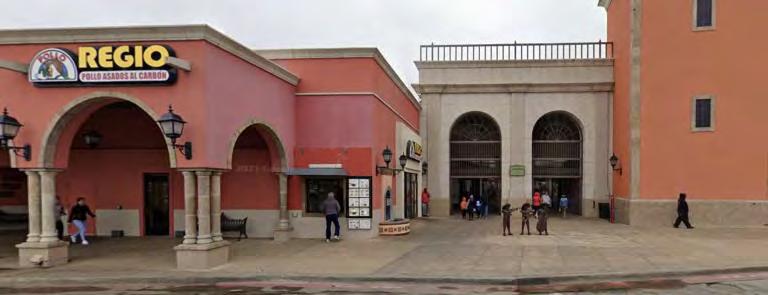
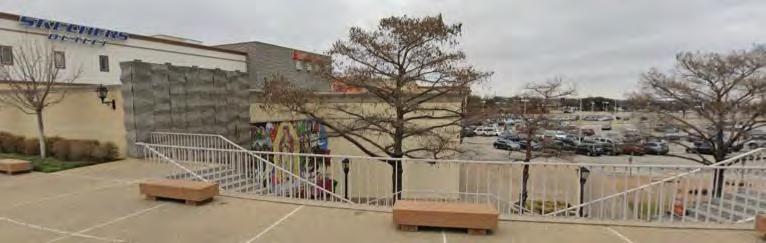
La Gran Plaza Transfer Center+ Hulen Mall
Dr. Dennis Dunkins Transfer Center+ Lancaster & Pine

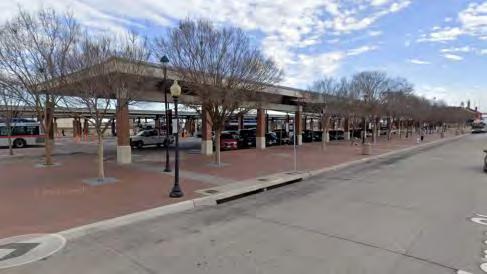
Mobility Assessment
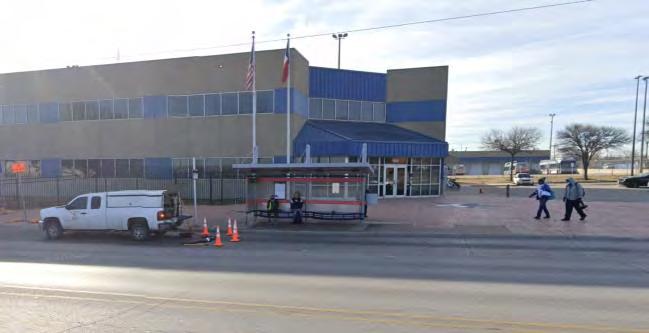
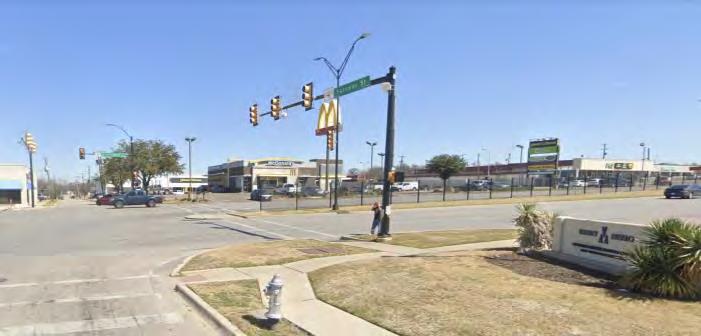
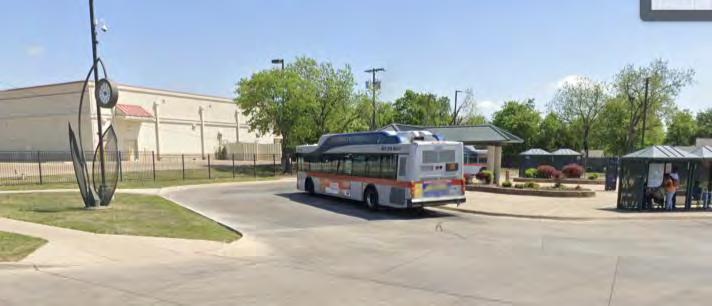
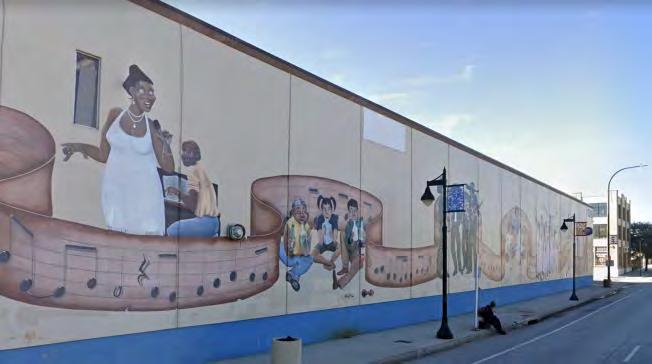
Recurringtrends
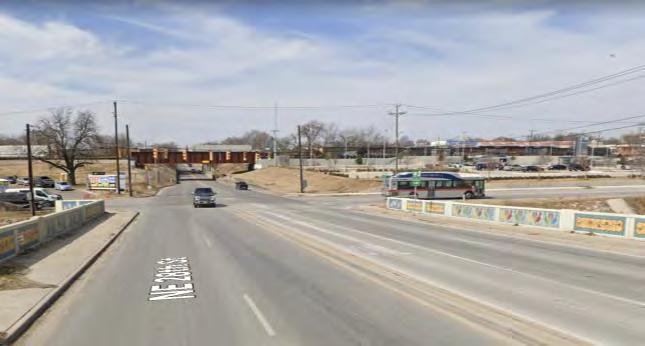
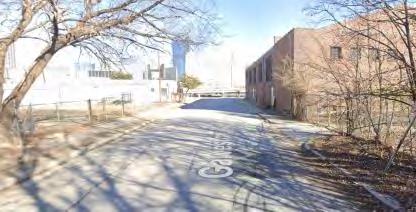
Painted bike lanes with lack of continuity/ conflict with buses "Implied" crosswalk
Narrow crosswalk on 4+ lane intersection
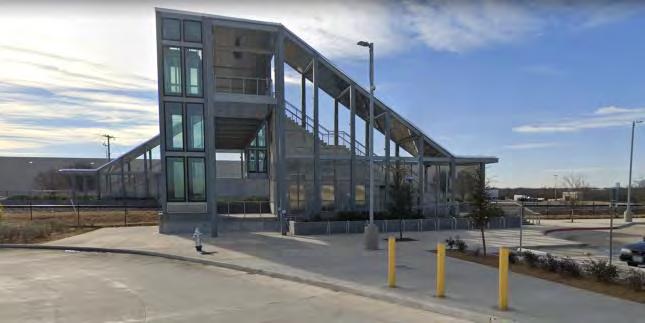
Visual separation of bus and rail when contained in the same site
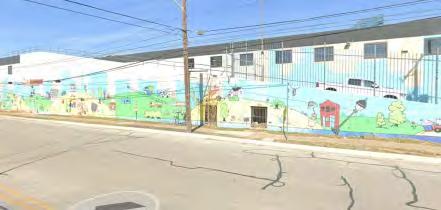
Murals on "closed off" facades
Large blocks of parking
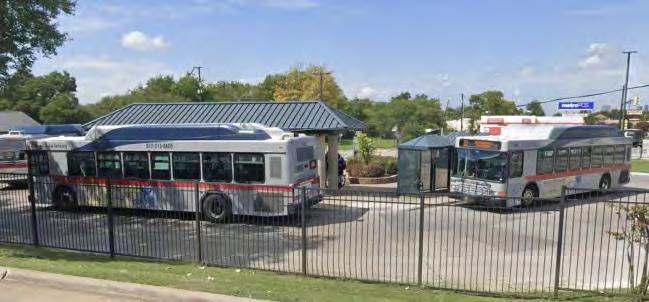
Individual bus shelter clusters instead of large terminal
Continuity of colors and materials across uses
Wider, red brick paved sidewalks associated with city center Art and decoration commissioned by city/ developers
Mobility Assessment
Results
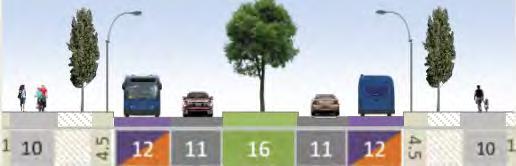
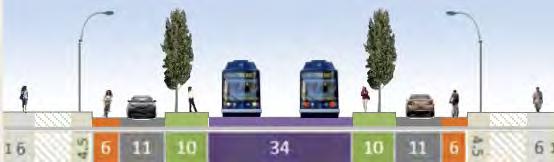
Design Proposals
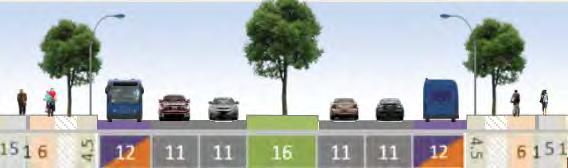
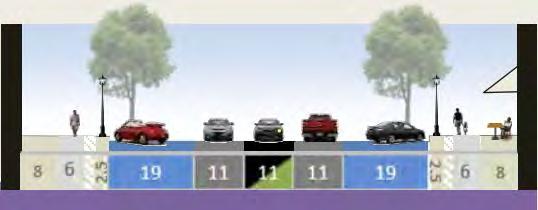
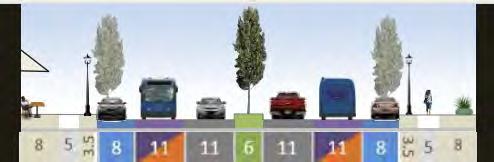
2016
Thoroughfare
Neighborhood Connector Commerce/ Mixed
Street Activity Street System Link
Fort Worth Master
Plan Commercial Connector
Use
Design Proposals Advancing East Lancaster

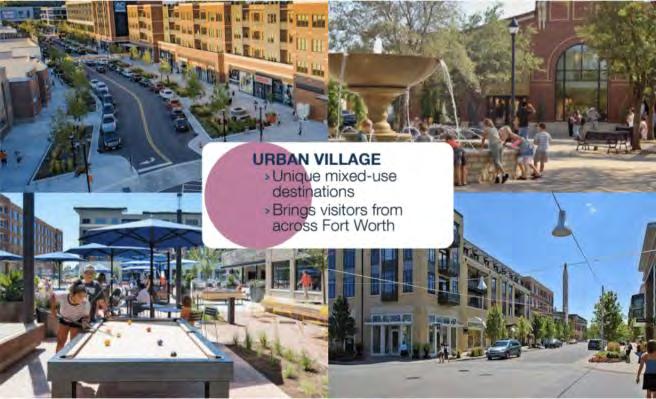
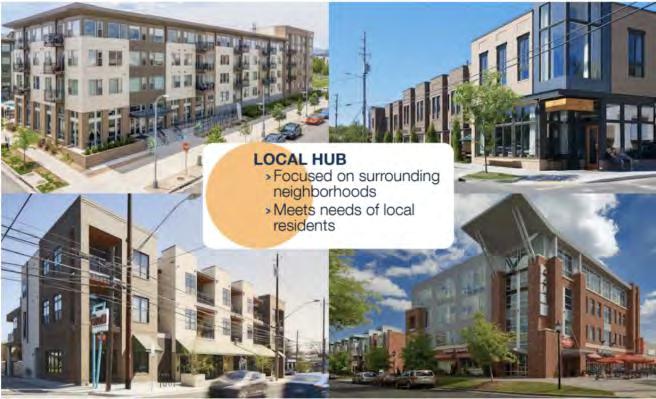
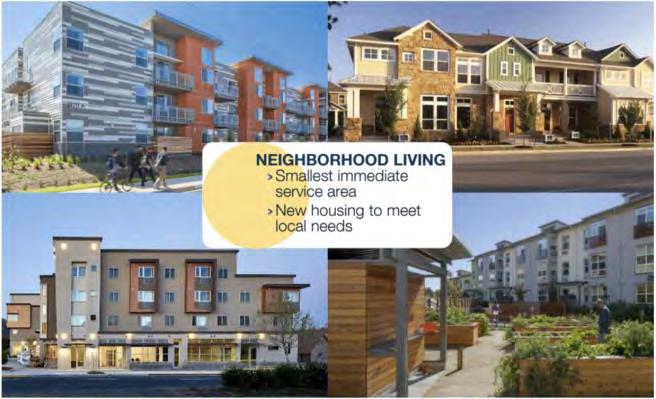

Design Recommendations
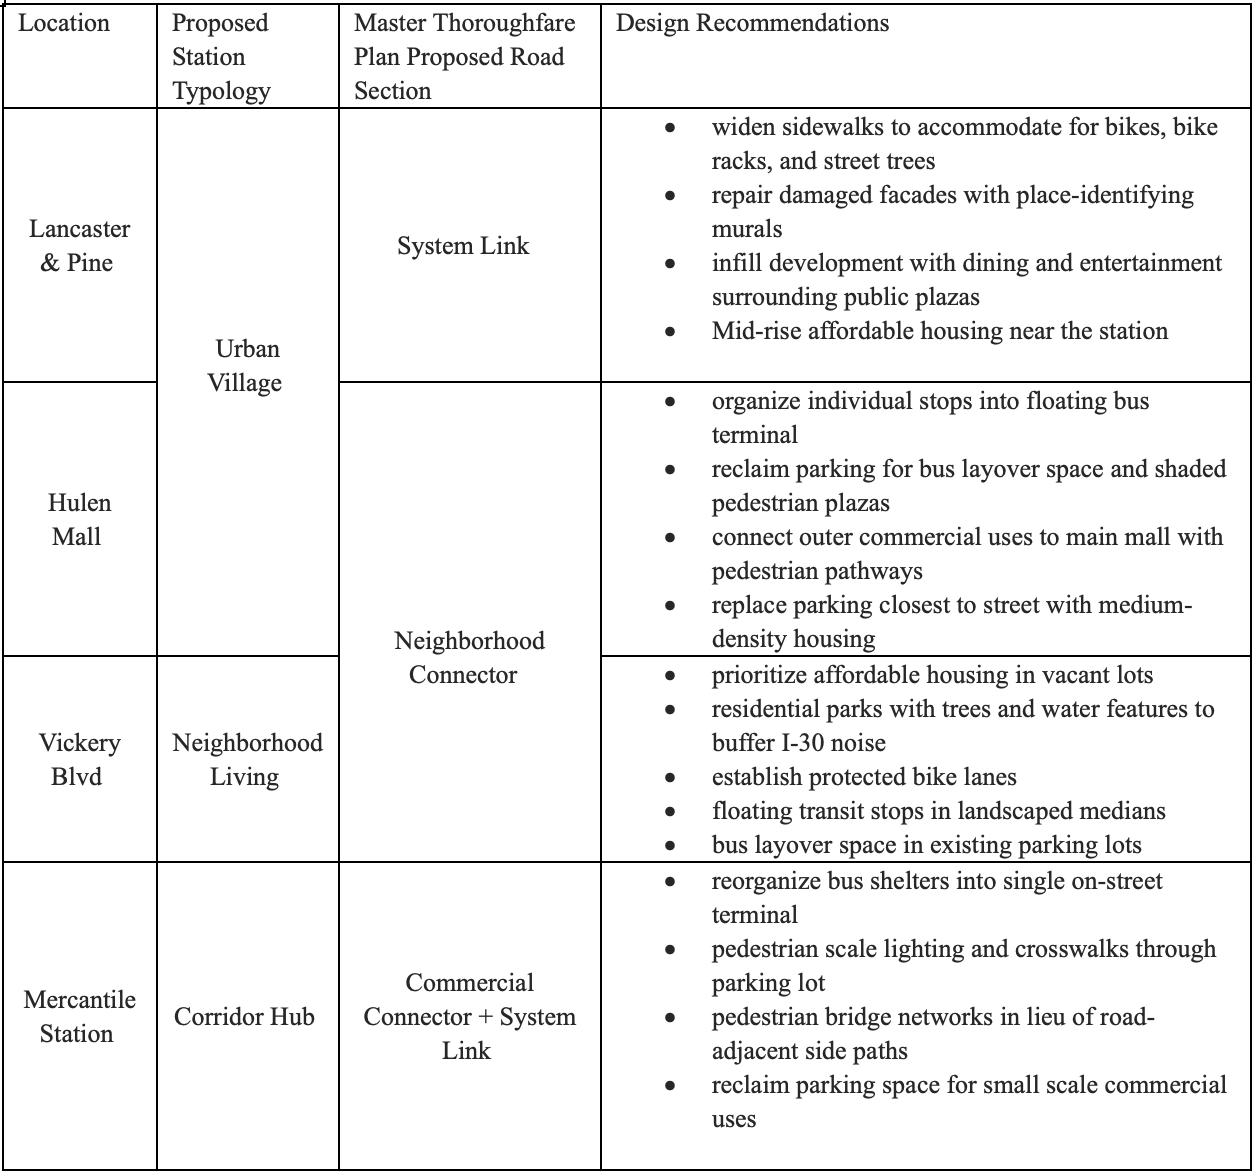
Recommendations
A Better Connection (2021)
Short-Term
Active Transportation Plan
-Pop up Projects Guide
-Sidewalk gaps
-Bike lane and transit integration
Transit Moves Fort Worth
-Performance analysis
-Market and demand analysis
-Land use and transportation planning
-Funding strategies
Long -Term
Public Engagement
Target younger audiences via Instagram instead of just Facebook
Continue face-to-face outreach to homeless population through TransitEnvoys
Short-term intervention strategies
Modify Pop Up Projects Guide:
City targets high-priorityareas, neighborhood residents collaborate with experts on design decisions, city-wide workforce and volunteersdeployed complete project
Partner with local small businesses to sponsorsmall scale upgradingof sidewalks or bus shelters
Data
Collection
Disaggregate surveydata by zip code, income, , race, age, education level, etc
Conductorigin-destinationsurveysfor existing bus trips
Existing Policies & Projects
Funding Strategies
Local Parking fees
Rideshare taxes
Turning partner cities into member cities
Federal
Justice 40
Elligibility for competitive grants