62
Technical Papers
HEALTH-BASED TARGETS PERFORMANCE REPORTING New software to automate decision rules in the Manual for the Application of Health Based Treatment Targets and produce a monthly report of pathogen barrier performance P Prevos & D Sheehan
WATER QUALITY MONITORING
INTRODUCTION Minimising risk to public health is the most important mission for water utilities. Safe drinking water is a necessary condition to allow communities to live, grow and enjoy. While in many parts of the world water supplies are the direct or indirect cause of about 10% of the burden of disease (Hrudey and Hrudey, 2004), Australian communities enjoy water that poses almost no risk to human health. The question remains, however, exactly how low the level of risk actually is. To define microbial safety the World Health Organisation uses the metric of Disability Adjusted Life Years (DALYs), which represents the sum of time a person is burdened with an illness (i.e. loss of time in good health) and years lost through premature death. The Manual for the Application of Health Based Treatment Targets, published by the Water Services Association of Australia (WSAA) (Release 1, August 2014), further referred to as the Manual, assists water managers with estimating the potential burden of disease caused by reticulated drinking water. The Manual defines methods for determining the minimum treatment requirements for drinking water supplies by assessing the relative microbiological risk in the source water for the supply, and then applies a suite of decision rules to estimate the effectiveness of treatment barriers that are used to manage the risk. The effectiveness of the treatment barriers is expressed in Log Reduction Values, which relates to public health risk. The Manual assists utility managers to design and operate water treatment plants to assure that the level of public health risk is less than 1 micro DALY per person per year in a population of one million people.
WATER NOVEMBER 2015
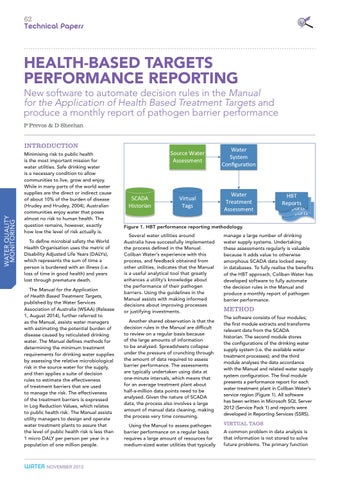
SCADA Historian
Source Water Assessment
Water System Configuration
Virtual Tags
Water Treatment Assessment
HBT HBT Reports HBT Reports Reports ports
Figure 1. HBT performance reporting methodology. Several water utilities around Australia have successfully implemented the process defined in the Manual. Coliban Water’s experience with this process, and feedback obtained from other utilities, indicates that the Manual is a useful analytical tool that greatly enhances a utility’s knowledge about the performance of their pathogen barriers. Using the guidelines in the Manual assists with making informed decisions about improving processes or justifying investments. Another shared observation is that the decision rules in the Manual are difficult to review on a regular basis because of the large amounts of information to be analysed. Spreadsheets collapse under the pressure of crunching through the amount of data required to assess barrier performance. The assessments are typically undertaken using data at one-minute intervals, which means that for an average treatment plant about half-a-million data points need to be analysed. Given the nature of SCADA data, the process also involves a large amount of manual data cleaning, making the process very time consuming. Using the Manual to assess pathogen barrier performance on a regular basis requires a large amount of resources for medium-sized water utilities that typically
manage a large number of drinking water supply systems. Undertaking these assessments regularly is valuable because it adds value to otherwise amorphous SCADA data locked away in databases. To fully realise the benefits of the HBT approach, Coliban Water has developed software to fully automate the decision rules in the Manual and produce a monthly report of pathogen barrier performance.
METHOD The software consists of four modules; the first module extracts and transforms relevant data from the SCADA historian. The second module stores the configurations of the drinking water supply system (i.e. the available water treatment processes); and the third module analyses the data accordance with the Manual and related water supply system configuration. The final module presents a performance report for each water treatment plant in Coliban Water’s service region (Figure 1). All software has been written in Microsoft SQL Server 2012 (Service Pack 1) and reports were developed in Reporting Services (SSRS). VIRTUAL TAGS
A common problem in data analysis is that information is not stored to solve future problems. The primary function