water quality • Low chlorine dose (0. 10 mg/L free chlorine) • Normal chlorine dose (0.35 mg/L free chlorine) • Chloramination (0.8 - 1.2 mg/L total chlorine) • PAC dosing (20 mg/L, approximately 20 minutes contact time) • Normal chlori ne dose (0.35 mg/L free chlorine) The full trial commenced on 15th September 2003. The process changes at the plant were made by the operator. T he treatment type and duration were only known to a few people within the operations section at Gippsland Water. This was done to minimise any bias in the data that may have arisen from any preconceptions relating to the treatment type.
Data Collection and Analysis Participants in the trial were asked to rate the strength of any taste or odour of the water according to the following numerical scale. • O Ni l • l Faint • 2 Mild • 3 Strong • 4 Very strong T hey were also asked to describe the taste or odour according to the fo llowing descriptions, • Chlorine • Plastic • Burnt Rubber • Medicinal • Metallic • Earthy or to describe the taste in their own words if none of the above descriptors marched the taste. T he data was transcribed to an Excel spreadsheet for analysis. Periods for analysis were carefully selected so as to ensure that all Sale residents had received the particular water type. Hydraulic modelling of the distribution system showed that it took up to 48 hours for water to travel from the WTP to all parts of the distribution system. Consequently the data analysed for each treatmen t modi fication covered the period from 48 hours after the treatment cha nge to 48 hours after the completion of the treatment modification. The numerical data for each period was su mmed to give a total water quality score for the period. In this semi-quantitative system, a high score represented water with a significant taste and odour and a low score, a zero to faint taste and odour. To
106 MARCH 200s
water
250
Ql
0
200
els ~ CO 150 ::,
a 2
"' :i:
100
50
Site 1
Site 2
Site 3
Site4
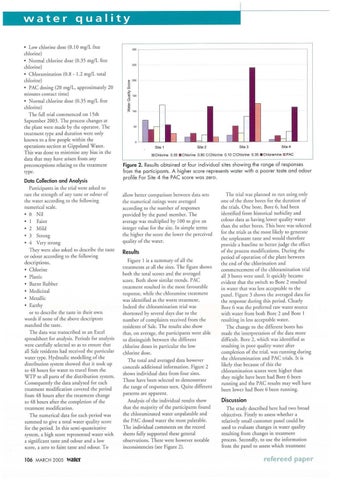
DChlorine 0.35 • Chlorine 0.80 O Chlorine 0.10 DChlorine 0.35 • Chloramine D PAC
Figure 2. Results obta ined at four ind ividual sites showing the range of responses from the participants. A higher score represents water w ith a poorer taste and odour profile For Site 4 the PAC score was zero. allow better comparison between data sets the numerical ratings were averaged according to the number of responses provided by the panel member. T he average was multiplied by I 00 to give an intege r value for the site. In sim ple terms the higher the score the lower the perceived quality of the water.
Results Figure I is a su mmary of all the treatments at all the sires. T he figure shows both the total scores and the averaged sco re. Both show similar trends. PAC treatment resulted in the most favou rable respo nse, while the chloramine treatment was identi fied as the wo rst treatment. Indeed the chlorami11arion trial was shortened by several days due to the number of co mplaints received from the res idents of Sale. T he results also show that, on average, the participants were able to distinguish between the different chlorine doses in particular the low chlorine dose. The total and averaged data however conceals addi tion al information. Figure 2 shows indi vidual data from four sites. T hese have been selected to demonstrate the range of responses seen. Quite different patterns are apparent. Analysis of the individual resu lts show that the majority of the participants found the chloraminared water unpalatab le and rhe PAC dosed water the most palatable. The individual com ments on the record sheers fully supported these general observations. T here were however notable inconsistencies (see Figure 2).
The trial was planned to run using only one of the th ree bores fo r the duration of the trials. One bore, Bore 6, had been identified from historical turbid ity and colour data as having lower quality water than the other bores. This bore was selected for the trials as the most likely to generate the unpleasant taste and would therefo re provide a baseline to better judge the effect of the process modificatio ns. During the period of operation of the plant between the end of the chlorination and co mmencement of the chloramination tria l all 3 bores were used. lt quickly became evident that the switch to Bore 2 resulted in water that was less acceptable to the panel. Figure 3 shows the averaged data for the respo nse during this period. Clearly Bore 6 was the preferred raw water source with water from both Bore 2 and Bore I resu lting in less acceptable water. T he change ro the different bores has made the interpretation of the data more difficult. Bore 2, which was identified as resulti ng in poor quali ty water after completion of th e trial , was running during the chloramin ation and PAC trials. It is likely that because of this the chloramination scores were higher than they might have been had Bore 6 been running and the PAC results may well have been lower had Bore 6 been running.
Discussion T he study described here had two broad objectives. Firstly to assess whether a relatively small customer panel could be used to evaluate changes in water quality resulti ng from changes in treatment process. Secondly, to use the information fro m the panel to assess which treatment
refereed paper