Table 7 ~ Determination of Recirculation Rate
Discussion A kinetic reaction equation can be developed assuming the recirculation model shown in Figure 8. Assuming complete mixing in each basin, with recirculation flowrate , a, mass balance on Aerobic Volume V 1I gives: aC2 Inlet Outlet aC1 l
=
(I)
dt
c20 V2) - cl vi (2) v2 Substituting (2) into (1) and solving the differential equation gives: In
v1c 10 +
v 2c 20 - (V1
+ Vi)C 1 = - a(V1 + Vi)t
- 0.00752 min-1
0.182 m 3 /s or 3.5 DWF
0.162 m 3 /s or 3.1 DWF
(3)
vi v 2
V/C20 - Clo) Hence if we plot In VICIO +
v2c20 Vi(C20
(VI
SUMMARY
+ V2)C1
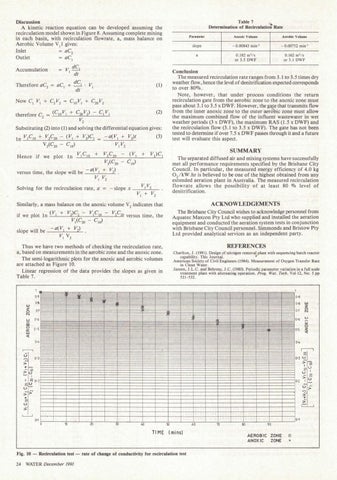
The separated diffused air and mixing systems have successfully met all performance requirements specified by the Brisbane City Council. In particular, the measured energy efficiency of 4.0 kg 0 2/ kW .hr is believed to be one of the highest obtained from any extended aeration plant in Australia. The measured recirculation flowrate allows the possibility of at least 80 % level of denitrification.
C1o)
versus time, the slope will be - a( Vi + V2) v1 v 2
Solving for the recirculation rate, a
= -
slope x
Vi V2 vi+ v 2
ACKNOWLEDGEMENTS
Similarly, a mass balance on the anoxic volume V2 indicates that if we plot In (VI + V2)C2 - vlclO Vl(C20 - CIO)
The Brisbane City Council wishes to acknowledge personnel from Aquatec Maxcon Pty Ltd who supplied and installed the aeration equipment and conducted the aeration system tests in conjunction with Brisbane City Council personnel. Simmonds and Bristow Pty Ltd provided analytical services as an independent party.
v 2c 20 versus time, the
- a( VI + V2) v1 v2
slope will be
Aerobic Volume
min- 1
Conclusion The measured recirculation rate ranges from 3 .1 to 3. 5 times dry weather flow, hence the level of denitrification expected corresponds to over 80%. Note , however, that under process conditions the return recirculation gate from the aerobic zone to the anoxic zone must pass about 3 .1 to 3 .5 x DWF. However, the gate that transmits flow from the inner anoxic zone to the outer aerobic zone must allow the maximum combined flow of the influent wastewater in wet weather periods (3 x DWF), the maximum RAS (1.5 x DWF) and the recirculation flow (3 .1 to 3.5 x DWF). The gate has not been tested to determine if over 7.5 x DWF passes through it and a future test will evaluate this aspect.
= (CIO vi +
therefore c 2
- 0.00843
a
dt
aC1 + dC1 · V1
Anoxic Volume
slope
V <!S:.J.
Accumulation Therefore aC2
Parameter
REFERENCES
Thus we have two methods of checking the recirculation rate, a, based on measurements in the aerobic zone and the anoxic zone. The semi-logarithmic plots for the anoxic and aerobic volumes are attached as Figure 10. Linear regression of the data provides the slopes as given in Table 7.
Charlton, J. (1991). Design of nitrogen removal plant with sequencing batch reactor capability . This Journal. ' American Society of Civil Engineers (1984) . Measurement of Oxygen Transfer Rate in Clean Water. Jansen, J .L.C . and Behrens , J.C. (1980) . Periodic parameter variation in a full scale treatment plant with alternating operation . Prag. Wat. Tech. Vol 12, No. 5 pp 521-532.
,
UJ
z
~
0·9
0·9
0-S
0•8
UJ
0-7
0-7
~
u
-;::;
-
---
0·4
.----,
0·6
X
0·5 0-4
o·3
+
>c5
-1
I 2 0· 2
i:i u
u
.;> +
$?
I
>
:
I
)___J
.'
0-1 0
10
20
30
40
50
Tl ME ( mins)
Fig. 10 24
Recirculation test -
WATER December 1991
rate of change of conductivity for recirculation test
.' 0•1
60
70
so
90
AEROBIC ZONE ANOX IC ZONE
U 0
>
u
z
0 X
~