F l ~ 6. GRAPH SHQWJ..:; THE SlR'IIIN. ~ GRAPH SHQWJ..:; Tl£ SlR'I IVAI.
~ ~
OllUTIOH)
,ooo ~ - - - - - - - - - - -
\000 ~ - - - - -- - - -- .,_ - - --o E•iwt lfflff't I Condu<tf'd 14. 4 .75.17. 4.75 -
G- -
o-----------<> E~-,,c] (ono\K ltd 5,5,7S·9-5-75 (sl:iJ ~ -54-owot., dw.AO'l)
f•IM'f~ 2 (ooduC tf'd 21•4•75•24-.C.•75
- • -
F101
MT GAMBIER ':£W/l,C£ IN SEAWATER FRCM PORT MAC(X)t,,f£U
F ~ Mt G,A,l,,,tBJER 5EwaGE N SEAWA~
elk, S,EW.\GE •SE:AWATER
=
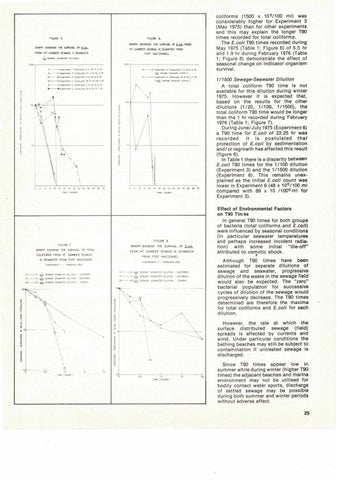
coliforms (1500 x 106/100 ml) was considerably higher for Experiment 3 (May 1975) than for other experiments and this may explain the longer T90 times recorded for total collforms. The E.coli T90 times recorded during May 1975 (Table 1; Figure 6) of 5.5 hr and 1.9 hr during February 1976 (Table 1; Figure 8) demonstrate the effect of seasonal change on indicator organism survival.
~E ,c,tromtnl l Conduc l•d 5.5.,s.9.5.75
- - E , i-lfflf'0\6(onductl'dl0 , 6 ,7S·l-7- 75 (
o.------.AE• Pl'fimrn1 4 (Qndu( ltd 26- 5 -75 -19 -5,75
~
~
111500 Sewage-Seawater Dilution A total coliform T90 time is not available for this dilution during winter 1975. However it is expected that, based on the results for the other dilutions (1 /20 , 1 /100 , 1 /1500) , the total coliform T90 time would be longer than the 1 hr recorded during February 1976 (Table 1; Figure 7). During June/ July 1975 (Experiment 6) a T90 time for E.coli of 22 .25 hr was recorded. It is postulated that protection of E.coli by sedimentation and/or regrowth has affected this result (figure 6). In Table 1 there is a disparity between E.coli T90 times for the 1 /100 dilution (Experiment 3) and the 1 /1500 dilution (Experiment 6). This remains unexplained as the initial E.coli count was lower in Experiment 6 (48 x 10 6 /100 ml compared with 89 x 10 /100 6 ml for Experiment 3).
- SPow<ittt d,M,on)
• • - - · • E•Pl'f~ 5 Condu<tf'd 1\,6,7S-12·6·7S 6 Concluctf'd 30-6- 75-1 ·7-75
4-,6,E,o.Pf'I' ~
•oo i<::'i' - - - ; r ' - - ' - - - t - - - - - - - - -
\'/
~
'\
\i \ \ 0
5
15 W
10
25
JO
35
~
45 50
~
W
~
o s
ro
10
ro
15
!!ME ( H()IJR5)
2s ro 1s ,o u
~
~
~
~
~
TIME (to.PS)
Effect of Environmental Factors on T90 Tlm9s
In general T90 times for both groups of bacteria (total coliforms and E.coli) were influenced by seasonal conditions (in particular seawater temperatures and perhaps increased incident radiation) with some Initial "die-off" attributed to osmotic shock.
FIGURE 8.
FIGURE 7.
GRAPH SHOWING THE SURVIVAL OF
GRAPH SHOWING THE SURVIVAL OF TOTAL
ll2Ji.
FROM MT GAMBIER SE WAGE IN SE AWATER
COLI FORMS FROM MT GAMBIER SEWAGE
•
FROM PORT MACOONNEL
Although T90 times have been estimated for separate dilutions of sewage and seawater, progressive dilution of the waste in the sewage field would also be expected. The "zero" bacterial population for successive cycles of dilution of the sewage would progressively decrease. The T90 times determined are therefore the maxima for total coliforms and E.coli for each dilution .
IN SEAWATER FROM PORT MACOONNEL (EXPERIMENT 7 - FEBRUARY 1976) ( [XPf.R M[Nl 7 • FE8RIJARY 1976)
--
o-.----
D- - -Q
~
~
------o isNi
SEWAGE SE AWA TER Oa.UTION - UNST~REO
~ S!WA(',E SEAWATER ~UHON • UNSTIRR£0
;!W
G- -
5,EWA{,f SEAWATER DILUTION - SIIAR(O
t
--£)
~
SEWAGE SE AWAT ER 011..UTlON • \JNSTIRREO SE V.AGE SEAWATER OlUTION - UNSTIRRED SE WAGE SEAWATER DILUT
,,
\\ \ ~ ',,_
I \
I I
\
I
I I --
~·
---1. ..
~~-:_------',--
\
I
0
','b..
10
I
'"
- Sllf~REO
~
\
·~ ~
TIME ( ~ 5 )
10L-------,L 0 05
10 TIME (HOUlS)
"
20
However, the rate at which the surface distributed sewage (field) spreads is affected by currents and wind. Under particular conditions the bathing beaches may still be subject to contamination if untreated sewage Is discharged. Since T90 times appear low In summer while during winter (higher T90 times) the adjacent beaches and marine environment may not be utilised for bodily contact water sports, discharge of sett led sewage may be possible during both summer and winter periods without adverse effect.
25