
Future Climate, Future Home
Phase 1 Appendices


Appendix A: Digitisation Details
Data layers created in ARC GIS:
Layer Type Attributes
Height (using the buildings footprint layer values or check the google street view)
Buildings
Polygon
Roof type (chosen from Table 1)
Wall type (chosen from Table 2)
Vegetation (Simple Plants) Polygon Simple vegetation (chosen from Table 3)
Surfaces Polygon Surface type (chosen from Table 4)
Vegetation (3D Plants) Points Trees (chosen from Table 5)


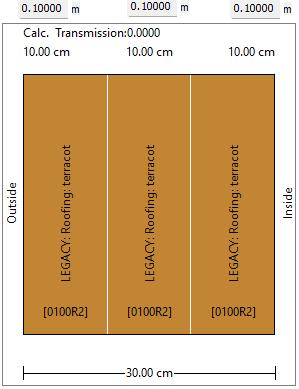
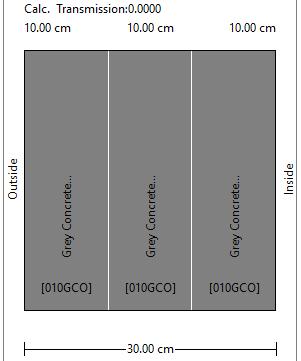


Table 1: Buildings Roof Types
Terracotta tiles- red
0200RT 1
30 cm Roofing: terracotta
Concrete tiles- grey
020RCG 2
Corrugated ironwhite


Corrugated irongrey

Corrugated iron –light grey




Corrugated ironblack

Corrugated ironblue

Corrugated ironbeige

Corrugated ironred

Corrugated irongreen

8


9


10


11


14


0BLIRO
0BGIRO
0RDIRO
020GRG


*Will add ENVImet code in future*


Shade sail
Solar panels
0250TT
Thatch THACCH 16
Green roof
01NADS 17
Table 2: Buildings Wall Types


Table 3: Simple Vegetation Types


Shrub
Shrub
Table 4: Surface Types


Asphalt- black
Asphalt- red
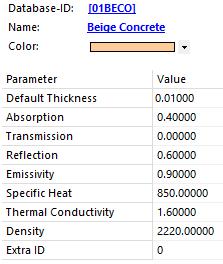
Concrete- grey
0200ZB
Brick paving- red
0200BR


Brick paving- beige 020BRB
Rubber Softfall
0200SY
Water (pools)
0200WW
Mulch
0200WD
Concrete - red
0200RD


Concrete – dark grey/black
0200DB 10
Wooden Deck
0200DW 11
Table 5: Trees built in project ENVI-met library
1. WA Pepp ermin t
AFWA4M WA Peppermi nt (very young)


AFWA7M WA Peppermi nt (young)


m > Trees
WA


2. Melal euca quinq uener via
WA Peppermi nt (old)


> Trees ≥ 15 m
WA Peppermi nt (very old) Trees > 25
MQ005M Melaleuca quinquene rvia (very young) (Narrower compared to Eucalyptus ) 7 m > Trees
MQ8.5M Melaleuca quinquene rvia (young)


AFWA16
AFWA22
MQ015M Melaleuca quinquene rvia (middle)

EUC05A Eucalyptus
(Very Young) Ample Canopy

EUC05M Eucalyptus (Very Young)


25 m >Trees ≥ 10 m
5 m ≥ Trees
3. Eucal yptus
EUC10A Eucalyptus (Young) Ample canopy


EUC10M Eucalyptus (Young)


10 m >Trees > 5 m
EUC15M Eucalyptus (Middle)

EUC15A Eucalyptus (Middle) Ample canopy

EUC20A Eucalyptus (Old) Ample canopy


25 m >Trees ≥ 10 m
30 m >Trees ≥ 25 m

EUC20M Eucalyptus (Old)


EUC30A Eucalyptus (Very Old) Ample canopy


EUC30M Eucalyptus (Very Old)


30 m >Trees ≥ 25 m

Trees ≥ 30 m
4.
Pyrus (very young 2 m height)


Pyrus (young 5 m height)


young)

(Young)

PYRUS2
PYRUS5
1. PYRU10
5. ACAC02 Acacias (Very
ACAC05 Acacias
8.
SHEO8M Sheoak (young) 8 m


6. CORAL5 Coral
7. FIGWID Ficus Rubiginos a (middle)
SHEO4M Sheoak (younger)
SHEOAK Sheoak (middle) 14 m


SHEO30 Sheoak (old) 30 m ≥ 20 m
SHEO37 Sheoak (Very old) 37 m


9. PINE05 Pine (Very young)
PINE10 Pine (young) 10 m
PINE20 Pine (middle) 20 m
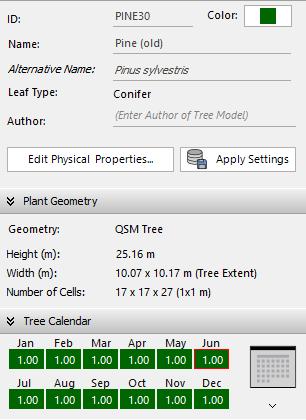


10.Plan e Tree Decidu ous


PINE30 Pine (old) 30 m
9. Grass Tree GRASTR Grass Tree
2.5 m
PLAN04 Plane Tree (Very young)
PLAN07 Plane Tree (young)


PLAN11 Plane Tree (Middle)
PLANET Plane Tree (Old)
11. PLDM16 Palm Tree
Ficus macro phylla (Moret on Bay Fig)
LTHYDE


a height of around 20 m and a width of about 35 m.


Appendix C: Broome field trip – Monitoring details
Instrumentation Process/ Summary
Context
The site visit to Broome (old Broome, North Broome) took place between January 19th and January 26th.
The Department of Community organized two case studies; one in North Broome (11A Nakamura Ave, Bilingurr WA 6725, Australia), and the other in old Broome (8/18 Barker St, Broome WA 6725, Australia).

The instrumentation plan is designed to be conducted for seven consecutive days. Three scenarios/ modes are set for the two case studies (Table 1):
1. All windows closed
2. All windows open
3. Air conditioning on
Table 1: Modes of the instrumentation plan
Mode Case study
All windows closed
All windows open
Air conditioning on
8/18 Barker St, Broome WA 6725, Australia
North Broome
Old Broome
Old Broome
Description
A three-bedroom detached house
Construction material: timber stud frame external and internal walls clad with asbestos sheeting material. The roof is framed with timber rafters, battens, and ceiling joints. The roof is clad with asbestos cement corrugated roof sheeting.


Figure 1: Old house: Map
Figure 2: Old house- floor plan

The instrumentation plan was run in this case study from the 20th to the 26th of January, and it was set for three scenarios as shown in (Table 2):
Figure 3: Old house - photos
Table 2: Measuring modes
Measuring mode Measuring time
All windows closed 20th to 22nd of January
All windows open 22nd to 24th of January
Air conditioning on 24th to 26th of January
The surface temperature is also measured in both spaces (living room and bedroom). The surface including walls, ceiling, and floor as demonstrated in figure 4:

Figure 4: Old house - Surface temperature- measuring circulation and surfaces
North Broome – New house
11A Nakamura Ave Bilingurr WA 6725, Australia
Description
A two-bedroom detached house.
Construction material: Steel stud frame external and internal walls clad with colorbond sheeting material with insulation break 70 & R2 batts and R1.5 bulk installation for internal wall. The roof is steel framed with colorbond cladding and weatheboard with R3 batts insulation for the ceiling. 750 mm roof eaves.


The instrumentation plan was run in this case study from the 19th to the 26th of January, and it was set for three scenarios as shown in Table 3:
Measuring mode
Measuring time
All windows closed 19th to 23rd of January
All windows open 23rd to 26th of January
Figure 5: New house - Map
Figure 6: New house- Floor plan
Table 3: New house - Measuring modes

The surface temperature is also measured in both spaces (living room and bedroom). The surface including walls, ceiling, and floor as demonstrated in Figure 8:

and surfaces
Figure 7: New house – photos
Figure 8: New house - Surface temperature- measuring circulation
Measurement tools
The sensors installed in the house are:
1. HOBO Temp/RH 2.5% Data Logger (UX100-011A)

HOBO temp/RH data logger records temperature and relative humidity (within 2.5% accuracy) in indoor environments with its integrated sensors. The logger can calculate minimum, maximum, average, and standard deviation statistics. The sensor was installed in the living room and bedroom in each house.
2. HOBO MX2300 Series Data Logger

This data logger records and transmits temperature and/or relative humidity (RH) in the outdoor environment. The Bluetooth Low Energy (BLE)-enabled logger is designed for wireless communication with the phone/ computer through HOBOconnect app. The logger can calculate, minimum, maximum, average, and standard deviation.
3. Infrared Thermometer- GM550E

This infrared thermometer was used for measuring the temperature of the surface’s temperature of the wall, ceiling, and floor of the living room and Bedroom of the old and new houses. This unit consists of optics, temperature sensor signal amplifier, processing circuit, and LCD Display. The optics collect the infrared energy emitted by the surface and focus it onto the sensor, then the sensor translates the energy into an electricity signal. This signal will be turned out to be digitally shown on the LCD after the signal amplifier and processing circuit.


Data plotting
1. Outdoor temperature and humidity
New house
Old house
2. Indoor air temperature and RH


New house Old house
New house Old house
3. Surface temperature


New house Old house
Appendix D: ENVI-met model inputs and outputs

Broome North
Aerial image:
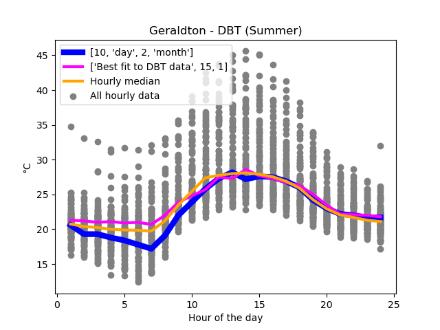
Selected day for simulation:

Modelling


Tree Canopy Coverage:


Model Surfaces
ENVI-met Output Maps:
Surface Temperature Distribution Map

(Thermal Comfort Index) Distribution Map

Potential Air Temperature Distribution Map

Wind Speed and Direction Distribution Map

Specific Humidity Distribution Map


Broome Central
Aerial image:
Selected day for simulation:

Modelling in ENVI-met Software:


Model Surfaces
ENVI-met Output Maps:
Surface Temperature Distribution Map
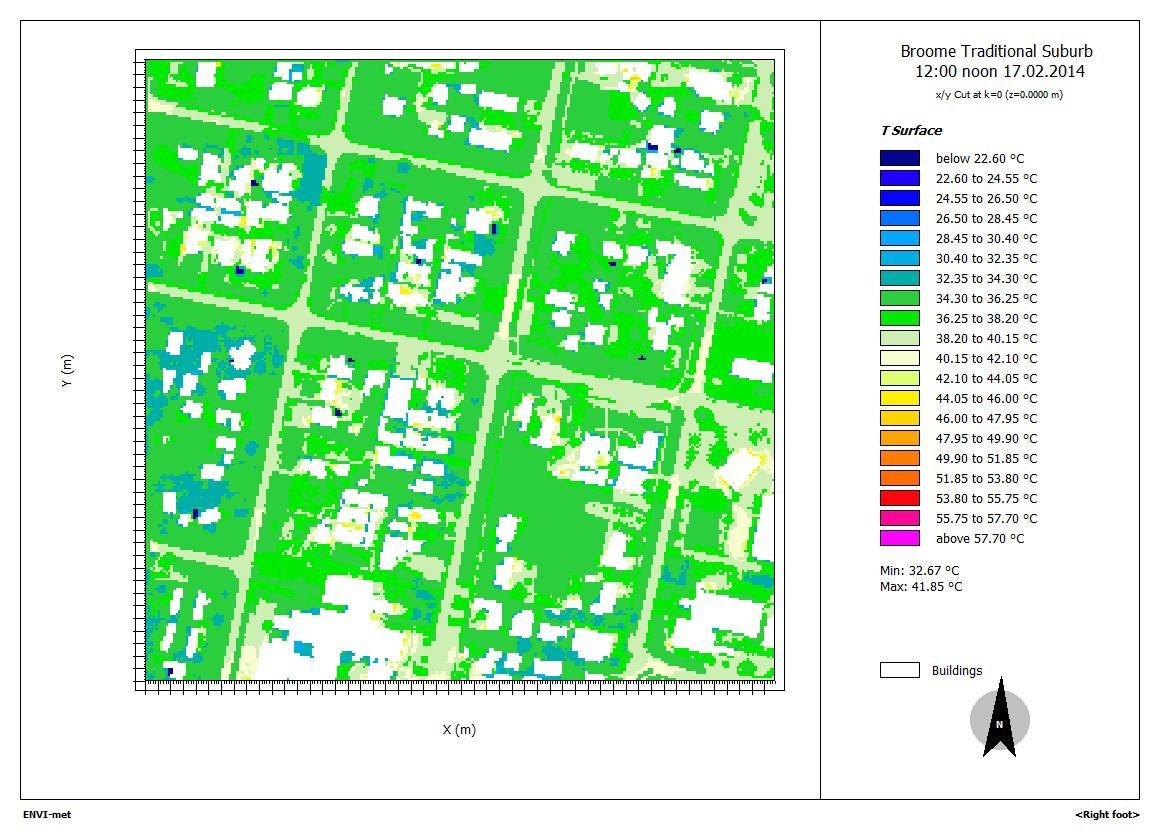
PET (Thermal Comfort Index) Distribution Map

Potential Air Temperature Distribution Map

Wind Speed and Direction Distribution Map

Specific Humidity Distribution Map


Bulgarra, Karratha
Aerial image:
Selected day for simulation:

Modelling in ENVI-met Software:


Model Surfaces
ENVI-met Output Maps:
Surface Temperature Distribution Map

PET (Thermal Comfort Index) Distribution Map

Potential Air Temperature Distribution Map

Wind Speed and Direction Distribution Map

Specific Humidity Distribution Map


Karratha Town Centre
Aerial image:
Selected day for simulation:

Modelling in ENVI-met Software:


Model Surfaces
ENVI-met Output Maps:
Surface Temperature Distribution Map

PET (Thermal Comfort Index) Distribution Map


Potential Air Temperature Distribution Map

Wind Speed and Direction Distribution Map

Specific Humidity Distribution Map

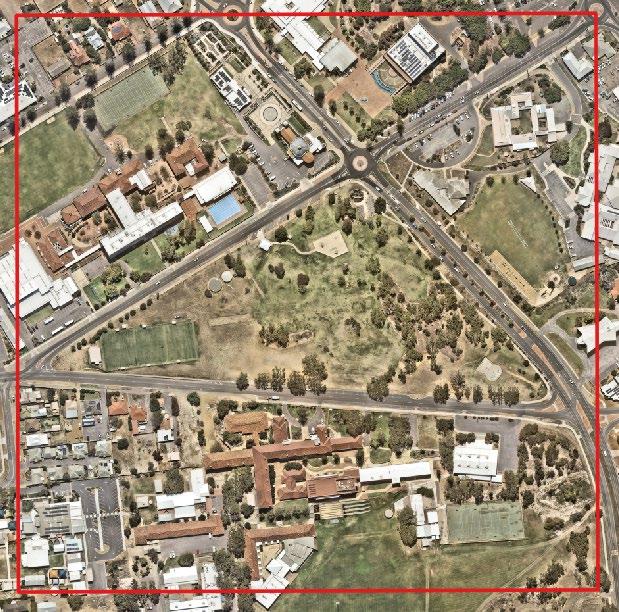
Maitland Park Geraldton
Aerial image:
Selected day for simulation:

Modelling in ENVI-met Software:


Model Surfaces
ENVI-met Output Maps:
Surface Temperature Distribution Map

PET (Thermal Comfort Index) Distribution Map

Potential Air Temperature Distribution Map

Wind Speed and Direction Distribution Map

Specific Humidity Distribution Map

Toodyay

Aerial image:
Selected day for simulation:

Modelling in ENVI-met Software:


Tree Canopy Coverage:

Model Surfaces

ENVI-met Output Maps:
Surface Temperature Distribution Map

PET (Thermal Comfort Index) Distribution Map

Potential Air Temperature Distribution Map

Wind Speed and Direction Distribution Map

Specific Humidity Distribution Map


Jindalee
Aerial image:
Selected day for simulation:

Modelling in ENVI-met Software:


Tree Canopy Coverage:


Model Surfaces
ENVI-met Output Maps:
Surface Temperature Distribution Map

PET (Thermal Comfort Index) Distribution Map


Potential Air Temperature Distribution Map

Wind Speed and Direction Distribution Map

Specific Humidity Distribution Map


Nollamara
Aerial image:
Selected day for simulation:

Modelling in ENVI-met Software:


Model Surfaces
ENVI-met Output Maps:
Surface Temperature Distribution Map
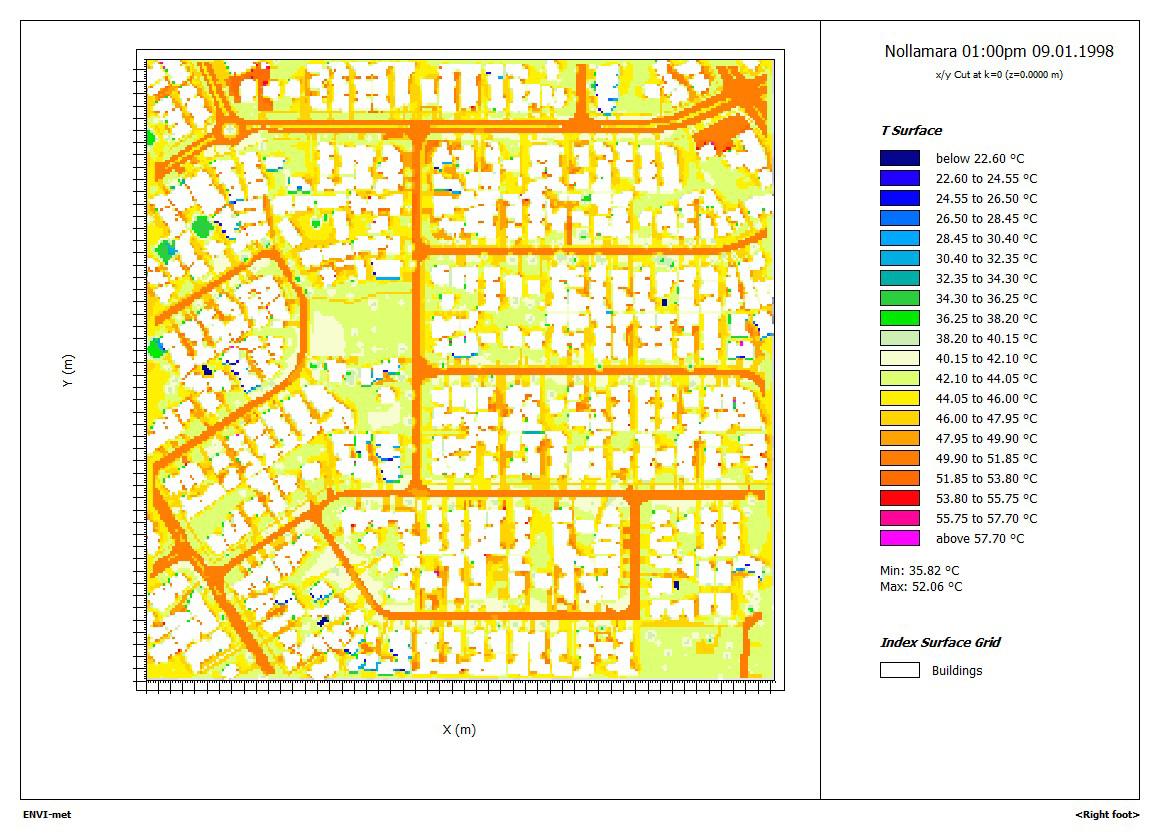
PET (Thermal Comfort Index) Distribution Map

Potential Air Temperature Distribution Map

Wind Speed and Direction Distribution Map

Specific Humidity Distribution Map


Leederville Town Centre
Aerial image:
Selected day for simulation:

Modelling in ENVI-met Software:


Model Surfaces
ENVI-met Output Maps:
Surface Temperature Distribution Map

PET (Thermal Comfort Index) Distribution Map

Potential Air Temperature Distribution Map

Wind Speed and Direction Distribution Map

Specific Humidity Distribution Map


Karawara
Aerial image:
Selected day for simulation:

Modelling in ENVI-met Software:


Tree Canopy Coverage:
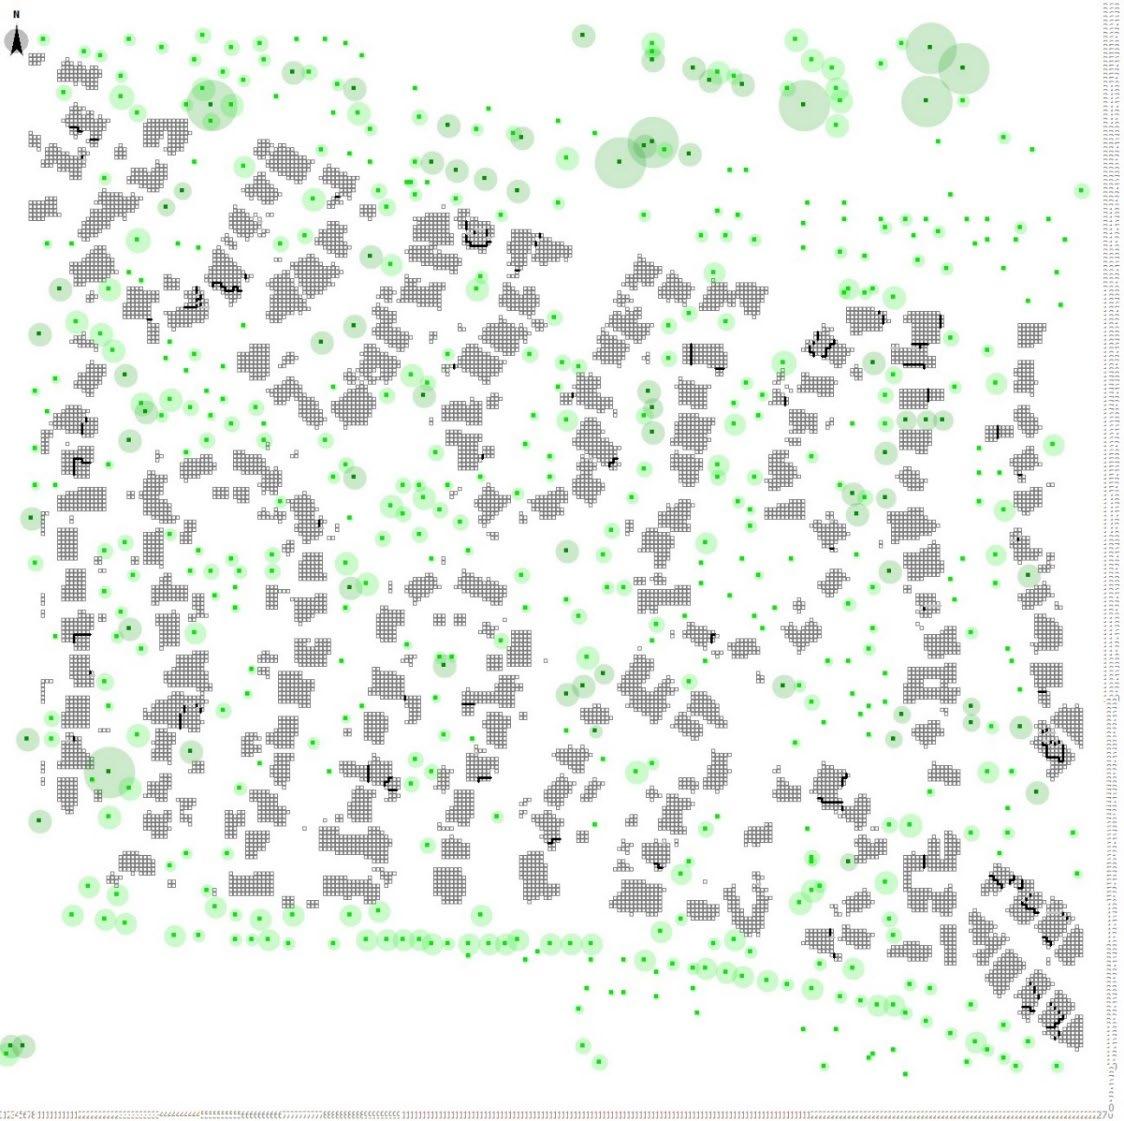

Model Surfaces
ENVI-met Output Maps:
Surface Temperature Distribution Map

PET (Thermal Comfort Index) Distribution Map

Potential Air Temperature Distribution Map

Wind Speed and Direction Distribution Map

Specific Humidity Distribution Map


Cockburn Central
Aerial image:
Selected day for simulation:


ENVI-met Output Maps:
Surface Temperature Distribution Map

(Thermal Comfort Index) Distribution Map


Wind Speed and Direction Distribution Map

Humidity Distribution Map

Lane Shoreline

Aerial image:
Selected day for simulation:


ENVI-met Output Maps:
Surface Temperature Distribution Map

(Thermal Comfort Index) Distribution Map


Wind Speed and Direction Distribution Map

Humidity Distribution Map

Appendix E: Average day analysis


