

Future Climate Future Home
Evidence-based adaptive urban design strategies for Western Australia
Partner organisation engagement
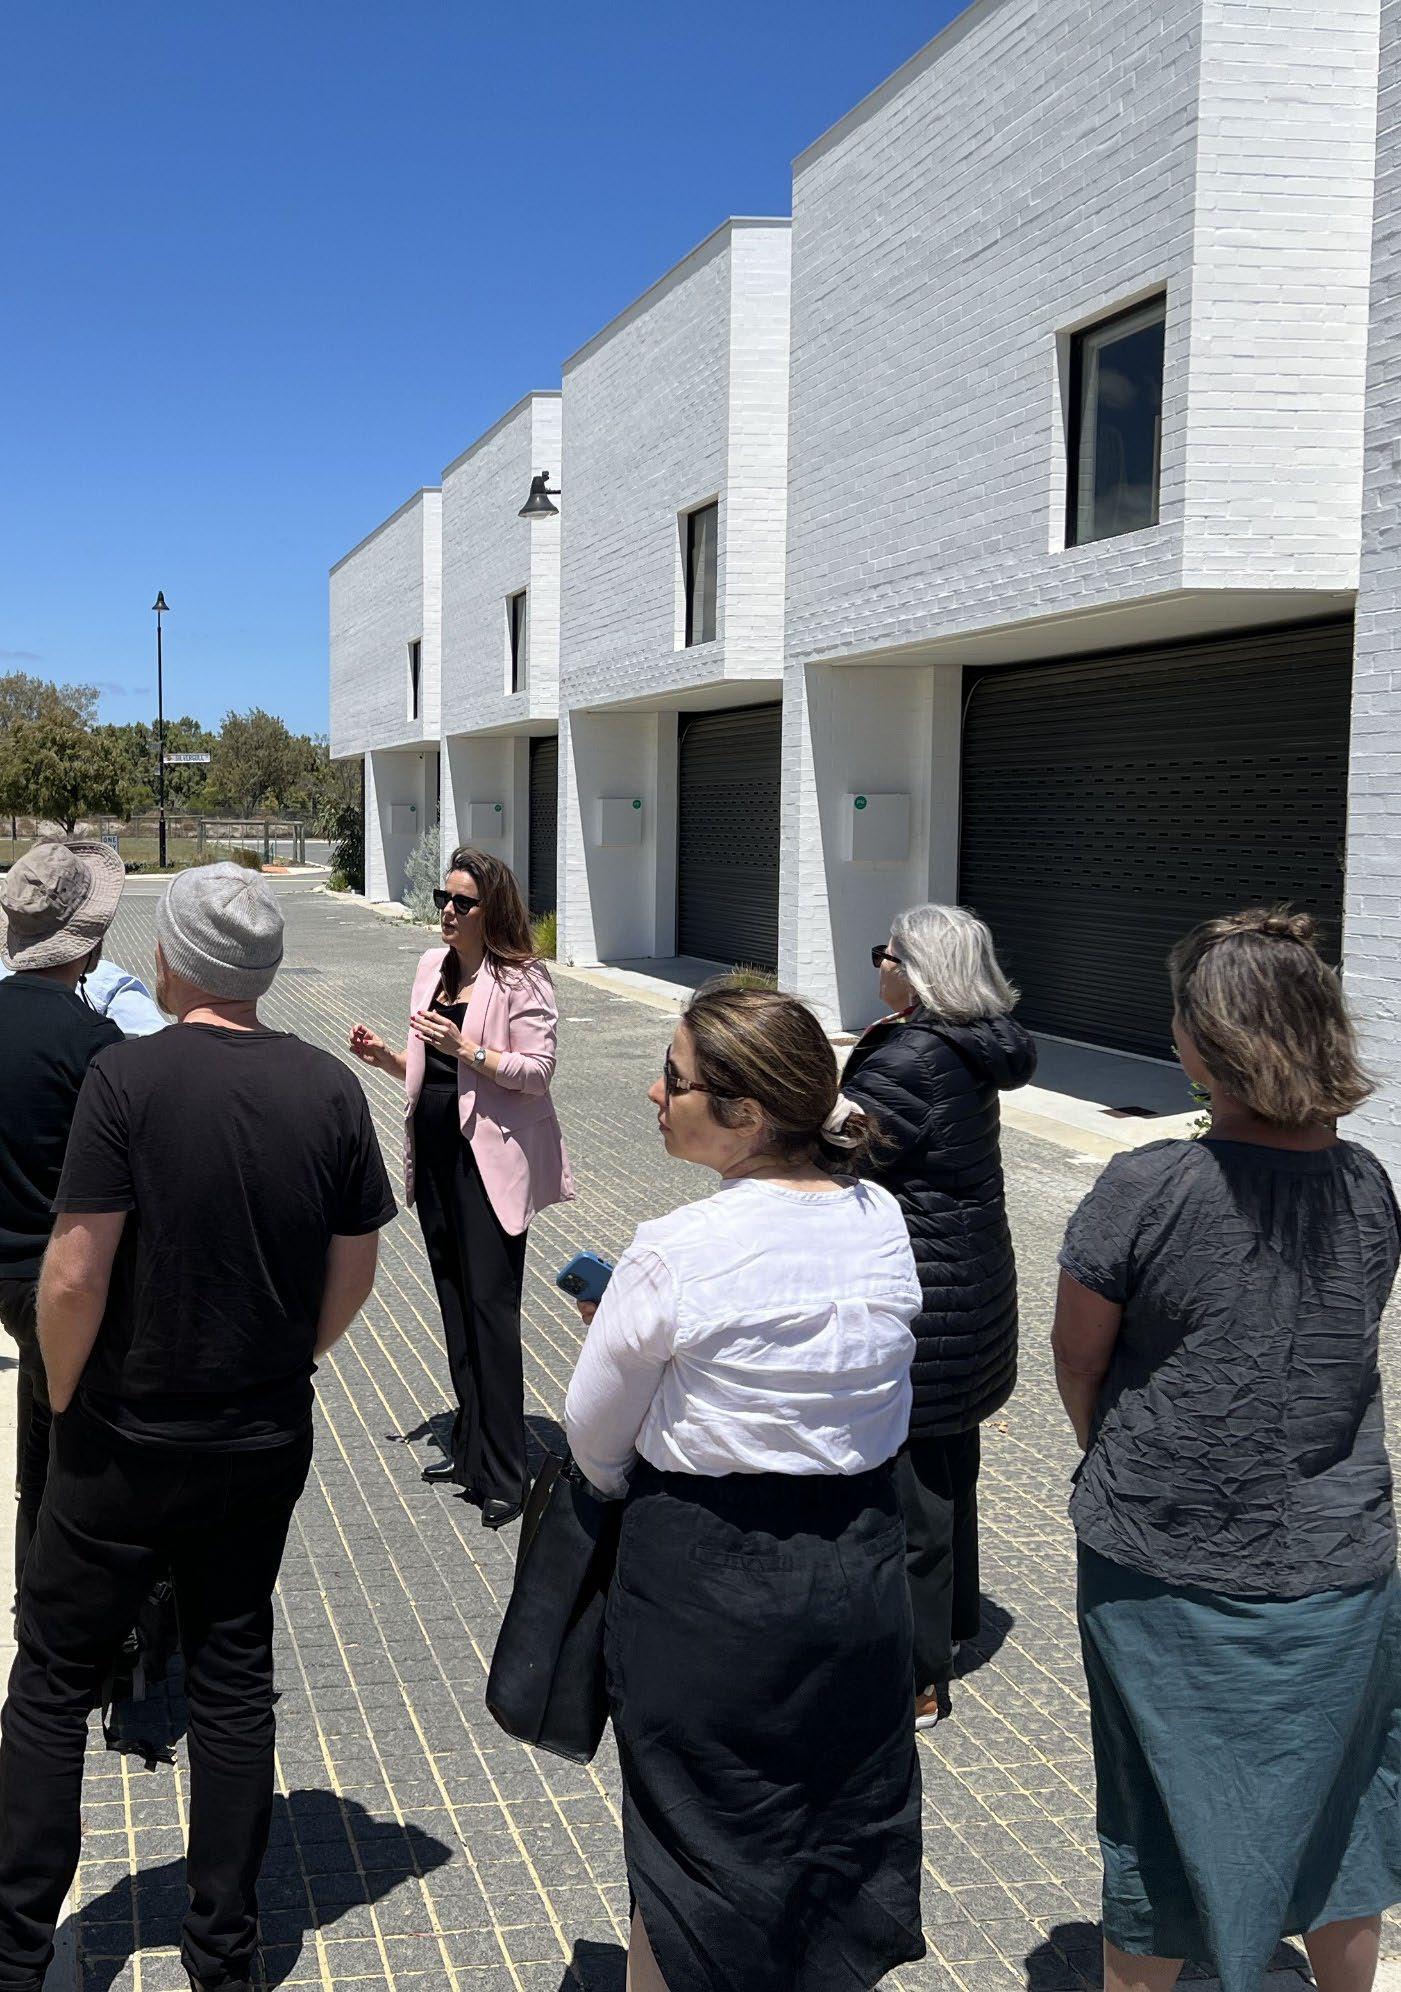


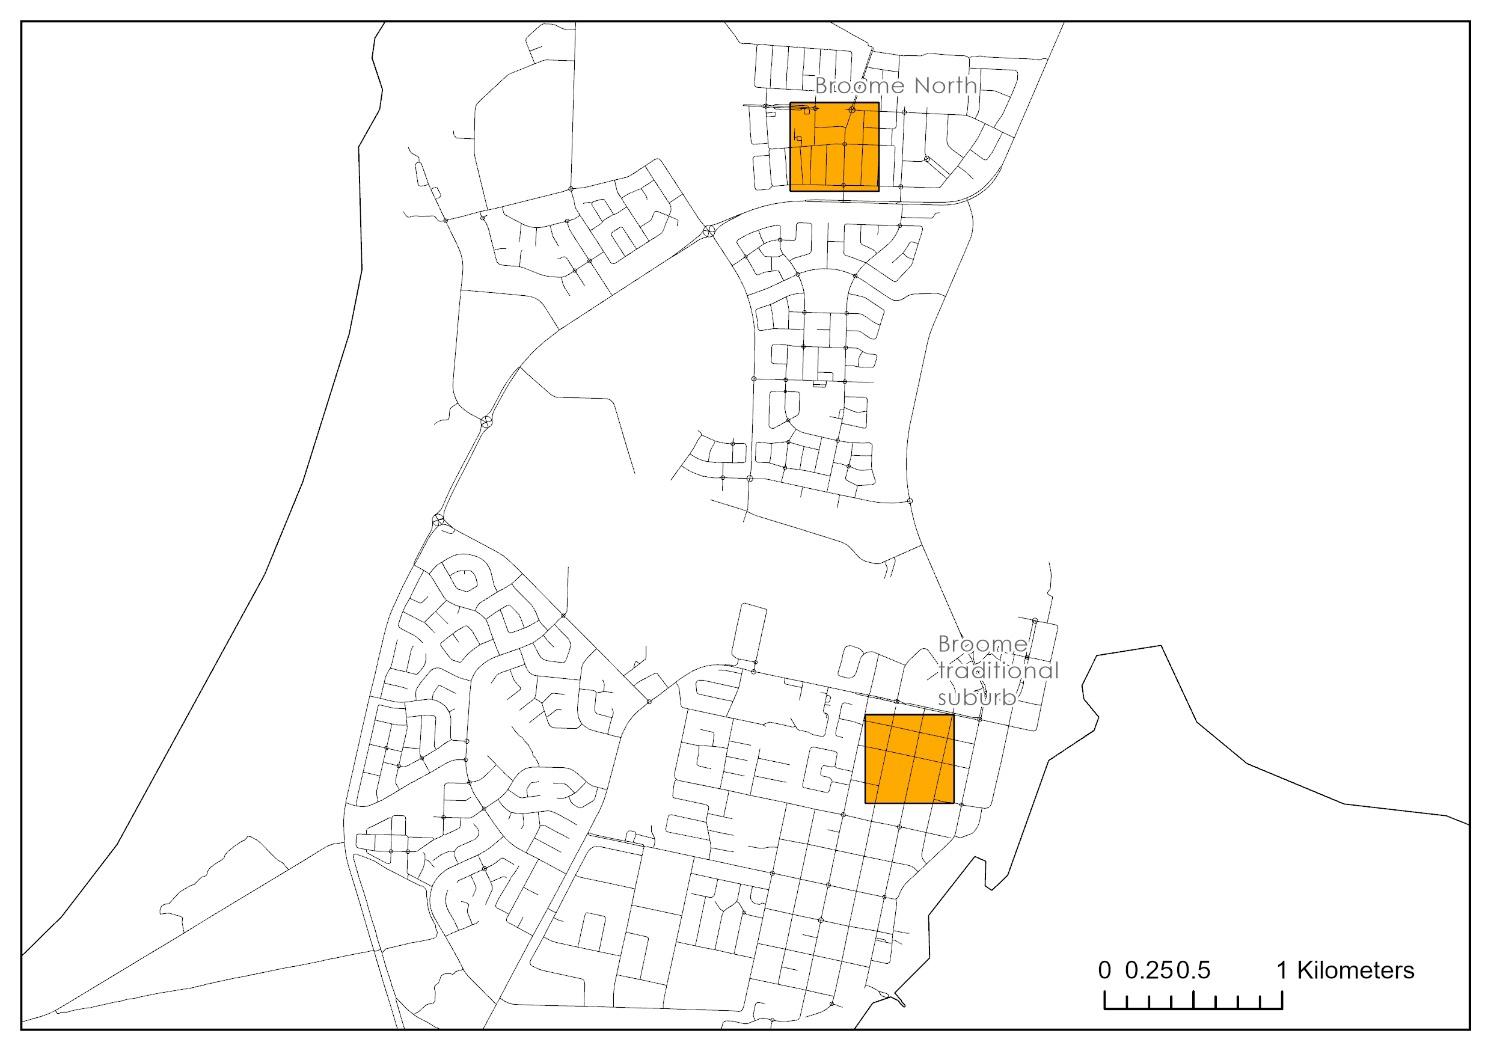
Figure 1: Broome case studies. .....................................................................................................................
Figure 2: Public housing without air conditioning has negative social impacts for the Aboriginal population in Broome. ....................................................................................................................................
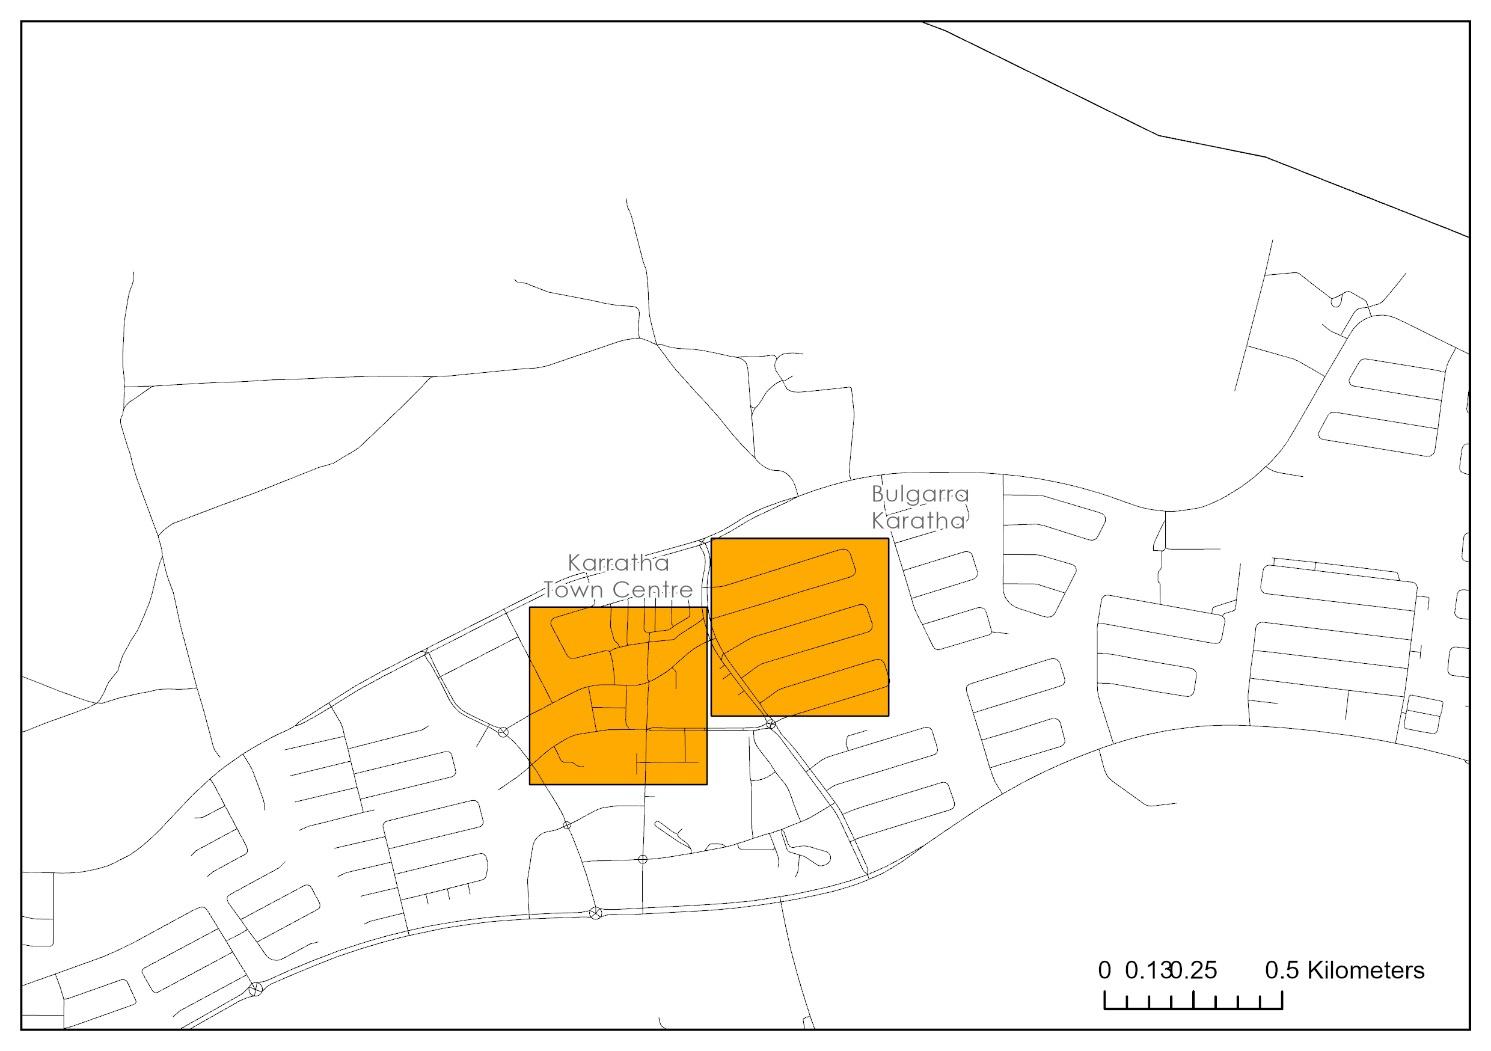
Figure 3: Karratha case studies
Figure 4: The Council is considering planting a combination of native and exotic trees to meet the shade canopy needs, while being cyclone and heat resilient.
Figure
Figure 8: Development in Toodyay mostly large-sized ‘bush blocks’ where people seek to develop land for various purposes, such as gardening, hobby farms, and livestock.
Figure 9: Perth metropolitan case studies
Figure 10: Mass land clearing for development into ‘Ikea’ suburbs
Figure 12: Sidewalks in Leederville town centre with trees and services competing for verge space
Acknowledgement
This research is supported by the Western Australian Planning Commission (WAPC), the Department of Planning Lands and Heritage (DPLH), Development WA, the Department of Housing and Works (DHW) and the Water Corporation. The research is also supported by WA Local Governments - the City of Karratha, the City of Greater Geraldton, the Shire of Toodyay, the City of Wanneroo, the City of Cockburn, the City of Vincent, and the City of Perth.
1. Executive summary
The latest IPCC change report contains dire projections for climate change impacts across Australia. However, the implications of changing temperatures and rainfall on urban precincts, public open spaces and housing in WA remain poorly understood. Local governments play a pivotal role in adaptation, as they are directly responsible for planning and implementing strategies that address local climate risks and community needs. Hence, there is a need for evidence-based strategies to underpin adaptation measures and Climate-Sensitive Urban Design.
Accordingly, the Future Climate Future Home project aims to:
Generate evidence to inform solutions and policy decisions concerning the climate change adaptation of urban precincts and housing to projected temperature and rainfall changes and foster healthy and climate-resilient communities across WA’s climate regions.
Phase 1 of the study was completed in 2025, and results were published in four reports:
• Future Climate, Future Home: Housing climate performance report
• Future Climate, Future Home: Precinct climate performance report
• Future Climate, Future Home: Water Corporation precinct climate performance report
• Future Climate, Future Home: Partner organisation engagement report
This Partner Organisation Engagement Report provides a summary of interviews conducted with project partners during Phase 1 of the Future Climate, Future Home project. The purpose of the interviews was to gain local knowledge of the study precincts and surrounding local government areas, to better understand the implications of the climate performance data and provide insights into effective adaptation design Additionally, we explore how current local government policies or procedures are informing decision-making, policy development, adaptation planning and management.
Current approaches to adaptation and progress vary among local governments due to capacity and the complexity of local climate risks. Climate-related threats to environments, such as heat stress and water shortages, are exacerbated by resource constraints, insufficient policy implementation and/or a lack of adaptation strategies, resulting in difficulties integrating adaptation into planning and decision making. Key challenges include competition for verge space, hindering tree planting efforts to mitigate urban heat island effects, coastal erosion, increased fire risk, water scarcity, and development and design issues.
Local Governments require useful climate science to help make informed decisions about balancing competing needs. Notably, many local governments lack the resources, training, or staffing to address the complexity of climate change adaptation. There are also opportunities for greater collaboration between governments to enhance climate resilience.
Findings from this report provide insights that will assist the development of adaptation strategies as part of the Future Climate, Future Home project. Additionally, the findings highlight the importance of improved understanding of long-term climate impacts, sustainable housing and development, localised adaptation strategies, opportunities for collaboration across local governments, and the need for stronger support systems to strengthen adaptation efforts.
2. Introduction
2.1 Context
Despite our comparative inaction in mitigating climate change, Australia has much to lose from a changing climate. The IPCC warns that ‘the region faces an extremely challenging future that will be highly disruptive for many human and natural systems’ (IPCC, 2022) The damage is already evident, with extreme events from droughts, heatwaves, bushfires and floods becoming more frequent and catastrophic. Climate impacts are ‘cascading and compounding across sectors and socioeconomic, and natural systems’(IPCC, 2022) and critical climate risks to Australian cities include challenges to publicly and privately-owned assets and infrastructure systems from gradual impacts like temperature rise and extreme events like floods, heatwaves and bushfires; more significant risk of human injury, disease and death, and interrupted labour force productivity, due to heat stress. Climate change will also damage ecosystems that support social well-being, provide services fundamental to our health, and offer protection from natural disasters (Australian Government, 2015) .
Climate adaptation at a local level is required as challenges are local and complex (Australian Government, 2025) Local governments play a pivotal role in climate change adaptation, as they are directly responsible for planning and implementing strategies that address local climate risks and community needs In Western Australia, unprecedented climate impacts have forced local governments to manage challenges for groundwater availability, adapt environments to relieve heat stress and urban heat island, and provide greater tree canopy (Department of Water and Environmental Regulation, 2022)
These climate-related issues also impact population health. According to a 2024 report investigating the intensifying heat-related health impacts of extreme heat exposure in Perth, heat-related deaths are expected to increase by 61.4% by the 2050s from the 2010s (Sharma et al., 2024) Heat-sensitive hospital admissions and Emergency Department (ED) presentations are projected to increase by 33.8% and 29,8% in 2050 This is projected to increase heat-related healthcare costs by $30.6 million (Sharma et al., 2024)
2.1.1 Climate projections for WA
The projections of future climate change for WA include 1) In southern regions (e.g., Perth), annual temp increases between 2.7 and 4.2°C, annual rainfall decreases between -26 and 4%, and an increase in evapotranspiration between 8 and17%; 2) In northern regions (e.g., Broome), annual temp increases between 2.7 and 4.9°C, annual rainfall changes between -26 and 23%, and an increase in evapotranspiration between 8 and17%; 3) In the Rangelands region (e.g. Karratha), annual temp increase between 2.7 and 5.3°C, annual rainfall change between -32 and 18%, and an increase in evapotranspiration between 6 and16% (Australian Academy of Science, 2021) There is reason to believe those responsible for urban environments should take the worst-case projections seriously. Indeed, the total emission reductions currently pledged through the Paris Agreement, even if implemented on time, will translate to average global surface temperatures of 3°C or more above the pre-industrial period by 2100 (Australian Academy of Science, 2021; IPCC, 2022) Such a rise will have dire implications for Australia.
2.1.2 Urban adaptation to extreme heat
Compounding extreme temperature and water shortages in urban areas is the Urban Heat Island. The excess heat load in urban settings can reach 10°C compared to their peri-urban surroundings (Sharifi et al., 2016). Researchers have linked heat stress associated with elevated temperatures to higher rates of human mortality and illness, particularly amongst vulnerable demographics such as the elderly, lower socio-economic classes, and residents in high-density, older housing stock with limited surrounding vegetation (Coutts et al., 2010) Urban planners and designers can do much to improve urban climates. For instance, designs can utilise passive cooling via shade and air movement, reduce the ability of a material to absorb and store heat energy and produce buildings with improved insulation/cooling (Browne et al., 2015; IPCC, 2022). Moreover, incorporating irrigated green infrastructure such as street trees can significantly reduce urban temperatures, as will green roof plantings that reduce glare, create shadows, and have a substantial cooling effect (IPCC, 2022). Nonetheless, challenges remain. Cooling strategies incorporating plants can also have a substantial water requirement, and many towns and cities across southern WA face increasing water scarcity (Australian Academy of Science, 2021) Moreover, such strategies can take time to be effective (Australian Academy of Science, 2021). Adaptive responses that hinge on higher-density living can exacerbate urban heat island effects and have often proven to be divisive (Sarkissian, 2013) Accordingly, planners should not compartmentalise an adaptive strategy into a single effort with a single purpose. Rather, planners should consider what adaptation measures will strengthen residents' mental and emotional health and shield others from the adverse effects of climate change (Henrique & Tschakert, 2022) Adaptation measures need to be applied in both new and existing areas, leading to questions about how and how planners and designers can successfully retrofit existing urban areas. Finally, Government and private industry need to fund any models for climate change adaptation, and it is unclear whether many Local Governments will have the necessary resources to fund adaptation.
2.1.3 Current policies for adaptation
Current global and Australian policies to mitigate climate change are inadequate. The IPCC affirm that climate change adaptation is now ‘essential and urgent’(IPCC, 2022). Given Australia's risks, developing specific and practical adaptation strategies to climate change is crucial. Planned adaptation involves deliberate and proactive planning, taking account of likely environmental changes and developing pre-emptive actions (Cooper & Lemckert, 2012). The Australian Government reinforces the need for such adaptation: ‘Planning policies to deliver resilience need to be robust across various climate change outcomes and responsive to new information’(Australian Government, 2015)
Nonetheless, adaptation progress is uneven due to gaps, barriers and limits to adaptation, and adaptive capacity deficits. Progress in adaptation planning, implementation, monitoring, and evaluation is lagging. Efforts to build, resource and deploy adaptive capacity are slow compared to escalating impacts and risks Barriers to effective adaptation include governance inertia at all levels, hindering the development of careful and comprehensive adaptation plans and their implementation (IPCC, 2022) Adaptation barriers in the urban development industry include perceived expense, lack of client demand and awareness of climate change risks, and limited and inconsistent climate risk regulation in the construction industry (IPCC, 2022) Indeed, Australia needs a governance shift from incremental and reactive to anticipatory decision-making (IPCC, 2022), with
more community-based and transformative adaptation. Australia’s reactive ‘adaptation’ is insufficient, too late, too little, and too costly.
Delays in implementing adaptation and emission reductions will impede climate-resilient development, resulting in more costly climate impacts and a grander scale of future adjustments (IPCC, 2022) Indeed, the worst of the projected climate change scenarios leave many of Australia’s human and natural systems at ‘very high risk and beyond adaptation limits’ (IPCC, 2022). Moreover, with higher levels of warming, adaptation costs increase, losses and damages grow, and governance and institutional responses have reduced adaptive capacity. Ultimately, climate hazards could overwhelm the capacity of organisations, systems, and leaders to provide necessary policies, services, resources, coordination and leadership. This situation worsens vulnerability and leads to maladaptation, inequities and injustices within and across generations (IPCC, 2022)
Moreover, the 'built environment' is a heavy, fixed thing that is slow and expensive to change (Gleeson, 2006) The adaptation task is ‘vast, almost unquantifiable, but the quicker we confront it, the better we are going to be able to manage’(O'Neil & Watts, 2015). Research on urban adaptation to climate change is imperative to inform and support the development and implementation of adaptation policies at all levels of governance. Research should build a solid and comprehensive knowledge base to identify appropriate options and develop medium to long-term strategies for adaptation (Leal-Arcas, 2012). This long-term view is critical as ‘adaptation will be an ongoing process of responding to change with no “end” point’(Hurlimann et al., 2014)
The Australian Government's ambition, scope and progress on adaptation have risen but are uneven, focusing on high-level strategies at the national level, adaptation planning at sub-national levels and new enabling legislation (IPCC, 2022). Indeed, national progress in the field is lagging, significant gaps remain, especially in practical implementation, monitoring and evaluation, and current adaptation is mainly incremental and reactive (IPCC, 2022). The previous Australian Government’s ‘National Climate Resilience and Adaptation Strategy’ acknowledges that climate change ‘poses significant risks to our economies, communities and the natural environment.’ Nonetheless, this strategy tends to demote responsibility for adaptation to state, territory and local governments who ‘share a greater responsibility for responding directly to climate change and natural disasters that affect built assets’ (Australian Government, 2015)
2.1.4 WA climate policy
Australian states and territories have climate change adaptation strategies for implementation (IPCC, 2022). The WA Government responded to climate change in the long-awaited WA Climate Policy released in mid-2023 following consultation with various stakeholders (Department of Water and Environmental Regulation, 2023). The strategy includes initiatives as follows:
Direction 1:
• Produce and communicate credible climate information and resources
• Understand how our climate may change
• Communicate science and adaptation knowledge to improve how we respond
• Strengthen adaptation research to drive innovation
Direction 2:
• Build public sector climate capability and strengthen accountability
• Set the right policies to enhance decision-making and encourage action
• Drive transformation through State Government leadership
• Develop appropriate metrics to measure progress
Direction 3:
• Enhance sector-wide and community partnerships to unite and coordinate action
• Support local communities to create their own adaptation pathways
• Develop and deliver adaptation action plans together
Direction 4: Empower and support the climate resilience of Aboriginal people
• Enhance the adaptive capacity of communities and create opportunities for Aboriginal people
• Empower Aboriginal-led climate adaptation action (Department of Water and Environmental Regulation, 2023).
The Department of Water and Environmental Regulation is undertaking two projects that are relevant to this work:
• Expanding the Climate Science Initiative to produce detailed climate projections for Western Australia
• Modelling the urban heat island effect of Perth’s future climate to provide better data for local adaptation planning (Department of Water and Environmental Regulation, 2023)
The strategy requires the development of Sector Adaptation Plans to identify sectors' specific climate impacts and priority adaptation actions.
• Health and human services
• Emergency management
• Primary industries
• Small-to-medium enterprises
• Natural environment
• Built environment
• Water
While the WA Climate Policy outlines how to develop, support, map, and identify focus areas, it lacks specific details on how WA will adapt to inevitable climate change and outline the necessary governance to ensure delivery. For example, the policy fails to explain how place-based adaptation should occur in urban areas and how to address structural inequalities and vulnerabilities. Moreover, such climate change policy has sometimes been poorly communicated to local communities (Henrique & Tschakert, 2022). Local Governments are the vehicle through which practical adaptation policy and planning occur at the community level (Bowering, 2014). In 2024, public health plans were made mandatory for all local government areas (Department of Health, 2019) These plans are underpinned by frameworks, such as the Health Impact Assessment framework, that aid in the identification of climate-related health risks. Nonetheless, some local governments are stalling to take action on climate change based on claims of inadequate information or the importance of other
interests (Bowering, 2014) Notably, many local governments lack the resources, training, or staffing to address the complexity of climate change adaptation (Whiley, 2023; Walter, 2024).
Despite the emerging policies, Australia is still ‘flying almost blind’ regarding adaptation (Flannery, 2020), and many planning decisions proceed on a business-as-usual basis (Flannery, 2016). At the urban development scale, urban planners and designers must prepare urban communities for a future climate. Unfortunately, most actors involved in the urban planning and design process are busy sorting through the immediate issues they face, and planning for a long-term climate change can be ‘too hard; thus, we go on with business as usual’(Seamer, 2019).
2.2 Research aim and objectives
Through a rare collaboration between experts in urban, landscape and architectural design, public health, climate science, engineering and climate, energy and water modelling, the Future Climate, Future Home project aims to:
Generate evidence to inform solutions and policy decisions concerning the climate change adaptation of urban precincts and housing to projected temperature and rainfall changes and foster healthy and climate-resilient communities across WA’s climate regions.
The Phase 1 objective of Future Climate, Future Home to ‘benchmark the performance of selected urban precinct and housing case studies across WA’s climate regions concerning urban heat island effects, thermal comfort of the outdoor environments, thermal performance of housing, and irrigation demands for public and private open spaces’ was met through four areas of research and published into four reports:
1. Future Climate, Future Home: Housing climate performance report
2. Future Climate, Future Home: Precinct climate performance report
3. Future Climate, Future Home: Water Corporation precinct climate performance report
4. Future Climate, Future Home: Partner organisation engagement report
This ‘Future Climate, Future Home: Partner organisation engagement report’ aimed to summarise local knowledge of our industry partners, enabling our research team to better understand the local implications of climate performance data and provide insights into adaptation strategies and future research directions
2.3 Future Climate, Future Home project governance
The Future Climate, Future Home project capitalises upon a long-term successful research collaboration with four partner organisations: The Western Australian Planning Commission (WAPC), the Department of Planning Lands and Heritage (DPLH), Development WA, and the Department of Housing and Works (DHW). The project also forges new collaborations with the Water Corporation, CSIRO and WA Local Governments - the City of Karratha, the City of Greater Geraldton, the Shire of Toodyay, the City of Wanneroo, the City of Cockburn, the City of Vincent, and the City of Perth. Project coordination and reporting occur through biannual Partner Organisation meetings. Project updates will also be provided to AUDRC’s Advisory board, which comprises Emma Cole – Chair of the WAPC;
Anthony Kannis– Chair of DPLH; Dean Mudford – CEO of Development WA; and Leon McIvor –Director-General of the DHW and the Urban Design Research and Education Committee, which includes officer-level staff from the State Government Partner Organisations.
3. Methods
This report summarises qualitative data obtained through semi-structured interviews with representatives of local governments participating in the Future Climate, Future Home project. The City of Perth is not featured in this report as the local government joined the project post data collection. Additionally, demographic data, obtained through secondary data sources, are reported
3.1 Case study local governments
Participating local governments were geographically spread throughout Western Australia’s broadscale climate and natural resource management (NRM) regions, the ‘Monsoonal North’, ‘Rangelands’, and the South-Western Flatlands (Table 1) These regions are diverse in their history, population, resource base, geography, and climate, resulting in each area having a unique set of priorities for climate adaptation (Climate Change in Australia, 2017)
Table 1: Case study Local Governments
LGA Natural Resource Management region
Shire of Broome Monsoonal north
City of Karratha Rangelands
City of Greater Geraldton
Shire of Toodyay
City of Wanneroo
City of Vincent
City of Cockburn
Southern and southwestern flatlands
Southern and southwestern flatlands
Southern and southwestern flatlands
Southern and southwestern flatlands
Southern and southwestern flatlands
The metropolitan local governments (i.e., City of Wanneroo, City of Cockburn and City of Vincent) interviewed were chosen to represent:
• Established urban areas
• Contemporary best practice precincts developed or earmarked for development
• Areas of varying area-level socio-economic disadvantage, and
• Varying urban and open space morphologies
3.1.1 Natural Resource Management Region
Resource Management Regions (NRMs)are geographically defined areas designated for sustainably managing and conserving the state's natural resources (Australian Bureau of Statistics, 2016) The Southern and South Western Flatlands Natural Resource Management Region (NRM) is characterised by a Mediterranean-type climate, with warm, dry summers and cooler, wetter winters (Climate
change in Australia, 2017) The Rangelands cluster region covers much of the Australian interior. Rainfall systems vary from seasonally reliable monsoonal influences in the north to very low and variable rainfall patterns in much of the centre and south (Climate Change in Australia, 2017). The Monsoonal North NRM extends across the entire Australian continent from the Burdekin River in Queensland to the Fitzroy Basin in WA and comprises most of Australia’s dry tropical savanna (Climate Change in Australia, 2017).
3.1.2 Socio-economic disadvantage
Demographic data for local government areas and socio-economic status were sourced from the Australian Bureau of Statistics (Australian Bureau of Statistics 2022). A measure of socio-economic disadvantage for each study precinct was sourced from the Australian Bureau of Statistics. The SocioEconomic Indexes for Areas (SEIFA) Index for relative Socio-Economic Disadvantage decile (IRSD), created from the 2021 census data, was used to measure local area economic status (Australian Bureau of Statistics 2021) The index summarises a range of information about the economic and social conditions of the people and households within an area along a continuum, thus capturing indicators of disadvantage (e.g., low income and low occupational skills). Low index scores (decile) indicate relatively greater disadvantage in general, whereas higher scores indicate less disadvantage. The index decile was assessed based on the local government area of the study precinct and ranking within Western Australia
3.2 Semi-structured interviews
Semi-structured interviews were conducted with representatives of participating local governments (n=7). Interviewees were current employees of local governments working in disciplines such as sustainability, environmental planning, environmental management, strategic planning, development, and regulation. Interviews were conducted in June and July 2024 and aimed to examine current climate-related issues impacting respective local government populations. There was a focus on heat stress during summer conditions and water shortages. Topics covered included barriers to adaptation, level of engagement with the community, policies and planning strategies and resource allocation.
The following research questions underpinned the Interviews:
• What are the perceived vulnerabilities (currently) in terms of extreme heat and water shortages for urban development in your jurisdiction (LGA)?
• What do you see as the future vulnerabilities?
• What current policies (if any) do you have in place to mitigate threats of extreme heat conditions and water shortages?
• What do you see as the biggest impediments that your LGA (or organisation) faces in being able to deliver adaptation strategies to deal with those threats?
• How do you anticipate our project results might help your organisation deal with the challenges you are facing?
• Has there been any engagement with the community regarding any of these challenges?
Ethics approval for the interviews was obtained from UWA Human Ethics 2024/ET000384.
4. Results
Table 2 details the geographical, management, environmental features, planning, socio-economic status, and relevant design policies for case study areas within participating local governments
Table 2: Geographical, environmental and demographic characteristics of LGA case studies
LGA State Gov partner IRSD decile Relevant policy
Shire of Broome DevWA DHW 3 SPP 7.0; SPP 7.3; Shire of Broome Local Planning Strategy; Broome North Waranyjarri Estate Design Guidelines; The Broome North Structure Plan; The Kimberley Vernacular Handbook
City of Karratha DevWA DHW 9 The City of Karratha Local Planning Strategy; SPP 7.0; SPP 7.2; The Pilbara Vernacular Handbook; SPP 7.3
City of Greater Geraldton 4 Maitland Park Concept Masterplan Report City of Geraldton Local Planning Strategy; SPP 7.2; SPP 7.3, Public Parkland Planning & Design Guide; SPP 7.0
Shire of Toodyay DPLH/ WAPC 5 Shire of Toodyay Local Planning Strategy; SPP 7.3; SPP 7.0; Liveable Neighbourhoods
City of Wanneroo DPLH/ WAPC 7 Liveable Neighbourhoods Policy; SPP 7.0 R-Codes Volume 1 for single houses and group dwellings below R60
City of Vincent DPLH/ WAPC 10 SPP Policy 4.2 Activity centres SPP 7.2; SPP 7.0
City of Cockburn DHW, DevWA 9 SPP 4.2; SPP 7.2; SPP 7.3- RDC Vol 2 – Apartments; SPP 7.0; Design guidelines for Cockburn Central West; Cockburn Coast Design Guidelines for Robb Jetty and Emplacement
SPP = State Planning Policy; R-Codes = Residential Design Codes; SPP 4.2 =Activity centres; SPP 7.0 = Design of the Built Environment; SPP 7.2 = Precinct Design; SPP 7.3 = Residential Design Codes
4.1 Regional case studies
4.1.1 Shire of Broome
Climate zone
The Broome case studies (Figure 1) are sited within the National Construction Code designated climate zone 1: High humidity summer, warm winter (Australian Building Codes Board, 2024).
Under the Köppen climate classification, Broome has a hot semi-arid climate (BSh), like most parts of the Australian tropics. It has two seasons: a dry season and a wet season (Sturman & Tapper, 1996). The dry season is from April to November, with nearly every day clear and maximum temperatures around 30 °C. The wet season extends from December to March, with maximum temperatures of around 35 °C, with somewhat erratic tropical downpours and high humidity. Broome's annual rainfall average is 615.1 mm (24.22 in), 75% of which falls from January to March (Bureau of Meteorology, 2025)
Figure 1: Broome case studies
Demographic profile
Broome’s demographic profile is set out below (Table 3).
Table 3: Broome demographic profile
Demographic characteristic
Gender
(%)
Male 7108 (48.5)
Female 7553 (51.5
Median Age 34
Average number of children per family 1.9
Average number of people per household 2.7
Median weekly household income $2,222
Indigenous status
Aboriginal and/or Torres Strait Islander 3,436 (23.4)
Non-Indigenous 9,325 (63.6)
Indigenous status not stated 1,894 (12.9)
Income
In labour force 7,478 (66.6)
Not in labour force 2,074 (18.5)
Not stated 1,686 (15.0)
Dwelling structure
Separate house 3,469 (76.5)
Semi-detached, row or terrace house, townhouse, etc 695 (15.3)
Flat or apartment 124 (2.7)
Other dwelling 182 (4.0)
Australian Bureau of Statistics (2021) ‘Census All persons QuickStats’, https://abs.gov.au/census/find-censusdata/quickstats/2021/510011262, accessed 13 September 2024.
Key climate-related themes from Participant Organisation interviews
Key themes that emerged from meetings with Shire of Broome representatives included:
• Development WA (the State Government's central land and development agency) is interested in achieving appropriate climate-sensitive outcomes, but this is not necessarily the case with private developers.
• Building costs in Broome are high, which is a barrier to climate-adapted building design. For example, Colourbond is often used because it is cheaper and freight efficient; however, it conducts heat
• A lack of localised policy (at a state or local level) informed by science is a barrier to efficient development. Local policies should be reviewed in light of this analysis to produce a Liveable Neighbourhoods code with amendments concerning local climate
• Climate-vulnerable areas such as the Kimberley and the Pilbara should have more rigid design guidelines to improve design outcomes. Existing policies for subdivision design are currently not rigid enough to enforce intended climate-responsive design outcomes.
• Significant cooling effects have been noted in Old Cable Beach drainage-related open space, likely due to cool air collecting in low-lying areas. Such approaches could be adopted elsewhere.
• There is a general lack of tree canopy cover; ‘There is probably only a hundredth of the street trees that we need.’
• Too often, the Council has relinquished road reserves for car parking, contributing to the heat island effect. ‘We have more areas being bitumised than we need.’
• The cooling benefits of different exotic or endemic tree species are unclear and require research.
• Broome North:
o The planning frameworks in Broome North encourage good outcomes, and planning controls are essential to keep in place.
o Broome North is supposedly designed to be climate-sensitive, and Development WA indicates a 23% reduction in energy costs compared to residents living in Old Broome; however, no data has been provided to support this.
o The Council has approved several applications to build sheds, and residents have been planting golden cane palms in the breezeways These approvals may affect the intended design outcomes and should be measured.
o There are many small parks rather than one big park, and only small pockets of turfed areas. It is not clear whether they deliver the same cooling benefits as larger parks.
• Broome central:
o Planning is underway to upgrade the Hammersley St verges into a green and lush living stream, eliminating the current car parking. The resultant linear park would form a cool, green connection from the main town centre to the jetty. This proposal could be modelled for its cooling benefits.
Key themes regarding Indigenous communities that emerged from a meeting with Broome-based Department of Planning Lands and Heritage staff included:
• No ‘one size fits all’ exists for climate-responsive design solutions. Each Indigenous community has wildly different issues in terms of what they need. Geographically close communities can still have very different requirements
• There is a dwindling sense of community in hot weather because people stay indoors to escape the heat.
• Connection with country is also disappearing and causing generational breakdowns among Indigenous populations when hot weather does not permit comfortable outdoor activities in nature.
• Overcrowding is a big issue and a common situation in Broome, particularly in social housing, which has implications for thermal comfort. It was noted that the overcrowding in dwellings should be factored into microclimatic modelling.
• Social housing does not come with air-conditioning, and it is costly to get one fitted
• Many Indigenous people prefer natural cooling/ventilation to air conditioning. In the past, they could rely on verandas, creeks for swimming, and breezes for cooling. However, relying on natural cooling methods has become increasingly challenging in recent years.
• There is an urgent need for more localisation in housing, adaptation, and design.
• Public housing without air-conditioning has social impacts on the indigenous population. People no longer socialise on verandas when it is too hot, and they become more irritable and antisocial, leading to increased conflict (Figure 2)
• Public housing with air conditioning is also problematic. Transitioning between air-conditioned rooms and outside conditions can be challenging to adapt to. Moreover, power blackouts can occur almost daily because air conditioning can overload generators.
• Housing orientation is vital so sea breezes can be utilised for ventilation and cooling
• The thermal comfort of different housing materials should be investigated across various seasons and weather conditions - for example, the wet season, cyclone season and heat waves.
Key themes that emerged from an interview/ meeting with Broome North Primary School staff included:
• During COVID, teachers were required to aerate classrooms with air filters, which increased power requirements. Alternatively, they opened the door and windows, but the temperature increased to the point where it was unbearable, even with the air conditioner on, especially in the wet season
• With doors and windows closed, school staff noticed (using air monitors) that the higher the CO2 levels in the classroom, the less productive the students were.
• An undercover area is heavily used during the hotter months of the year. The basketball court is not covered, so 50% of the time, the students opt not to use it.
• The academic ability of students tends to decline when the weather gets hot
• The school would like to use data to support making plans to adapt to the heat.
• Shade structures are required over the basketball court and between buildings.
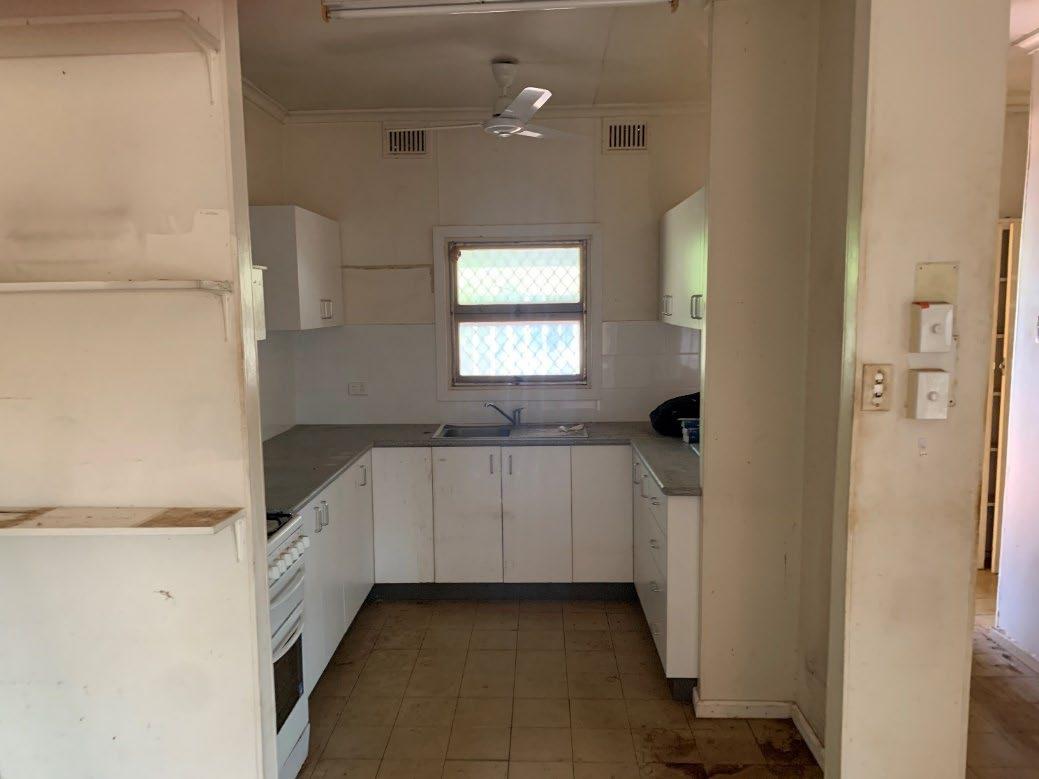
Figure 2: Public housing without air conditioning has negative social impacts for the Aboriginal population in Broome.
4.1.2 City of Karratha
Climate zone
The Karratha case studies (Figure 3) are sited within the National Construction Code designated climate zone 1: High humidity summer, warm winter (Australian Building Codes Board, 2024)
Karratha has a hot semi-arid climate (BSh) that just avoids a hot desert climate (BWh) classification. Temperatures are warm to hot all year round, with low rainfall, most of which falls in late summer due to the influence of tropical cyclones and the monsoon, although there is a second rainfall peak in early winter as the northern edges of cold fronts occasionally cause rain in the region. It is very rare for any rain to fall in the period from August to December. Winter temperatures rarely drop below 10 °C, while maximums stay in the mid to high 20s, and days are sunny with low humidity. Summers are very hot and usually dry, although the erratic influence of the monsoon can cause periods of high humidity and thunderstorms (Bureau of Meteorology, 2025)
Figure 3: Karratha case studies
Demographic profile
The demographic profile for the Karratha case studies is below (Table 4).
Table 4: Karratha's demographic profile
Demographic characteristic Number (%)
Gender
Male 12,032 (54.2)
Female 10,166 (45.8)
Median Age 32
Average number of children per family 2
Average number of people per household 2.8
Median weekly household income $3,158
Indigenous status
Aboriginal and/or Torres Strait Islander 2,594 (11.7)
Non-Indigenous 16,152 (72.8)
Indigenous status not stated 3,455 (15.6)
Income
In labour force 11,459 (69.2)
Not in labour force 2,321 (14.0)
Not stated 2,772 (16.7)
Dwelling structure
Separate house 4,951 (78.5)
Semi-detached, row or terrace house, townhouse, etc 893 (14.2)
Flat or apartment 330 (5.2)
Other dwelling 97 (1.5)
Australian Bureau of Statistics (2021) ‘Census All persons QuickStats’https://abs.gov.au/census/find-censusdata/quickstats/2021/LGA54310, accessed 13 September 2024.
Key climate-related themes from Partner Organisation interviews
Key themes that emerged from the interview with the City of Karratha included:
• Urban design needs to address liveability according to future heat projections and weather events; ‘The projections are that this whole region (the Pilbara and inland) is going to be Ground Zero for heating and increased heat, so liveability of the whole Pilbara needs to be addressed and designed around the way we live so it is efficient.’
• Karratha’s climatic zone has robust building codes to withstand tropical cyclones and their effects on buildings; ‘Certainly, the projections with climate change are that we are going to see a decrease in the number of cyclones, but potentially the increase in the severity.’
• Higher-intensity weather events may lead to flooding. Less frequent but intense rainfall is problematic for biodiversity.
• Residents are well-adapted to hot temperatures and stay indoors, while outside workers take precautions such as reducing working hours.
• The environment is under extreme stress during hot weather events. Waterholes are dry, and foliage cover is reduced. Increased animal deaths occur in hot temperatures when animals cannot get to water and shade.
• Naturally occurring trees are very small due to climate impacts (e.g., cyclones) and provide limited shade (Figure 4).
• Some areas are vulnerable to coastal erosion and sea level rise, but mainly erosion occurs from storm surges.
• The community is generally sceptical about climate change and thinks it will not affect them; ‘They see it as more of a southwest issue and as a water issue.’
• Aquifers supply the primary water source, and a small amount is from the dam. These aquifers are under pressure, and water literacy in the community is generally poor. Nonetheless, there is high water recycling with four wastewater treatment plants. Wastewater is used to irrigate public spaces.
• Mining operates under the water table, and excess water is distributed to aquifers or creeks. Industry (Watercorp and Rio Tinto) is considering putting desalination plants in place to reduce pressure on aquifers.
• Generally, housing is not designed to withstand temperatures and provide favourable thermal conditions. Most buildings and housing have been designed using principles better suited to the south of the state; ‘A north-facing house to allow plenty of light through is torture up here because we want relief from the sun and the heat, so applying building principles from the south is not appropriate for up here…Here, you need to create breezeways, and the best part of the house is the south of the house.’
• The indigenous community, who occupy Department of Communities housing, are highly vulnerable to heat stress because the housing does not provide air conditioning, verandas, or louvres- they are ‘essentially boxes.’
• Heat is a particular problem for the prison as the entire prison is not air-conditioned.
• The Council is considering planting a combination of native and exotic trees to meet the city's shade canopy needs while being cyclone and heat resilient (Figure 4).
• Many houses are owned by companies and rented, so residents are not invested in planting and maintaining private trees As such, ‘the drive to plant a tree and look after it for ten years until it is well established is low. So that is a barrier to increasing shade in the residential areas.’
• No climate adaptation plan exists; however, an emission reduction plan is underway. An urban forest study has been conducted, but the Council has not yet endorsed the tree strategy
• There was a perception that research was needed to understand:
o How regional communities view climate change
o The cooling effects of trees on verges and footpaths
o The cooling effects of breezeways for cooling
o The longer-term planning of climate change impacts
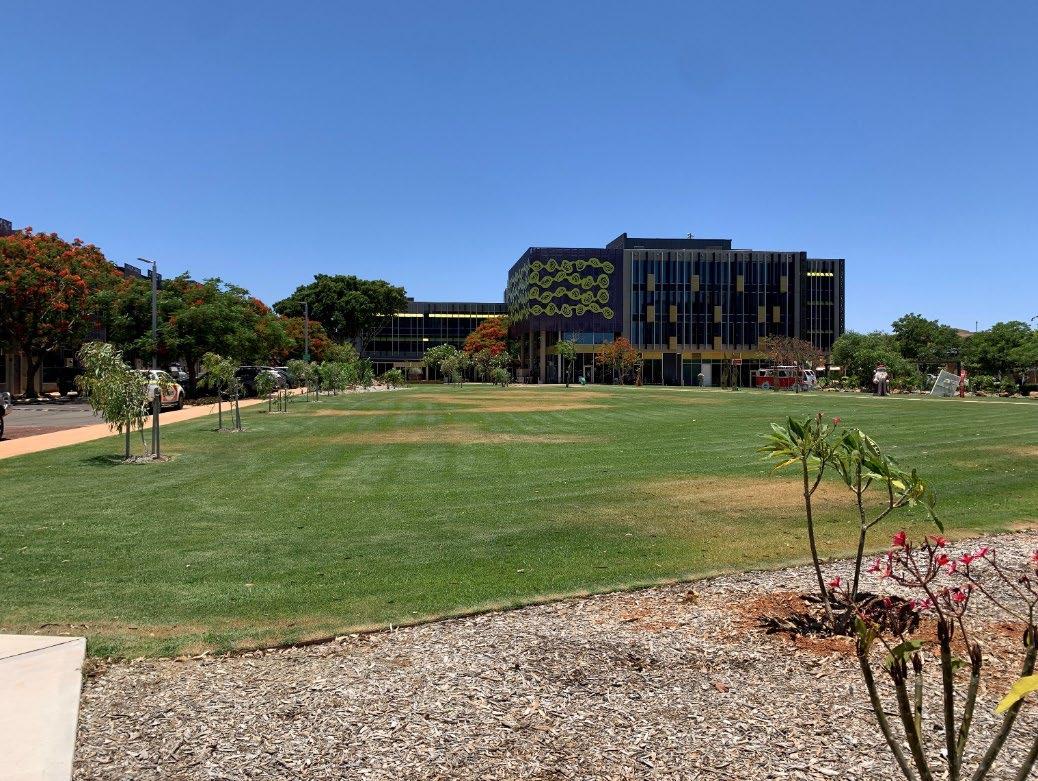
4: The Council is considering planting a combination of native and exotic trees to meet the shade canopy needs, while being cyclone and heat resilient.
Figure
4.1.3 City of Greater Geraldton
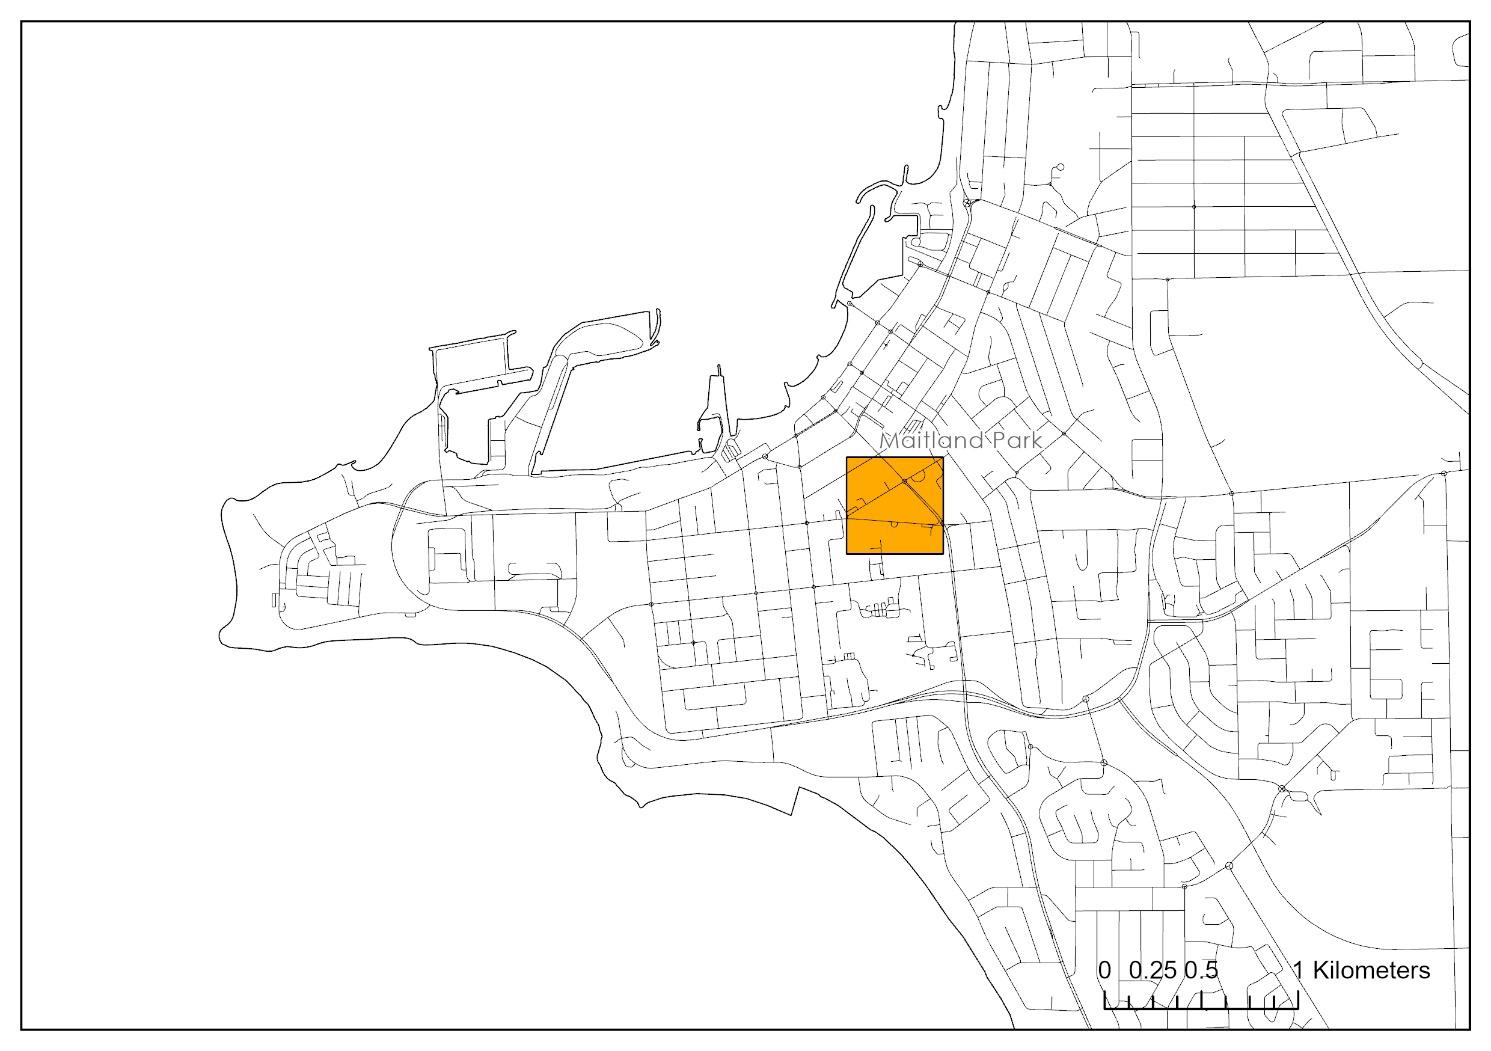
5: Geraldton case study
Climate zone
The Geraldton case study (Figure 5) is sited within the National Construction Code designated climate zone 5 Warm temperate (Australian Building Codes Board, 2024) Geraldton has a Mediterranean climate (Csa) with semi-arid (Bsk) influence. Geraldton is very sunny, receiving around 164 clear days annually. Summers are long-lasting and hot, though with relatively mild nights. Winters are short but mild and wet, with cool nights. Mean sea temperatures in the summer months (measured at 10m) are consistently above 22 °C, often exceeding 24 °C. In the winter, the temperature is mild, with daily highs averaging around 20 °C. Most of the yearly rainfall falls in this period. Geraldton averages 32–33 °C in the summer, with some days over 40 °C. Afternoon sea breezes cool coastal areas (Bureau of Meteorology, 2025).
Figure
Demographic profile
The demographic profile for the Geraldton case study is below (Table 5).
Table 5: Geraldton demographic profile
Demographic characteristic Number (%)
Gender
Male 19,505 (49.4)
Female 19,992 (50.6)
Median Age 40
Average number of children per family 1.9
Average number of people per household 2.4
Median weekly household income $1,536
Indigenous status
Aboriginal and/or Torres Strait Islander
3,814 (9.7)
Non-Indigenous 32,254 (81.7)
Indigenous status not stated 3,421(8.7)
Income
In labour force 18,941 (59.9)
Not in labour force 9,719 (30.7)
Not stated 2,976 (9.4)
Dwelling structure
Separate house 12,367 (86.3)
Semi-detached, row or terrace house, townhouse, etc 1,519 (10.6)
Flat or apartment 230 (1.6)
Other dwelling
154 (1.1)
Australian Bureau of Statistics (2021) ‘Census All persons QuickStats’ https://www.abs.gov.au/census/find-censusdata/quickstats/2021/LGA53800, accessed 13 September 2024.
Key climate-related themes from Partner Organisation interviews
Key themes that emerged from the interview with the City of Greater Geraldton included:
• The critical and most overt issue relating to climate and impacting the LGA is coastal erosion.
• Secondly, water shortages are an issue, particularly around planting new trees and establishing them until they are self-sufficient.
• At some point during 2024, Geraldton was the hottest place on Earth, reaching 49.3 degrees during the peak. People sought refuge from the heat in the library and congregated in shaded areas.
• There is a lot of state housing, and the Department of Communities has recently revitalised one suburb to modernise older housing and improve road connectivity. Improvements have been made to a park in recognition that parks, parkland trees, nature play, and gardens are essential for the indigenous population and can deliver urban cooling
• Development is sometimes done outside of the Council’s control and, therefore, is not always sustainable, ‘One of our things is that the state or any state agency can just issue themselves a development approval without going through the city. If they had to go through a formal development approval process, the Council could say, “No, you should not be building it there because you are in a personal hazard zone.”
• Buildings facing the sun are not the best design for Geraldton Some existing buildings that face the wrong way are unusable at certain hours of the day in summer.
• Houses designed to facilitate passive air movement (without air conditioning) seem ineffective once temperatures reach the mid-40s.
• Footpaths that reflect heat are ‘good for reflecting heat’ but too bright for use in summer. The alternative ‘black concrete’ is easier on the eyes but absorbs more heat, making the pathways hotter. Hot temperatures have caused damage to footpaths. They can get sticky and buckle (Figure 6).
• The CBD Master plan recognises that canopy coverage is currently around 7% but aims at 30%. Tree planting in the CBD competes with underground services, underground infrastructure and hard surfaces.
• Watering new trees until they are self-sufficient is challenging. Although dry, Geraldton has a significant amount of moisture in the air that could be extracted and used to water trees. This technology may be available in the future. Hydra panels (built-in solar panels and water and atmospheric extraction units designed for remote water supplies) were examined and considered, but a manufacturer could not agree on their use.
• A climate change adaptation plan is operational A net zero corporate plan is also in place; ‘We have a net zero plan, but we are not going to reach it, so we are going to have to buy some carbon credits somewhere, but at least we got a plan that allows us to get down to zero theoretically.’
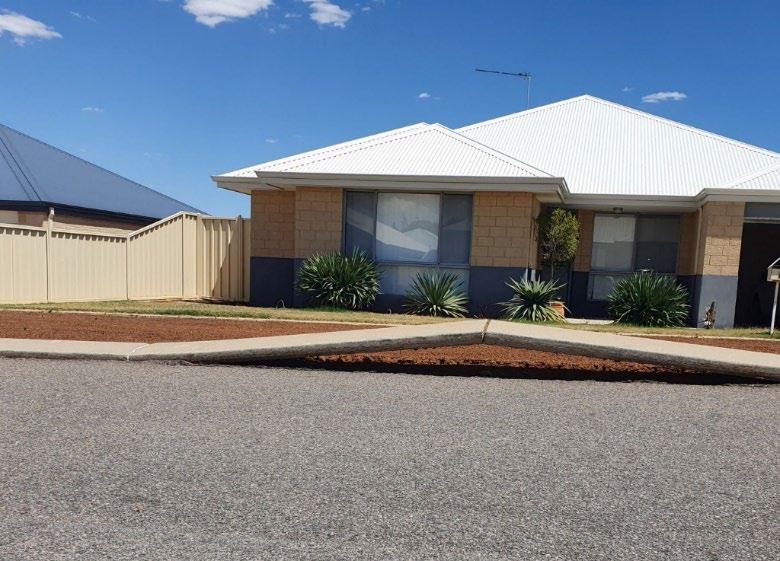
Figure 6: Example of extreme heat causing footpaths in Geraldton to buckle
4.1.4
Shire of Toodyay
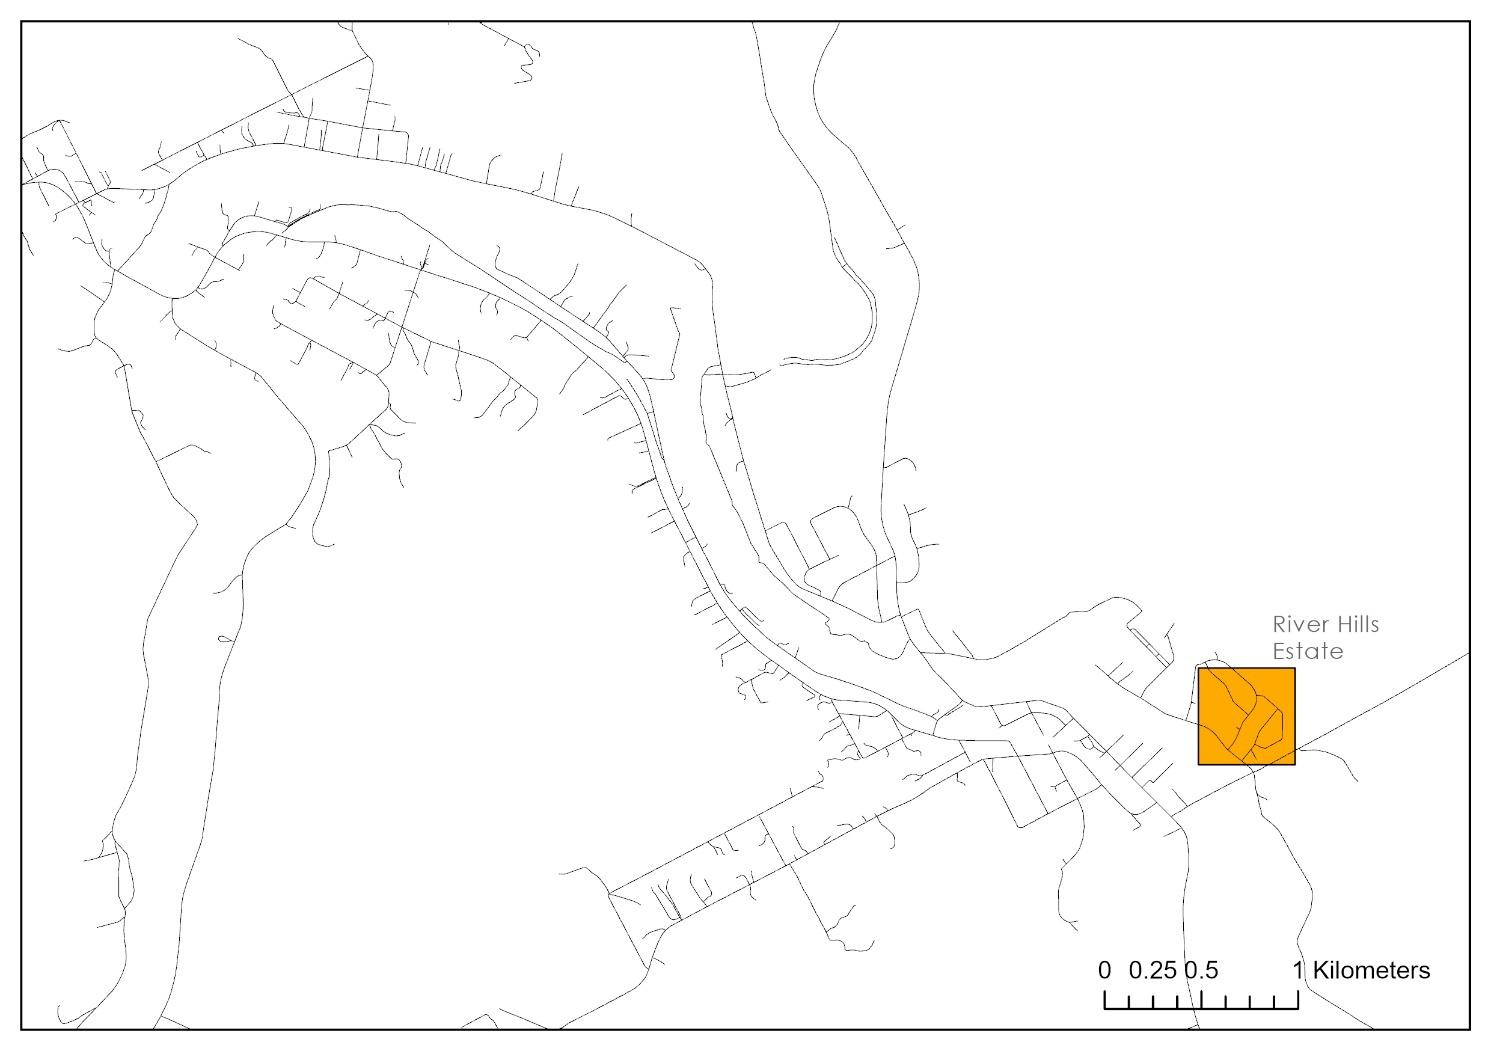
Figure 7: Toodyay case study
Climate zone
The Toodyay case study (Figure 7) is sited within the National Construction Code designated climate zone 5 Warm temperate (Australian Building Codes Board, 2024) Northam has a hot-summer Mediterranean climate (Köppen: Csa) with hot, dry summers and mild, rainy winters (Bureau of Meteorology, 2025)
Demographic profile
The demographic profile for the Toodyay case study is below (Table 6)
Table 6: Toodyay demographic profile
Aboriginal and/or Torres Strait Islander
136 (3.0)
Non-Indigenous 3,959 (86.0)
Indigenous status not stated 508 (11.0)
Income
In labour force 2,022 (50.8)
Not in labour force 1,495 (37.6)
Not stated 459 (11.5)
Dwelling structure
Separate house 1,707 (97.6)
Semi-detached, row or terrace house, townhouse, etc 10 (0.6)
Flat or apartment
0
Other dwelling 26 (1,5)
Australian Bureau of Statistics (2021) ‘Census All persons QuickStats’ https://abs.gov.au/census/find-censusdata/quickstats/2021/509021244, accessed 13 September 2024.
Key climate-related themes from Partner Organisation interviews
Key themes that emerged from the interview with the Shire of Toodyay included:
• Water shortages are the biggest climate-related challenge Toodyay faces. Access to accurate water data is missing, and a hydrology study has not been conducted in Toodyay for a long time. For instance, salt encroachment into water bodies has not been examined.
• The Aboriginal Heritage Act is another competing interest and challenge to water management.
• A high proportion of elderly residents live in Toodyay and this population suffers more in the heat.
• Development in this LGA is mostly large-sized ‘bush blocks’ where people seek to develop land for various purposes, such as gardening, hobby farms, and livestock (Figure 8). Retaining trees on private property is threatened by competing legislations around preservation, bushfire and development and finding a balance is difficult.
• Refuge from the heat on hot days is provided through public health plans and managed by the environmental officer.
• Climate-related planning and frameworks are complex and cannot be developed without the required expertise and resources. Resourcing to develop climate-related plans and policies is on Toodyay’s wish list; ‘We need the assistance to get policies up and running.’
• The cost of developing in Toodyay is higher than in the city, so developers and the government cut costs to save money, which does not necessarily favour the environment.
• Regions often suffer from a city-centric perspective and are often beholden to the state government's preferences, which are not always the best design. Adherence to a minimum standard in the Residential Design Codes does not produce favourable outcomes.
• Attracting good quality urban design outside the metropolitan area is limited, as people are offered more money to work in the city, and the travel distance to Toodyay is a barrier, resulting in some regional areas suffering in terms of quality urban design
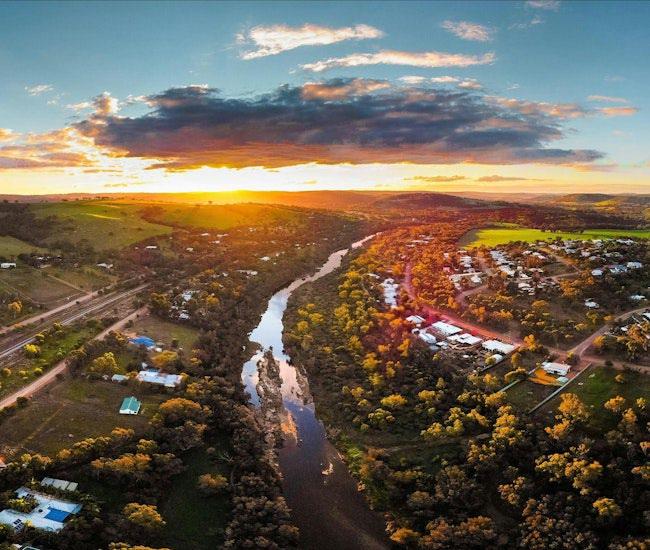
Figure 8: Development in Toodyay mostly large-sized ‘bush blocks’ where people seek to develop land for various purposes, such as gardening, hobby farms, and livestock
4.2 Perth metropolitan case studies
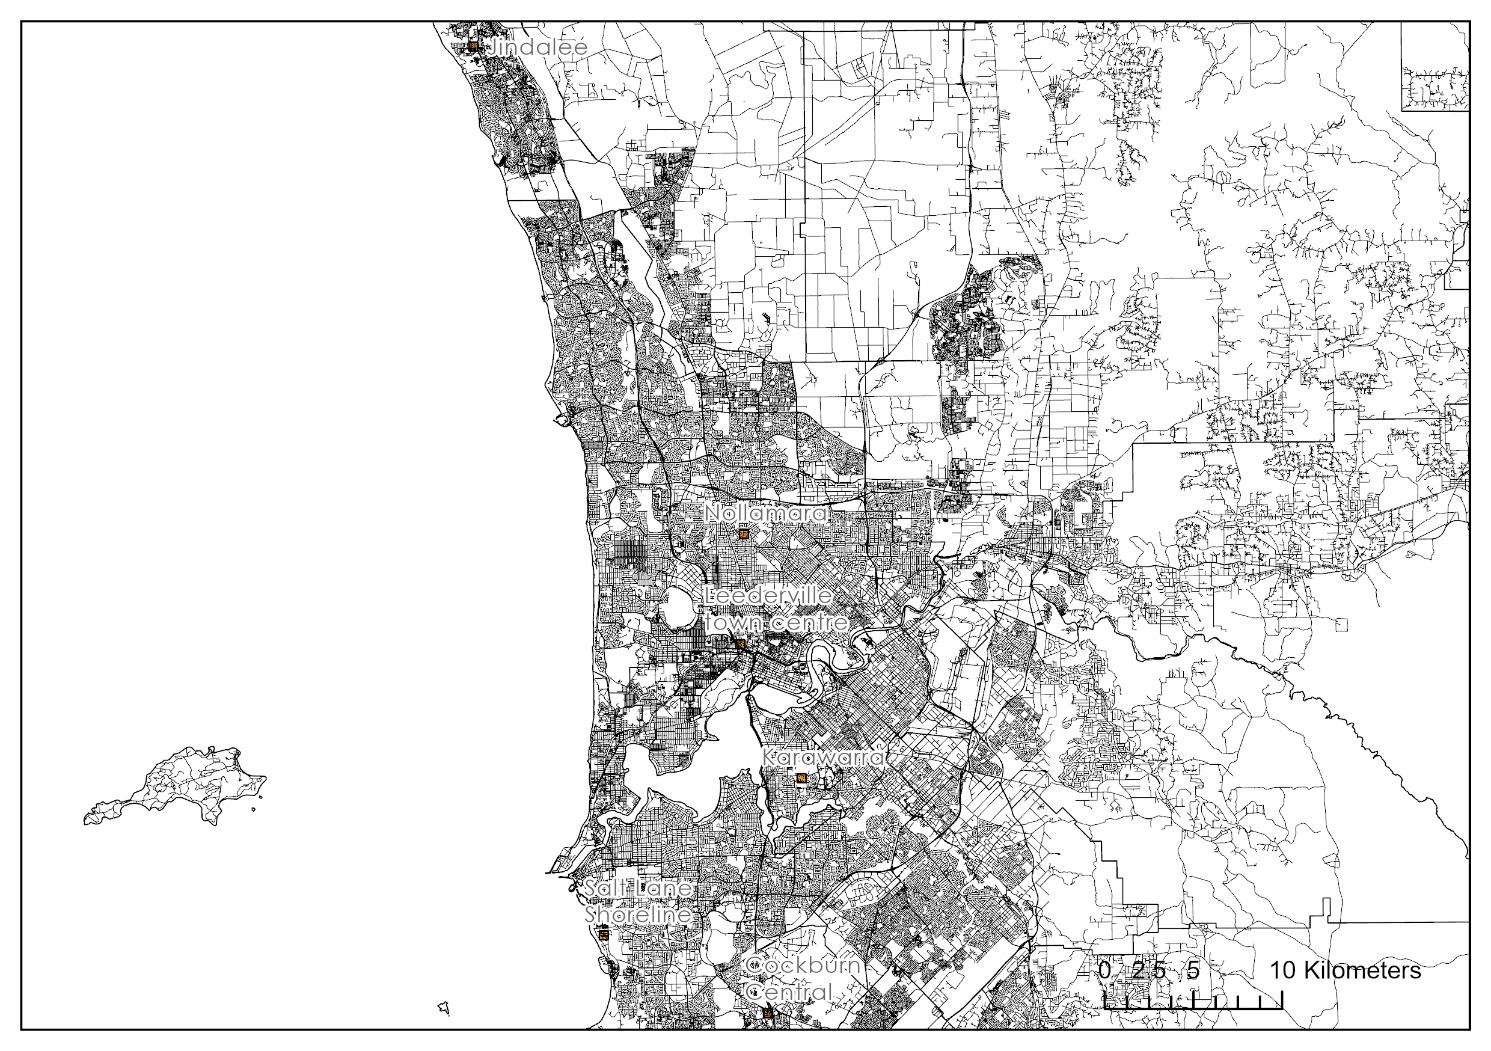
Figure 9: Perth metropolitan case studies
Climate zone
The Perth case studies (Figure 9) are sited within the National Construction Code designated climate zone 5 Warm temperate (Australian Building Codes Board, 2024) Perth has a Mediterranean climate (Köppen climate classification Csa), with hot, dry summers and mild, wet winters. February is the hottest month of the year, with an average high of 31.6 °C, and July is the coldest month, with an average low of 7.9 °C. 77% of the rain in Perth falls between May and September (Bureau of Meteorology, 2025)
4.2.1
City of Wanneroo
Demographic profile
The demographic profile for the City of Wanneroo is below (Table 7).
Table 7 Wanneroo demographic profile
Demographic characteristic Number (%)
Gender
Male 102,807 (49.2)
Female 106,304 (50.8)
Median Age 35
Average number of children per family 1.9
Average number of people per household 2.8
Median weekly household income $1,894
Indigenous status
Aboriginal and/or Torres Strait Islander
3,971 (1.9)
Non-Indigenous 197,334 (94.4)
Indigenous status not stated 7,809 (3.7)
Income
In labour force 110,941 (68.1)
Not in labour force 44,270 (27.2)
Not stated 7,784 (4.8)
Dwelling structure
Separate house 65,649 (92.1)
Semi-detached, row or terrace house, townhouse, etc 5,066 (7.1)
Flat or apartment
Other dwelling
302 (0.4)
184 (0.3)
Australian Bureau of Statistics (2021) ‘Census All persons QuickStats’ https://abs.gov.au/census/find-censusdata/quickstats/2021/LGA58760, accessed 13 September 2024.
Key climate-related themes from Partner Organisation interviews
Discussion mostly pertained to new developments in the LGA, including the case study site of Jindalee. Key themes that emerged from the interview with the City of Wanneroo included:
• Developers are typically profit-driven, and large-scale land clearing is the most cost-effective method for development, leading to poor liveability and climate outcomes (Figure 10).
• Current development and the provision of low-cost housing are not responsive to the environment or climate and are not conducive to trees with canopy as part of the urban fabric.
• There is a dominance of hardscapes, such as roofs, pavements and roads, which radiate heat
• Attempts to modify the current development/business model and improve outcomes are evident in planning regulations and policies (e.g., the Residential Design Codes). However, developments typically only adhere to minimum standards.
• In the study site and other similar areas, the design does not maximise liveability in the streets for all age groups.
• Building costs and affordability have resulted in reduced lot sizes; however, the houses are getting bigger on the lot, resembling dog boxes. Different urban design solutions are needed.
• A tall canopy is much more effective in summer for providing shade from direct radiant heat from above. There is a need to plant suitable tree species rapidly
• There is competition for roadside verge space between developers trying to reduce road reserve space to gain profits and service providers needing to use reserves for service infrastructure such as gas, power, sewage, etc. This situation creates a deficit of space for tree planting, which would provide a canopy and shaded footpaths that facilitate shared use
• Planning standards do not currently provide a solution to this dilemma.
• Development should draw lessons from overseas (e.g., courtyard housing, tall tree canopy, wind towers) that work in similar climates and explore different approaches to urban cooling.
• Urban design should utilise local conditions for cooling (e g., sea breezes)
• Direct sunlight and radiant heat on some playground surfaces make them unsuitable for hot days (Figure 11).
• Water allocation areas (determined by the Department of Water) and governing processes restrict water use and distribution flexibility within the LGA. Most of LGA's water allocation goes to sports grounds, parks, and open spaces. Worryingly, water allocations are operating at maximum capacity and are about to be decreased.
• Current gaps in the knowledge include:
o Hard evidence around heat and the performance of the environment concerning heat
o Evidence of the unacceptable performance of the current development
o Urban design that uses urban ventilation systems
o Urban design that utilises/responds to the ethnicities that are part of the Australian population (and reflect similar climate zones).
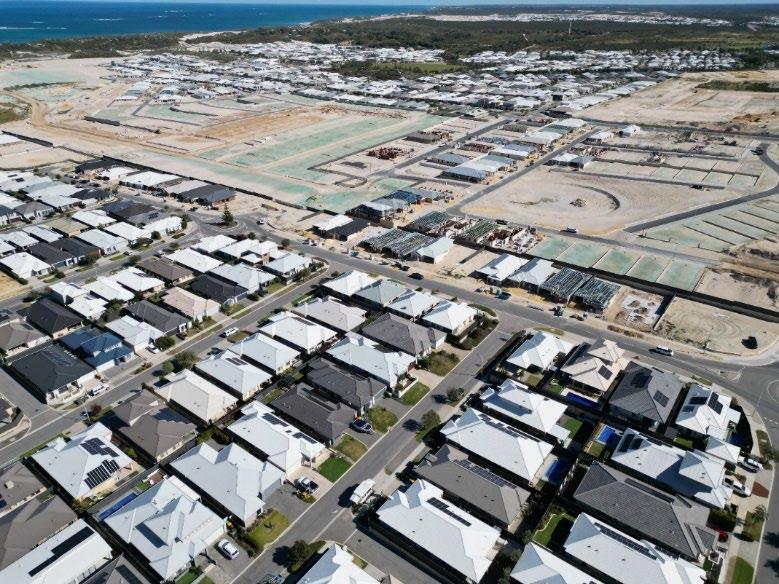
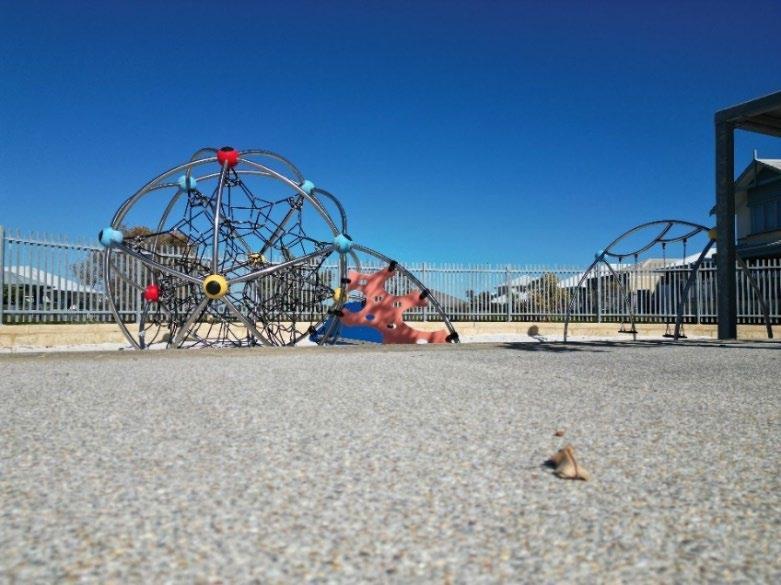
Figure 10: Mass land clearing for development into ‘Ikea’ suburbs
Figure 11: Playground exposed to direct sunlight and radiant heat
4.2.2 City of Vincent
Demographic profile
The demographic profile for the City of Vincent is below (Table 8).
Table 8: City of Vincent demographic profile
Demographic characteristic
Gender
Male 18,240 (49.9)
Female 18,293 (50.1)
Median Age 36
Average number of children per family
Average number of people per household
Median weekly household income $2,209
Indigenous status
Aboriginal and/or Torres Strait Islander
318 (0.9)
Non-Indigenous 34,483 (94.4)
Indigenous status not stated 1,734 (4.7)
Income
In labour force 22,915 (73.2)
Not in labour force 6,588 (21.1)
Not stated 1,790 (5.7)
Dwelling structure
Separate house 7,418 (48.0)
Semi-detached, row or terrace house, townhouse, etc 3,380 (21.9)
Flat or apartment 4,574 (29.6)
Other dwelling 54 (0.3)
Australian Bureau of Statistics (2021) ‘Census All persons QuickStats’ https://www.abs.gov.au/census/find-censusdata/quickstats/2021/LGA58570, accessed 13 September 2024.
Key climate-related themes from Partner Organisation interviews
Key themes that emerged from the interview with the City of Vincent included:
• Concerns about canopy cover. The state government is very pro-development, and no tree protections exist to protect private properties. A significant amount of tree canopy is lost on private land, as people cut down trees to subdivide or build extensions, which the Council has no control over. Nonetheless, ‘Green track’ offers a life cycle assessment of building proposals and incentives for greening.
• Trees also compete with underground power, car parking and other underground services in verges. Sidewalks are narrow, and the provision of competing services creates challenges for tree canopy and shade provision (Figure 12).
• In the town centre, the Council is trying to balance having more trees with business density and the need for, in some places, more car parking.
• There is tension between maintaining biodiversity and providing habitats and planting viable tree species for the Council to maintain in the future.
• Trees are watered with bore water under a water allocation plan; ‘Planting a tree is one thing but giving it enough water until it is self-sufficient is expensive.’ Water allocation will be reduced by 8-10% by 2028.
• The provision of shaded public open space is a focus of the LGA.
• Concrete retains heat, especially on consecutive hot days and is vulnerable to damage.
• The library is a refuge from the heat on hot days, and hours are extended to accommodate people.
• Barriers to innovating climate-related design are mostly limitations in resources and staffing.
• Many people use the trees, and shade structures the city provide for relief from the heat
• In summer, the alfresco areas with shade structures are full.
• Climate risk assessment planning, stormwater drainage, and climate modelling are mooted but have not yet been developed.
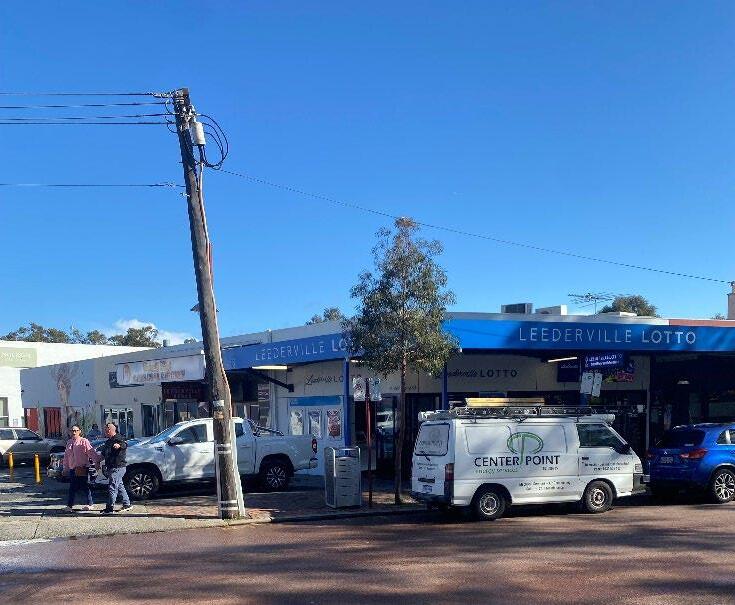
Figure 12: Sidewalks in Leederville town centre with trees and services competing for verge space
4.2.3 City of Cockburn
Demographic profile
The demographic profile for the City of Cockburn is below (Table 9).
Table 9: Cockburn Central demographic profile
Demographic characteristic Number (%)
Gender
Male 57,054 (49.3)
Female 58,771 (50.7
Median Age 36
Average number of children per family 1.8
Average number of people per household 2.6
Median weekly household income $1,988
Indigenous status
Aboriginal and/or Torres Strait Islander 2,224 (1.9)
Non-Indigenous 109,180 (94.3)
Indigenous status not stated 4,424 (3.8)
Income
In labour force 64,696 (69.4)
Not in labour force 24,254 (26.0)
Not stated 4,292 (4.6)
Dwelling structure
Separate house 34,655 (81.1)
Semi-detached, row or terrace house, townhouse, etc 5,012 (11.7)
Flat or apartment 2,826 (6.6)
Other dwelling
206 (0.5)
Australian Bureau of Statistics (2021) ‘Census All persons QuickStats’, https://abs.gov.au/census/find-censusdata/quickstats/2021/50701, accessed 13 September 2024.
Key climate-related themes from Partner Organisation interviews
Key themes that emerged from an interview with the City of Cockburn included:
• Drastic changes to the landscape have occurred, turning semi-rural and agricultural areas such as market gardens into new suburbia. The Local Government endeavours to keep as much bush as possible, but the WA State Government primarily determines the types of developments and where they occur, so the Local Government acts within that state framework.
• There are no trees or vegetation in newly developed areas that used to be industrial farming properties.
• Many trees died throughout the City of Cockburn in parks, reserves, and streets last summer (2023/2024).
• Developments are built following a set of rules and are handed over to the LGA to be managed once they are done. However, the rules are not necessarily providing the best design for the community, and the LGA finds themselves trying to make the spaces more liveable and climate responsive retrospectively; ‘We get handed over developments once they are done, and we just have to deal with what is handed to us’.
• People without air conditioning at home often get on the bus or visit their local shopping centre or library to escape the heat. Over last summer, many facilities (e.g., Cockburn Aquatic and Recreation Centre and the library) noticed increased usage of people taking refuge from the heat; ‘There are plenty of places for people to come in and sit and grab a cup of water. They look after everyone.’
• Developers select trees for reasons other than sustainability, and tree selection could be about cost or aesthetics when selling the properties, so choices are not always the most suitable.
• The Department of Water and Environmental Regulation (DWER) have said it will reduce water allocations over the coming years, which is concerning. Every year, the City of Cockburn reduces water use on the scheme and groundwater.
• The City of Cockburn is adapting to hotter climates and water shortages by creating garden beds (from existing lawns and paving) and adding more vegetation, trees, and shading.
• There is a regular program where shade sails go out over parks and playgrounds every year before summer and are taken down in winter.
• Hydro zoning has occurred in many parks, and most have soil moisture sensors to avoid overor under-watering.
• The Council is trying to influence more sustainable design choices (among builders and renovators) by providing planning concessions in exchange for tree planting, solar panels or other sustainability measures.
• Procedures are in place, and action plans are developed for heat events so that vulnerable communities (seniors, special needs, etc) are managed during heat waves.
• The local government conducts risk assessments annually, with climate change typically ranking as the top risk to the city.
• The city provides free eco-audits to help people update their homes for better sustainability.
• Cockburn Central:
o A car park and a freeway devoid of natural environment surround the train station.
o The study site generally has much concrete, some astroturf, and very little shade. The site, including the park and ride, is like a heat sink (Figure 13)
o Development at the study site has been slow or delayed, resulting in a significant number of vacant blocks.
o Competing factors for verge space, such as bike lanes, car parking, minimum requirements by planning schemes, and restricted space for trees
o The need to provide car parking in higher-density areas is a barrier to planting more trees in streetscapes (Figure 14)
o The central park in Cockburn is the most unused in Cockburn as it is too small and has no trees or shade (Figure 15). Planting vines on the structure for shade in the park area has failed due to the extreme heat and dry conditions The Council cannot manage water features put in by the developers due to health issues and water restrictions. One has been removed, and a second one will be removed once its management is turned over to the C ouncil
o Trees planted in tree pits and on rubber surfaces struggle to grow because they get hot.
o A wetland/ public open space on the edge of the study area has been rehabilitated and is being used for drainage that could provide some cooling to the surrounding area.
o The effectiveness of shading elements on building facades is unclear (Figure 16).
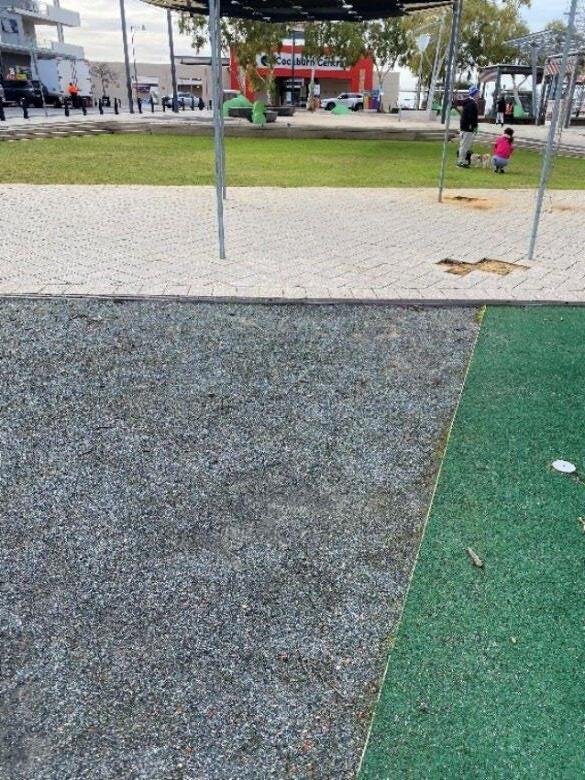
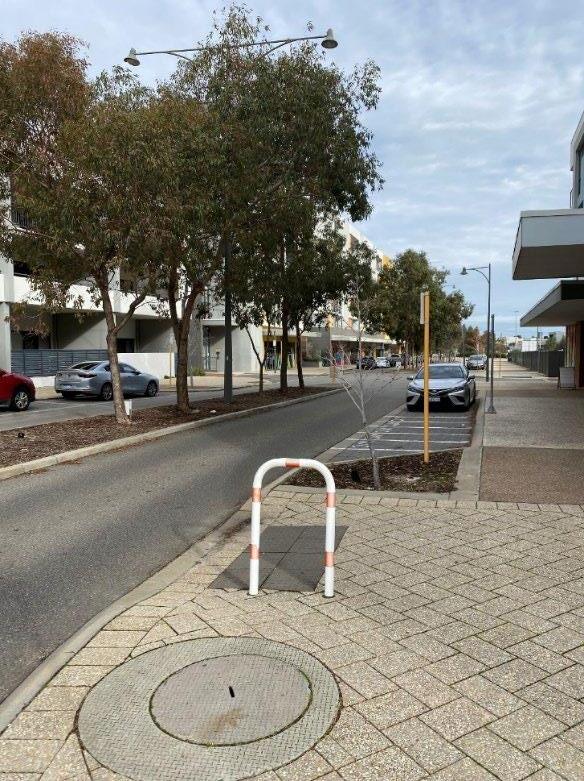
Figure 13: Hard, unshaded surfaces and maintenance problems
Figure 14: Trees and car parking competing verge space can prevent street tree placement and growth.
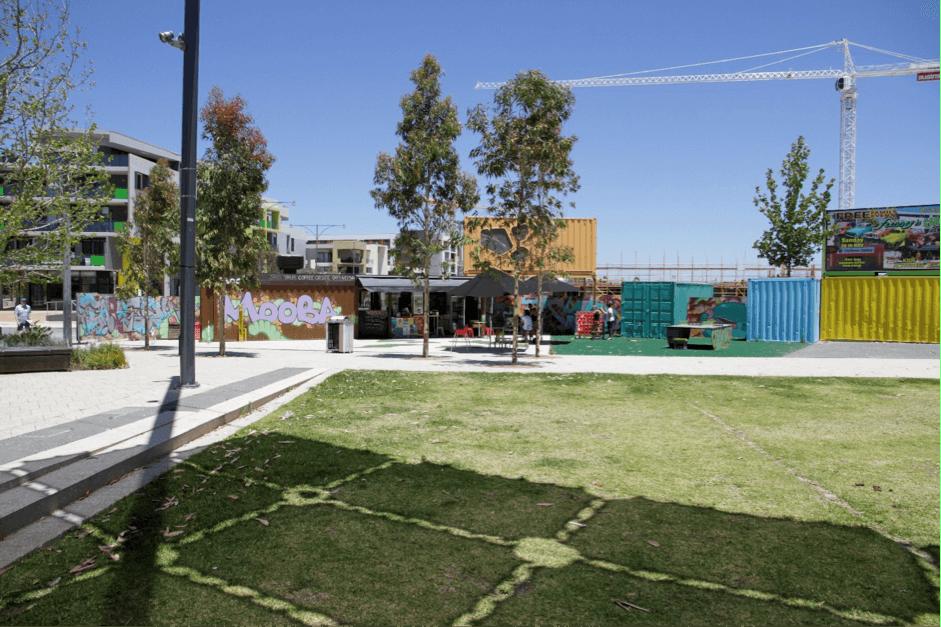
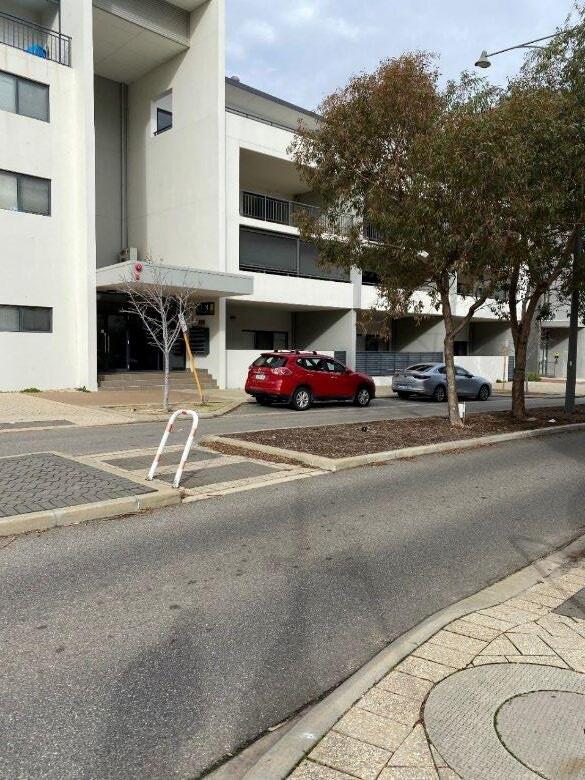
Figure 15: The most central but unused park in Cockburn
Figure 16: Shade elements on buildings in the study site
5. Conclusion
Western Australian local governments are actively working to adapt their environments and communities to climate change; however, challenges persist. Current approaches to adaptation and progress are varied among local governments due to adaptation capacity and the complexity of local climate risks. Climate-related threats to environments, such as heat stress and water shortages, are exacerbated by resource constraints, insufficient policy implementation and/or a lack of adaptation strategies, resulting in difficulties integrating adaptation into planning and decision making.
Findings from this report provide insights that will assist the development of adaptation strategies as part of the Future Climate, Future Home project. Additionally, the findings highlight the importance of improved understanding of long-term climate impacts, sustainable housing and development, localised adaptation strategies, opportunities for collaboration across local governments, and building stronger support systems to strengthen adaptation efforts
6. References
Australian Academy of Science. (2021). The risks to Australia of a 3°c warmer world Available at www.science.org.au/warmerworld
Australian Building Codes Board. (2024). Climate zone map. Australian Building Codes Board. Retrieved 03.09 from https://www.abcb.gov.au/resources/climate-zone-map
Australian Bureau of Statistics. (2022). 2021 Census All persons Quickstats. Retrieved 07.25 from https://www.abs.gov.au/census/find-census-data/quickstats/2021/5
Australian Bureau of Statistics. (2021). 2021 Socio-Economic Indexes for Areas (SEIFA). Retrieved 07.25 from https://www.abs.gov.au/statistics/people/people-and-communities/socio-economicindexes-areas-seifa-australia/latest-release
Australian Bureau of Statistics. (2016). 2021Natural Resource Management Regions. Retrieved 07.25 fromhttps://www.abs.gov.au/ausstats/abs@.nsf/Lookup/by%20Subject/1270.0.55.003~July%2 02016~Main%20Features~Natural%20Resource%20Management%20Regions%20(NRMR)~11
Australian Government. (2015). National climate resilience and adaptation strategy https://www.environment.gov.au/climate-change/adaptation/strategy
Australian Government. (2025). Climate adaptation in Australia https://www.dcceew.gov.au/climate-change/policy/adaptation Bowering, E. (2014). Adapting to climate-induced sea level rise on the Gold Coast: lessons from the Netherlands. Australian Planner, 51(4), 340-348.
Browne, M., Norton, B., & McCormack, S. (2015). Phase change materials for photovoltaic thermal management. Renewable and Sustainable Energy Reviews, 47, 762-782.
Bureau of Meteorology. (2019). Bureau of Meteorology. Australian Government. Retrieved 23.01 from http://www.bom.gov.au
Bureau of Meteorology. (2025). Climate statistics for Australian locations. Australian Government. Retrieved 07.07 from http://www.bom.gov.au/climate/averages/tables/cw_003003_All.shtml Climate change in Australia. (2017). Climate change in Australia. Australian Government. Retrieved 11.05 from http://ccia2007.climatechangeinaustralia.gov.au/
Cooper, J. A. G., & Lemckert, C. (2012). Extreme sea-level rise and adaptation options for coastal resort cities: a qualitative assessment from the Gold Coast, Australia. Ocean & Coastal Management, 64, 1-14.
Coutts, A., Beringer, J., & Tapper, N. (2010). Changing urban climate and CO2 emissions: implications for the development of policies for sustainable cities. Urban Policy and Research, 28(1), 27-47. https://doi.org/10.1080/08111140903437716
Department of Health. (2019). State Public Health Plan for Western Australia . Government of Western Australia. https://www.health.wa.gov.au/~/media/Files/Corporate/generaldocuments/Public-Health-Act/State-public-health-plan/State-PH-Plan-2019-2024/StatePublic-Health-Plan-WA.pdf
Department of Water and Environmental Regulation. (2022). Climate Resilient WA: Directions for the state’s Climate Adaptation Strategy. Government of Western Australia. https://www.wa.gov.au/system/files/2022-12/Climate-resilient-WA.pdf
Department of Water and Environmental Regulation. (2023). Climate Adaptation Strategy: Building WA’s climate resilient future. Government of Western Australia https://www.wa.gov.au/system/files/2023-07/climate_adaption_strategy_220623.pdf
Flannery, T. (2016). World in motion: Breaking the restraints on positive progress. Griffith REVIEW(52), 79. Flannery, T. (2020). The Climate Cure: Solving the Climate Emergency in the Era of COVID-19. Text Publishing.
Gleeson, B. (2006). Waking from the Dream: Towards Urban Resilience in the Face of Sudden Threat. Griffith University Urban Research Program
Henrique, K. P., & Tschakert, P. (2022). Everyday limits to adaptation. Oxford Open Climate Change . Hurlimann, A., Barnett, J., Fincher, R., Osbaldiston, N., Mortreux, C., & Graham, S. (2014). Urban planning and sustainable adaptation to sea-level rise. Landscape and Urban Planning, 126, 84-93.
Intergovernmental Panel on Climate Change. (2022). IPCC Working Group 2 Sixth Assessment Report Intergovernmental Panel on Climate Change. https://www.ipcc.ch/report/ar6/wg2/ Leal-Arcas, R. (2012). Climate migrants: Legal options. Procedia-Social and Behavioral Sciences, 37, 86-96.
O'Neil, C., & Watts, T. (2015). Two Futures: Australia at a Critical Moment. Text Publishing. Planning and Development Act 2005. State Planning Policy 7.0 Design of the Built Environment (SPP 7.0).
Sarkissian, W. (2013). Wendy Sarkissian on NIMBYism, Community Resistance and Housing Density. The Fifth Estate. Retrieved 17.12 from http://www.thefifthestate.com.au/spinifex/nimbyismcommunity-resistance-and-housing-density/45397
Seamer, P. (2019). Breaking Point: The Future of Australian Cities. Nero. Sharifi, E., Sivam, A., & Boland, J. (2016). Resilience to heat in public space: a case study of Adelaide, South Australia. Journal of Environmental Planning and Management, 59(10), 1833-1854. https://doi.org/https://doi.org/10.1080/09640568.2015.1091294
Sharma, S., Sun, W., Jian, L., Landrigan, T., Kirkland, L., Joyce, S., & Scalley, B. (2024). Projecting heatrelated health impacts under climate change in Perth. Department of Health WA. https://www.health.wa.gov.au/~/media/Corp/Documents/Reports-andpublications/Climate-change-heat-related-health-impacts/Projecting-heat-related-healthimpacts-under-climate-change-in-Perth_Final.pdf
Sturman, A. P., & Tapper, N. J. (1996). The weather and climate of Australia and New Zealand. Oxford University Press, USA.
Walter, T. G., Bricknell, L. K., Preston, R. G., & Crawford, E. G. (2024). Perspectives of environmental health officers on climate change adaptation in Australia: a cross-sectional survey. Journal of Public Health, 1-13.
Whiley, H., Smith, J. C., Moore, N., Burton, R., Conci, N., Psarras, H., & Ross, K. E. (2023). Climate change and health: challenges to the Local Government environmental health workforce in South Australia. International Journal of Environmental Research and Public Health, 20(14), 6384.
