
Article
UnpackingParkCoolIslandEffectsUsingRemote-Sensed, MeasuredandModelledMicroclimaticData
BillGrace,JulianBolleter* ,MaassoumehBarghchi andJamesLund
AustralianUrbanDesignResearchCentre,SchoolofDesign,UniversityofWesternAustralia, Perth,WA6009,Australia;bill.grace@uwa.edu.au(B.G.);maassoumeh.barghchi@uwa.edu.au(M.B.); james.lund@uwa.edu.au(J.L.)
* Correspondence:julian.bolleter@uwa.edu.au
Abstract
AcademicEditor:Julia NerantziaTzortzi
Received:4July2025
Revised:4August2025
Accepted:12August2025
Published:20August2025
Citation: Grace,B.;Bolleter,J.; Barghchi,M.;Lund,J.UnpackingPark CoolIslandEffectsUsing Remote-Sensed,Measuredand ModelledMicroclimaticData. Land 2025, 14,1686. https://doi.org/ 10.3390/land14081686
Copyright: ©2025bytheauthors. LicenseeMDPI,Basel,Switzerland. Thisarticleisanopenaccessarticle distributedunderthetermsand conditionsoftheCreativeCommons Attribution(CCBY)license (https://creativecommons.org/ licenses/by/4.0/).
Thereisincreasinginterestintheroleofparksaspotentialcoolrefugesintheageofclimate change.SuchpotentialrefugesresultfromtheParkCoolIsland(PCI)effect,reflecting thetemperaturedifferentialbetweentheparkandsurroundingurbanareas.However, thisstudyofdifferentparktypologiesinPerth,Australia,illustratesthatwhilesurface temperaturesare10–15 ◦Clowerinparksduringsummerafternoons(muchlessthan atothertimes),airtemperaturesaregenerallynodifferentfromtheadjacentstreetscape forthesmallerparks.Onlythelargestparkinthestudyhad1–2 ◦Clowermorning andmid-afternoonairtemperaturedifferentials.ThestudyillustratesthatwhilethePCI isarealphenomenon,themagnitudeintermsofairtemperatureissmall,anditisof lessrelevancetotheconditionsfeltbyhumansinaveragesummerdaytimeconditions thanthedirecteffectsofsolarradiation.ManystudieshaveassessedthePCIeffect,an indicatorthathasshownawiderangeacrossdifferentstudiesandmeasurementtechniques. However,thisnovelpaperutilisessatelliteremote-sensedlandsurfacetemperatures,ongroundmeasurementsofsurfacetemperatures,airtemperatures,andhumidity,aswellas modellingusingthemicroclimaticsimulationsoftwareENVI-metversion5.0.Areliance onlandsurfacetemperature,whichinisolationhasamarginalcorrelationwithhuman experienceofthermalcomfort,hasledsomeresearcherstooverstatethePCIeffectandits influenceonadjoiningurbanareas.Theresearchreportedinthispaperillustratesthatitis theshadeprovidedbythecanopyinparks,ratherthanparksthemselves,thatprovides meaningfulthermalcomfortbenefits.Accordingly,adaptationtoincreasingtemperatures requiresthecreationofacontinuouscanopy,ideallyoverparks,streetscapes,andprivate lotsinaninterconnectednetwork.
Keywords: parkcoolislandeffect;urbanheatislandeffect;publicopenspace;climate adaptation;climatesensitiveurbandesign
1.Introduction
ManypartsofAustraliaalreadyhaveextensiveexposuretoextremesummerconditions.Perth(thecapitalcityofWesternAustraliaandthefocusofthispaper)hassummer daysthatoftenexceed40 ◦C,whichisprojectedtoworsenwithclimatechange.Recent updatesonglobalwarming[1]projectthat,withcurrentreal-worldpoliciesandactions (asopposedtonationalpledgesandtargets),globaltemperatureincreasesof2.2–3.4 ◦C abovepre-industriallevelsarelikelybytheendofthecenturyandwillcontinuetorise thereafter.TheseconditionswillhavedireimplicationsforAustraliancities,particularlyfor
residentsofsuburbanareaswithminimaltreecanopycover,whethermiddle-ringsuburbs experiencingurbaninfill[2]orcompactnewsuburbsontheurbanfringe[3].
1.1.UrbanHeatIslandsandParkCoolIslands
TheUrbanHeatIsland(UHI)isawell-recognisedphenomenonincities.Itarises fromretainingsolarradiation-inducedheatin‘impervious’urbansurfaceswithhighsolar absorptivityandheatcapacity,suchasroads,pavementsandbuildingsurfaces[4].The UHIeffectcanleadtolandsurfacetemperatures10 ◦Chigherthanthoseoftheirperi-urban surroundings[5],anditismorepronouncedatnightthanduringtheday[6].
Incontrast,vegetatedsurfacesinparksandgardensabsorbandre-radiatelessheat, resultinginlowerlandsurfacetemperatures.Thisphenomenonhascometobeknown astheParkCoolIsland(PCI)effect[7](Figure 1).UrbandesignersareincreasinglyinterestedinunderstandingtheeffectsofUHIandPCIonimprovingsummerthermalcomfort conditionsinurbansettings,particularlytheroleofparksasrefuges.Moreover,parksare alsodescribedasmitigatingUHIeffectsinhigh-levelpolicydocuments,suchasAustralia’s recentNationalUrbanPolicy,whichdescribeshow‘Greenspacesplayakeyroleinmitigatingtheurbanheatislandeffectbyprovidingshadedpathways,coolerenvironmentsand morecomfortableconditions’[8].


Figure1. Vegetationinparksprovidescoolingthroughshadeandevapotranspiration.
ManystudieshaveassessedthePCIeffect,whichreflectsthetemperaturedifferential betweentheparkandsurroundingurbanareas,whicharetypicallyhotterinthemiddleof theday,anindicatorthathasshownawiderangeacrossdifferentstudiesandmeasurement techniques[9].
Theliteratureincludesstudiesbasedonthemeasurementoflandsurfacetemperatureby remotelysensedsurfacetemperaturedata[10]orthermographiccameras[11].Asnotedby Liuetal.[12],satellite-derivedsurfacetemperatureisthemostprevalentmethodidentified intheliteraturetoidentifythePCIeffect.Otherstudiesinvolvethemeasurementofair temperature[13,14].Thesemeasuresreflecttheurbanenergybalancebuthavedifferent implicationsforhumanthermalcomfort.Additionally,theliteraturealsoincludesstudies
suggestingthatthePCIcontributestothemitigationofUHIthroughthecoolingofsurroundingurbanareas[7,15],whichcanevenreduceenergyforcoolinginbuildings[16,17].An explanationoftheurbanenergybalanceisnecessarytoresolvetheimportanceofthese observationsinthestudyofurbanmicroclimaticconditions.
1.2.TheUrbanMicroclimate
TheUHIeffectrepresentsthedifferenceintemperaturebetweenurbanareasandtheir surroundingnon-urbanisedareas[4].Atthemetropolitanscale,thedifferenceisbetween the‘city’andtheadjacent‘countryside.’Attheurbanprecinctscale,thedifferentialof interestliesbetweenurbanstreetscapesandvegetatedareas,whetherthesearelandscaped parksorconservationareas.WhenreferringtoUHI,itisimportanttodefinewhatismeant byboth‘temperature’andthelocationofthetemperaturemeasurement.RegardingUHI studies,airtemperatureneargroundlevelisthemostrelevant,notingthatairtemperature varieswithelevation.ThismeasureofUHIisknownastheCanyonUrbanHeatIsland (CUHI),whichisthelayerofairbetweenthegroundandthetopsofbuildingsandtrees[18]. Whenthemeasurementislandsurfacetemperature,thisisknownastheSurfaceUrban HeatIsland(SUHI)[4].Inurbanareas,thenear-surfaceairtemperatureisusuallyvery differentfromthatofthesurface,asitisinfluencedbyfactorssuchaswind,shading, turbulence,andthethree-dimensionalstructureoftheurbanenvironment[18].
Inessence,theUHIariseswhentheheatenergystoredthroughabsorbedsolarradiationduringthedaywithinurbanelementswithhighthermalmass(suchasroadsand buildings)isreleasedtoheatthenear-surfaceairduringthelateafternoonsandevenings. ThemagnitudeoftheUHIeffectdependsontheamountandrateofenergystoredand released,whicharefunctionsofsolarexposure,albedo,heatcapacity,thermalconductivity, andemissivityofthevarioussurfaces.Measurementsofnear-surfaceairtemperature duringaheatwaveinBirmingham,intheUnitedKingdom,reportedbyStewartand Mills[4],indicatedthatthecitycentrewashotterthananurbanparkfromaround4pm, peakingat5 ◦Caround10pm.Airtemperaturedifferentials(∆Ta)werelessthan1 ◦C duringmostofthedaytime(Figure 2).
00:0003:0006:0009:0012:0015:00 18:0021:0000:0003:0006:0009:00
Time (hour) City Centre Urban Park temperature
Figure2. Measurementsofnear-surfaceairtemperatureduringaheatwaveinBirminghamindicated thatthecitycentrewashotterthananurbanparkfromaround4pm,peakingat5 ◦ Caround10pm. Airtemperaturedifferentialswerelessthan1 ◦ Cduringmostofthedaytime.Figurereproduced fromStewartandMills[4].
Thisbehaviourisbecauseittakestimeforgroundsurfacesexposedtosolarradiation toheat,onlyemittinglong-waveradiationlaterinthedaytoheatthenear-surfaceair. Thehigherheatcapacitysurfacesthathaveabsorbedtheheatcontinuetore-radiateheat wellafter(directanddiffuse)short-wavesolarradiationhasdeclinedinintensity,butthe effectdiminishesasheatislostfromboththegroundandthenear-surfaceairovernightat similarrates[11].TheCUHIeffect,therefore,haslittleimpactonpeakdaytimenear-surface airtemperaturesinsummerconditions(whichtypicallyoccurinthemid-afternoon)and islargestintheevenings.Importantly,theCUHIalsoaffectsair-conditioningloadsin buildings(asaveragedailyairtemperaturesarehigherinaffectedlocations)[16].
ManyUHIarticlesarebasedonlandsurfacetemperature,whichmeasuresthesurface urbanheatisland(SUHI)effect[15,19–21].Asnotedabove,SUHIgenerallyreflectsCUHI effectsbutnotquantitatively.Whenexposedtoradiation,built-formelementsthatabsorb moreenergythanvegetatedsurfacesdevelopmuchhigherlandsurfacetemperatures. MeasurementsofsurfaceandairtemperaturesinPhoenix,Arizona(alsoreportedbyMills andStewart[4]),showpeaklandsurfacetemperaturesinthedesertandoverasphalt pavementofaround60 ◦Cinthemiddleoftheday,comparedto45 ◦Conasuburban irrigatedgrasssurface(∆Ts ≈ 15 ◦C).(∆ denotesDeltaordifferential).However,atthe sametimeofday,thenear-surfaceairtemperaturesofallthreesurfacesweresimilar (38–40 ◦C)(Figure 3).
Figure3. MeasurementsofsurfaceandairtemperaturesinPhoenix,Arizona,showpeaklandsurface temperaturesinthedesertandoverasphaltpavementofaround60 ◦ Cinthemiddleoftheday, comparedto45 ◦ Conasuburbanirrigatedgrasssurface(∆Ts ≈ 15 ◦ C).However,atthesametimeof day,thenear-surfaceairtemperaturesofallthreesurfacesweresimilar(38–40 ◦ C).Figurereproduced fromStewartandMills[4].
Otherstudiesinvolvingthemeasurementofairtemperaturedifferencesinurban areasalsoillustratethat ∆Ta ismuchlessthan ∆Ts.Eliasson[22]foundthatovernightair temperaturedifferentials(∆Ta)wereseldommorethan2 ◦C.Spronken-SmithandOke reportedaverageAugusttime ∆Ta valuesinVancouverparksof1.9 ◦C(night)and2.2 ◦C (day)andinSacramentoparksof2.4–3.3 ◦C(night)and1.2–2.4 ◦C(day).Inanextensive
studyinTokyo,Sugawara[23]reportedmeasured ∆Ta valuesof0.5–1.8 ◦C(compositeof 72fair-weatherdaysinAugust).
ManystudiesonthePCIutiliseremotelysensedlandsurfacetemperaturedata[15,19–21]. Manyofthesesourcesusethelandsurfacetemperaturedatatoassesstheapparentcooling effectofparksonadjacenturbanareas,oftenreferredtoasthe‘parkcoolingdistance’ (PCD)[24].Thedataanalysismethodologiesofthesestudiesvary,buttheyallrelyon LandsatThermalInfraredSensor(TIRS)data.Thespatialresolutionoftherawdatafrom Landsat8is100m,andthedatais‘resampled’to30m—aprocessknownas‘Cubic convolution’,whichaveragesthe16closest100mdatapointstothenominal30mgrid[25]. Thisprocessisgenerallyacceptablefordelineatinglarge-scaletemperaturedifferencesin thelandscape.
However,asisclearfromground-basedlandsurfacetemperaturedata,thereisasharp delineationinTs betweenparksurfacessuchasgrassandadjacentroadsunderexposureto short-wavesolarradiation(asidentifiedinthermalimaging,Spronken-SmithandOke[11]). Iflandsurfacetemperaturedatawereaccurateto5m,thatwouldbeevidentintheimages. However,theresampling‘averagesout’thedifferentialbetweentheactuallandsurface temperatureintheparkandtheactuallandsurfacetemperatureinthesurroundingsand willvaryaccordingtowheretheoriginalimageistakenrelativetotheparkboundary. Accordingly,landsurfacetemperaturesourcesarenotareliableguidetoassessingsmall parks’PCIorthe‘parkcoolingdistance’ingeneral.
However,measurementsofairtemperatures[11,13,23]supportthenotionthatthe lowertemperaturesinparksinfluencetemperaturesinadjacenturbanareas.Vanosetal. foundthatcoolerair‘extendsoutsidetheparkinthedirectionofprevailingwinds’[26]. Thisprocessisknownasadvection(whichisanalogoustoconvection).Sugawaraetal.[27] similarlyfoundthat‘turbulentmixingtransferscolderairfromtheparktourbanareasinits vicinity’withagreaterdistanceinthedownwinddirection;however,coolingalsooccurred incalmconditions.Sugawarareferstothisphenomenonasa‘gravitycurrentdriven bythepressuregradientbetweenthecolderparkandthewarmertown’[23].Oke[28] hypothesisedasimilarmechanism,withcooler,denserairfromtheparkflowingoutwards inacirculationpatternthatbringsascendingwarmerairtoconvergeathigherelevations abovethepark.Thismechanismisanalogoustothemechanismbywhichdaytimesea breezesoccuratmuchlargerscalesincoastalregions.Theprocesswouldbedisruptedat thepark/urbanscalebyanysignificantground-levelwindspeeds.
Afocusonsurfaceorairtemperaturesneglectsthefulleffectsofsummerconditions onhumanthermalcomfort.Thehumanenergybalancethatcontrolsthermalcomfort(for aparticularlevelofphysicalactivity)dependsonthecombinedeffectofairtemperature, humidity,airvelocity,and,mostimportantlyforoutdoorenvironments,themeanradiant temperature.Inoutdoorsettings,themeanradianttemperatureisafunctionoftheintensity ofsolarradiation,includingitseffectsonre-radiationfromadjacentsurfaces.Thisisthe majorfactorinfluencingheatstresslevelsforpeopledirectlyexposedtothesuninlocations withhighdirectnormalradiationinpeaksummerconditions,suchasPerth.Inthisstudy, thePhysiologicalEquivalentTemperature(PET)isusedasthemeasureofthermalcomfort, whichincludesthefullrangeofvariablesofinterest.
1.3.ResearchQuestions
Inordertoidentifytherelevanceofthispreviousworkforevolvingclimateconditions inPerth,Australia,andtheirimplicationsforurbanandlandscapedesign,inthisarticle, weseektoresolvethefollowingquestions:
1. WhatarethefactorsthatcontroltheurbanmicroclimateofPerthwithintheexisting urbanform?
2. WhatarethevariablesinPerththatarerelevanttourbandesignandhumanthermal comfort?
3. TowhatdegreedoparksinPerthprovidecooling,eitherinternallyorinsurrounding areas,inhotsummerconditions?
Toanswerthesequestions,thisstudycomparestheresultsofacommonlyusedmethod toevaluatethePCI(satellite-derivedlandsurfacedata)withfieldmeasurementsofsurface, airtemperature,andrelativehumidity,andtheresultsofmicroclimatesimulationsoftware (ENVI-met).
2.MaterialsandMethods
ThisstudyexaminedthelikelyPCIeffectsinparkcasestudies(n=3)inPerth, WesternAustralia,acityof2.4millionpeoplestretchingsome125kmfromnorthto southonacoastalplain.Perthhasahot-summerMediterraneanclimate(Köppenclimate classificationCsa)andreceivesmoderate,highlyseasonalrainfall,predominantlyduring winter.Summersaregenerallyhotanddry,lastingfromDecembertoMarch,andcancause extremeheateventsthatposeriskstoexposedpopulations’health.Researchhasindicated thatPerthhasexperiencedmorefrequent,longer,andhotterheatwavesinthetwenty-first century[29].
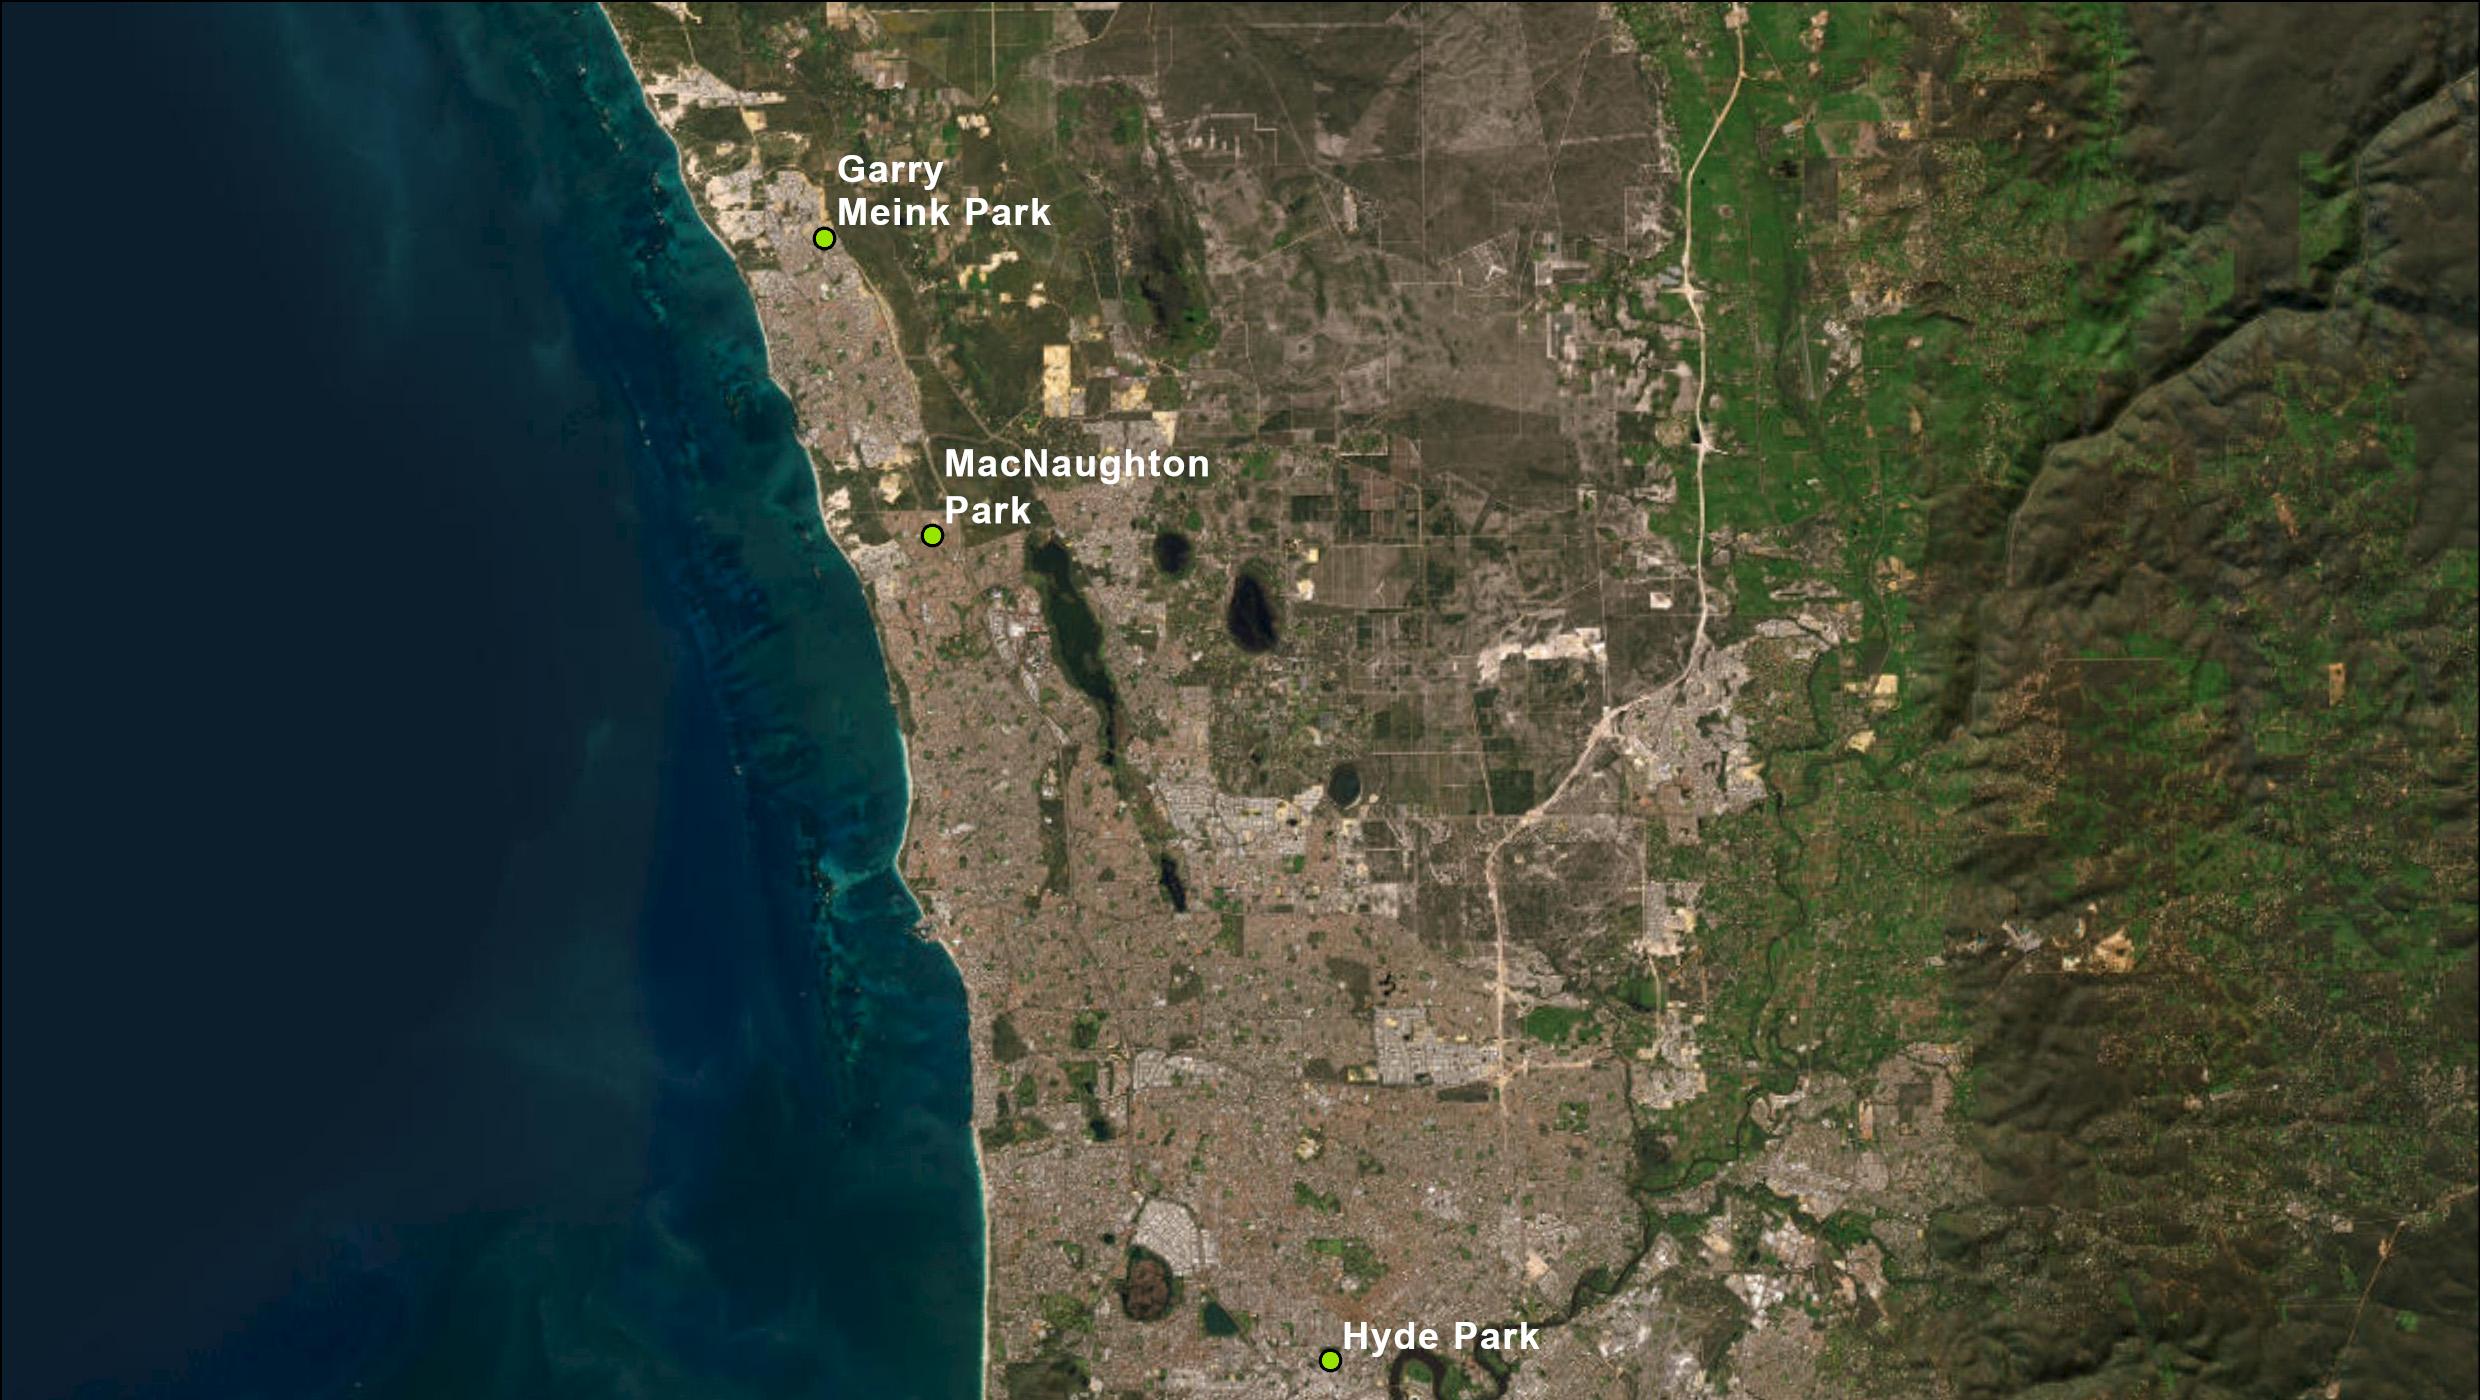
ThecasestudyparksacrossPerth(Figure 4)representdifferentprevailingtheories forPOSprovisionandneighbourhooddesigninthesurroundingarea.Inbrief,eligible parkcasestudiesweresituatedinpredominantlyresidentialareas.Thecasestudiesare discussedinrelationtotheirrespectivelandscapeandurbandesigntheoriesbelow.

2.1.TheCaseStudyParks
2.1.1.GarryMeinckPark,Butler
ThesuburbofButlerinPerth’snorthhasapopulationdensityof2450people perkm2 [30]andreflectsthecurrent‘LiveableNeighbourhoods’designcodegoverninggreenfielddevelopmentinWesternAustralia[31].FollowingNewUrbanistthinking, thispolicycallsforacompactsuburbanlayoutcomprisingsmalllots(averaging300m2) withhighsitecoveragebyhousesatadensityofabout30dwellingsperhectare,interspersedwithsmalleryetaccessibleneighbourhoodparks[31].Duetohighsitecoverage bybuildings,smalllotsandjuveniletreespecimens,thesecasestudieshaveminimal urbancanopycoveronprivateland.Comparativelynarrowroadsectionsandtheconstraintspresentedbyserviceinfrastructurehavealsoresultedinminimaltreecanopycover instreets.
WithinButler,GarryMeinckPark(Figure 5)isdesignatedasa‘NeighbourhoodPark’ withintheWesternAustralianclassificationframeworkforpublicopenspace[32].The landscapingoftheseneighbourhoodparksconsistsofareasofirrigatedandnon-irrigated lawns,mulch,andpavingwithsomefringingtrees.GarryMeinckParkisaround1.3ha, withacanopycoveroflessthan5%andagrasscoverofaround20%.Typicaltreetypes inGarryMeinckParkincludednativespeciessuchas Eucalyptusgomphocephala, Agonis flexuosa, Corymbiacalophylla,and Melaleucaquinquenervia.
Figure5. GarryMeinckPark(picturedinthecentreoftheimage)consistsofareasofirrigatedand non-irrigatedlawns,mulch,andpavingwithsomefringingtrees.
2.1.2.MacnaughtonPark,Kinross
The1990ssuburbofKinrosshasapopulationdensityof2395peopleperkm2 [30]. Kinrossreflectsplanningforsemi-compactsuburbs,comprisinghousingatadensityof 25dwellingsperhectare,withanaveragelotsizeof350m2 andhighsitebuildingcoverage, resultinginminimaltreecanopycoveronprivatelots.Duetocomparativelynarrowroad sectionsandtheconstraintspresentedbyserviceinfrastructure,thestreetsinthecasestudy alsohaveminimaltreecover.MacnaughtonPark(Figure 6)isadesignated‘Neighbourhood Park’withintheWesternAustralianclassificationframeworkforpublicopenspace[32].
Thecasestudyparkhas,inpart,resultedfromgovernmentpolicyaimedatprotecting bushlandinthePerthregion[33].Inadditiontoretainedbushlandtothewestandsouth, andstandsofremnanttreestotheeast,the4.6haparkalsocontainsanirrigatedoval andclubrooms.Typicaltreesarenative,including Agonisflexuosa, Xanthorrhoeapreissii, Allocasuarina spp.and Eucalyptus,withacanopycoverof13.8%andagrasscoverof33%.
Figure6. MacNaughtonPark(picturedinthecentreoftheimage)containsanirrigatedovaland clubroomswithretainedbushlandtothewestandstandsofremnanttreestotheeast.
2.1.3.HydePark,Highgate
TheinnermixedzoneofHighgatehasapopulationdensityof4008peopleperkm2 [30] andcompriseslatenineteenth-centuryinner-citysuburbsthatfringethePerthCentral BusinessDistrict.Varioushousingtypesincludelatenineteenthandearlytwentieth-century workers’cottages,grandFederationhousesandsignificantapartmentdevelopmentsfrom the1960sand1970s.Treecanopycoveronprivatelotsisgenerallylowduetohighbuilding cover,butitisreasonableonthestreets.ThisurbanformsurroundsHydePark,aproduct ofthepublicparksmovement,whichsawmunicipalparks(suchasOlmsted’sandVaux’s designofNewYork’sCentralPark)beingestablishedinthemid-nineteenthcenturyin majorcitiesasawayofimprovinglivingconditionsinovercrowdedandquicklygrowing industrialcities[34].HydeParkreflectssuchelaboratelylandscapedparksofthelate nineteenthcenturyandcompriseswalkingpathsshadedbyavenuesoftreesencircling acentrallake(andonceawetland)(Figure 7).The16haparkhasacanopycoverof 59.5%andagrasscoverof18.7%.Treesaretypicallyexoticandinclude Platanusacerifolia, Ficusmacrophylla, Washingtoniafilifera and Jacarandamimosifolia.HydeParkisadesignated ‘RegionalPark’withintheWesternAustralianclassificationframeworkforpublicopen space[32].
2.2.MicroclimaticCaseStudyData
Microclimatedataforthecasestudysiteswerecollectedandanalysedfromthreecontrastingsources:remote-sensedlandsurfacetemperaturedata[35],on-sitemeasurements, and(forHydePark)ENVI-metmicroclimaticmodelling[36](Table 1).TheENVI-metmodel
simulatedanaveragesummerdayandprovidedoutputsforlandsurfacetemperature,air temperature,andthePhysiologicalEquivalentTemperature(PET)thermalcomfortindex. AsPETincludesradiation,afactornotdirectlycapturedbyairorsurfacetemperature,it offersamorecomprehensivemeasureofhumanthermalcomfort.
Figure7. HydePark(picturedinthecentreoftheimage)compriseswalkingpathsshadedbyavenues oftreesencirclingacentrallake(andonceawetland).
Table1. Microclimatedatasourcesutilised.
MicroclimateDataSource GarryMeinckPark,Butler MacnaughtonPark,Kinross HydePark,Highgate
Measuredlandsurface temperature
Measuredairtemperature
Measuredrelativehumidity
Landsat8landsurface temperatures
ENVI-metlandsurface temperatures
ENVI-metairtemperatures
ENVI-metPhysiologically EquivalentTemperatures(PET)
2.2.1.Remote-SensedLandSurfaceTemperatureData
LandsurfacetemperaturemapsweregeneratedforallAustraliancitiesusingLandsat 8thermalinfraredsensor(TIRS)band10dataoverthesummerof2018–2019[35].Land surfacetemperatureswerecollectedforPerthonthe14December2018andthe21January 2019;bothdateswerecloud-freeandhadmaximumtemperaturesof39.1 ◦Cand29.8 ◦C, respectively[37].
2.2.2.MeasurementsofLandSurfaceTemperature,AirTemperature,and RelativeHumidity
Landsurfacetemperature,airtemperature,andrelativehumidityweremonitored insideandadjacenttoeachpark.Measurementsweretakenevery25m,formingatransect thatextendedapproximately200moneithersideofthepark.Eachsetofmeasurements wastakenonapproximatelyaveragesummerdays,withanovernightminimumbelow 20 ◦C,amaximumaround30 ◦C,andclear,sunnyconditions.Threesetsofmeasurements weretaken:at7:00–8:00am,2:00–3:00pm,and7:00–8:00pm(herebyreferredtoasmorning, afternoon,andeveningmeasurements).
Instrumentsweremountedonatrolley,whichwasusedtoensurethatmeasurements couldbecompletedquickly,minimisingtheeffectsofchangingconditionsastheday progressed.TemperatureandrelativehumidityweremeasuredwithaSauermannSi-HH3 thermo-hygrometermanufacturedinMontpon-Ménestérol,France,whilelandsurface temperaturesweremeasuredwithaTopdonTC-003thermalcamera,manufacturedin Shenzhen,China.Thethermo-hygrometerwasshieldedfromsolarradiationtoensure directsunlightontheprobedidnotimpactairtemperaturereadings.
TemperatureandhumidityvaluesfromBureauofMeteorology(BOM)measurement sitesinPerthwereusedtoadjustforchangesinthemacroweatheraseachcollectionevent progressed.
2.2.3.ENVI-MetMicroclimateModellingofLandSurfaceTemperature,AirTemperature andPhysiologicalEquivalentTemperature
MicroclimatemodellingwasconductedforHydeParkusingtheENVI-metsoftware version5.0[36].ENVI-metisathree-dimensionalsoftwaremodelforsimulatingurban environmentsthatincorporatescomputationalfluidmechanics,thermodynamics,and atmosphericphysics.Allbuildings,surfaces,andvegetationweredigitisedinArcMap 10.8.2.Thisprocessinvolvedidentifyingthematerialproperties,comparingthemwiththe software’sdefaultoptions,andcreatinganyrequiredcustommaterials.TheassignedIDs forthesematerialswerethenusedduringthedigitisationprocessinArcMap.Vegetation modellingincludedthedigitisationofgrass,shrubs,andtrees.Sincethedefaultsoftware librarydoesnotincludetreesfromtheSouthernHemisphere,thesewereclassifiedand createdusingtheENVI-metAlberoprogrammebasedonspecificattributessuchasheight, crownheightandwidth,trunkheight,treecalendar,andleaftypeandpositioning,resulting in30differenttreetypes(Table 2).ThefinalmodelwasexportedusingQGISversion3.34.8.
Table2. ENVI-metmodellingandsimulationinputparameters.
DomainSize500 × 500 × 50(Height)
Gridspatialresolution: 2m
Meteorology: FullforcingusingEPWfile+enabledIVSradiation.
Buildings:(defaultbuilding)moderateinsulationwall, betweenandbelowbuildings:Pavement(concrete)
Soils:Defaultunsealedsoil(Sandysoil),sandysoilplaced belowsimpleand3Dvegetation
Modellingfeatures:
Surfaces:Asphaltroad,woodchipmulch,lightconcrete pavement
Vegetation(2D):non-irrigatedgrass:2cm Trees(3D):Simplifiedto11differenttreesindifferentsizes (intotal30)
Duration: 14h
TheweatherconditionssetasinputstotheENVI-metmodelswere‘epw’filesproducedbytheCommonwealthScientificandIndustrialResearchOrganisation(CSIRO). CSIROtypicalmeteorologicalyear(TMY)filesarebasedonhistoricalweatherdatadrawn fromtheyears1990to2015.Thesimulationrunsfor14honan‘average’summerday, selectedtostatisticallybestmatchthecombinationofhourlyaveragedrybulbtemperature andrelativehumidity.Theselecteddayis9January1998.
SurfaceandairtemperaturemapsweregeneratedusingtheENVI-metLeonardo programmetocomparethemicroclimaticconditionswithinparksandtheirsurrounding environment.ThehumanthermalcomfortindexwascalculatedusingtheENVI-met BioMetprogramme,apost-processingtoolthatcalculateshumanthermalcomfortindices fromENVI-metoutputfiles.PETreflects‘ theairtemperatureatwhich,inatypical indoorsetting(withoutwindandsolarradiation),theheatbudgetofthehumanbodyis balancedwiththesamecoreandskintemperatureasunderthecomplexoutdoorconditions tobeassessed’[38].ThePETindexaccountsforthecombinedeffectonhumanphysiology arisingfromairtemperature,meanradianttemperature,windspeed,andvapourpressure (i.e.,ameasureofhumidity),dependingonclothingandmetabolicrate(Figure 8)[38]. ENVI-metproducescalculatedvaluesofPETfromarefinedsetofequationsderivedfrom WaltherandGoestchel[


Figure8. ThePETindexaccountsforthecombinedeffectonhumanphysiologyarisingfrom airtemperature,meanradianttemperature,windspeed,andvapourpressure(i.e.,ameasureof humidity).
3.Results
Microclimatedataforthecasestudysitesaresetoutbelow,includingon-sitemeasurementoflandsurfacetemperature,airtemperature,relativehumidity(%),remotelysensed landsurfacetemperaturedata[35],andENVI-metmicroclimaticmodellingforthefinal HydeParkcasestudy[36].
3.1.WeatherData
Thefielddatawascollectedduringsummerdaysthatwerebroadlyrepresentative ofaverageconditions.Table 3 comparestheairtemperatureandrelativehumiditydata fromthenearestBureauofMeteorologyweatherstationwiththeselectedaveragesummer dayduringthedatacollectionperiod.Morningtemperatureswerebroadlyrepresentative ofaverageconditions,whileafternoontemperaturesweremarginallycoolerthanaverage fortheGarryMeinckandMacNaughtonParkdatacollectiondays.Windspeedsinall casesrepresentedaveragePerthsummerdayswitheast–southeastbreezesinthemorning, whichswingtocoastalseabreezefromthesouthwestintheafternoons.
Table3. Weatherconditionsduringfielddatacollection.
AverageSummerDay (9January1998)
GarryMeinckPark (28February2025)
MacNaughtonPark (14February2025)
HydePark (1March2025)
Drybulb temperature(◦C) Morning18.918.221.319.1
3.2.MicroclimateDataforGarryMeinckPark,Butler
Thefigurebelowshowsthemeasuredlandsurfacetemperature,airtemperature andrelativehumidityfortheGarryMeinckParkcasestudy(Figure 9).Thelandsurface temperaturesoftheirrigatedturfwithintheparkaresubstantiallycoolerinthemiddle oftheday,andtoalesserextentinthemorningandevening.Airtemperaturesare generallyconsistentbetweentheparkandtheurbancatchment.Relativehumiditylevels areconsistentbetweentheparkandtheurbancontextinthemorningandevening,witha markedincreaseinhumidityinthepark(andtothesouthofthepark)inthemiddleofthe dayduetothearrivalofaseabreezeduringthemeasurementprocess.
012345678910111213141516171819
Measurement point
Gary Meinck Park: Air temperature 7-8am 2-3pm 8-9pm
Gary Meinck Park: Relative humidity 7-8am 2-3pm 8-9pm
012345678910111213141516171819
Measurement point
Figure9. GarryMeinckParklandsurfacetemperature,airtemperatureandrelativehumidity obtainedfromfieldmeasurementstakenatthepointsidentifiedontheplan(seeSection 2.2.2).The greenboxonthegraphsdenotestheparkextents.Airtemperaturesaregenerallyconsistentbetween theparkandtheurbancatchment.
Thefigurebelowcomparestheremotelysensedandmeasuredlandsurfacetemperatures[35]fortheGarryMeinckParkcasestudy(Figure 10).Thelandsurfacetemperatureis approximatelytheaverageofthedaytimemeasuredtemperaturesinFigure 9.Anegligible landsurfacetemperaturedifferenceisrecordedbetweentheparkandtheurbancatchment intheremotelysenseddata.
Garry Meinck Park: Surface temperature
Measurement point
Remote sensed Measured
Figure10. GarryMeinckParkremote-sensedlandsurfacetemperaturedataobtainedfromLandsat 8data(seeSection 2.2.1)comparedtofield-measuredresultstakenatthepointsidentifiedonthe plan.Anegligiblelandsurfacetemperaturedifferenceisrecordedbetweentheparkandtheurban catchmentintheremotelysenseddata.Note,thegreenboxonthegraphsdenotestheparkextents.
3.3.MicroclimateDataforMacnaughtonPark,Kinross
Thefigurebelowshowsthemeasuredlandsurfacetemperature,airtemperatureand relativehumidityfortheMacNaughtonParkcasestudy(Figure 11).Theirrigatedturf
oftheoval(left-handgreenboxongraph)providessubstantialcoolingoflandsurface temperaturesinthemiddleoftheday;however,thiscoolingeffectissubstantiallylower inthemorningandevening.Notably,theareaofnon-irrigatedbushland(right-hand greenboxonthegraph)ishotterinthemorningandmiddaythanthesurroundingurban context.Theirrigatedovalareaoftheparkprovidessomecoolingofairtemperatures inthemiddleoftheday,andnoneintheevening.Notably,theairtemperaturesinthe irrigatedsectionoftheparkareslightlywarmerintheearlymorningrelativetotheurban context.Thenon-irrigatedbushlandareaoftheparkexperienceswarmerairtemperatures intheafternooncomparedtothesurroundingurbancontext.Theirrigatedovalinthepark resultsinasubstantialincreaseinrelativehumidityduringthemiddleoftheday;however, thenon-irrigatedareaissimilartotheadjacentstreets.
Figure11. Cont.
024681012141618202224262830
Measurement point
MacNaughton Park: Surface temperature 7-8am 2-3pm 8-9pm
MacNaughton Park: Air temperature 7-8am 2-3pm 8-9pm
024681012141618202224262830
Measurement point
MacNaughton Park: Relative humidity 7-8am 2-3pm 8-9pm
Figure11. TheMacnaughtonParkcasestudylandsurfacetemperature,airtemperature,andrelative humiditywereobtainedfromfieldmeasurementstakenatthepointsidentifiedontheplan(see Section 2.2.2).Thegreenboxdenotestheparkextents.Theirrigatedovalareaoftheparkprovides somecoolingofairtemperaturesinthemiddleoftheday,andnoneintheevening.
Figure 12 comparestheremotelysensedandmeasuredlandsurfacetemperaturedata fortheMacnaughtonParkcasestudy.Again,thelandsurfacetemperatureisapproximately theaverageofthedaytimemeasuredtemperaturesinFigure 11.Aminorreductioninland surfacetemperatureisrecordedontheirrigatedoval.
3.4.MicroclimateDataforHydePark,Highgate
Thefigurebelowshowsthemeasuredlandsurfacetemperature,airtemperature andrelativehumidityfortheHydeParkcasestudy(Figure 13).Intermsoflandsurface temperatures,theparkprovidessubstantialcoolingduringthemiddleoftheday;however,
ithaslittleeffectoncoolinginthemorningorevening.Inrelationtoairtemperatures, theparkprovidesthegreatestcoolingintheafternoonandtoalesserextentintheearly morning.Intheevening,theparkdoesnotprovidecoolinginrelationtoairtemperatures. Levelsofrelativehumidityareelevatedinthepark,particularlyduringthemiddayhours, duetothelake.Evaporativecoolingfromthelakeisalsolikelytocontributetothelower airtemperatures.
MacNaughton Park: Surface temperature
Measurement point)
Remote sensed Measured
Figure12. SurfacetemperaturedatafortheMacnaughtonParkcasestudyobtainedfromLandsat 8data(seeSection 2.2.1)comparedtofield-measuredresultstakenatthepointsidentifiedonthe plan.Aminorreductioninlandsurfacetemperatureisrecordedontheirrigatedovalintheremotely senseddata.Note,thegreenboxonthegraphsdenotestheparkextents.
024681012141618202224262830
Measurement point
Hyde Park: Surface temperature 7-8am 2-3pm 8-9pm
Hyde Park: Air temperature 7-8am 2-3pm 8-9pm
024681012141618202224262830
Measurement point
Hyde Park: Relative humidity 7-8am 2-3pm 8-9pm
024681012141618202224262830
Measurement point
Figure13. Cont.
Figure13. TheHydeParkcasestudylandsurfacetemperature,airtemperature,andrelativehumidity wereobtainedfromfieldmeasurementstakenatthepointsidentifiedontheplan(seeSection 2.2.2). Theparkprovidesthegreatestcoolinginrelationtoairtemperaturesintheafternoonandtoalesser extentintheearlymorning.Note,thegreenboxonthegraphsdenotestheparkextents.
Remote-sensedlandsurfacetemperaturesfortheHydeParkcasestudyreveallower temperaturesinthepark(Figure 14),butaconsiderablysmallertemperaturedifference betweentheparkandurbancatchmentcomparedtothosemeasuredduringthemiddleof theday(Figure 13).Again,theremotelysenseddatagenerallyreflectstheaverageofthe measureddata.
Thefollowingfigurescomparemicroclimaticdatafromon-sitemeasurement,remote sensing[35],andENVI-metmodelling[36].
Figure 15 comparestheremotelysensedlandsurfacetemperaturedata,themeasured landsurfacetemperatures,andtheENVI-metmodelledlandsurfacetemperaturedatafor anaveragesummerdayintheHydeParkcasestudy.Theresultsaresimilarwithinthe park.However, ∆Ts (betweentheunshadedareasoftheparkandstreet)islessthanthat inthemeasuredlandsurfacetemperaturedata.Themeasuredlandsurfacetemperatures showgreatervariabilitybutgenerallycorrelatewiththosemodelledinENVI-met.
Hyde Park: Surface temperature
024681012141618202224262830
Figure14. Cont.
Figure14. Remote-sensedlandsurfacetemperaturesfortheHydeParkcasestudyreveallower temperaturesinthepark,butaconsiderablysmallertemperaturedifferencebetweentheparkand urbancatchmentcomparedtothosemeasured.Note,measurementsoflandsurfacetemperature weretakenatthepointsidentifiedontheplan.
Surface temperature: Afternoon
Measurement point
Measured ENVI-met Remote sensed
Figure15. HydeParkmeasured,remotelysensedandENVI-metmodelledlandsurfacetemperature data.Note,thegreenboxdenotestheparkextents.
Figure 16a–cpresentstheHydeParkENVI-metmapofairtemperature,incorporating measureddatathroughouttheday.ThefigureshowsthatENVI-metprojectscoolairto thenorthoftheparkalongawindpaththroughadvection(thewindat07:00isalight breezefromthesouthat2.5m/s),alsonotingthatwarmairenterstheparkfromthesouth. However,theairisonlyfractionallycooler(lessthan1 ◦C),andtheeffectdiminishesduring theday.Byevening,thereisnodetectableeffect.TheseresultsconfirmthatwhilethePCI isarealphenomenon,themagnitudeintermsofairtemperaturesisminor,andthePCD effectislimited.Figure 16d–fcomparestheENVI-metsimulatedairtemperature.


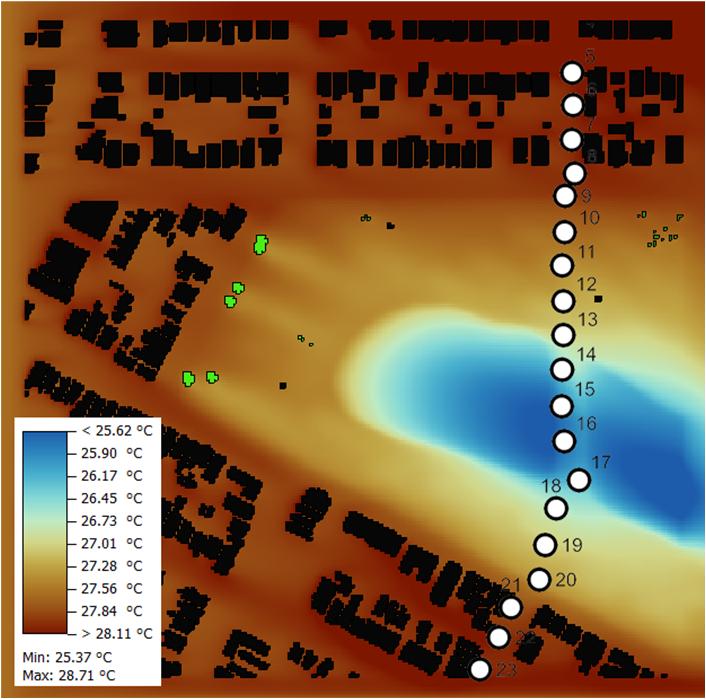
Figure16. HydePark(a–c)ENVI-metmapsofairtemperature,(d–f)comparisonswithmeasured data(note:thetemperaturescalevariesintheENVI-metmaps).Thegreenboxdenotesthepark extents.
Figure 17 setsouttheENVI-metPEToutputsforHydePark.PETlevelsaregenerally consistentbetweentheparkandtheurbancontext,exceptundertreecanopies.
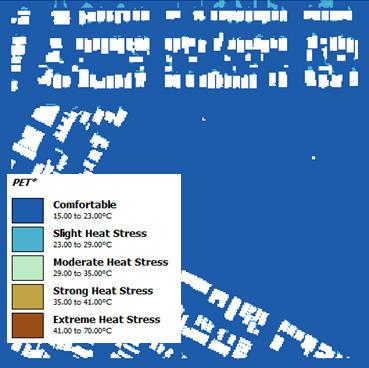
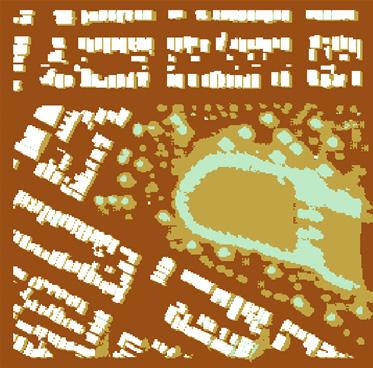
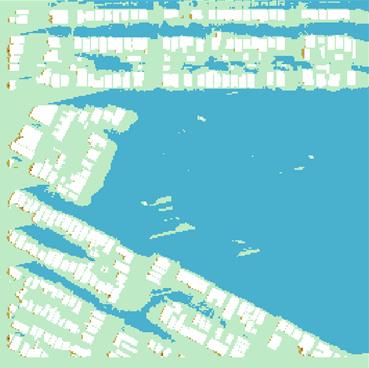
Figure17. HydeParkENVI-metPETresultsin(a)morning,(b)afternoonand(c)evening.PET* levelsaregenerallyconsistentbetweentheparkandtheurbancontext,exceptun-dertreecanopies.
4.Discussion
4.1.ParkCoolIslandEffects
Thedatapresentedaboveindicatethatwhilethecasestudyparksurfaces(particularly grass)havecoolerlandsurfacetemperaturesinthemiddleofthedaythansurrounding areas(positive ∆Ts of10–15 ◦C)whendirectsolarradiationismostimpactful,theeffect diminishesbyevening,andbymorning,itisnotevident. ∆Ts valuesintheeveningare similartothosereportedbySpronken-SmithforaparkinVancouver[11].
Regardingairtemperatures,theafternoon ∆Ta issignificantlysmallerthan ∆Ts,even intheafternoon(approximately2 ◦C),andislargelyabsentintheeveningsandmornings. AtMacNaughtonPark,morningTa isslightlyhigherthanthepark’ssurroundings,asis afternoonTa onthesandysoilsurfaceofthepark.
Spronken-Smith[11]reporteda ∆Ta ofaround2 ◦Catbothdaytimeandnighttimefor 10parksinVancouver,and1.2–2.4 ◦C(daytime)and2.4–3.3 ◦C(nighttime)for10parks inSacramento,withbothsetsofdatafromAugust.Sugawara[23]reported ∆Ta values rangingfrom0.5to1.8 ◦C(nighttime)and1to1.6 ◦C(middleoftheday)over72days insummerconditionsinTokyo.Thoseresultsareverysimilartothosereportedherefor daytime ∆Ta butvaryforothertimes.
TheHydeParkENVI-metdatashowthattheafternoonTa inmostoftheparkis similartothatoftheadjacentstreetscape,andinsomeexposedareas,itisevenhigher. AfternoonTa isaround2–3 ◦Clowertothenorthofthelake,wherethewaterleadstosome evaporativecooling.Also,thatmorning,Ta wasrelativelywarmerinthislocationdueto theretainedheatinthelake.
Otherstudieshaveidentifiedthatthecoolairinparksproduceslowerairtemperatures inadjacentstreetscapes.Spronken-Smith[11]reportedaPCDofapproximately75min theVancouverstudy,andSugawara[23]reportedPCDsrangingfrom31to120minthe Tokyostudy.Thateffectisnotevidentinthedatasetsreportedhereforanycasestudy parkatanytimeofday,irrespectiveoftheirsize.Indeed,Figure 16 showsthatENVI-met projectscoolairtothenorthoftheparkalongawindpaththroughadvection(thewind at07:00isalightbreezefromthesouthat2.5m/s),alsonotingthatwarmairentersthe parkfromthesouth.However,theairisonlyfractionallycooler(lessthan1 ◦C),andthe effectdiminishesduringtheday.Byevening,thereisnodetectableeffect.Theseresults confirmthatwhilethePCIandPCDarerealphenomena,theirmagnitudeintermsofair temperaturesidentifiedinthisstudyisminor.
4.2.CorrelationsBetweenRemotelySensed,Measured,andModelledClimateData
4.2.1.Remote-SensedandMeasuredLandSurfaceTemperatures
Comparisonsofremotelysensedlandsurfacetemperatures(whichreflectafternoon conditions)withmeasureddata(Figure 15)illustratethatremotelysensedlandsurface temperaturestendtoslightlyunderestimatestreetscapelandsurfacetemperatures(Ts) andslightlyoverestimateTs withinparks.Remote-sensedlandsurfacetemperaturesalso donotaccuratelydelineateparkboundariesforthesmallerparks.Coolerlandsurface temperaturesevidentthroughmeasurementinGarryMeinckPark,whichisonlyaround 75minwidth,arenotreflectedintheremotelysensedlandsurfacetemperaturedata (Figure 10).
Theseobservationsareconsistentwiththefactthattherawdatafromwhichthe remotelysensedlandsurfacetemperaturemapsareproducedhavearesolutionof100m andhencecannotidentifysmall-scalelandsurfacetemperaturedifferentials.Forexample, remotelysensedlandsurfacetemperaturesunderestimategenericurbanformTs values duetotheaveragingofhigher-temperatureimperviousstreetscapesurfacesandlowertemperaturevegetatedspacesinvergesandyards.
Therefore,theuseofremotelysensedlandsurfacetemperatureisoflimitedvalue inurbanstudiesattheneighbourhoodscaleduetothelimitationsoftherawTIRSdata’s resolution[10].Theresamplingprocessusedtoproduce30mresolutionimagesinevitably averagesactualTs values,resultinginunderestimatesingeneralurbanformandoverestimatesin(allbutlarge)parks.
4.2.2.ENVI-MetSurfaceandAirTemperatures
TheHydeParkENVI-metmodelinputisbasedonan‘epw’filerepresentingaverage summerconditions,somacro-scaleairtemperaturesarenotidenticaltothosemeasured fromthenearestBureauofMeteorologyweatherstationduringdatacollection.However, theyareverysimilarduringtheday(seeTable 4).Table 3 indicatesthatthemeasuredTa is similartotheENVI-metweatherfileinthemorningsandafternoons,butslightlyhigherin theevenings.
Table4. Ta (◦ C)measuredandENVI-metinputweatherdatafortheHydeParkcasestudy(averaged forthehoursinwhichdatawerecollected).
MeasuredENVI-MetWeatherFile
TheHydeParkENVI-metmodelshowsreasonableagreementbetweenmodelledand measureddatainrespectofbothairandsurfacetemperature.Outsidetheparkperimeter, themodelledTs values(Figure 15)aresomewhatlowerthanthemeasureddata.There isslightlymorevariancewithinthepark,butthiscanbeattributedtothemodelsurface beinggrassratherthantheactualsurface,whichisasphaltpaving.TheENVI-metand measuredTsresultswithintheparkaresimilarintheafternoon,illustratingtheoverriding impactofsurfacesshadedfromdirectsolarradiation.
Theairtemperatures(Ta)(Figure 16d–f)aresimilarbetweenthedatasets.TheENVImetresultsareslightlylowerinthemorning,almostidenticalintheafternoonandslightly higherintheevening.Thissituationprimarilyreflectsthemacro-scaledifferencesoutlined inTable 3
Thedifferencesbetweenparksandsurroundingswithrespecttosurfaceandair temperatureresultsarebroadlysimilartothefindingsofotherresearchers,includingthose referencedintheintroductiontothisarticle[22,23].Thekeyquestionistheirrelevanceto humanthermalcomfort.
4.2.3.ThermalComfortModelling
Asdescribed,thePhysiologicalEquivalentTemperature(PET)indexaccountsfor thecombinedeffectonhumanphysiologyarisingfromairtemperature,meanradiant temperature,windspeed,andvapourpressure(i.e.,ameasureofhumidity)[38].Mean radianttemperature(MRT)isasummationofradiativeeffectsfrombothdirectanddiffuse (short-wave)andindirect(long-wave)radiation.Directsolarradiationisbyfarthelargest contributiontoMRTinsummerdaytimeconditionsinPerth,andhence,PETisdominated bythisexposure.ThissituationisstarklyevidentfromtheafternoonPETresultsin Figure 17,whichshowstrongtoextremeheatstressinthepark,exceptintheshadeof thetrees.Exceptinthoselocations,thePETisnodifferentfromthesurroundingurban areas.Exposuretodirectsolarradiationcompletelyoverwhelmsanyminorreductionin airtemperatureinthepark.Thethermalcomfortbenefitsofferedbytheparkareevidentin
theevenings,wherethePETislowerthaninthesurroundingareaduetolowerTa inthe absenceofsolarexposure.
ThisanalysisraisesquestionsabouttherelevanceofTa andTs inrelationtotheurban microclimateandtheirimpactonoutdoorhumanthermalcomfort.Asillustratedhere andinotherstudies,thetemperatureofurbansurfaces(Ts)isnotagoodindicatorofnearsurfaceairtemperature(Ta),norisitagoodindicatorofhumanthermalcomfort,which reflectsexposuretodirectandindirectradiation,humidityandwindandatthehottest timeofdayinsummerisdominatedbydirectexposuretosolarradiation.Theseresults confirmthatwhilethePCIisarealphenomenon,themagnitudeiscomparativelyminor (∆Ta ≈ 2 ◦C)andisoflimitedrelevancetohumanthermalperceptioninsolar-exposed locationsduringaveragesummerdaytimeconditionsinclimatessuchasthatofPerth.By far,themajorbenefitofferedbyparksistheshadeprovidedbytrees,asisevidentfromthe PETmapsofHydePark(Figure 17).
Similarly,PCDisoflittlerelevancetotheplanninganddesignofurbanareas.Although itwasnotevidentinthemeasurementandmodellingreportedhere,evenwhenidentified inotherstudies,theextentofinfluenceonTawasminorandlimitedtoapproximately 120m.
4.3.ResearchFindings
Thestudyidentifiesthatitisthedirectandindirecteffectsofsolarradiationinthe formofmeanradianttemperature(MRT)thathavethemajorinfluenceontheurban microclimateinPerthsummerdaytimeconditions(researchquestion1).Thisvariablehas agreaterimpactonhumanthermalcomfort(asmeasuredbyPET)thanairtemperature insolar-exposedlocations.SurfacetemperatureinfluencesMRTbutinitselfisnotagood indicatorofthermalcomfort(researchquestion2).Inrelationtomeasuredairtemperatures, onlytheHydeParkcaseprovidessomecoolingintheafternoonand,toalesserextent, intheearlymorning.WhilePCIisbrieflyobservableinthisstudyintheHydePark simulation,itisnotmeasurableinthehottestpartofthedayorinthedatacollectedfrom fieldmeasurements(researchquestion3).
Regardless,urbanparksareveryimportantelementsoftheurbanfabricforamultitude ofreasons[40].AsthisstudyofdifferentparktypologiesinPerth,Australia,illustrates,it islargelythecontinuousshadeprovidedbytreesthatprovidesanybenefit,asillustrated bythecorridoroftreessurroundingHydeParkLake(seeFigure 17b).Therefore,the adaptationofparks(andurbanareasmoregenerally)toamelioratedaytimesummer conditionsrequiresthecreationofacontinuoustreecanopy,ideallyonparks,streetscapes andprivatelotsinaninterconnectednetwork.Oneofthedangersofasingularfocuson ParkCoolIslandeffectsisthaturbanplannersanddesignersdiscounttheimportanceof outdoorthermalcomfortinstreetscapesandprivatelots,aswellastheneedforconnected urbangreeningmoregenerally.
4.4.Limitations
Thefindingsofthisstudy,focusingonPerth,WesternAustralia,areofmostrelevance tolocationswithsimilarMediterraneanclimatesandhighlevelsofsolarirradiationin summer.Otherlocationswillexhibitadifferentbalancebetweenairtemperatures,humidity andmeanradianttemperaturesandhenceresultindifferentlevelsofthermalcomfortin parkenvironments.
WhiletheENVI-metmodellingisonlyreportedforHydeParkinthispaper,ithasbeen usedbytheauthorstomodelseveralotherparksinPerthandotherlocationsinWestern Australia,whichwillbereportedinafuturearticle(presentlyunderreview).Theresults fromthosestudiesmirrorthefindingsreportedhere.HydeParkexhibitedthelargestPCI
effectandwaschosenforfurtheranalysisinENVI-mettounderstandthedynamicsofthe effectinmoredetail,giventhattheothercasestudieshadnegligiblePCIeffects.
Finally,themeasurementofPCIeffectsinthisstudyisbasedonthreetimepoints.Futureresearchinthisareacouldutilisecontinuousdiurnalprofilestoillustratethetemporal evolutionofthePCIeffect.
5.Conclusions
Themajorfactorthatgivesrisetothemicroclimaticconditionsinurbanareasisthe modificationofthemacroclimaticimpactsofsolarradiation,airtemperatures,andwind speedsanddirectionbybuildings,artificialsurfaces,andvegetation.Thetemperatureof surfacesandnear-surfaceairinanyparticularlocationresultsfromthecomplexinteraction betweenthesefactors.WhileTa isimportantforhumanthermalcomfortwhensolar radiationisabsent,itismuchlessinfluentialatthehottesttimesofsummerdaysinwarm tohotclimatessuchasPerth.Accordingly,variablessuchasthePETaremuchmore relevanttoestimatingtheimpactofurbandesignandparksonhumanthermalcomfortin summerconditions.Giventheimportanceofsolarradiationtohumanthermalcomfort, theadaptationofparks(andurbanareasmoregenerally)toamelioratedaytimesummer conditionsrequiresthecreationofacontinuoustreecanopy,ideallyoverparks,streetscapes, andprivatelotsinaninterconnectednetwork.
AuthorContributions: Conceptualization,B.G.,J.B.andM.B.;methodology,B.G.,J.B.andM.B.; software,B.G.andM.B.;validation,B.G.;formalanalysis,B.G.andJ.L.;investigation,B.G.,J.L.and M.B.;resources,J.B.;datacuration,B.G.;writing—originaldraftpreparation,B.G.,J.B.andM.B.; writing—reviewandediting,B.G.,J.B.andM.B.;visualization,B.G.andJ.B.;supervision,B.G.and J.B.;projectadministration,J.B.;fundingacquisition,B.G.andJ.B.Allauthorshavereadandagreed tothepublishedversionofthemanuscript.
Funding: ThisresearchwasfundedbytheWaterCorporationgrantnumber[GR000638]andthe WesternAustralianPlanningCommission(WAPC),theDepartmentofPlanning,LandsandHeritage (DPLH),DevelopmentWAandtheDepartmentofHousingandWorksgrantnumber[GR000705].
DataAvailabilityStatement: Theoriginalcontributionspresentedinthisstudyareincludedinthe article.Furtherinquiriescanbedirectedtothecorrespondingauthor(s).
Acknowledgments: TheauthorswouldliketothankJeremyMaherfromtheWaterCorporationfor hissteadfastsupportofthisresearchthroughthevarioustwistsandturnsoftheresearchprocess.
ConflictsofInterest: Theauthorsdeclarenoconflictofinterest.
References
1. ClimateActionTracker.WarmingProjectionsGlobalUpdate,November2024.2024.Availableonline: https: //climateactiontracker.org/documents/1277/CAT_2024-11-14_GlobalUpdate_COP29.pdf (accessedon1March2025).
2. Bolleter,J.Backgroundnoise:AreviewoftheeffectsofbackgroundinfillonurbanliveabilityinPerth. Aust.Plan. 2016, 10, 265–278.[CrossRef]
3. Bolleter,J.Fringebenefits?AreviewofoutersuburbandevelopmentonPerth’sfringesinrelationtostategovernmentgoals concerningthenaturalenvironmentandefficienttransportconnectivity. Aust.Plan. 2017, 54,93–114.[CrossRef]
4. Mills,G.;Stewart,I.D. TheUrbanHeatIsland;Elsevier:SanDiego,CA,USA,2021.
5. Sharifi,E.;Sivam,A.;Boland,J.Resiliencetoheatinpublicspace:AcasestudyofAdelaide,SouthAustralia. J.Environ.Plan. Manag. 2016, 59,1833–1854.[CrossRef]
6. Nardino,M.;Laruccia,N.Landusechangesinaperi-urbanareaandconsequencesontheurbanheatisland. Climate 2019, 7,133. [CrossRef]
7. Lenzholzer,S. WeatherintheCity:HowDesignShapestheUrbanClimate;NAIPublishers:Rotterdam,TheNetherlands,2015.
8. AustralianGovernment.NationalUrbanPolicy:ConsultationDraft.2024.Availableonline: https://www.infrastructure.gov.au/ sites/default/files/documents/draft-national-urban-policy.pdf (accessedon1March2025).
9. García-Haro,A.;Arellano,B.;Roca,J.Quantifyingtheinfluenceofdesignandlocationonthecoolislandeffectoftheurbanparks ofBarcelona. J.Appl.RemoteSens. 2023, 17,034512.[CrossRef]
10. Cheng,X.;Wei,B.;Chen,G.;Li,J.;Song,C.InfluenceofParkSizeandItsSurroundingUrbanLandscapePatternsonthePark CoolingEffect. J.UrbanPlan.Dev. 2015, 141,A4014002.[CrossRef]
11. Spronken-Smith,R.A.;Oke,T.R.Thethermalregimeofurbanparksintwocitieswithdifferentsummerclimates. Int.J.Remote Sens. 1998, 19,2085–2104.[CrossRef]
12. Liu,H.;Huang,B.;Cheng,X.;Yin,M.;Shang,C.;Luo,Y.;He,B.-J.Sensing-basedparkcoolingperformanceobservationand assessment:Areview. Build.Environ. 2023, 245,110915.[CrossRef]
13. Vanos,J.K.;Warland,J.S.;Gillespie,T.J.;Slater,G.A.;Brown,R.D.;Kenny,N.A.HumanEnergyBudgetModellinginUrbanParks inTorontoandApplicationstoEmergencyHeatStressPreparedness. J.Appl.Meteorol.Climatol. 2012, 51,1639–1653.[CrossRef]
14. Motazedian,A.;Coutts,A.M.;Tapper,N.J.ThemicroclimaticinteractionofasmallurbanparkincentralMelbournewithits surroundingurbanenvironmentduringheatevents. UrbanFor.UrbanGreen. 2020, 52,126688.[CrossRef]
15. Yu,Z.;Guo,X.;Jørgensen,G.;Vejre,H.Howcanurbangreenspacesbeplannedforclimateadaptationinsubtropicalcities? Ecol. Indic. 2017, 82,152–162.[CrossRef]
16. Kim,K.;Yi,C.;Lee,S.Impactofurbancharacteristicsoncoolingenergyconsumptionbeforeandafterconstructionofanurban park:ThecaseofGyeonguilineforestinSeoul. EnergyBuild. 2019, 191,42–51.[CrossRef]
17. Kong,F.;Sun,C.;Liu,F.;Yin,H.;Jiang,F.;Pu,Y.;Cavan,G.;Skelhorn,C.;Middel,A.;Dronova,I.Energysavingpotentialof fragmentedgreenspacesduetotheirtemperatureregulatingecosystemservicesinthesummer. Appl.Energy 2016, 183,1428–1440. [CrossRef]
18. Ho,H.C.;Knudby,A.;Xu,Y.;Hodul,M.;Aminipouri,M.Acomparisonofurbanheatislandsmappedusingskintemperature, airtemperature,andapparenttemperature(Humidex),forthegreaterVancouverarea. Sci.TotalEnviron. 2016, 544,929–938. [CrossRef]
19. Liao,W.;Guldmann,J.-M.;Hu,L.;Cao,Q.;Gan,D.;Li,X.Linkingurbanparkcoolislandeffectstothelandscapepatternsinside andoutsidethepark:Asimultaneousequationmodellingapproach. Landsc.UrbanPlan. 2023, 232,104681.[CrossRef]
20. Lin,W.;Yu,T.;Chang,X.;Wu,W.;Zhang,Y.Calculatingcoolingextentsofgreenparksusingremotesensing:Methodandtest. Landsc.UrbanPlan. 2015, 134,66–75.[CrossRef]
21. Feyisa,G.L.;Dons,K.;Meilby,H.Efficiencyofparksinmitigatingurbanheatislandeffect:AnexamplefromAddisAbaba. Landsc.UrbanPlan. 2014, 123,87–95.[CrossRef]
22. Eliasson,I.Urbannocturnaltemperatures,streetgeometryandlanduse. Atmos.Environ. 1996, 30,379–392.[CrossRef]
23. Sugawara,H.;Narita,K.-I.;Mikami,T.Verticalstructureofthecoolislandinalargeurbanpark. UrbanClim. 2021, 35,100744. [CrossRef]
24. Cai,X.;Yang,J.;Zhang,Y.;Xiao,X.;Xia,J.Coolingislandeffectinurbanparksfromtheperspectiveofinternalparklandscape. Humanit.Soc.Sci.Commun. 2023, 10,674.[CrossRef]
25. Martí-Cardona,B.;Prats,J.;Niclòs,R.EnhancingtheretrievalofstreamsurfacetemperaturefromLandsatdata. RemoteSens. Environ. 2019, 224,182–191.[CrossRef]
26. Brown,R.;Vanos,J.;Kenny,N.;Lenzholzer,S.Designingurbanparksthatamelioratetheeffectsofclimatechange. Landsc.Urban Plan. 2015, 138,118–131.[CrossRef]
27. Sugawara,H.;Shimizu,S.;Takahashi,H.;Hagiwara,S.;Narita,K.i.;Mikami,T.;Hirano,T.ThermalInfluenceofaLargeGreen SpaceonaHotUrbanEnvironment. J.Environ.Qual. 2016, 45,125–133.[CrossRef][PubMed]
28. Oke,T.R.;Crowther,J.M.;McNaughton,K.G.;Monteith,J.L.;Gardiner,B.TheMicrometeorologyoftheUrbanForest[and Discussion]. Philos.Trans.R.Soc.Lond.BBiol.Sci. 1989, 324,335–349.[CrossRef]
29. Duncan,J.;Boruff,B.;Saunders,A.;Sun,Q.;Hurley,J.;Amati,M.Turningdowntheheat:Anenhancedunderstandingofthe relationshipbetweenurbanvegetationandsurfacetemperatureatthecityscale. Sci.TotalEnviron. 2019, 656,118–128.[CrossRef]
30. AustraliaBureauofStatistics.Census.Availableonline: https://www.abs.gov.au/census (accessedon28January2025).
31. WestAustralianPlanningCommission;DepartmentofPlanning. LiveableNeighbourhoods:AWesternAustralianGovernment SustainableCitiesInitiative;WestAustralianPlanningCommission:Perth,Australia,2009.
32. DepartmentofSportandRecreation. ClassificationFrameworkforPublicOpenSpace;DepartmentofSportandRecreation:Perth, Australia,2012.
33. Davis,G.;Harford-Mills,G. Examining60YearsofStrategicPlanninginMetropolitanPerthandPeel;CommitteeforPerth:Perth, Australia,2016.
34. Summers,L. FromWastelandtoParkland;UniversityofMelbourne:Melbourne,Australia,2007.
35. Devereux,D.;Caccetta,P.LandSurfaceTemperatureandUrbanHeatIslandEstimatesforAustralianCapitalCities,Summer 2018-19.Availableonline: https://researchdata.edu.au/land-surface-temperature-2018-19/1426489 (accessedon7July2025).
36. ENVI-met.ENVI-met:DecodingUrbanNature.Availableonline: https://www.envi-met.com/ (accessedon23June2025).
37. BureauofMeteorology.BureauofMeteorology.Availableonline: http://www.bom.gov.au (accessedon23January2025).
38. Höppe,P.Thephysiologicalequivalenttemperature—Auniversalindexforthebiometeorologicalassessmentofthethermal environment. Int.J.Biometeorol. 1999, 43,71–75.[CrossRef]
39. Walther,E.;Goestchel,Q.ThePETcomfortindex:Questioningthemodel. Build.Environ. 2018, 137,1–10.[CrossRef]
40. Bolleter,J.;Ramalho,C. Greenspace-OrientedDevelopment:ReconcilingUrbanDensityandNatureinSuburbanCities;Springer: London,UK,2019.
Disclaimer/Publisher’sNote: Thestatements,opinionsanddatacontainedinallpublicationsaresolelythoseoftheindividual author(s)andcontributor(s)andnotofMDPIand/ortheeditor(s).MDPIand/ortheeditor(s)disclaimresponsibilityforanyinjuryto peopleorpropertyresultingfromanyideas,methods,instructionsorproductsreferredtointhecontent.