Report Contributors:
Alejandro Brugués Rodríguez, John Byrd, Noé Arón Fuentes Flores, David Gaytan, John Gibson, Camila Hernández, Mayra Maldonado, Jason Marczak, Jorge Eduardo Mendoza Cota, Roberto Ransom, and Ignacia Ulloa
Report Contributors:
Alejandro Brugués Rodríguez, John Byrd, Noé Arón Fuentes Flores, David Gaytan, John Gibson, Camila Hernández, Mayra Maldonado, Jason Marczak, Jorge Eduardo Mendoza Cota, Roberto Ransom, and Ignacia Ulloa
How Reducing Wait Times at Land Ports of Entry Would Promote Commerce, Resilience, and Job Creation The Economic Impact of a More Efficient US-Mexico Border
Atlantic Council ADRIENNE ARSHT LATIN AMERICA CENTER
Atlantic Council
ADRIENNE ARSHT LATIN AMERICA CENTER
The Atlantic Council’s nonpartisan Adrienne Arsht Latin America Center (AALAC) broadens understanding of regional transformations while demonstrating why Latin America and the Caribbean matter for the world. The center focuses on pressing political, economic, and social issues that will define the region’s trajectory, proposing constructive, results-oriented solutions to inform public sector, business, and multilateral action based on a shared vision for a more prosperous, inclusive, and sustainable future.
AALAC – home to the premier Caribbean Initiative – builds consensus for action in advancing innovative policy perspectives within select lines of programing: U.S. policy in the Western Hemisphere; Colombia’s future; Venezuela’s multidimensional crisis; Central American prosperity; US-Mexico ties; China in the Americas; Brazil’s trajectory; Caribbean development; regional economic development and commerce; and energy transitions. Jason Marczak serves as the center’s senior director.
This report is written and published in accordance with the Atlantic Council Policy on Intellectual Independence. The authors are solely responsible for its analysis and recommendations. The Atlantic Council and its donors do not determine, nor do they necessarily endorse or advocate for, any of this report’s conclusions.
Atlantic Council 1030 15th Street NW, 12th Floor Washington, DC 20005
For more information, please visit www.AtlanticCouncil.org.
ISBN-13: 978-1-61977-250-2 September 2022
Atlantic Council
ADRIENNE ARSHT LATIN AMERICA CENTER
The Economic Impact of a More Efficient US-Mexico Border
How Reducing Wait Times at Land Ports of Entry Would Promote Commerce, Resilience, and Job Creation
(The first of a two-part series on the US-Mexico Border)
Report Contributors: Alejandro Brugués Rodríguez, John Byrd, Noé Arón Fuentes Flores, David Gaytan, John Gibson, Camila Hernández, Mayra Maldonado, Jason Marczak, Jorge Eduardo Mendoza Cota, Roberto Ransom, and Ignacia Ulloa
A joint report by the Atlantic Council’s Adrienne Arsht Latin America Center, the University of Texas at El Paso’s Hunt Institute for Global Competitiveness, and El Colegio de la Frontera Norte.
Table of Contents
EXECUTIVE SUMMARY 6
INTRODUCTION 7
WHY INVEST IN THE US-MEXICO BORDER? 8
BORDER WAIT TIMES: A CONTINUED CHALLENGE 9
THE ECONOMIC IMPACT OF A MORE EFFICIENT US-MEXICO BORDER 11
The United States: Increased border efficiency would strengthen the economy 12
Mexico: The potential economic gains of a more efficient border 15
CONCLUSION 17
METHODOLOGY 18
APPENDICES 19
ACKNOWLEDGMENTS 38
“We know that long wait times at the border can hurt our businesses and economy, especially in my district. Ensuring our ports of entry have sufficient funding to reduce wait times is necessary to keep our economy on track and ensure businesses on both sides of the border succeed.”
The Hon. Juan Vargas Representative (D-CA-51)
US HOUSE OF REPRESENTATIVES
“Strengthened US-Mexico collaboration at our border will unlock significant economic growth, promote supply chain resilience, and boost competitiveness, benefiting Mexican workers and families. These benefits will reverberate far beyond the border, reaching states throughout Mexico. Now is the time to invest in initiatives to create an even more efficient and secure shared border.”
H.E. Luz Maria de la Mora Subsecretary of International Commerce, Secretariat of the Economy UNITED MEXICAN STATES
“Our border communities rely on efficient and effective infrastructure for work, trade, tourism and other economic exchanges across the US-Mexico border. As the North American region seeks to retain its competitive global advantage, it is more important than ever for these communities to have access to top-notch ports of entry, staffing and technology. With the proper tools for border management, our border cities will be enabled to prosper now and well into the future.”
The Hon. Tony Gonzales Representative (R-TX-23)
US HOUSE OF REPRESENTATIVES
5 ATLANTIC COUNCIL THE ECONOMIC IMPACT OF A MORE EFFICIENT US-MEXICO BORDER
Executive Summary
Improvements in border management and the adoption of new technologies at the US-Mexico border have the potential to enhance security and generate economic benefits for the United States and Mexico through expedited flows of goods and people. Reduced border wait times would lead to more traffic entering the United States from Mexico, both in terms of commercial trucks loaded with goods for US consumers and shoppers ready to buy US goods. This report quantifies the economic impact of this additional commerce and cross-border spending, which would lead to further economic prosperity in the two countries.
Research shows that a 10-minute reduction in wait times could lead to an additional $26 million worth of cargo entering the United States each month via commercial vehicles. This translates to more than $312 million in further commerce from Mexico into the United States annually. The extra inventory of finished and intermediate goods would drive down US domestic prices, creating increased economic well-being for US citizens.
This report also finds that reducing border wait times by 10 minutes has a positive annual impact of $5.4 million on the US economy due to purchases by additional families and individuals entering the United States from Mexico. While the immediate effect of these purchases is most evident in border communities, economic benefits would spread to the continental United States due to the
economic linkages between local economies, with approximately 25 percent of the total impact reaching non-border states.
Beyond the $312 million in added commerce from Mexico into the United States, a 10-minute reduction in border wait times would promote the creation of nearly 18,700 direct and indirect jobs in Mexico, increase labor income per sector by an average of $17,474, and simulate growth for various Mexican economic sectors, particularly manufacturing, wholesale trade, and mining.
More specifically, a one-minute reduction in border wait times would increase the average production (or output) per sector—for Mexico’s top ten sectors exporting to the United States—by 2 percent. This reduction in border wait times would also boost intermediate sales and aggregate demand in Mexico by 2.4 percent and 1.7 percent, respectively.
These findings illustrate the economic benefits of prioritizing investments at the US-Mexico border to reduce commercial and noncommercial wait times. They are understood as the lower range of the potential national-level economic benefits of deepened US-Mexico collaboration to create a more efficient and secure border. A forthcoming second study will build on these findings, disaggregating the economic impact of reduced wait times for US and Mexican states and counties at the border and beyond.
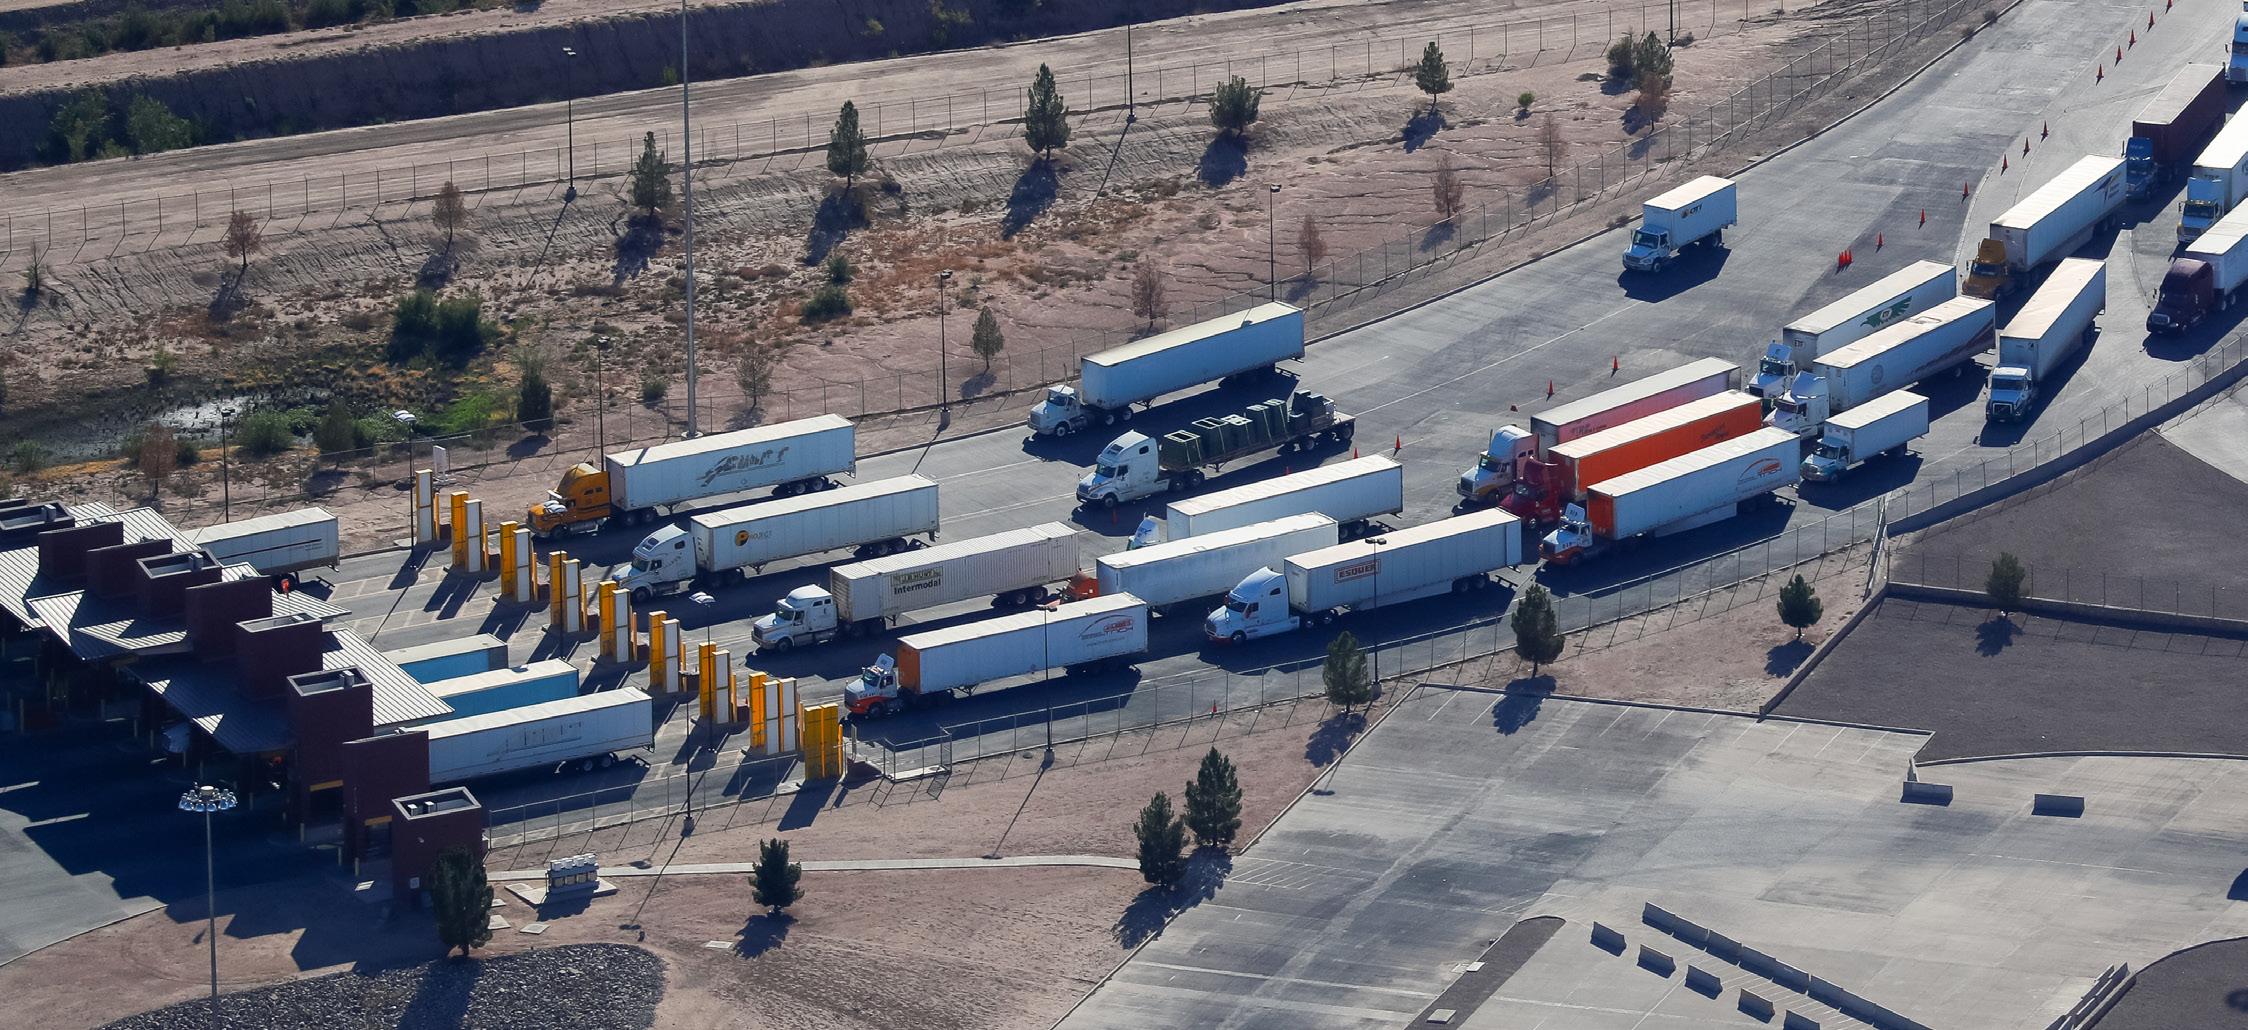
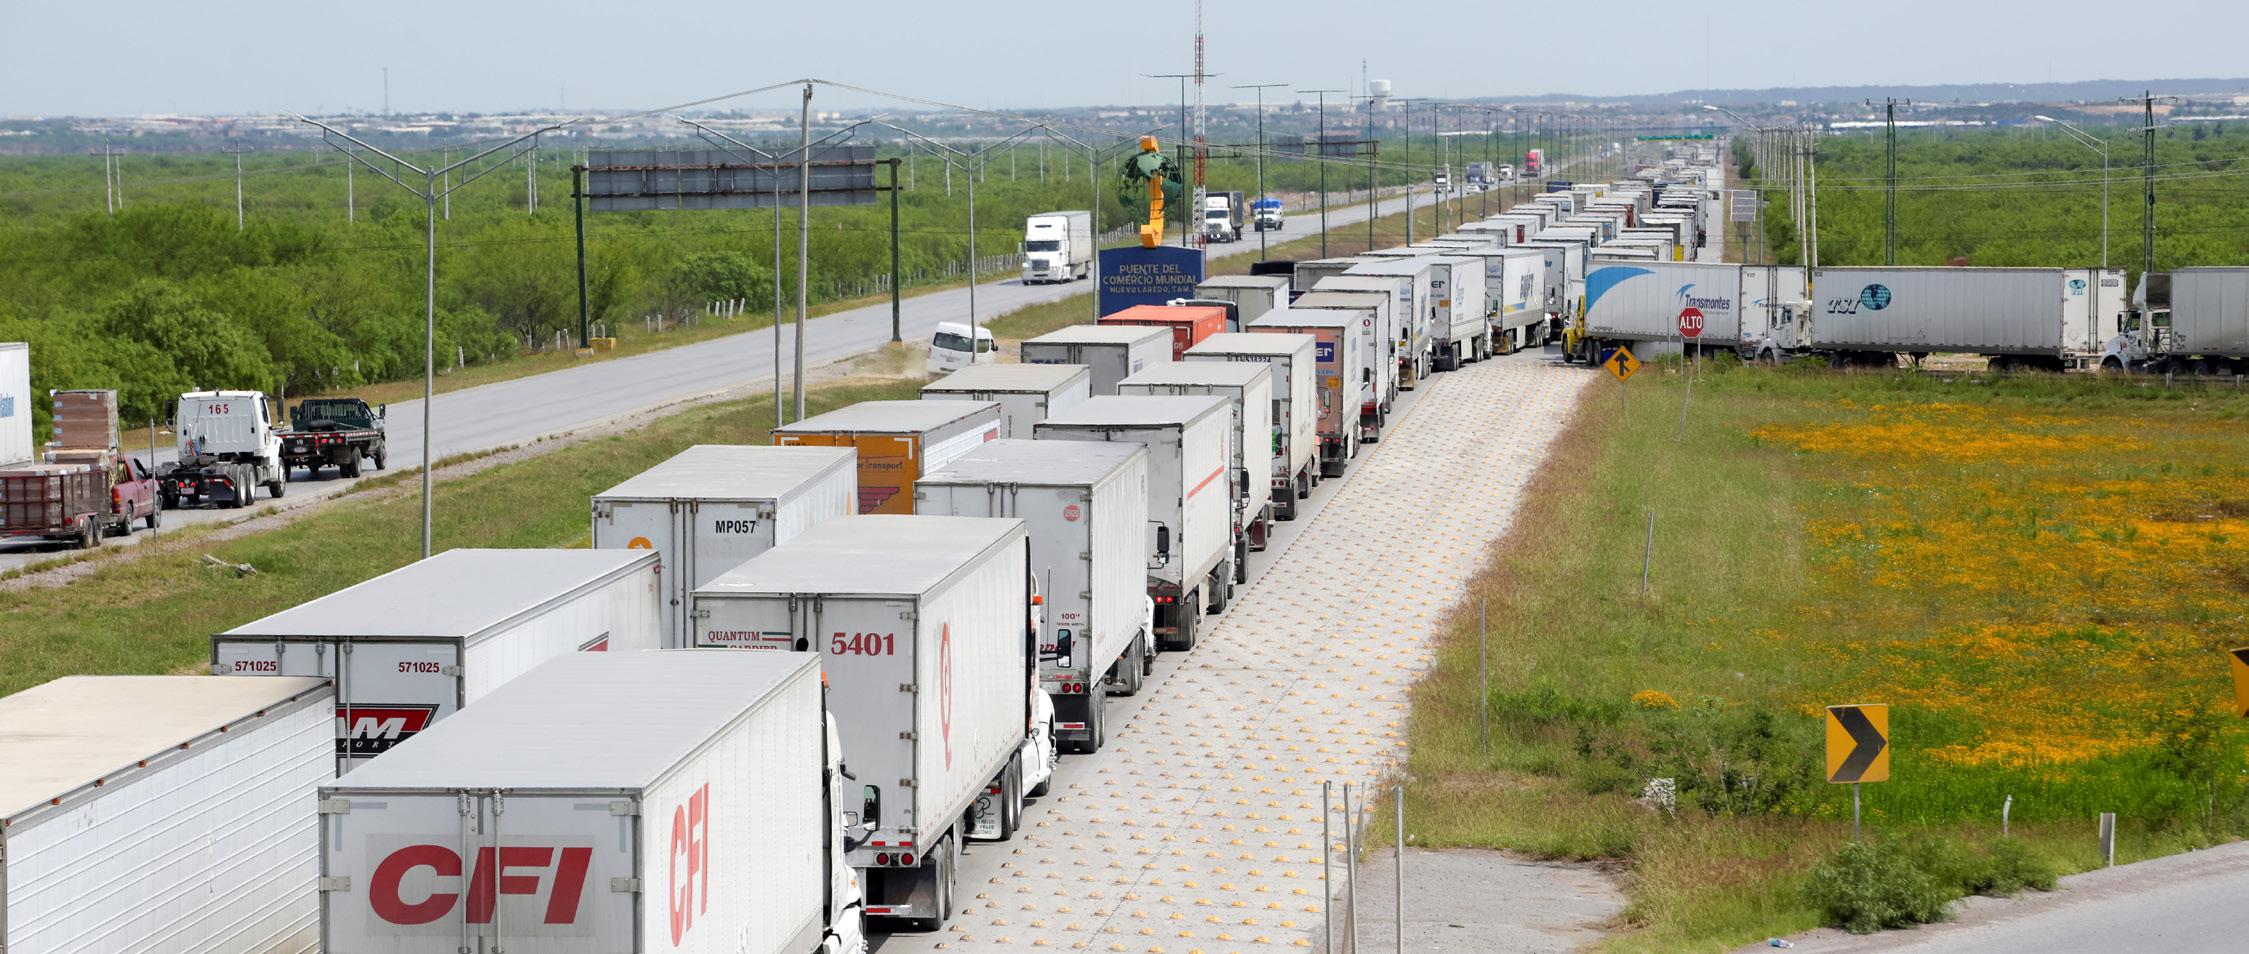
Trucks pass through the U.S. border and into the United States from Juarez, Mexico in El Paso, Texas, U.S. June 18, 2018. REUTERS/Mike Blake
6 ATLANTIC COUNCIL THE ECONOMIC IMPACT OF A MORE EFFICIENT US-MEXICO BORDER
Introduction
The US-Mexico border is a hub of cultural and commercial exchange, fostering continued growth and collaboration between the United States and Mexico. Stretching over 2,000 miles, it has more than forty-four active ports of entry, with fifteen million US and Mexican citizens residing in border counties. In July 2022 alone, the United States and Mexico traded over $65 billion in goods,1 with more than $53 billion crossing the southern border via trucks and trains.2
Approximately five million US jobs depend on trade with Mexico,3 meaning that one in every twenty-nine workers in the United States has a job created or supported by US-Mexico trade. These jobs are spread throughout the US economy in terms of geography and industries. In Mexico’s automotive sector, US-Mexico trade supports more than one million jobs directly and 4.5 million indirectly.4
In addition to importing and exporting final products, the United States and Mexico jointly produce goods. Cross-border production sharing has contributed to greater economic integration, resilience, and competitiveness while helping to insulate the US and Mexican economies from global competitors. Similarly, US-Mexico trade in services contributes to the commercial relationship, with over $62 billion traded in 2019.5
On July 12, 2022, US President Joseph R. Biden and Mexican President Andrés Manuel López Obrador met in Washington, DC, to discuss how safer and more efficient borders would enhance shared commerce.6 During their meeting, the United States committed to investing $3.4 billion and Mexico $1.5 billion to undertake major projects to modernize land ports of entry on the northern and southern borders. These efforts will create jobs, bolster shared security, and enhance supply chain resilience by promoting legitimate trade and travel.
New investments should continue to enhance shared commerce while addressing long-standing efficiency and security challenges, including excessive wait times, inconsistent federal policies, outdated screening technologies, and the illicit flow of weapons, drugs, contraband, and people. Future US-Mexico cooperation should also build on prior efforts to modernize border infrastructure, expedite processing times, and implement joint production programs through accords such as the United StatesMexico-Canada Agreement (USMCA). It could also prioritize new information-sharing infrastructure, shared defense strategies, bilateral-processing mechanisms, and expanded trusted traveler programs. The long-term institutionalization of standing working groups like the US-Mexico High-Level Economic Dialogue (HLED) will help the United States and Mexico align priorities and advance shared development goals moving forward—as evidenced through the joint commitments made at the September 12, 2022, HLED meeting.7
This report—the first in a two-part series—shows that US-Mexico cooperation aimed at creating a more efficient, resilient, and secure border will enhance shared commerce and economic well-being through the expedited flow of goods and people. Reduced border wait times would allow more commercial and noncommercial vehicles to enter the United States from Mexico, bolstering crossborder trade and spending and stimulating competitiveness, economic integration, and job creation. This report includes national-level findings, while a second report disaggregates results by county and state, showing that investing in the US-Mexico border will pay dividends far beyond the border.
7 ATLANTIC COUNCIL THE ECONOMIC IMPACT OF A MORE EFFICIENT US-MEXICO BORDER
Why Invest in the US-Mexico Border?
The United States and Mexico rely on each other to meet their populations’ demand for goods and services. Mexico stands as one of the United States’ largest trading partners in terms of goods, ranking first in 2019 with more than $614 billion in total (two-way) goods traded that year.8 Recent disruptions to cross-border commerce illustrate this interdependence, with important economic implications for populations on both sides of the border.
As COVID-19 first raged worldwide, shutting down economies in the spring of 2020, the US-Mexico border was not immune to the global lockdown. Disruptions in cross-border flows of goods and people resulted in unemployment, curtailed retail sales, and decreased revenue for the tourism industry. In Texas alone, the tourism industry lost $1.02 billion over the course of eight months of border closures. In Mexico, agricultural exports decreased 5.9 percent between March and May of 2020, with a 17.9 percent decrease in sugar exports compared to 2019.9
Avocados are another example of US-Mexico economic interdependence. Approximately nine of ten avocados in US supermarkets come from Mexico.10 In 2021 alone, the United States imported more than 1.1 million metric tons of avocados from Mexico, totaling over $2.8 billion. However, a temporary suspension of avocado imports—due to a verbal threat received by a US inspector in Michoacán—led to concerns over shortages and price increases across the United States.11 Fortunately, the eight-day suspension did not have a lasting impact on local economies or spoil the fruit waiting for export. Soon after the suspension was lifted, avocados quickly returned to US supermarkets to satisfy consumer demand.
The story of COVID-related commerce disruptions and the avocado example not only illustrate the two countries’ economic
interdependence but also the importance of safe and efficient borders. According to US Customs and Border Protection (CBP), the average border-crossing wait time per truck regularly surpasses 125 minutes during regular-to-peak crossing hours.12 Multiplied by the average of 19,617 trucks crossing the border daily, the lost revenue amounts to millions of dollars annually for the United States and Mexico.
Cross-border spending by noncommercial entities (families and individuals) also directly impacts the US and Mexican economies. Cities along the southern border of the United States have become attractive commercial poles that draw customers from Mexico up to 75 miles (120 kilometers) away for daily consumption of goods and services. This is partly due to trade mechanisms becoming antiquated under new international trade agreements (originally designed to retain customers in local markets and supply border counties with national products) and the limitations of the Mexican domestic market, which often translates to higher prices and lower quality in goods such as food, clothing, footwear, and household equipment.
The United States and Mexico have created a series of tools to expedite border crossings for pedestrians, trains, and commercial and noncommercial vehicles, including Unified Cargo Processing,13 Global Entry, Secure Electronic Network for Travelers Rapid Inspection (SENTRI),14 Customs Trade Partnership Against Terrorism,15 and other trusted traveler programs. However, these mechanisms only serve a small portion of daily border crossers, given high annual fees and other prohibitive eligibility requirements. For example, only 175,000 citizens in the United States and Mexico have become SENTRI card holders.16 Building on these and other programs is essential as US and Mexican leaders work together to tap the full economic potential of our shared border.
8 ATLANTIC COUNCIL THE ECONOMIC IMPACT OF A MORE EFFICIENT US-MEXICO BORDER
Border Wait Times: A Continued Challenge
Bottlenecks at land ports of entry along the US-Mexico border present a long-term challenge for economic integration, supply chain resilience, and competitiveness.
While international production sharing programs such as the USMCA and the Maquiladora Export Industry17 have promoted mutually beneficial trade, they have contributed to border congestion by increasing the volume of vehicles requiring border inspections. Congestion and associated wait times are compounded by outdated technologies and limited information sharing within and between agencies in Mexico and the United States. Curtailing the illegal flow of weapons, drugs, contraband, and people also requires stringent and time-consuming border inspections that may lead to border delays.
As shown in Figure 1, non-expedited cargo (commercial vehicles) entering the United States from Mexico undergoes a multistep inspection process. The first processing step involves examination by Mexican border agents who verify paperwork for outgoing goods, ensuring that tariffs are accurately assigned.18 Once cargo
reaches US inspection booths, CBP officers first examine relevant documentation for incoming merchandise and drivers, who are then subject to automated regulation and tariff compliance reviews. At the officers’ discretion, cargo can undergo an additional canine or gamma ray inspection before being cleared for crossing.
Noncommercial vehicles entering the United States from Mexico also undergo a multistep inspection process. Depending on the type of border crossing (i.e., land or bridge), vehicles could be required to pay tolls in cash or via electronic toll collection systems. Once completed, vehicles continue to US inspection points, where they can undergo up to two separate inspections. At the primary inspection booth, CBP officials verify travelers’ documentation and inquire about the purpose of their visit to the United States. If the Interagency Border Inspection System finds records of norm violation,20 CBP officers direct the vehicle toward secondary inspection. At the secondary inspection, officers conduct a thorough identity investigation, after which access to the United States is either granted or denied.
Figure 1: Inspection Process for Commercial Vehicles at the US-Mexico Border19
CBP primary inspection (document inspection)
Secondary inspection
VACIS, X-Ray, FMCSA `Others
Visual vehicle safety inspection Detailed state truck safety inspection
Mexico United
SOURCE: US Department of Transportation, Federal Highway Administration, “Border-wide Assessment of Intelligent Transportation System (ITS) Technology—Current and Future Concepts,” https://ops.fhwa.dot.gov/publications/fhwahop12015/ch2.htm, 2022.
Warehouse / Yard
1. Mexican Export Lot 2. US Federal Compound
3. State Safety Facility Warehouse / Yard
Mexican export documentation verifications and cargo inspection selection Mexican export cargo inspection
9 ATLANTIC COUNCIL THE ECONOMIC IMPACT OF A MORE EFFICIENT US-MEXICO BORDER
Despite the implementation of numerous interventions to enhance the border-user experience, border users consulted while preparing this report expressed concerns about inconsistent federal policies that are not well attuned to their needs.21 For example, outdated technologies at port facilities lead to inaccurate time projections on official agency platforms, making border users turn to social media to better estimate wait and crossing times. Similarly, double inspection processes and unstandardized documentation
requirements in different ports of entry generate delays in border crossings, which ultimately increase transport expenses.
Finding ways to efficiently process the large volume of commercial and noncommercial vehicles crossing the border while safeguarding national security should remain a priority for the bilateral relationship. This will improve the border-user experience and result in substantial economic gains for both countries.
 THE ECONOMIC IMPACT OF A MORE EFFICIENT US-MEXICO BORDER
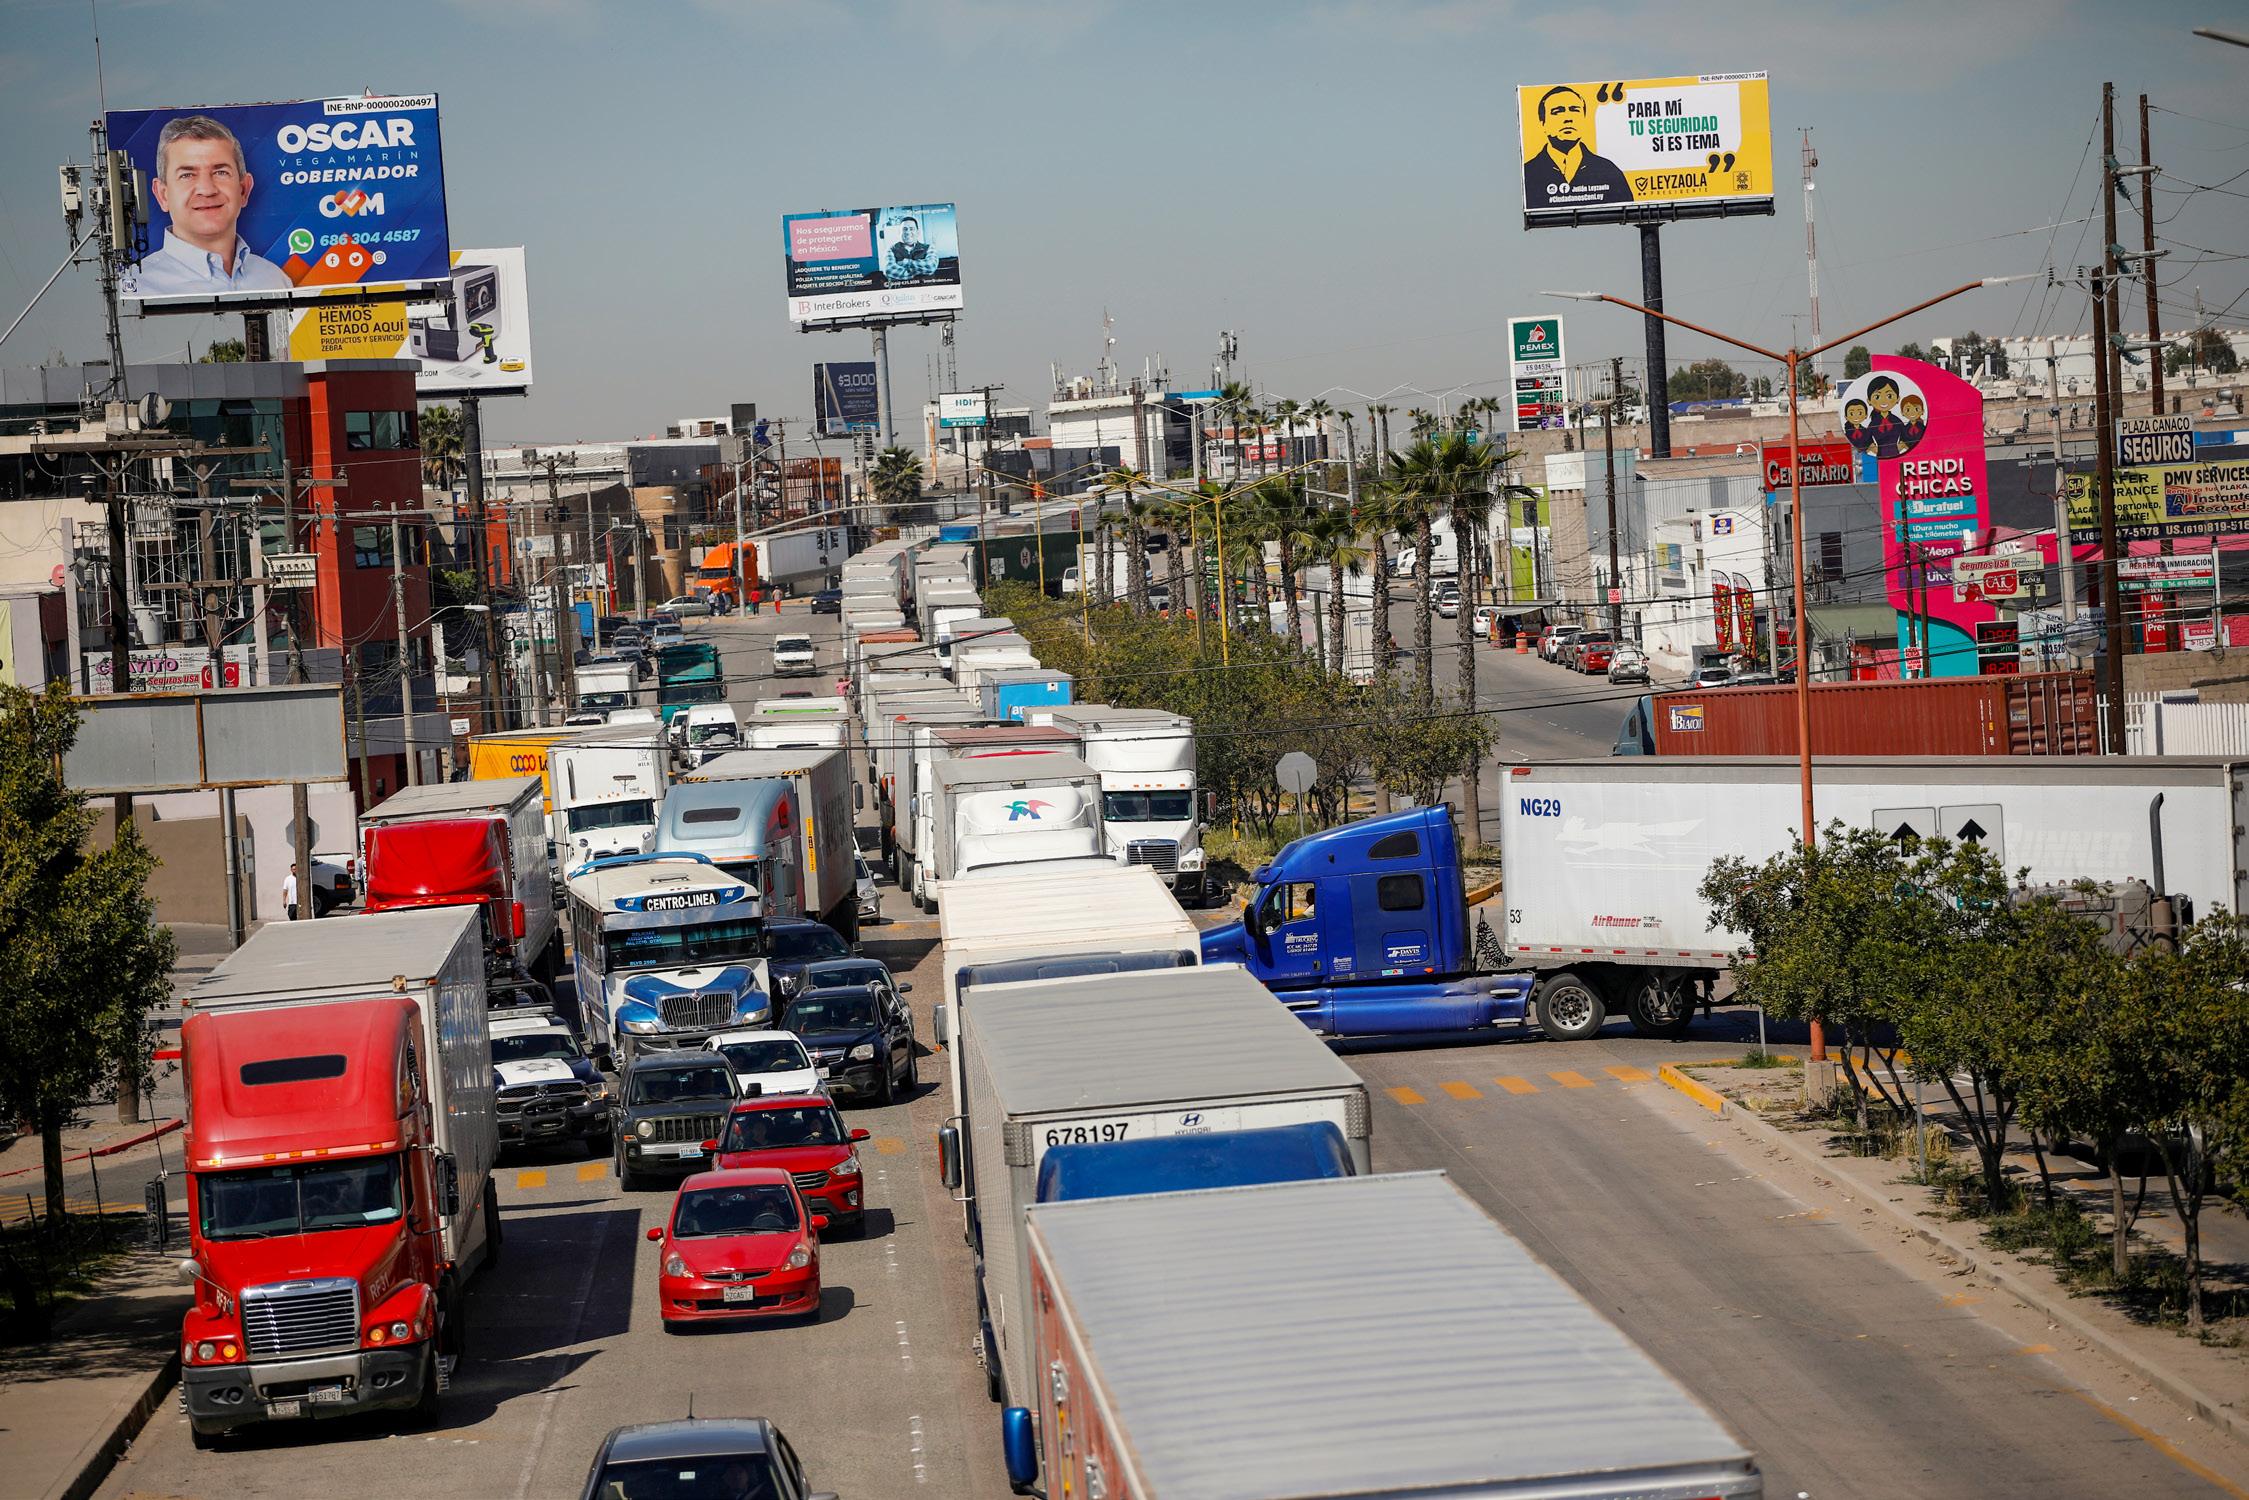
Trucks wait in a long queue for border customs control to cross into the U.S., in one of the main roads of Tijuana, Mexico, April 18, 2019. REUTERS/Andres Martinez Casares - RC1CE4339C90
THE ECONOMIC IMPACT OF A MORE EFFICIENT US-MEXICO BORDER
Trucks wait in a long queue for border customs control to cross into the U.S., in one of the main roads of Tijuana, Mexico, April 18, 2019. REUTERS/Andres Martinez Casares - RC1CE4339C90
10 ATLANTIC COUNCIL
The Economic Impact of a More Efficient US-Mexico Border
Reduced wait times at the US-Mexico directly impact the US and Mexican economies through increased crossborder commerce (commercial vehicles) and spending (noncommercial vehicles). This section quantifies the nationwide dollar value that would result from additional traffic entering the United States from Mexico following a 10-minute reduction in border wait times. The economic impact is estimated for the US and Mexican economies.
OUR APPROACH
The Atlantic Council’s Adrienne Arsht Latin America Center partnered with the Hunt Institute for Global Competitiveness at the
University of Texas at El Paso and El Colegio de la Frontera Norte to produce this two-part study. Findings in this first report result from roundtables, focus groups, and individual consultations carried out virtually across both countries and in-person in Washington, DC; El Paso, Texas; and Tijuana, Mexico; and the analysis of economic data from the United States and Mexico. This study utilizes two economic models; one uses US data, emphasizing the US economy, and another employs Mexican data, focusing on the Mexican economy. As a starting point, both sides of the border were viewed independently to account for discrepancies in data availability and the specific methodologies of local partners and stakeholders. By later harmonizing findings and data, the scope and range of results were extended, ultimately determining the costs and benefits of reducing border wait times for both economies.
USEFUL TERMS
• Commercial traffic: loaded or unloaded vehicles (usually trucks or trains) that cross the US-Mexico border with the intent to distribute goods produced in the country of origin.
• Expenditure: the amount of money spent by noncommercial entities (families and individuals).
• Aggregate demand: the total amount of demand for all finished goods and services produced in an economy.
• Final good: a product that the final consumer uses or consumes. It does not require any additional processing.
• Gross output: the measure of total economic activity in the production of new goods and services during an accounting period.
• Labor income: the sum of employee compensation (wages and benefits) and proprietor income.
• Intermediate good: a product used to produce a final good.
• Intermediate sale: the sale of intermediate goods used in the production of final goods.
• Noncommercial traffic: vehicles carrying passengers (tourists, workers, others) that do not transport goods to sell in the destination country.
11 ATLANTIC COUNCIL THE ECONOMIC IMPACT OF A MORE EFFICIENT US-MEXICO BORDER
The United States: Border Efficiency to Strengthen the Economy
By John Byrd, John Gibson, Mayra Maldonado, and Roberto Ransom. University of Texas at El Paso’s Hunt Institute for Global Competitiveness
Improved border management and the implementation of new technologies at the US-Mexico border have the potential to enhance border security and expedite legitimate trade and travel, stimulating the US and Mexican economies. A more efficient border would allow more commercial and noncommercial traffic to enter the United States from Mexico, resulting in additional goods for US consumers and businesses and more shoppers buying US goods and services.
KEY TAKEAWAYS:
A 10-minute reduction in wait times at the US-Mexico border would:
• Five-hundred thirty-two additional commercial vehicles loaded with goods entering the United States from Mexico every month would generate an additional commercial intake of nearly $26 million monthly or $312 million annually. The extra inventory resulting from increased imports would reduce US domestic prices, thus promoting economic well-being for US citizens.
• Sixty-thousand two-hundred forty additional noncommercial vehicles entering the United States from Mexico every month would generate an additional economic intake of $450,000 monthly, or $5.4 million annually. Border states would absorb approximately 75 percent of this economic impact, and the other 25 percent would reach non-border states in the United States.
The Economic Impact of Additional Commercial Crossings
In 2021, more than 4.7 million container trucks loaded with over $345.9 million worth of cargo entered the United States from Mexico via the US-Mexico border.22 Research shows that a oneminute reduction in commercial wait times would result in 53 additional commercial crossings (see regression analysis in Appendix B). This means that a 10-minute reduction in wait times would result in approximately another 532 container trucks entering the United States every month.
These containers may be loaded or unloaded. Therefore, estimating the economic impact of additional commercial crossings would require determining the proportion of loaded containers entering the United States via land ports of entry and the average cargo value of loaded containers. Data from the US Bureau of Transportation shows that approximately 73.1 percent of containers crossing the US-Mexico border are loaded with an average value of $66,798. Table 1 shows a breakdown of the average container value and the number of loaded and unloaded containers crossing the border through individual border counties.
12 ATLANTIC COUNCIL THE ECONOMIC IMPACT OF A MORE EFFICIENT US-MEXICO BORDER
State County
Table 1: Proportion of Loaded Containers and Average Container Value (2019)
Loaded Containers
Loaded + Unloaded Containers Exports 2019 Imports 2019
Total Trade
Average Value per Truck
Texas El Paso 610,869 184,426 795,295 $31,717,503,019 $46,613,712,212 $78,331,215,231 $76,307
Texas Hudspeth 0 0 0 $- $- $- $-
Texas Presidio 8,418 1,791 10,209 $144,896,195 $200,275,710 $345,171,905 $23,791
Texas Val Verde 59,951 15,651 75,602 $2,068,951,047 $3,082,037,002 $5,150,988,049 $51,409
Texas Maverick 149,732 30,298 180,030 $7,453,868,613 $22,197,870,144 $29,651,738,757 $148,251
Texas Webb 1,711,670 658,639 2,370,309 $95,124,653,587 $135,741,587,991 $230,866,241,578 $79,304
Texas Starr 38,611 17,958 56,569 $92,580,893 $387,724,994 $480,305,887 $10,042
Texas Hidalgo 502,312 213,297 715,609 $13,222,562,811 $23,522,857,942 $36,745,420,753 $46,829
Texas Cameron 153,280 134,796 288,076 $8,910,096,389 $8,930,388,221 $17,840,484,610 $58,262
New Mexico Luna 15,960 794 16,754 $23,980,387 $116,358,933 $140,339,320 $7,291
New Mexico Dona Ana 114,701 19,916 134,617 $14,098,068,953 $16,344,483,518 $30,442,552,471 $142,496
Arizona Yuma 28,342 8,823 37,165 $506,644,995 $875,099,032 $1,381,744,027 $30,876
Arizona Pima 303 12 315 $3,518,870 $1,794,662 $5,313,532 $5,923
Arizona Santa Cruz 293,771 66,136 359,907 $10,369,174,240 $15,633,063,045 $26,002,237,285 $53,215
Arizona Cochise 21,775 8,253 30,028 $802,531,798 $1,153,252,535 $1,955,784,333 $52,962
California San Diego 798,230 258,912 1,057,142 $17,279,207,288 $32,480,486,882 $49,759,694,170 $40,691
California Imperial 258,227 134,805 393,032 $7,023,568,716 $11,087,270,453 $18,110,839,169 $42,936
Total US Border 4,766,152 1,754,507 6,520,659 $208,841,807,801 $318,368,263,276 $527,210,071,077 Average $66,798
SOURCE: The Hunt Institute for Global Competitiveness and the COLEF using data from the Department of Transportation and the US Census Bureau.
Based on these findings, a 10-minute reduction in commercial wait times would allow $26 million23 in additional cargo value to enter the United States monthly or $312 million annually. This added commerce from Mexico into the United States consists of various finished and intermediate goods demanded by US consumers and businesses. While it may be argued that additional consumer goods entering the United States via the southern border would result in fewer jobs in the United States, the extra inventory generated by these other imports would also drive down domestic prices. Furthermore, the inflow of intermediate goods serves as vital inputs that support US businesses. As such, more data and analysis are required to determine which of these offsetting effects dominate.
The Economic Impact of Additional Noncommercial Crossings24
Improvements in border management tools and practices could also expedite the flow of noncommercial crossings, with positive repercussions for the US economy due to additional crossborder spending. In 2021, nearly 126 million people entered the United States from Mexico to purchase goods and services from US businesses. As shown in Table 2, these purchases generated an economic impact of $12.3 billion for the US economy.25 While the four US border states—Arizona, California, New Mexico, and Texas—absorb 75 percent of this impact, approximately 25 percent
13 ATLANTIC COUNCIL THE ECONOMIC IMPACT OF A MORE EFFICIENT US-MEXICO BORDER
2019 Unloaded Containers 2019
2019
Table 2: Economic Impact of Cross-Border Spending in the United States
Impact Employment
1
2
3
Income
Added
$2,765,047,740.91 $5,036,142,293.41
$1,234,825,927.30 $1,980,607,178.46 $4,118,866,436.04
$977,441,701.68 $1,771,486,445.19 $3,177,688,817.94
$6,517,141,364.56 $12,332,697,547.38
bleeds directly into non-border states. This means that spending by shoppers from Mexico in US border states has an economic impact of $3.1 billion in the other forty-six US states.
Research finds that a 10-minute reduction in wait times at the US-Mexico border would result in an average of approximately 5,020 additional noncommercial crossings every month, or 60,240 every year (see regression results in Appendix B). Determining the economic impact of these additional crossings requires data on the spending patterns of noncommercial crossers and a model to assess the economic impact of this spending. Appendix C provides
technical details on how the data and model were used to calculate impact.
Research shows that a 10-minute reduction in noncommercial wait times at the US-Mexico border would lead to a $450,000 positive economic impact on the US economy every month. Over the course of one year, this would add up to a monetary intake of $5.4 million. The top three industries that would most benefit from additional cross-border spending is concentrated in areas where tourists or temporary visitors are likely to spend money, particularly retail, fullservice restaurants, and general merchandise industries. For further information on sector-specific impacts, see Appendix C.
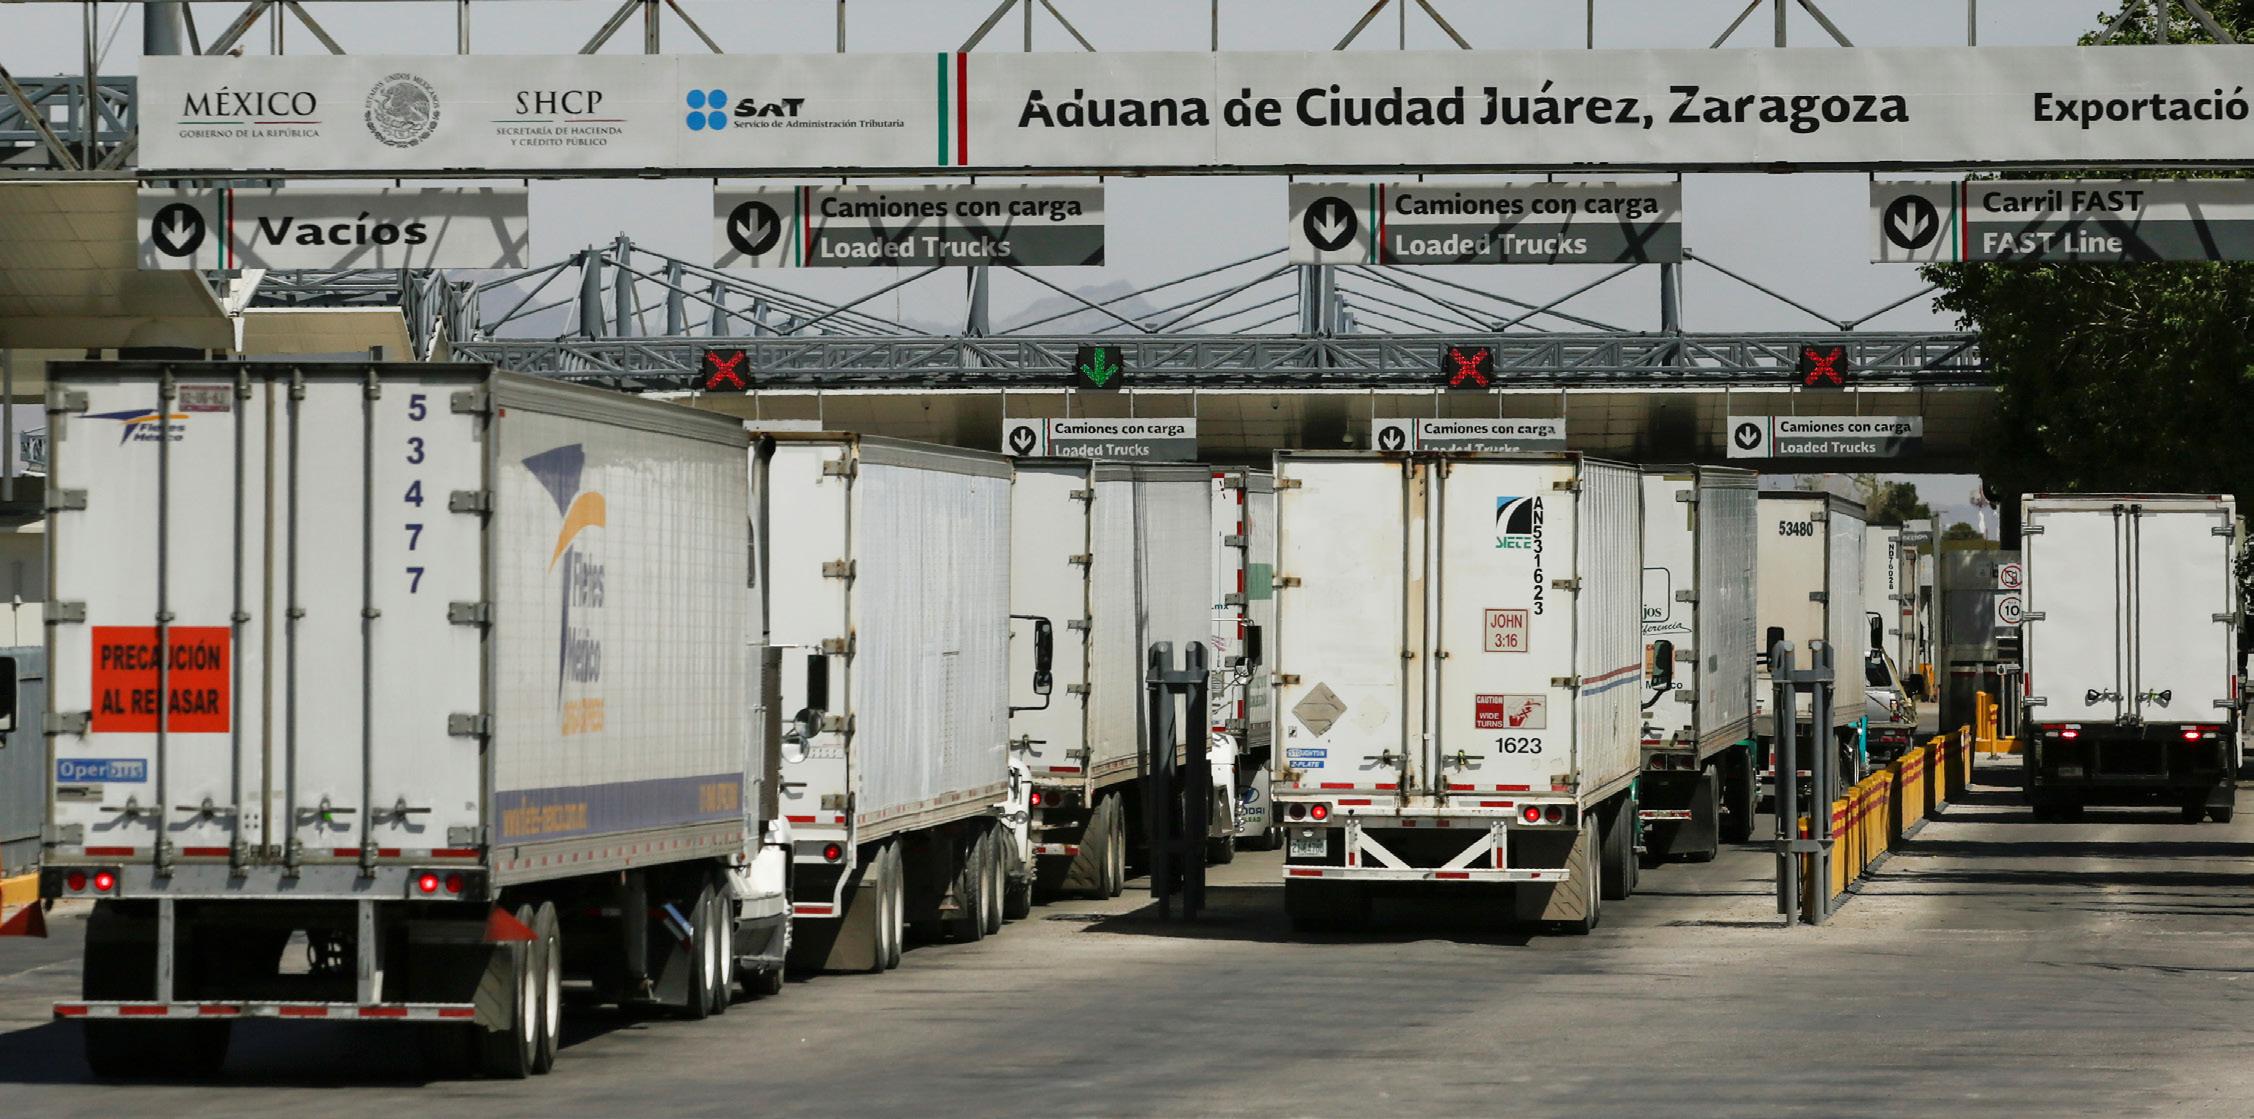
Trucks wait in a queue for border customs control, to cross into the United States, at the Zaragoza-Ysleta border crossing bridge in Ciudad Juarez, Mexico April 30, 2020. REUTERS/Jose Luis Gonzalez
Institute for Global Competitiveness and the COLEF, using
14 ATLANTIC COUNCIL THE ECONOMIC IMPACT OF A MORE EFFICIENT US-MEXICO BORDER
Labor
Value
Output
- Direct 60,619.16 $1,812,022,814.56
- Indirect 21,166.07
- Induced 18,648.05
100,433.29 $4,024,290,443.54
SOURCE: The Hunt
IMPLAN.
(2022)
Mexico: The Potential Economic Gains of Border Efficiency
By David Gaytan, Noé Arón Fuentes Flores, Alejandro Brugués Rodríguez, and Jorge Eduardo Mendoza Cota. El Colegio de la Frontera Norte
KEY TAKEAWAYS:
A one-minute reduction in wait times at the US-Mexico border would:
• Boost Mexican exports to the United States, increasing sectoral output by an average of 2 percent, intermediate sales by an average of 2.4 percent, and aggregate demand by an average of 1.7 percent. Sectors benefiting the most from reduced commercial wait times are those for which production is largely driven by US demand for export goods such as mining, manufacturing, wholesale trade, and agriculture.
A 10-minute reduction in wait times at the US-Mexico border would:
• Create nearly 18,700 additional direct and indirect Mexican jobs. These posts would be largely concentrated in financial services; wholesale trade; sports, cultural, and other recreational services; and professional, scientific, and technical services.
• Lead to an overall increase of $174,474 in labor income.
Expediting the flow of commercial traffic from Mexico into the United States would boost cross-border commerce, which impacts aggregate demand in Mexico, causing a change in total gross output and intermediate sales.26 These effects can be disaggregated by sector in the Mexican economy.
Macroeconomic Impact of Additional Commercial Crossings
Determining the sectoral economic impact of a more efficient US-Mexico border requires understanding the relationship between Mexico’s exports per sector and US demand for export goods. The United States stands as Mexico’s largest export market, with approximately 80 percent of Mexican exports destined for the United States.27 Nearly 100 percent of these exports are concentrated in ten sectors,28 accounting for $349 billion in 2018 and $358 billion in 2019 (for more information, see Appendix F).29 Therefore, this study only considers Mexico’s top-ten sectors in terms of exports to the United States. Within this group, the manufacturing and maquiladora export industries are particularly important, producing more than 60 percent of Mexico’s total exports to the United States. Today, Mexico stands as the top US supplier of motor vehicles and motor vehicle parts.30
Findings show that, on average, Mexican exports to the United States drive 38 percent of Mexican production (or output) per sector (for a detailed breakdown, see Appendix F). For mining, manufacturing, wholesale trade, and agriculture, exports to the United States drive more than 50 percent of total gross output. These four sectors alone are responsible for 84.4 percent of the total dollar value generated from exports to the United States, accounting for $664.26 billion out of the total $787.16 billion in total production.
A significant portion of Mexican exports enters the United States via land ports across the US-Mexico border. An average of twenty-eight commercial vehicles with export goods arrive at the border every hour, with the average truck taking approximately 20 minutes to cross the border (for more information, see Appendix D3). Reducing wait times would boost Mexican exports by allowing additional commercial crossings into the United States. This would strengthen Mexican supply chains by stimulating the exchange of intermediate and final goods between sectors in response to the increased demand for export goods.
Given that approximately 73.1 percent of containers crossing the US-Mexico border are loaded with an average value of $66,798,31 a one-minute reduction in commercial wait times would increase
15 ATLANTIC COUNCIL THE ECONOMIC IMPACT OF A MORE EFFICIENT US-MEXICO BORDER
sectoral output (total gross output) by an average of 2 percent. This output growth would be driven by a 1.7 percent increase in average demand per sector, occurring as a result of additional Mexican exports entering the United States. Intermediate sales (the sectoral exchange of intermediate goods for the production of additional export goods) would grow by an average of 2.4 percent per sector. Appendix D includes a detailed description of the two models used in the analysis, a queuing and input-output model.
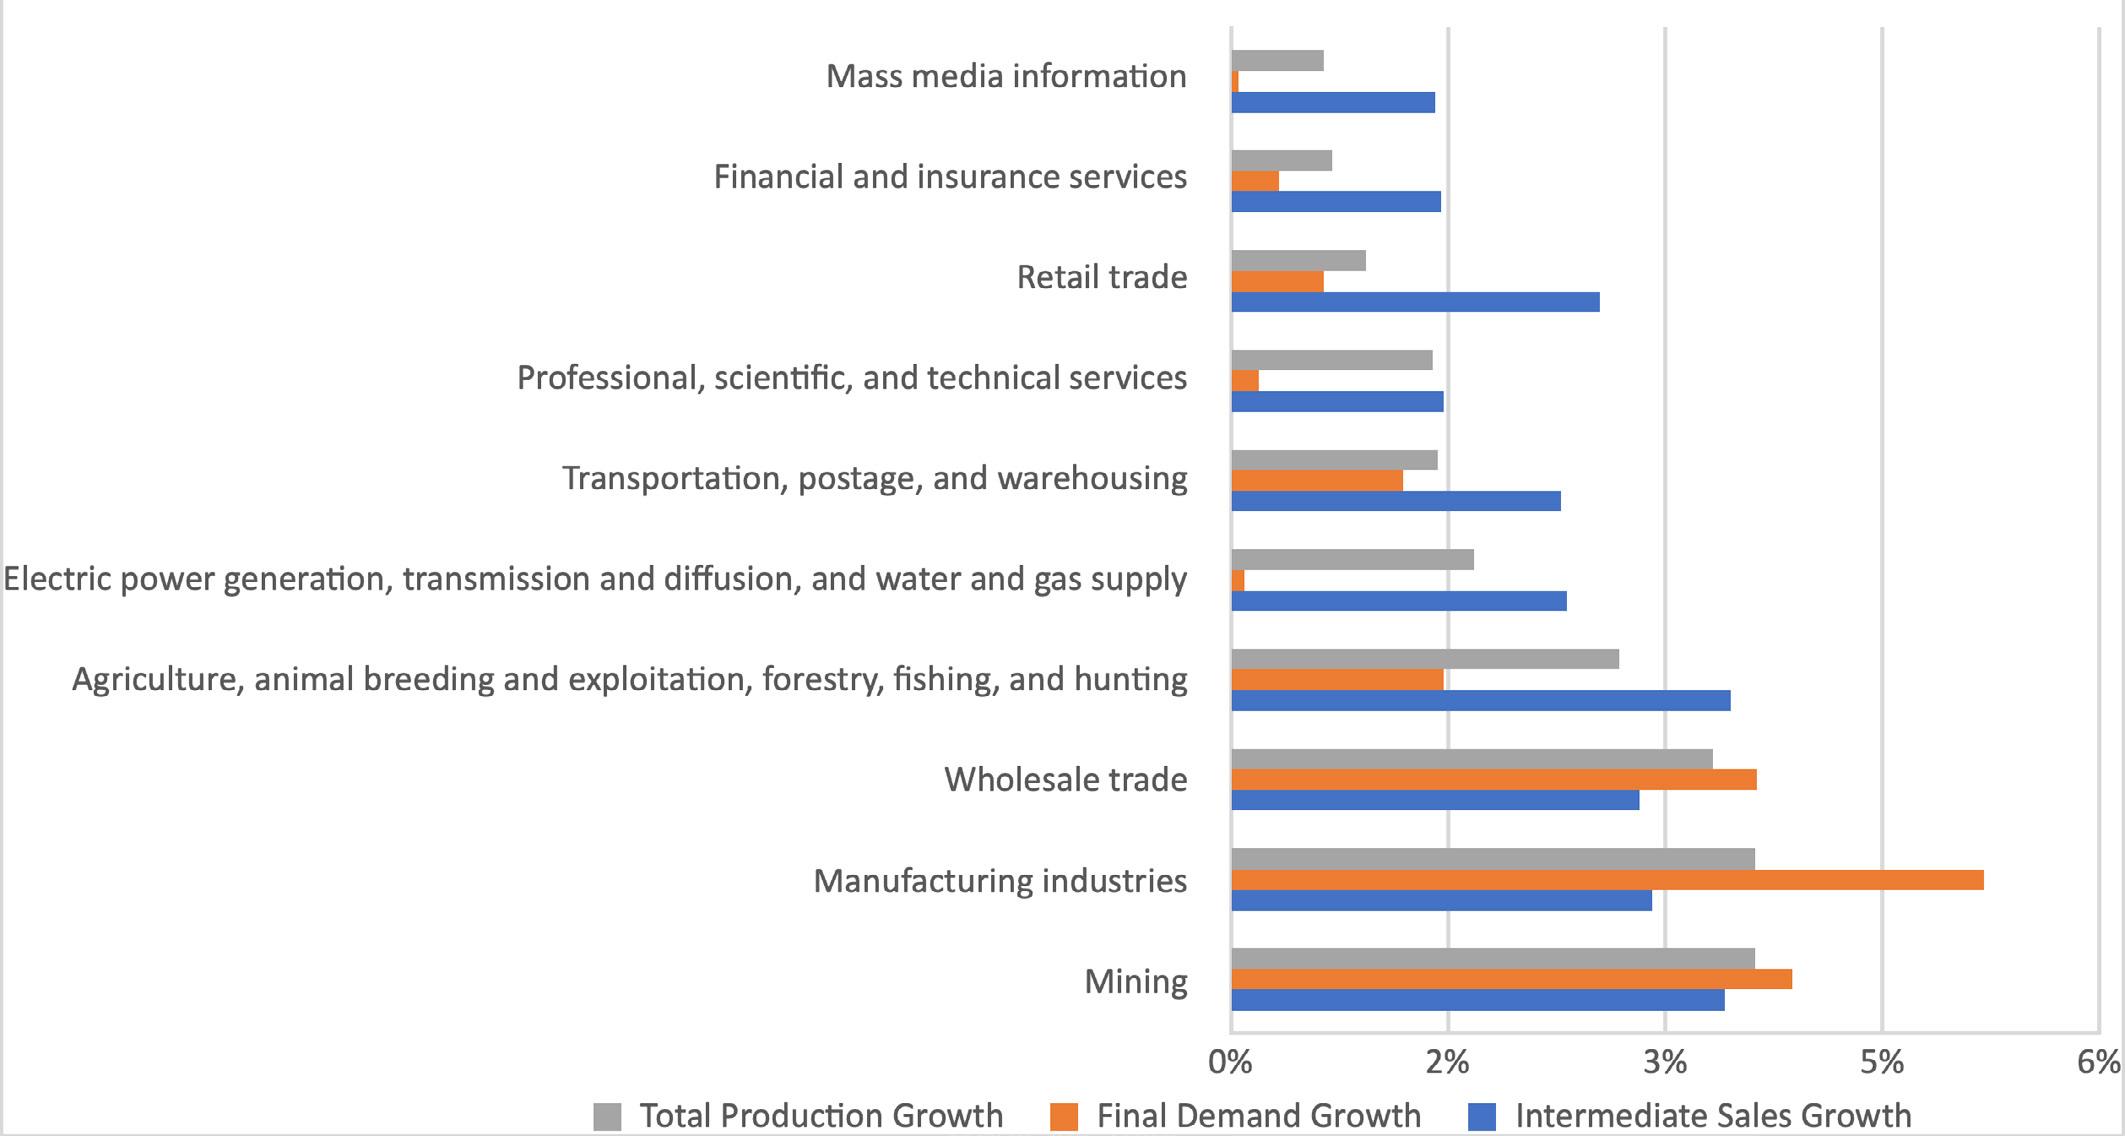
As Figure 2 shows, the benefits of increased commercial crossings into the United States are unequally distributed across sectors of the Mexican economy. The mining, manufacturing, and wholesale trade sectors experience the highest growth rates in production, at 3.62 percent, 3.62 percent, and 3.33 percent, respectively. These three sectors also have the largest increase in aggregate demand, growing at 3.88 percent, 5.20 percent, and 3.63 percent, respectively. Regarding intermediate sales, the agricultural and mining sectors have growth rates higher than 3 percent. Appendix F has a detailed breakdown of nominal and percentage growth in production (total gross output), intermediate sales, and aggregate demand following a one-minute reduction in border wait times.
Economic Impact on Employment and Labor Income of Additional Commercial Crossings
Moreover, this study finds that a 10-minute reduction in border wait times would promote the creation of nearly 18,700 indirect and direct jobs in Mexico over the course of one year, with 5,505 new positions opening in financial and insurance services, 3,684 in mass media information, 3,216 in wholesale trade, and 2,448 in professional, scientific, and technical posts. The loss in labor is far smaller, with an estimated 793 jobs lost in manufacturing and 210 in the transportation, postage, and warehousing sectors. (For detailed analysis, see Appendix G).
A ten-minute reduction in commercial wait times would also result in a $174,474 increase in labor income. When disaggregated by sector, labor income growth is higher in the wholesale trade, financial and insurance services, information services, and mining sectors. Interestingly, this change would lead to more equitable distribution of labor income across Mexican economic sectors. However, the variation is driven mainly by increased production by sector rather than overall productivity. (For more information, see Appendix G).
Figure 2: Growth of Total Gross Output, Aggregate Demand, and Intermediate Sales
THE
IMPACT OF A MORE EFFICIENT US-MEXICO BORDER
SOURCE: In-house prepared graph based on estimates for 2018 data, obtained from the National Institute of Statistics and Geography, 2022.
Total Production Growth Aggregate Demand Growth Intermediate Sales Growth
16 ATLANTIC COUNCIL
ECONOMIC
Conclusion
Amore efficient US-Mexico border would expedite legitimate trade and travel, enhancing cross-border commerce and benefiting the US and Mexican economies. Streamlined border crossings could be achieved through improvements in border management practices and the adoption of new technologies. These efforts would also bolster shared security between the United States and Mexico.
This report focused on the economic impact of expediting commercial and noncommercial crossings from Mexico into the United States. Reduced border wait times would increase the supply of goods and services for US consumers and stimulate spending in the United States while boosting Mexican exports into the United States. This would lead to an increasingly competitive, economically integrated, and resilient bilateral relationship.
In the United States, a 10-minute reduction in border wait times would facilitate the crossing of 532 additional loaded trucks every month, generating an added commercial intake of nearly $26 million per month. In one year, the economic impact on the US economy would be $312 million. Similarly, it would allow 60,240 additional noncommercial vehicles to enter the United States every month, generating an extra economic intake of $450,000 monthly, or $5.4 million annually. The benefits of increased cross-border commerce and spending would extend throughout the United States due to the economic linkages between local economies.
For Mexico’s top ten export sectors to the United States, a oneminute reduction in commercial wait times would, on average, increase production (total gross output) by 2 percent, intermediate sales by 2.4 percent, and aggregate demand by 1.7 percent. Results show the mining, manufacturing, wholesale trade, and agricultural sectors would benefit the most from additional commerce from Mexico into the United States. Historically, more than 50 percent of production in these sectors has been driven by US demand for export goods.
Expediting the flow of commercial vehicles from Mexico into the United States by ten minutes would increase labor income by $174,474 and promote the creation of nearly 18,700 additional direct and indirect jobs in Mexico, particularly in financial services; mass media information; wholesale trade; and professional, scientific, and technical services.
These numbers illustrate the lower-bound economic gains that would result from reduced wait times at the US-Mexico border, stemming from potential improvements in border management practices and tools. They emphasize the economic interdependence of the United States and Mexico, outlining how a further coordinated, binational approach to the border would benefit both countries. A subsequent study will disaggregate national-level findings and thus determine the impact of a more efficient and secure US-Mexico border at the state and county level in the United States and Mexico.
Trucks wait in a long queue for border customs control to cross into the United States at the World Trade Bridge in Nuevo Laredo, Mexico April 2, 2019. REUTERS/Daniel Becerril
17 ATLANTIC COUNCIL THE ECONOMIC IMPACT OF A MORE EFFICIENT US-MEXICO BORDER
Methodology
US-focused analysis
The Hunt Institute for Global Competitiveness used a two-step process to calculate the economic impact of reducing border wait times for commercial and noncommercial crossings. First, regression analysis was employed to determine the relationship between average wait times (in minutes) and the average number of crossings (commercial and noncommercial) at major US-Mexico land ports of entry. Additional factors impacting this relationship, such as employment and crime on both sides of the border, the number of lanes in operation, and total expenditures made by the US Department of Homeland Security (DHS), were considered. The analysis used data from various sources, including CBP, the US Department of Transportation’s Bureau of Transportation Statistics, the US Department of Labor’s Bureau of Labor Statistics, Instituto Nacional de Estadística y Geografía (INEGI, or National Institute of Statistics and Geography), and the Instituto Mexicano de Seguro Social (Mexican Institute of Social Security). To account for disruptions in border traffic patterns stemming from COVID-19 and its accompanying policy changes, the study captures data between April 2016 and December 2019, before the pandemic’s onset.
The second step in the analysis was quantifying the economic impact of additional crossings resulting from reduced wait times. Because of the different types of data available for commercial and noncommercial crossings; this study used various methods to quantify their effects. For commercial crossings, the proportion of loaded container crossings and the average value per container— obtained from the US Department of Transportation—were used to determine the dollar value associated with increased container crossings. For noncommercial crossings, survey data from the City of El Paso’s International Bridges Department on travel and spending patterns were used to model the economic impact of spending by additional noncommercial crossers. Appendices A through C include more technical information and a detailed, stepby-step explanation of the analysis.
Mexico-focused analysis
El Colegio de la Frontera Norte used a three-step process and two economic models to determine the economic impact of reduced border wait times for commercial vehicles. The analysis used data from the US Bureau of Transportation Statistics, CBP, the North American Industry Classification System (NAICS), Mexico’s INEGI, Automated Census Information System (ACIS), and Servicio de Administración Tributaria (SAT, or Tax Administration Service).
The first step was to estimate the average inspection rate of commercial vehicles at US-Mexico border land ports of entry (see Appendix D3 for detailed analysis). Then, a queuing model was used to determine how reduced wait times affect Mexican exports to the United States. Finally, an input-output model was implemented to establish how changes in exports affect production (total gross output), intermediate sales, and aggregate demand for Mexico’s top ten sectors in terms of exports to the United States. Appendix D provides a detailed, technical description of the queueing and inputoutput models, while Appendix F includes analysis results.
18 ATLANTIC COUNCIL THE ECONOMIC IMPACT OF A MORE EFFICIENT US-MEXICO BORDER
Appendices
The following Appendices provide additional details on the economic analysis summarized in the main report. Given its technical nature, this section can be skipped by more casual readers. Appendices A, B, and C explain the US-focused analysis by the Hunt Institute for Global Competitiveness and Appendices D, E, F, and G expand on the Mexico-focused analysis by El Colegio de la Frontera Norte.
US-FOCUSED ANALYSIS
APPENDIX A 20
Provides a detailed description of the data used in the regression analysis.
APPENDIX B 24
Outlines the regression model used to estimate the relationship between border wait times and commercial and noncommercial crossings.
APPENDIX C 25
Gives an overview of IMPLAN and how it was used to measure the economic impact of noncommercial crossings.
MEXICO-FOCUSED ANALYSIS
APPENDIX D 28
Provides more details on the input-output and queuing models.
APPENDIX E 31
Describes the data used in the analysis.
APPENDIX F 32
Explains the economic impact analysis with and without reduced border wait times.
APPENDIX G 36
Describes the analysis of economic impact on employment and labor income.
THE
IMPACT
EFFICIENT US-MEXICO
19 ATLANTIC COUNCIL
ECONOMIC
OF A MORE
BORDER
APPENDIX A: DATA USED FOR THE FIXED EFFECTS MODEL
While report results are presented at the national level, the analysis by the Hunt Institute for Global Competitiveness is built from countylevel data focusing on major US-Mexico land ports of entry. Map 1 shows the counties on the US-Mexico border for which data was
collected and analyzed. These counties have one or more land ports of entry. Map 2 presents CBP sectors and selected counties’ ports of entry within each sector.
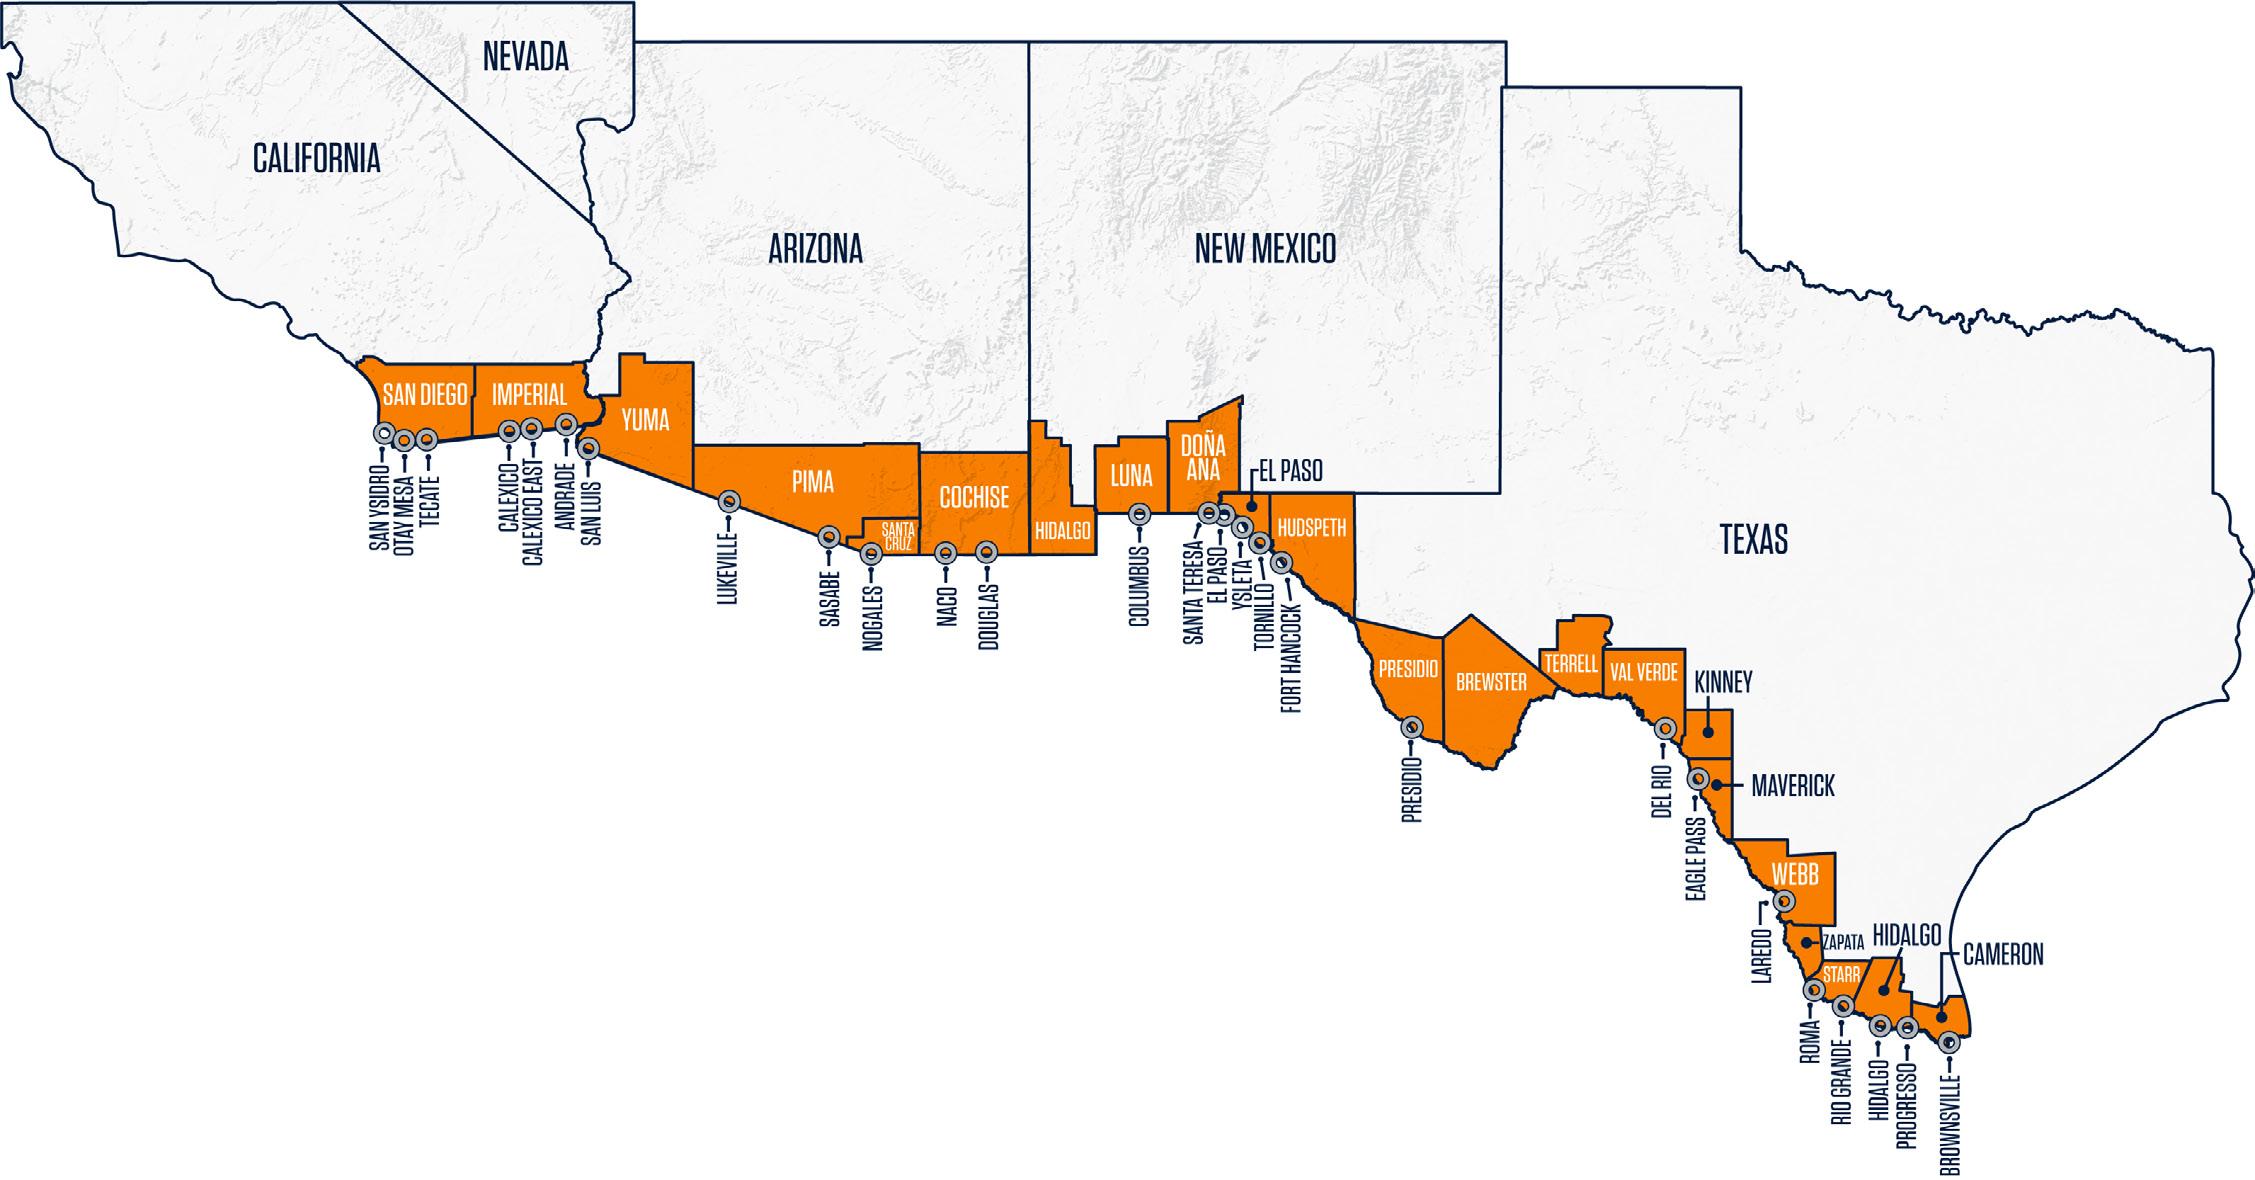
Map 1. US Border Counties on the US-Mexico Border
THE ECONOMIC IMPACT OF A MORE EFFICIENT US-MEXICO BORDER
SOURCE: The Hunt Institute for Global Competitiveness and El Colegio de la Frontera Norte (COLEF).
20 ATLANTIC COUNCIL
APPENDIX A
Map 2. CBP Sectors Along the US-Mexico Border
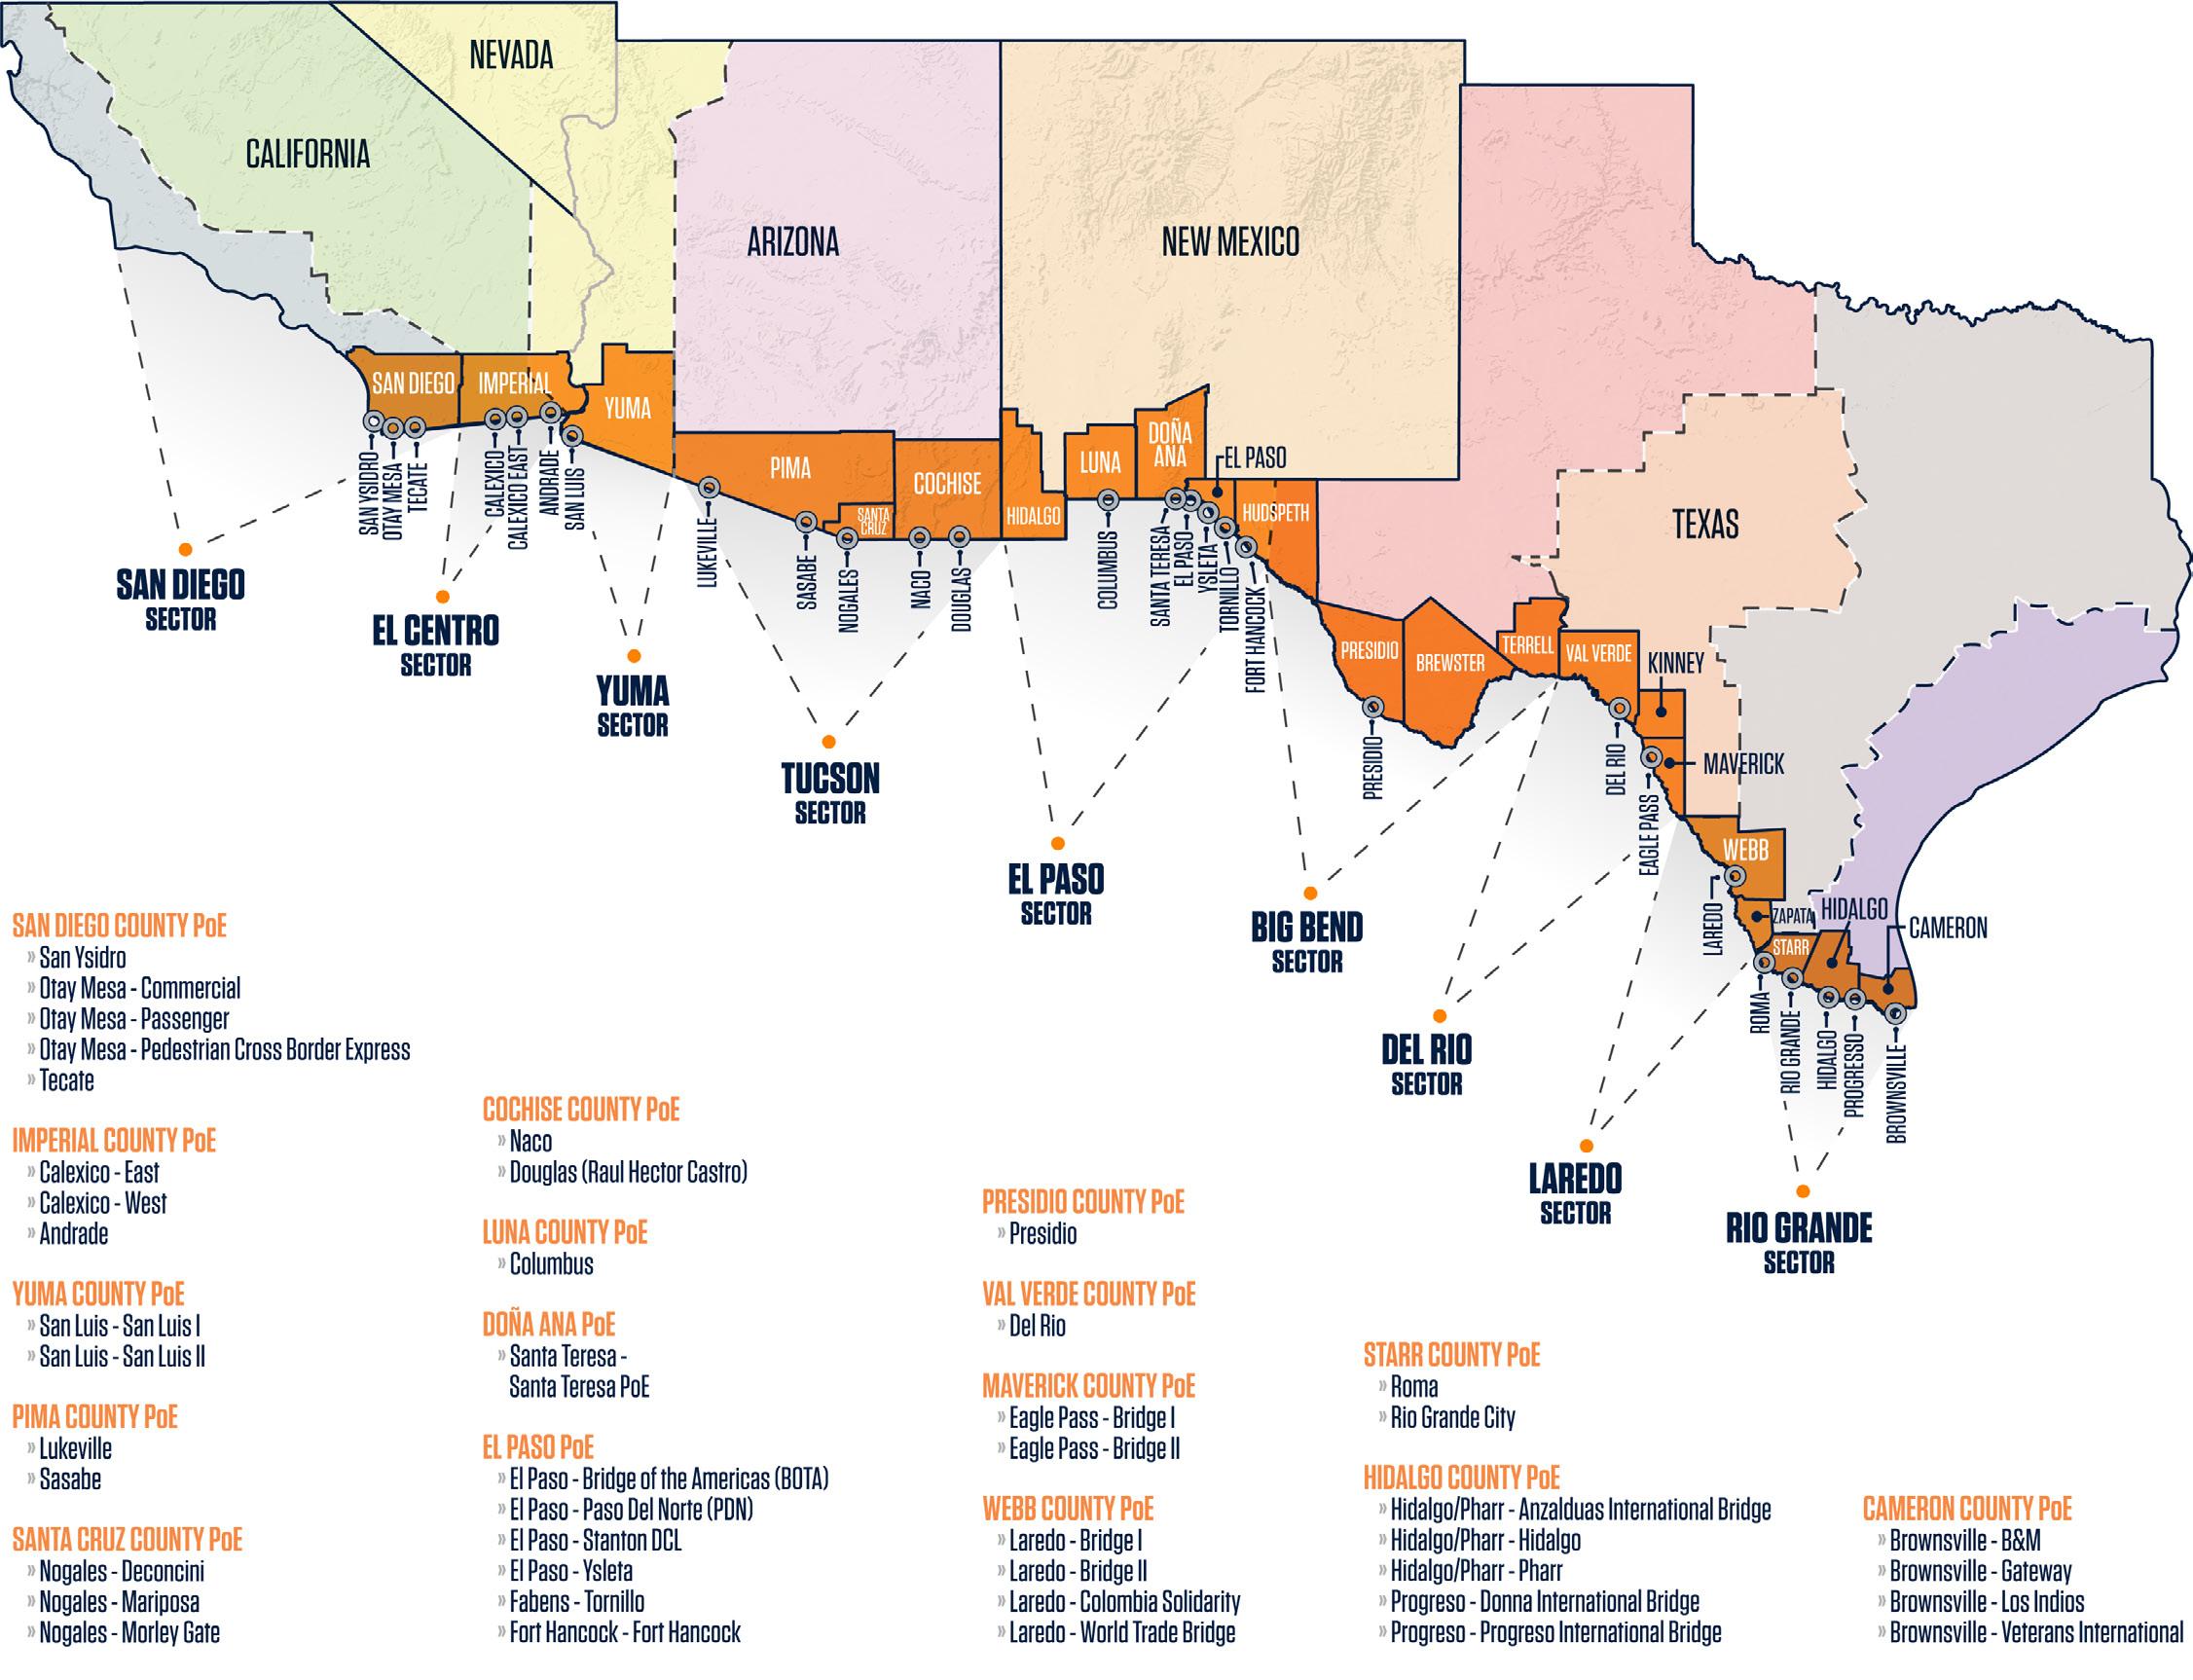
SOURCE: The Hunt Institute for Global Competitiveness and COLEF using data from CBP.
Table A1 lists every US county that touches the US-Mexico border. The list includes the name of every port of entry within that county, the names of the corresponding Mexican counties, and the CBP sector that contains that county.
21 ATLANTIC COUNCIL THE ECONOMIC IMPACT OF A MORE EFFICIENT US-MEXICO BORDER
APPENDIX A
Table A1: US-Mexico Border States, Counties, Cities, Ports of Entry, Mexican Sister Cities, and CBP Sectors
State County City PoE
San Ysidro San Ysidro
Otay Mesa - Commercial Otay Mesa - Passenger
California
Arizona
San Diego
New Mexico
Texas
Sister City CBP Sector
Tijuana, Baja California San Diego Sector, CaliforniaOtay Mesa
Tecate
Imperial Calexico
Otay Mesa - Pedestrian Cross Border Express
Tecate
Calexico - East
El Centro Sector, CaliforniaCalexico - West Andrade Andrade
Yuma San Luis
San Luis - San Luis I
San Luis - San Luis II
Mexicali, Baja California
San Luis Rio Colorado, Sonora Yuma Sector, Arizona
Pima Lukeville Lukeville Puerto Peñasco, Sonora
Santa Cruz Nobales
Tucson Sector, Arizona Sasabe Sasabe Sáric, Sonora
Nogales - Deconcini
Nogales - Mariposa
Nogales - Morley Gate
Nogales, Sonora
Cochise Naco Naco Naco, Sonora
Douglas Douglas (Raul Hector Castro) Agua Prieta, Sonora
Luna Columbus Columbus Asencion, Chihuahua El Paso Sector, New MexicoDoña Ana Santa Teresa Santa Teresa - Santa Teresa Port of Entry Ciudad Juarez, Chihuahua
El Paso - Bridge of the Americas (BOTA)
El Paso - Paso del Norte (PDN)
El Paso El Paso
El Paso - Stanton DCL
El Paso - Ysleta
Ciudad Juarez, Chihuahua El Paso Sector, Texas
Hudspeth Fort Hancock Fort Hancock - Fort Hancock El Paso Fabens Fabens - Tornillo Guadalupe, Chihuahua Presidio Presidio Presidio Ojinaga, Chihuahua Big Bend Sector, Texas
Val Verde Del Rio Del Rio Acuña, Coahuila
Del Rio Sector, TexasMaverick Eagle Pass
Webb Laredo
Eagle Pass - Bridge I Piedras Negras, Coahuila
Eagle Pass - Bridge II
Laredo - Bridge I
Laredo - Bridge II
Laredo - Colombia Solidarity
Laredo - World Trade Bridge
Starr Roma Roma
Nuevo Laredo, Tamaulipas
Ciudad Miguel Aleman, Tamaulipas
Rio Grande Rio Grande City Camargo, Tamaulipas
Hidalgo/Pharr - Anzalduas International Bridge
Hidalgo County Hidalgo/ Pharr
Hidalgo Progreso
Cameron Brownsville
Hidalgo/Pharr - Hidalgo
Hidalgo/Pharr - PharrProgreso - Donna International Bridge
Progreso - Donna International Bridge
Progreso - Progreso International Bridge
Brownsville - B&M
Brownsville - Gateway
Brownsville - Los Indios
Brownsville - Veterans International
Reynosa, Tamaulipas
Laredo Sector, Texas
Rio Grande Valley Sector
Rio Bravo, Tamaulipas
Matamoros, Coahuila
SOURCE: The Hunt Institute for Global Competitiveness and El Colegio de la Frontera Norte (COLEF) using data from CBP.
22 ATLANTIC COUNCIL THE ECONOMIC IMPACT OF A MORE EFFICIENT US-MEXICO BORDERAPPENDIX A
Running the necessary regressions to determine the impact of border wait times on border crossings requires data on several variables in various geographies. The data gathered for the regression analysis includes:
1. Average wait times: Border wait times at ports of entry were obtained from CBP. The research team used this data to estimate the monthly average border wait time (in minutes) for every land port of entry. This data was available for commercial vehicles, personal vehicles, and pedestrian modes of crossing, but not for rail crossings.32 Commercial vehicle data for the Hudspeth port of entry were unavailable for this variable.33
2. Total number of crossings per month: Data was captured from the US Department of Transportation’s Bureau of Transportation Statistics for each port of entry on the US-Mexico border and mode of crossing (commercial vehicles, noncommercial vehicles, and pedestrian crossings). The analysis uses these data to estimate the total number of crossings per city and county. The data for the Fort Hancock port of entry was unavailable for this variable.
3. Number of operational lanes per month: The total number of operating lanes per hour per port of entry was taken from the CBP for every port of entry. This analysis used the point of entrylevel data to estimate the number of operational lanes by city and county. The research team estimated an hourly average for every port of entry, using it to estimate a monthly average of the number of lanes in operation per port of entry. The commercial vehicles data for the Eagle Pass port of entry were not available for this variable.
4. Total number of existing lanes: The total number of existing lanes for every port of entry was captured from CBP. Commercial vehicle data for the Fort Hancock port of entry were unavailable for this variable.
5. Total employment (United States): The monthly data of total non-farm employment information for each US county on the US-Mexico border with ports of entry was obtained from the US Department of Labor’s Bureau of Labor Statistics.
6. Total employment (Mexico): The monthly data on total non-farm employment for each of the Mexican counties on the US-Mexico border with a port of entry was acquired from the Instituto Mexicano del Seguro Social (IMSS or Mexico’s Institute of Social Security).
7. Illegal Apprehensions: CBP provided its complete monthly number of illegal apprehensions for every sector within the southern border. See Map 2 for the boundaries of each CBP sector. This variable serves as a measure of crime in the United States.
8. Homicide rate: The total number of homicides per county was obtained for every northern Mexican municipality from the Secretariado Ejecutivo del Sistema Nacional de Seguridad Publica (Mexico’s Executive Secretary of the National Public Security System), the Mexican agency that compiles the total number of homicides per county. Mexican population data is available from two Mexican agencies, the Instituto Nacional de Estadística y Geografía (INEGI or the National Institute of Statistics and Geography) and the Consejo Nacional de Población (CONAPO or the National Council on Population). This variable serves as a measure of crime in Mexico.
9. Federal Expenditures (United States): Federal costs data were obtained for the following federal agencies: CBP, US Coast Guard, Transportation Security Administration, Federal Law Enforcement Training Center, and US Immigration and Customs Enforcement. These expenses were gathered for the following counties: San Diego and Imperial in California; Yuma, Pima, Santa Cruz, and Cochise in Arizona; Luna and Doña Ana in New Mexico; and El Paso, Presidio, Val Verde, Maverick, Webb, Starr, Hidalgo, and Cameron in Texas.
10. Trade: The data obtained from the US Trade Census consists of the value of the total imports and exports that cross the US-Mexico border ports of entry every month.
IMPACT OF A MORE EFFICIENT US-MEXICO BORDER
23 ATLANTIC COUNCIL THE ECONOMIC
APPENDIX A
APPENDIX B: FIXED EFFECTS MODEL
Calculating the economic impact of a more efficient and secure border, requires understanding the relationship between wait times and the number of border crossings.
The data across counties shows a low yet positive correlation between noncommercial crossings and wait times, suggesting that increased wait times are associated with more border crossings.34 This counterintuitive finding is explained by the fact that increased border usage (or border congestion) results in both longer wait times and more crossings. Therefore, to determine the underlying relationship between border wait time and crossings, the research team used an econometric model to control for other factors that may influence border crossings. The following equation is estimated by fixed effects using monthly county-level data from April 2016 through December 2019.35
crossit = β1waitit + β2 Xit+ i+uit ,t = 1,2, ..., T


In the estimation equation, crossit and waitit denote the number of crossings (either commercial or noncommercial) and average wait times in county i at time t , respectively All additional time-varying explanatory variables are included in Xit, while i denotes the timeconstant fixed effect for county i and uit denotes the error term.36
The additional controls in Xit account for other factors influencing crossings and include a measure of employment in the United States and Mexico, a measure of crime in both countries, the number (or proportion) of lanes in operation, total expenditures by DHS, and a measure of trade (included in the commercial regression only).
The left panel of Table B1 provides regression results for commercial crossings, while the right panel shows results for noncommercial crossings. The coefficient estimate on wait times is of primary interest, which is negative and statistically significant in both regressions. Specifically, the analysis found that a one-minute reduction in wait times results in 53 additional commercial crossings and 502 noncommercial crossings on average per month.
The coefficient on wait times in the commercial crossing regression is statistically significant at 10 percent. Each additional commercial crossing represents another cargo container (loaded or unloaded) crossing into the United States via a land port of entry. The coefficient on wait times in the noncommercial crossings regression is statistically significant at 5 percent. Each additional noncommercial crossing represents a personal vehicle crossing into the United States via a land port of entry.
Regression results suggest an inverse relationship between wait times and commercial and noncommercial border crossings. Including additional time-varying controls and time-constant fixed effects helped to reverse the counterintuitive finding of a positive correlation reported above. As such, Table B1 describes the underlying relationship between border wait times and border crossings. These findings can be used to determine how improved border management techniques or the adoption of new technologies affect commercial and noncommercial border crossings.
Table B1: Fixed Effects Regression Results
Regression Results
Commercial Crossings Noncommercial Crossings
Wait times -53.23* -502.05** (30.34) (227.18)
Employment in US 0.03 0.23 (0.05) (0.41)
Employment in Mexico -0.01 0.05 (0.02) (0.17)
Crime in US -0.03 -1.16*** (0.04) (0.43)
Crime in Mexico -17.60*** -30.00 (5.56) (98.12)
Lanes operational 487.29 314031.50*** (1998.54) (68954.24)
DHS Expenditures -0.002** 0.01 (0.001) (0.01)
Trade 8.92E-06*** (5.09E-07)
Constant 8307.01 268168.40*** (6615.80) (48439.59)
Sample Size 554 585 R^2 0.95 0.76
SOURCE: The Hunt Institute for Global Competitiveness and the COLEF, using data from the US Department of Transportation.
NOTE: The standard error is in parentheses. ***Statistically significant at 1 percent. **Statistically significant at 5 percent. *Statistically significant at 10 percent.
THE
IMPACT OF A MORE EFFICIENT US-MEXICO BORDER
24 ATLANTIC COUNCIL
ECONOMIC
APPENDIX B
APPENDIX C: ECONOMIC IMPACT ANALYSIS OF BORDER CROSSINGS
The regression results presented in Appendix B established a link between border wait times and commercial and noncommercial crossings. This serves as the first step in understanding the economic impact of reduced border wait times. Additional data is needed to determine the economic impact of reductions in border wait times. The following subsections explain the steps taken to produce the economic impact results described in the main text.
Appendix C1: Economic Impact of Commercial Crossings
The regression results described in Appendix B indicate that a one-minute reduction in average commercial wait times results in approximately fifty-three additional container crossings per month. Data from the US Department of Transportation’s Bureau of Transportation Statistics were used to estimate that approximately 73.1 percent of these containers would be loaded with an average value of $66,798 (for a detailed breakdown of the proportion of loaded containers crossing the US-Mexico border and their average cargo value, see table 1 on page 13). This means that a 10-minute reduction in wait times would result in 532 additional container crossings, of which 388 would be loaded with $25,879,549 in cargo value.
Appendix C2: Economic Impact of Noncommercial Crossings
Individuals crossing from Mexico into the United States make purchases on the US borders and in states, contributing to local economies. Due to underlying economic linkages, this spending has an amplified national impact. To estimate this impact, the research team used IMPLAN—a regional economic impact software—, data on expenditure patterns, and the average number of border crossings aggregated to the county level. Below is an overview of the data and model used to estimate the economic impact of the expenditures that result from these noncommercial border crossings.
A 2019 study by the City of El Paso International Bridges Department quantifies the social and economic cross-border activities from vehicle and pedestrian crossings through the El Paso–Ciudad Juárez port of entry. The study consisted of two surveys. First, a short questionnaire administered to US-Mexico border crossers between October 1 and December 31, 2019. Residents who indicated Mexico as their primary place of residence received an entry survey, while those indicating the United States as their primary place of residence received an exit survey. The entry survey captured the planned activities and expenditures of those traveling to El Paso from Ciudad Juárez, while the exit survey captured the activities and spending already made by those traveling to Ciudad Juárez from El Paso.
THE
IMPACT OF A MORE EFFICIENT US-MEXICO BORDER
25 ATLANTIC COUNCIL
ECONOMIC
APPENDIX C
Survey respondents were asked questions related to four categories:
• Demographics
• Reasons for crossing
• Anticipated spending (including the area of spending)
• Trip characteristics
This report focused on survey responses related to the intended destination (El Paso or other) and expected spending across various categories. The survey results indicate that approximately 80 percent of individuals crossing the border (by vehicle and as pedestrians) remained in El Paso, while 20 percent continued to another location. Of the 80 percent who stayed in El Paso, approximately 64 percent of those who crossed by vehicle and 47 percent who crossed as pedestrians reported positive expected expenditures. The survey data breaks down the dollar amount individuals expected to spend within twenty categories.37
This information was used to calculate the average expenditure per crosser, for both vehicle and pedestrian crossings. These expenditures were then scaled by the total number of vehicle and pedestrian crossings in 2019 (after scaling by the proportion of crossers who remained in El Paso and reported spending money) to determine the average expenditure of crossings in 2019 for El Paso County.
To establish the economic impact of these expenditures at the national level, the average expenditures by crossers in 2019 were computed for the following border counties:
• Texas: Presidio, Val Verde, Maverick, Webb, Starr, Hidalgo, and Cameron
• New Mexico: Luna and Doña Ana
• Arizona: Yuma, Pima, Santa Cruz, and Cochise
• California: San Diego and Imperial
Unfortunately, detailed expenditure data were unavailable for the other border counties. However, the El Paso survey was used with the assumption that spending patterns across the twenty categories do not change across counties. First, the average expenditures per crosser for each category was recovered from the El Paso survey. These expenditures were then scaled up or down based on the average household income in the neighboring Mexican state relative to the average household income in Chihuahua (the Mexican state neighboring El Paso). Once this income adjustment was made, the average 2019 expenditures were scaled by the number of vehicle and pedestrian crossings in 2019 for each border county listed above. This exercise reveals the total spending in the twenty categories for each of the sixteen border counties considered in the analysis.38
These findings were used as inputs into IMPLAN to estimate the economic impact of expenditures by individuals crossing the US-Mexico border. First, the twenty expenditure categories from the survey were mapped into comparable IMPLAN industries. Then, industry output (spending) was reduced in these industries for each of the sixteen counties. Twenty adverse output (spending) events were modeled separately in the sixteen counties for a total of 320 events. The rest of the United States was then built up, county-bycounty for Texas, New Mexico, Arizona, and California; and state-bystate for the non-border states. Finally, the national-level analysis was run using IMPLAN’s multiregion input-output feature, allowing for additional indirect linkages between regions within the analysis. Tables C2.1 and C2.2 present the main findings.
THE ECONOMIC IMPACT OF A MORE EFFICIENT US-MEXICO BORDER
26 ATLANTIC COUNCIL
APPENDIX C
Source:
1
Table C2.1: Economic Impact of Removing Cross-Border Spending in the United States (2022)
Added Output
-$2,765,047,740.91 -$5,036,142,293.41
-$1,980,607,178.46 -$4,118,866,436.04
-$1,771,486,445.19 -$3,177,688,817.94
-$6,517,141,364.56 -$12,332,697,547.38
Hunt Institute
COLEF,
As shown on Table C2.1, removing cross-border spending by noncommercial crossers results in approximately 100,433 fewer jobs in the United States. Approximately 60 percent of this job loss is directly caused by reduced expenditure. The remaining 40 percent is due to indirect and induced effects. Removing crossborder spending would also result in a loss of $12,332,697,547 in economic output. Approximately 41 percent of this output loss is explained by the direct effects of reducing expenditures and 59 percent by indirect or induced effects.
Table C2.2 includes the top five most impacted industries in terms of output lost due to the reduction in cross-border spending by noncommercial crossers. As expected, these industries are concentrated in areas where tourists or temporary visitors would
likely spend money. The three sectors with the largest output loss include retail, full-service restaurants, and general merchandise. As such, the entire output loss within these industries was due to sectoral linkages with other areas experiencing direct impacts.
IMPLAN results in Table C2 can be combined with the regression results in Appendix B to determine the economic impact of reducing noncommercial border wait times. The research team divided the total output loss resulting from eliminating noncommercial crossings by the total number of crossers in 2019, 87,812,443.39 This yields a value of $140.44 which can be interpreted as the output loss associated with losing one noncommercial crosser or the output gain associated with one additional noncommercial crosser.
-$56,187,767.71
27 ATLANTIC COUNCIL THE ECONOMIC IMPACT OF A MORE EFFICIENT US-MEXICO BORDER
APPENDIX C Table C2.2: Top Five Industries with Reductions in Economic Output from Removing Cross-Border Spending in the United States (2022) Impact 1 - Direct 2 - Indirect 3 - Induced Impact output Industry display Impact output Impact output Impact output 1 Retail: Clothing and ccessories -$2,161,062,814.49 -$707,698.49 -$23,321,554.17 -$2,185,092,067.16 2 Other real estate services $0.00 -$740,224,149.66 -$130,392,264.37 -$870,616,414.03 3 Full service restaurants -$713,075,639.37 -$28,572,142.09 -$65,051,510.06 -$806,699,291.52 4 General merchandise -$575,957,329.13 -$2,040,513.78 -$36,955,115.99 -$614,952,958.90 5 Management $0.00 -$397,735,328.22
-$453,923,095.93 Source: The Hunt Institute for Global Competitiveness and the COLEF, using IMPLAN.
Impact Employment Labor Income Value
- Direct -60,619.16 -$1,812,022,814.56
2 - Indirect -21,166.07 -$1,234,825,927.30
3 - Induced -18,648.05 -$977,441,701.68
-100,433.29 -$4,024,290,443.54
The
for Global Competitiveness and the
using IMPLAN.
APPENDIX D: DESCRIPTION OF THE INPUT-OUTPUT AND QUEUING MODELS
Appendix D1: The queueing model
This study uses a queuing model to evaluate how wait times for commercial vehicles at the US-Mexico border affect Mexican exports to the United States. A queueing model mathematically describes a queuing system, making specific assumptions about the probabilistic nature of the number and type of servers (commercial vehicles), the arrival and service processes (border processing rates), and the queue discipline and organization. For this study, this can be described as:
E'j,t = E'j,0- ∆ %(λ-μ)*
Where;
E'j,0 (1)
hour (μ). To conduct the queuing analysis, these two variables must be known beforehand. Appendix D3 shows how they were defined.
Besides the variables λ and μ , the queuing model considers other key variables, including the value of exports transported by commercial vehicles and the number of lanes in operation. The former was determined using data from the US Department of Transportation’s Bureau of Transportation Statistics (see Appendix C1), and the latter with data from CBP. Additionally, this study considers the system in its steadystate of operation, i.e., during time intervals when λ and μ behave normally. This means that anomalous states of operation are removed from the analysis (such as the first 30 minutes in the workday when personnel perform preparatory activities).
E'j,t = commercial vehicles processed per hour at t ≥1.
E'j,0 = commercial vehicles processed per hour at t=0.
λ = the average number of commercial vehicles arriving per hour.40
μ = the average number of commercial vehicles dispatched per hour.41
α = the share of sectoral exports in total exports per hour (E'j,0 / ∑ E'j,0).
∑ E'j,0 = the total number of commercial vehicles per hour in the economy.
The E'j,0 vector also serve as a measure of Mexican exports, given that commercial vehicles entering the United States are loaded with Mexican goods.
In equation (1), the assigned volume is the number of commercial vehicles arriving at a border checkpoint every hour (λ ), while the volume processed is the processing capacity of the checkpoint per
As equation (1) shows, when the volume of commercial vehicles in the system is processed immediately [( λ-μ ) = 0] , there would be no queues. As a result, wait times would be insignificant, and the value of Mexican exports entering the United States in commercial vehicles would be E'j, 0 . However, when the assigned volume of commercial vehicles is greater than the volume of vehicles processed [ ( λ-μ ) > 0 ] , a queue forms, leading to increased wait times and reducing the number of commercial vehicles crossing the border with Mexican export goods (reducing E'j,t). This calculation produces approximate wait times, which are sufficiently accurate to understand the overall distribution of traffic between land ports of entry across the US-Mexico border.
Once approximate wait times are established, it is important to verify the model’s validity. Using a chi-square goodness of fit test, the observed distribution of the variables λ and μ is compared with their theoretical distribution, demonstrating the degree of adjustment between the sample (the average service rate for one checkpoint) and the population (the average service rate for all checkpoints across the US-Mexico border). This hypothesis test concludes, with a certain degree of statistical significance, that the sample in this study is representative of the full population.
THE
IMPACT OF A MORE EFFICIENT US-MEXICO BORDER
28 ATLANTIC COUNCIL
ECONOMIC
αj ∑
APPENDIX D
Appendix D2: Intersectoral input-output model
Input-output models are a form of macroeconomic analysis based on the interdependencies (the flow of goods and services) between different economic sectors. They are commonly used to estimate the impacts of positive or negative economic shocks and their ripple effects throughout an economy.
This study uses an input-output model to determine how increased Mexican exports stemming from reduced border wait times (previously established using a queuing model; see Appendix D1) affect aggregate demand in Mexico (calculated as aggregate demand = C + I + G + Nx , where: C = consumer spending; I = private investment and corporate spending; G = government spending; and Nx = net exports (exports minus imports).
Economic sectors respond to increases in aggregate demand directly by supplying final goods (increasing output) or indirectly by producing intermediate goods for sectors that respond directly (increasing intermediate sales). Therefore, findings are then used to calculate the impact on total gross output and intermediate sales across sectors of the Mexican economy.
Equation (2) estimates the impact of increased demand for Mexican exports on output per sector:
Xj,0 = (I-A)-1Yj,0 (2)
Where:
Xj,0 = the total gross output vector per sector at t=0
( I-A ) -1 = the Leontief inverse (or the matrix of indirect and direct multipliers). In which I = identity matrix and A = technical coefficient matrix.
Yj,0 = the aggregate demand vector per sector at t=0
Therefore, equation (2) could be re-written as:
Xj,0 = (I-A)-1E'j,0 (3)
Where:
E'j,0 = the exports vector per sector at t=0
As discussed in Appendix D1, E'j,0 can be interpreted as “commercial vehicles processed by the customs system every hour” and equation (3) expressed as:
Xj,t = (I-A)-1E'j,t (4)
Where E'j,0 = commercial vehicles processed per hour at t ≥ 1
This interpretation makes two assumptions: (a) that the system operates at full capacity and (b) that the volume of commercial vehicles in the system is processed immediately [ ( λ-μ ) = 0 ] , resulting in no wait times (see Appendix D1). In other words, the input-output model is static.
However, this is not always the case, given that commercial vehicle arrivals and departures to and from border checkpoints do not happen at fixed intervals (they are uncertain). Therefore, by incorporating specific trajectories describing the behavior of E'j,t (changes to the number of commercial vehicles processed by customs checkpoints due to reduced wait times), the static inputoutput model can be used to estimate the impact of increased Mexican exports on total gross output per sector. This is calculated with the equation:
Lj,t = ∑ [Xj,t +Xj,0] (5)
Where:
Lj,t = the impact on total gross output.
Xj,0 = the total gross output vector per sector at t=0 (before reduced wait times and no changes to E'j,0).
Xj,t = the total gross output vector per sector at t ≥1 (after reduced wait times and changes to E'j,t).
j = 1- n sectors.
THE ECONOMIC IMPACT OF A MORE EFFICIENT US-MEXICO BORDER
29 ATLANTIC COUNCIL
APPENDIX D
Appendix D3: Establishing the assigned volume and processing rate of commercial vehicles
Estimating the average processing capacity of a port of entry requires data on the volume of commercial vehicles serviced and the number of lanes, hours, and days in operation for that port of entry. For land ports of entry across the US-Mexico border, these data were obtained from the Bureau of Transportation Statistics’ Border Crossing Data.42 Table D3 shows data for the Otay Mesa port of entry in Baja, California, the third-busiest on the US-Mexico border.43 The Otay Mesa example helps to illustrate how processing capacity was calculated for other ports of entry as part of this study.
On average, one lane in the Otay Mesa port of entry operates 65 hours per week. Together, its ten lanes would operate 650 hours per week, meaning that, together, the lanes of the Otay Mesa port of entry operate for approximately 33,800 hours in one year (52 weeks). Given that 962,577 commercial vehicles are serviced per
year, a total of 18,511 trucks would cross the border weekly. For one lane, this translates to 1,851 trucks per week, 370 per day, and 28.5 per hour.
Having established the number of commercial vehicles serviced per hour (28.5 vehicles), an M/M/1 queue was simulated (see Appendix D1) to estimate the average processing capacity (μ ), showing that border wait times for commercial vehicles are approximately 21.5 minutes.44
Enhanced border management practices and the implementation of new technologies would improve the processing capacity of ports of entry, reduce commercial wait times, and allow more Mexican exports to enter the United States. This would boost total gross output, aggregate demand, and intermediated sales across various sectors in the Mexican economy, as well as employment and labor income (see Appendices F and G for input-output analysis results).
Item Value
Total number of commercial vehicles serviced per year 962,577
Hours in operation per day 13
Days in operation per week 5
Maximum number of lanes in operation 10
FUENTE: Cálculos propios con base en Información procedente de <https://bwt.cbp.gov/> y <Border Crossing/Entry Data - Bureau of Transportation Statistics
THE
IMPACT OF A MORE EFFICIENT US-MEXICO BORDER
Table D3: Data for the Otay Mesa Port of Entry
30 ATLANTIC COUNCIL
ECONOMIC
APPENDIX D
APPENDIX E: DATA USED FOR THE ANALYSIS
This study relied on the North American Industry Classification System (NAICS) and the Sistema Automatizado de Información Censal (ACIS or Automated Census Information System) to further understand Mexico’s productive sector and commercial relationship with the United States. It also used data from the Instituto Nacional de Estadística y Geografía (INEGI or the National Institute of Statistics and Geography).
The NAICS, jointly developed by the US Economic Classification Policy Committee, INEGI, and Statistics Canada, classifies North American business statistics, allowing for a high level of comparability between economic activities in the United States, Mexico, and Canada. The sectors shown in Table E1, classified by NAICS in 2018, were used for this study.
The INEGI used data from economic censuses in Mexico, systematized in the ACIS,45 to produce an input-output matrix46 for the Mexican economy in 2013. It then used a RAS method to estimate a matrix for 2018.47 The 2018 matrix was used as part of this study to determine the top ten Mexican sectors exporting to the United States, which were later used in the intersectoral inputoutput analysis described in Appendix D2. Results on the economic impact of reduced border wait times on sectoral output, aggregate demand, and intermediate sales appear in Appendix F2.
Additionally, the 2018 input-output matrix and vectors for employment and labor income in Mexico were used to estimate how reduced commercial wait times affect employment and labor income, as shown in Appendix G. The vectors were calculated using data from the ACIS.
Table E: Sectoral Classification of the North American Industry Classification System (NAICS) (2018)
NAICS Code Sector
11
Agriculture, animal breeding and exploitation, forestry, fishing and hunting
21 Mining
22
31-33
Electric power generation, transmission and diffusion, water and gas supply through pipelines to final consumers
Construction
Manufacturing industries
Wholesale trade
Retail trade
Transportation, postage, and warehousing
Mass media information
Financial and insurance services
Real estate and rental services of personal and intangible property
Professional, scientific, and technical services
Corporate
Business support services and waste and residue management and remediation services
Educational services
Health and social welfare services
Cultural, sports, and other recreational services
Temporary accommodation services and food and beverage preparation services
Other services, except government activities.
Legislative, governmental, law enforcement, and international and extraterritorial organization activities
SOURCE: The Colegio de la Frontera Norte using the 2018 sectoral classification of the NAICS
THE
IMPACT OF A MORE EFFICIENT US-MEXICO BORDER
31 ATLANTIC COUNCIL
ECONOMIC
APPENDIX E
23
43
46
48-49
51
52
53
54
55
56
61
62
71
72
81
93
APPENDIX F: ECONOMIC IMPACT ANALYSIS OF BORDER CROSSINGS
This study first established a baseline of Mexican exports to the United States without reduced wait times, which allowed for the determination of the top ten sectors exporting to the United States and the effect that exports have on sectoral output in Mexico. Then, an analysis with reduced border wait times was conducted, and baseline results were compared with new findings to determine the relative and absolute variation in sectoral output, aggregate demand, and intermediate sales stemming from reduced wait times. The values in all Appendix F tables appear in 2018 US dollars, using a conversion rate of 1 US dollar to 20.03 Mexican pesos. Results have yet to be adjusted to 2022 values, using inflation and consumer price index (CPI) historical data from the United States.
Appendix F1: Analysis without reduced border wait times
Assessing the economic impact of a one-minute reduction in border wait times requires understanding the US-Mexico commercial relationship and how it drives sectoral output in Mexico. As shown in Figure F1, ten sectors produced 99.86 percent of total Mexican exports to the United States in 2018. Therefore, this study considers these ten sectors.
Figure F1: Top Ten Mexican Sectors in Terms of Exports to the United States (2018)
THE ECONOMIC IMPACT OF A MORE EFFICIENT US-MEXICO BORDER
32 ATLANTIC COUNCIL
APPENDIX F SOURCE: In-house, prepared using 2018 using data obtained from INEGI (2022).
• 31-33 - Manufacturing • 43 - Wholesale trade • 21 - Mining • 48-49 - Transportation, postage, and warehousing • 46 - Retail trade • 11 - Agriculture, animal breeding and exploitation, forestry, fishing, and hunting • 52 - Financial and insurance services • 22 - Electric power generation, transmission and diffusion, and water and gas supply through pipelines to final consumers • 51 - Mass media information • 54 - Professional, scientific, and technical services 3.97% 0.82% 0.05% 0.02% 1.92% 6.81% 6.30% 63.24% 16.80% 0.05%
The input-output analysis was employed to estimate the baseline output per sector driven by Mexican exports to the United States, using equation (3) in Appendix D2 [ X j, 0 = ( I-A ) -1 E' j, 0] . Table F1
includes results in relative and absolute terms, showing that, on average, Mexican exports to the United States drive 38 percent of total gross output per sector in Mexico.
NAICS classification code
Table F1: Total Gross Output (TGO) Driven by Mexican Exports to the United States (2018)48
Sector
Total Percentage
Mining 976,753.75 68.91% 31-33 Manufacturing 9,992,494.79 68.79%
21
43
11
Wholesale trade 1,724,997.69 63.26%
Agriculture, animal breeding and exploitation, forestry, fishing, and hunting 630,344.07 50.86%
Electric power generation, transmission and diffusion, and water and gas supply through pipelines to final consumers 234,304.63 31.91% 48-49 Transportation, postage, and warehousing 682,499.14 27.21%
22
54
Professional, scientific, and technical services 155,642.26 26.37%
46 Retail trade 477,034.24 17.72% 52
Financial and insurance services 185,136.92 13.40% 51 Mass media information 79,296.98 12.22%
Total 15,138,504.47 380.65%
Average 1,513,850.45 38.07%
SOURCE: In-house, prepared estimates based on estimates for 2018 using data obtained from INEGI (2022).
EFFICIENT
33 ATLANTIC COUNCIL THE ECONOMIC IMPACT OF A MORE
US-MEXICO BORDER
APPENDIX F
Appendix F2: Analysis with reduced wait times
A second input-output analysis was performed to determine how the positive economic shock (increased Mexican exports caused by reduced border wait times) affected total gross production per sector (X j,t ). This is estimated using equation (4) in Appendix D2 [Xj,t = (I-A)-1E'j,t], where E'j,t is the exports vector and j the number of sectors.
Given the interdependencies between sectors, the economic impact of reduced border wait times spreads throughout productive sectors in the Mexican economy. Therefore, results show the average percentage increase in output, aggregate demand, and final sales per sector driven by additional Mexican exports to the United States (caused by a one-minute reduction in border wait times). Table F2.1 shows findings in terms of total gross output, while Tables F2.2 and F2.3 include results for aggregate demand and intermediate sales, respectively.
Table F2.1: Growth in Total Gross Output (TGO)49
NAICS
Classification code Sectors
11
Absolute (TGO)
Total Gross Output
Change driven by Mexican exports Percentage increase
Agriculture, animal breeding and exploitation, forestry, fishing, and hunting 61,870,394,408.39 63,525,716,328.93 2.68%
21 Mining 70,768,853,919.12 73,333,868,768.35 3.62%
22
31-33
43
46
48-49
51
Electric power generation, transmission and diffusion, and water and gas supply through pipelines to final consumers 36,661,826,110.83 37,277,124,334.51 1.68%
Manufacturing industries 725,175,223,165.25 751,416,123,114.45 3.62%
Wholesale trade 136,148,265,851.22 140,678,214,854.59 3.33%
Retail trade 134,388,874,388.42 135,641,595,360.59 0.93%
Transportation, postage, and warehousing 125,222,060,808.79 127,014,345,127.69 1.43%
Mass media information 32,404,278,182.73 32,612,516,876.33 0.64%
52
Professional, scientific, and technical services 29,468,317,923.12 29,877,043,990.12 1.39%
Financial and insurance services 68,962,248,726.91 69,448,429,551.32 0.70% 54
Average 142,107,034,348.48 146,082,497,830.69 2.00%
SOURCE: In-house, prepared estimates based on estimates for 2018 using data obtained from INEGI (2022).
34 ATLANTIC COUNCIL THE ECONOMIC IMPACT OF A MORE EFFICIENT US-MEXICO BORDER
APPENDIX F
Table F2.2: Growth in intermediate sales50
NAICS Classification code Sectors
11
21
22
31-33
43
Intermediate Sales
Absolute intermediate sales Change driven by Mexican exports Percentage increase
Agriculture, animal breeding and exploitation, forestry, fishing, and hunting 37,715,987,831.23 39,017,404,257.82 3.45%
Mining 38,319,742,304.75 39,627,221,214.17 3.41%
Electric power generation, transmission and diffusion, and water and gas supply through pipelines to final consumers 26,093,440,432.45 26,698,820,186.23 2.32%
Manufacturing industries 500,578,423,695.96 515,136,851,491.74 2.91%
Wholesale trade 50,588,439,711.28 52,014,146,106.25 2.82%
46
51
52
54
Transportation, postage, and warehousing 27,507,131,659.31 28,135,165,832.62 2.28%
Retail trade 20,372,948,351.47 20,891,889,251.96 2.55% 48-49
Mass media information 14,218,572,797.10 14,418,468,679.28 1.41%
Financial and insurance services 23,171,318,014.63 23,506,746,665.51 1.45%
Professional, scientific, and technical services 27,550,006,467.55 27,955,133,873.68 1.47%
Average 76,611,601,126.57 78,740,184,755.93 2.41%
SOURCE: In-house, prepared estimates based on estimates for 2018 using data obtained from INEGI (2022).
Table F2.3: Growth in final demand51
NAICS Classification
11
51
52
54
Sectors
Final demand
Absolute aggregate demand Change driven by Mexican exports Percentage increase
Agriculture, animal breeding and exploitation, forestry, fishing, and hunting 24,154,406,577.15 24,508,312,071.11 1.47%
Mining 32,449,111,614.37 33,706,647,554.19 3.88%
Electric power generation, transmission and diffusion, and water and gas supply through pipelines to final consumers 10,568,385,678.38 10,578,304,148.28 0.09%
industries 224,596,799,469.30 236,279,271,622.71 5.20%
Wholesale trade 85,559,826,139.94 88,664,068,748.35 3.63%
trade 114,015,926,036.95 114,749,706,108.63 0.64%
postage, and warehousing 97,714,929,149.48 98,879,179,295.07 1.19%
Mass media information 18,185,705,385.62 18,194,048,197.05 0.05%
Financial and insurance services 45,790,930,712.28 45,941,682,885.81 0.33%
Professional, scientific, and technical services 1,918,311,455.57 1,921,910,116.43 0.19%
Average 65,495,433,221.90 67,342,313,074.76 1.67%
SOURCE: In-house, prepared estimates based on estimates for 2018 using data obtained from INEGI (2022).
THE ECONOMIC IMPACT OF A MORE EFFICIENT US-MEXICO BORDER
35 ATLANTIC COUNCIL
APPENDIX F
code
21
22
31-33 Manufacturing
43
46 Retail
48-49 Transportation,
APPENDIX G: ECONOMIC IMPACT ON EMPLOYMENT AND LABOR INCOME
Appendix G1: Employment
The effect of a 10-minute reduction in commercial wait times on direct employment in Mexico was estimated using the multiplier:
l = LT [diag(X)-1] (6)
Where: l = the direct employment coefficient
LT = the employment generated per sector52
NAICS
[diag(X)-1] = the diagonal matrix of total gross output (obtained via the input-output model)
To assess the impact on direct and indirect employment, the direct employment coefficient (l) is multiplied by the Leontief inverse:
MED-1 = l[(I-A)-1] (7)
Table G1 shows the original jobs per sector and the new jobs created as a result of increased exports following a 10-minute reduction in commercial wait times. It also includes the difference between these two values and the relative increase and net variation in employment. Results show that 18,697 jobs would be created in one year.
Table G1: Impact on Direct and Indirect Employment of a More Efficient US-Mexico Border
Original New Difference
11 Agriculture, animal breeding and ex ploitation, forestry,
SOURCE: In-house
Relative Increase Net Variation
0.7 0.3% 748.2
2.2 1.2% 2,220.1
0.1 0.1% 129.3
12.8 -0.8 0.0% -793.1
11.6 3.2 0.2% 3,216.0
1.7 0.0% 1,748.8
-0.2 0.0% -210.3
3.7 1.0% 3,684.5
5.5 0.8% 5,505.5
2.4 0.3% 2,448.6
3.9% 1,8697.6
1.9 0.4% 1,869.8
from INEGI (2022).
THE
IMPACT OF A MORE EFFICIENT US-MEXICO BORDER
36 ATLANTIC COUNCIL
ECONOMIC
prepared estimates based on estimates for 2018 using data obtained
APPENDIX G
Classification code Sectores
fishing, and hunting 5.9 6.6
21 Mining 5.9 8.1
22 Electric power generation, transmis sion and diffusion, and water and gas supply through pipelines to final consumers 7.4 7.5
31-33 Manufacturing industries 13.6
43 Wholesale trade 8.4
46 Retail trade 24.7 26.4
48-49 Transportation, postage, and ware housing 10.3 10.1
51 Mass media information 12.0 15.7
52 Financial and insurance services 10.1 15.6
54 Professional, scientific, and technical services 18.6 21
Total 116.9 135.4 18.5
Average 11.7 13.5
Appendix G2: Labor income
The effect of a 10-minute reduction in commercial wait times on labor income in Mexico was estimated using a two-step process. First, the labor income coefficient was determined with the equation:
r = RemT [diag(X)-1] (8)
Where: r = the labor income coefficient
RemT = the labor income per sector 53
[diag(X)-1] = the diagonal matrix of total gross output
Second, the labor income coefficient (r ) was multiplied by the Leontief inverse:
MRemD-1 =r [(I-A)-1] (9)
Table G2 shows the direct and indirect effects on labor income of increased Mexican exports to the United States stemming reductions in commercial wait times. It includes labor income per sector before reduced wait times (original), labor income after reduced wait times (new), the difference between these two values, and the relative increase and net variation in labor income. Results show that, overall, labor income would increase by $17,474 with a one-minute reduction in border wait times or $174,474 with a tenminute reduction.
NAICS
Table G2: Impact on Labor Income of a More Efficient US-Mexico Border
Original New Difference
Agriculture,
One-minute reduction in wait times
reduction in wait times Relative weight
0.04 0.05 0.01 $ 324.72 $3,247.21 1.9%
Mining 0.10 0.15 0.05 $ 2,643.81 $26,438.14 15.1%
Electric power genera tion,
0.08 0.09 0.01 $ 711.73 $7,117.31 4.1%
Manufacturing industries 0.14 0.15 0.01 $ 467.19 $4,671.91 2.7% 43
Wholesale trade 0.08 0.16 0.08 $ 3,852.29 $38,522.90 22.0%
Retail trade 0.09 0.13 0.04 $ 1,766.03 $17,660.32 10.1% 48-49 Transportation, postage, and warehousing 0.10 0.10 0.00 $ (89.37) $(893.65) -0.5%
51 Mass media information 0.17 0.23 0.06 $ 2,895.81 $28,958.10 16.6%
Financial and insurance services 0.16 0.23 0.07 $ 3,574.24 $35,742.39 20.5%
Professional, scientific, and technical services 0.14 0.17 0.03 $ 1,327.86 $13,278.59 7.6%
Total $ 17,474.32 $174,743.23
Average $ 1,747.43 $17,474.32
SOURCE: In-house prepared estimates based on estimates for 2018 using data obtained from INEGI (2022).
THE ECONOMIC IMPACT OF A MORE EFFICIENT US-MEXICO BORDER
37 ATLANTIC COUNCIL
APPENDIX G
Classification code Sector
10-minute
11
animal breeding and exploita tion, forestry, fishing, and hunting
21
22
transmission and diffusion, and water and gas supply through pipe lines to final consumers
31-33
46
52
54
Acknowledgments
This report was informed by roundtables, focus groups, and consultations carried out in the United States and Mexico and the analysis of economic data. We thank the many individuals and institutions who participated in project activities and research efforts. It was a true pleasure to work with our partners at the University of Texas at El Paso’s (UTEP’s) Hunt Institute for Global Competitiveness and Colegio de la Frontera Norte (COLEF).
We are deeply grateful to the Adrienne Arsht Latin America Center (AALAC) team, who worked tirelessly to produce this report, particularly to Camila Hernández and Ignacia Ulloa, who provided invaluable writing and editorial support. Thank you to Jason Marczak, senior director for AALAC, and Maria Fernanda Bozmoski, deputy director for programs, for their guidance and editorial support.
We thank AALAC Non-Resident Fellow Bosco Martí and the Global Nexus team, specifically Ruben Olmos, Ana Margarita Martínez, and Alejandro Vales, for providing crucial expertise and contributions. Our gratitude extends to Rhonda Shore for her diligent editorial work and to Donald Partyka and Anais Gonzalez for their exceptional design skills.
Most importantly, we thank the US Department of State’s Bureau for International Narcotics and Law Enforcement Affairs for giving the Atlantic Council, UTEP, and COLEF the opportunity to produce this report in service of daily border users and strengthening the US and Mexican economies.
IMPACT
EFFICIENT US-MEXICO
38 ATLANTIC COUNCIL THE ECONOMIC
OF A MORE
BORDER
Endnotes
1 Government of the United States, “Trade in Goods with Mexico,” US Census Bureau, accessed August 16, 2022, https://www.census.gov/foreign-trade/balance/c2010.html; and Government of the United States, “Monthly U.S. International Trade in Goods and Services, June 2022,” US Census Bureau and US Department of Commerce, August 4, 2022, https://www.census.gov/foreign-trade/Press-Release/current_press_release/ft900.pdf.
2 Government of the United States, “Overview of US- North American Freight by Port, Commodity Group, and Mode - Value (in Millions),” US Department of Transportation, accessed August 16, 2022, https://explore.dot.gov/views/Dashboard_PortbyCommodity/Overview?%3Aembed=y&%3Aiid=1&%3AisGuestRedirectFromVizportal=y.
3 Government of Mexico, “US-Mexico Trade Relation,” Embassy of Mexico to the United States of America, Section of Economic Affairs, February 2022, https://embamex.sre.gob.mx/eua/images/stories/economicos/2022/documents/US-MX_Trade_Website_02-2022.pdf.
4 Government of Mexico, Secretariat of Foreign Affairs, Embassy of Mexico to the United States of America, Office of Political Affairs. Information acquired September 8, 2022.
5 Government of the United States, “Mexico: US-Mexico Trade Facts,” Office of the US Trade Representative, accessed August 14, 2022, https://ustr.gov/countries-regions/americas/mexico.
6 Joint Statement by President Biden and President Lopez Obrador, The White House, July 12, 2022, https://www.whitehouse.gov/briefing-room/statements-releases/2022/07/12/president-biden-and-president-lopez-obrador-joint-statement/.
7 The US-Mexico High-Level Economic Dialogue is an opportunity for Mexico and the United States to advance strategic economic and commercial priorities to foster economic development and growth, job creation, and global competitiveness and reduce poverty and inequality.
8 Government of the United States, “Mexico: US-Mexico Trade Facts,” US Trade Representative, accessed August 16, 2022, https://ustr.gov/countries-regions/americas/mexico.
9 Zahniser, Stephen. “COVID-19 Working Paper: U.S.-Mexico Agricultural Trade in 2020,” United States Department of Agriculture, Economic Research Service. January, 2022.
10 Michoacán, Mexico, exports approximately 80 percent of its avocado supply directly to the United States. Government of the United States, “Fresh Avocado Imports from Mexico Resume,” Animal and Plant Inspection Service, United States Department of Agriculture, accessed August 20, 2022. https://www.aphis.usda.gov/aphis/newsroom/stakeholder-info/sa_by_date/sa-2022/avocado-imports-mexico.
11 Ibid
12 Government of the United States, “Hourly Wait Times Trends vs Current,” Customs and Border Protection, accessed August 17, 2022, https://bwt.cbp.gov/details/09250401/POV.
13 Unified Cargo Processing is a program for joint inspection of northbound cargo via free and secure trade lanes. John Davis, “U.S. and Mexico United in Cargo Processing,” US Customs and Border Protection, last modified January 4, 2022, https://www.cbp.gov/frontline/cargo-processing..
14 Global Entry and the Secure Electronic Network for Travelers Rapid Inspection are risk-based programs that allow expedited clearance for pre-approved, low-risk travelers upon arrival in the United States. Government of the United States, “Global Entry: Trusted Traveler Program Enrollment,” US Customs and Border Protection, last modified September 6, 2022, https://www.cbp.gov/travel/trusted-traveler-programs/global-entry; and Government of the United States, “Secure Electronic Network for Travelers Rapid Inspection,” US Customs and Border Protection, last modified January 4, 2022, https://www.cbp.gov/travel/trusted-traveler-programs/sentri.
15 The Customs Trade Partnership Against Terrorism is a voluntary supply chain security partnership used by the public and private sectors. Government of the United States, “CTPAT: Customs Trade Partnership Against Terrorism,” US Customs and Border Protection, last modified August 29, 2022, https://www.cbp.gov/border-security/ports-entry/cargo-security/CTPAT.
16 “SENTRI Program Requirements,” Immigration Passport Visa Service, accessed August 17, 2022, http://immigrationpassportvisa.com/travel/sentri-passprogram-requirements/#:~:text=Over%20175%2C000%20US%20citizens%20and%20Mexican%20citizens%20have%20become%20card%20holders.
17 The Maquiladora Export Industry is a conglomerate of intermediate-good manufacturing companies.
18 According to the North American Industry Classification System (NAICS), a classification scheme for Mexican productive activities that dates to 1993 and collects information on businesses, households, and individuals. In the development of this study, the consortium also referred to the Automated Census Information System (ACIS), which allowed for adjustments and specifications of data. For additional information on NAICS and ACIS, see Appendix G.
19 Vehicle and Cargo Inspection System (VACIS) and Federal Motor Carrier Safety Administration (FMCSA).
20 The Interagency Border Inspection System is a computer-based system that provides law enforcement access to drivers’ criminal records and other information used to screen vehicles crossing the border.
21 Border users were consulted during roundtables hosted by the Atlantic Council. The first took place on May 10, 2022, in El Paso, Texas, in collaboration with the Hunt Institute for Global Competitiveness at the University of Texas at El Paso. The second occurred on July 12, 2022, in Tijuana, Mexico, in collaboration with El Colegio de la Frontera Norte.
22 According to research by the Hunt Institute for Global Competitiveness, 4,720,967 container trucks crossed the border in 2021.
23 A 10-minute reduction in commercial wait times would allow $25,879,549 million, specifically in additional cargo value, to enter the United States monthly. See Appendix C1 for more information.
24 This section focuses on crossings by individuals and families in noncommercial vehicles alone. Migrant caravans at the US-Mexico border disrupted standard pedestrian crossing patterns during the sample period, preventing the analysis of pedestrian traffic using the regression model described in Appendix B. Further research is needed to estimate the economic impact of additional pedestrian crossings following a reduction in border wait times.
25 Per Table 2, these purchases generated an economic impact of $12,332,697,547 for the US economy. The economic impact of cross-border spending was determined by mapping out expenditure categories and running INPLAN’s multi-region input-output feature.
26 Given the nature of available data for the input-output analysis (macroeconomic data from Mexico’s National Institute of Statistics and Geography (INEGI), which captures the commercial relationship between the United States and Mexico), this section exclusively focuses on commercial crossings from Mexico into the United States. The economic impact for Mexican families and workers was estimated by considering how changes in the US-Mexico commercial relationship affect employment and labor income.
27 Government of the United States, “U.S.-Mexico Trade Relations,” Congressional Research Service, updated April 25, 2021, https://sgp.fas.org/crs/row/IF11175.pdf.
28 The ten sectors are mining; manufacturing; wholesale trade; agriculture, animal breeding and exploitation, forestry, fishing, and hunting; electric power generation, transmission and diffusion, and water and gas supply; transportation, postage, and warehousing; professional, scientific, and technical services; retail trade; financial and insurance services; and mass media information.
29 “U.S.-Mexico Trade Relations,” Congressional Research Service. https://sgp.fas.org/crs/row/IF11175.pdf
30 “México supera a Japón y lidera por primera vez envíos de autos a Estados Unidos” (“Mexico surpasses Japan and leads car shipments to the United States for the first time”), El Economista, September 5, 2022, https://dfsud.com/america/mexico-supera-a-japon-y-lidera-por-primera-vez-envios-de-autos-a-estados.
31 See Appendix C1.
32 As described in the report, the regression analysis did not include pedestrian crossings due to the impact of migrant caravans during the period under study.
39 ATLANTIC COUNCIL THE ECONOMIC IMPACT OF A MORE EFFICIENT US-MEXICO BORDER
33 Missing data was excluded from averages.
34 The correlation between wait times and crossings is 0.2977. This is likely because congestion at the border may result in both increased wait times and a higher number of crossings.
35 The sample ends prior to 2020 to avoid disruptions in border crossings due to COVID-19. See Appendix A for a detailed description of the data.
36 The fixed effect, i, accounts for time-constant heterogeneity between counties in the analysis. Estimating the regression equation by fixed effects removes this time-constant heterogeneity, effectively controlling for the immutable differences between counties.
37 Spending categories include clothing, general merchandise, auto parts, groceries, electronics, restaurants, gas, sports and music, building, furniture, personal care services, fast food, health, business and other professional services, amusement and recreation, accommodation, bar, theater, transportation and parking, and other products.
38 The sixteen counties used in the analysis were El Paso, Presidio, Val Verde, Maverick, Webb, Starr, Hidalgo, Cameron, Luna, Dona Ana, Yuma, Pima, Santa Cruz, Cochise, San Diego, and Imperial.
39 The total number of crossers was determined using data from the Bureau of Transportation Statistics.
40 This could also be the average arrival rate.
41 This could also be the average service rate.
42 Government of the United States, “Bureau of Transportation Statistics: Border Crossing/Entry Data,” US Department of Transportation, accessed August 18, 2022, https://www.bts.gov/browse-statistical-products-and-data/border-crossing-data/border-crossingentry-data#:~:text=Border%20 crossing%20data%20are%20collected,comparable%20data%20on%20outbound%20crossings..
43 Scott Mall, “FreightWaves Classics: Otay Mesa Land Port is third-busiest on U.S.-Mexico border,” Freightwaves, May 12, 2021, https://www.freightwaves.com/news/freightwaves-classics-otay-mesa-land-port-is-third-busiest-on-us-mexico-border.
44 Ports of entry with extremely atypical wait times (anomalies) were disregarded in this paper’s analysis.
45 The ACIS systematizes information from Mexico’s four most recent economic censuses, which occurred in 2019, 2014, 2009, and 2004.
46 An input-output matrix represents national or regional economic accounting that records how industries trade with one another and produce for consumption and investments.

47 The RAS method is an interactive method for data reconciliation. It scales an input-output table bi-proportionally to achieve consistency between given row and column sums. For a detailed description of the methodology used by INEGI, see “Matrices de Contabilidad Social de México: Fuentes y metodología,” INEGI, accessed August 18, 2022, https://inegi.org.mx/contenidos/investigacion/mcsm/doc/fuente_y_metodologia.pdf.
48 Originally in 2018 Mexican pesos and converted to US dollars using a conversion rate of 1 US dollar to 20.03 Mexican pesos. Results are in 2018 values.
49 Originally in 2018 Mexican pesos and converted to US dollars using a conversion rate of 1 US dollar to 20.03 Mexican pesos. Results are in 2018 values.
50 Originally in 2018 Mexican pesos and converted to US dollars using a conversion rate of 1 US dollar to 20.03 Mexican pesos. Results are in 2018 values.
51 Originally in 2018 Mexican pesos and converted to US dollars using a conversion rate of 1 US dollar to 20.03 Mexican pesos. Results are in 2018 values.
52 Total employment per sector was obtained from INEGI, using 2018 data.
53 Total labor income per sector was obtained from INEGI, using 2018 data in Mexican pesos (millions).
THE ECONOMIC IMPACT OF A MORE EFFICIENT US-MEXICO BORDER
40 ATLANTIC COUNCIL
CHAIRMAN
*John F.W. Rogers
EXECUTIVE CHAIRMAN
EMERITUS
*James L. Jones
PRESIDENT AND CEO
*Frederick Kempe
EXECUTIVE VICE CHAIRS
*Adrienne Arsht
*Stephen J. Hadley
VICE CHAIRS
*Robert J. Abernethy
*C. Boyden Gray
*Alexander V. Mirtchev
TREASURER

*George Lund
DIRECTORS
Todd Achilles Timothy D. Adams
*Michael Andersson
David D. Aufhauser
Barbara Barrett Colleen Bell Stephen Biegun Linden P. Blue Adam Boehler
John Bonsell
Philip M. Breedlove Myron Brilliant
*Esther Brimmer Richard R. Burt
*Teresa Carlson
*James E. Cartwright John E. Chapoton Ahmed Charai Melanie Chen
Michael Chertoff
*George Chopivsky Wesley K. Clark
*Helima Croft
*Ankit N. Desai Dario Deste
*Paula J. Dobriansky
Joseph F. Dunford, Jr. Richard Edelman
Thomas J. Egan, Jr. Stuart E. Eizenstat
Mark T. Esper
*Michael Fisch
*Alan H. Fleischmann
Jendayi E. Frazer
Meg Gentle
Thomas H. Glocer
John B. Goodman
*Sherri W. Goodman Jarosław Grzesiak Murathan Günal Frank Haun
Michael V. Hayden Tim Holt
*Karl V. Hopkins Kay Bailey Hutchison Ian Ihnatowycz Mark Isakowitz Wolfgang F. Ischinger Deborah Lee James
*Joia M. Johnson
*Safi Kalo
Andre Kelleners Brian L. Kelly
Henry A. Kissinger John E. Klein
*C. Jeffrey Knittel Joseph Konzelmann Franklin D. Kramer
Laura Lane Almar Latour Yann Le Pallec
Jan M. Lodal Douglas Lute Jane Holl Lute William J. Lynn Mark Machin Umer Mansha Marco Margheri Michael Margolis Chris Marlin William Marron Christian Marrone Gerardo Mato Timothy McBride Erin McGrain John M. McHugh
*Judith A. Miller Dariusz Mioduski Michael J. Morell
*Richard Morningstar Georgette Mosbacher Majida Mourad Dambisa F. Moyo Virginia A. Mulberger Mary Claire Murphy Edward J. Newberry Franco Nuschese Joseph S. Nye Ahmet M. Ören Sally A. Painter Ana I. Palacio
*Kostas Pantazopoulos Alan Pellegrini David H. Petraeus
*Lisa Pollina Daniel B. Poneman
*Dina H. Powell dddMcCormick Michael Punke Ashraf Qazi Thomas J. Ridge Gary Rieschel Lawrence Di Rita Michael J. Rogers Charles O. Rossotti Harry Sachinis C. Michael Scaparrotti Ivan A. Schlager Rajiv Shah Gregg Sherrill Jeff Shockey Ali Jehangir Siddiqui Kris Singh Walter Slocombe Christopher Smith Clifford M. Sobel James G. Stavridis Michael S. Steele Richard J.A. Steele Mary Streett
*Gil Tenzer
*Frances M. Townsend Clyde C. Tuggle Melanne Verveer Charles F. Wald Michael F. Walsh Ronald Weiser
*Al Williams Maciej Witucki Neal S. Wolin
*Jenny Wood Guang Yang Mary C. Yates Dov S. Zakheim
HONORARY DIRECTORS
James A. Baker, III Ashton B. Carter Robert M. Gates
James N. Mattis Michael G. Mullen Leon E. Panetta
William J. Perry Condoleezza Rice Horst Teltschik William H. Webster
*Executive Committee Members
List as of September 12, 2022
The Atlantic Council is a nonpartisan organization that promotes constructive US leadership and engagement in international affairs based on the central role of the Atlantic community in meeting today’s global challenges.
© 2021 The Atlantic Council of the United States. All rights reserved. No part of this publication may be reproduced or transmitted in any form or by any means without permission in writing from the Atlantic Council, except in the case of brief quotations in news articles, critical articles, or reviews. Please direct inquiries to:
Atlantic Council
1030 15th Street, NW, 12th Floor, Washington, DC 20005
(202) 463-7226, www.AtlanticCouncil.org
Made possible by: