1 RATIONALE
The original experiment was conducted in a forest ecosystem and used one transect line to measure abiotic and biotic data in quadrats placed along the line. The species observed were recorded then used to calculate the species diversity of the quadrats. On the other hand, the modified experiment investigated abiotic and biotic data within a marine ecosystem where six transect lines and 23 quadrats were used. Thus, this information was used to develop a relationship between transect distance and mollusc abundance.
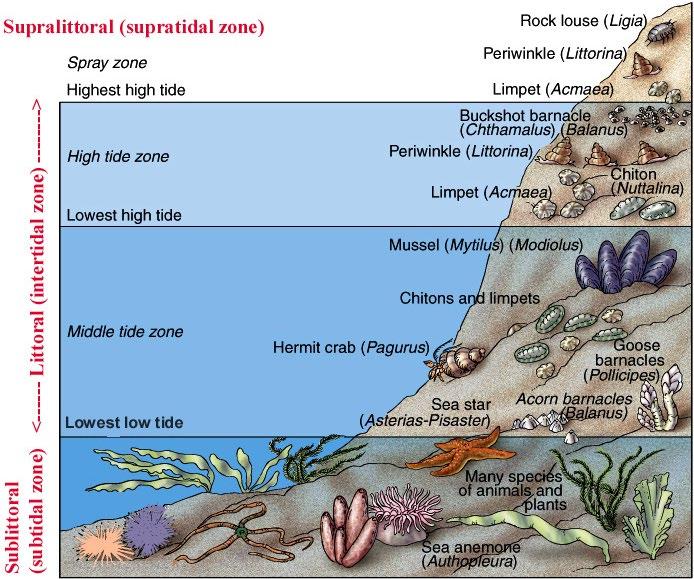
In marine biology, the littoral zone refers to the part of the ocean nearest to the shore and is divided into three subzones: supralittoral, intertidal (eulittoral) and sublittoral (Figure 1). The intertidal zone is defined as the region of land below water at high tides and above water at low tides (Baharuddin et al., 2019) and can be further subdivided into low, middle and high intertidal zones based on average exposure to air The high intertidal zone (HIZ) is flooded during high tides but remains dry for long durations between each period of high tide (NOAA, 2020). In contrast, the sublittoral zone (SBZ) is constantly inundated with water with no exposure to the air (Molles, 2015). Inhabitants of the intertidal zone are exposed to drastic and rapid fluctuations in abiotic parameters (e.g. pH, temperature, air exposure). Since intertidal organisms are mostly marine animals, abiotic factors play an relatively larger role during low tides whereas biotic factors (e.g. competition, predation) have a greater influence during submergence (Garrity, 1984). Thus, abiotic factors tend to set the upper vertical limit of distribution and biotic factors usually determine the lower vertical limit of distribution of intertidal organisms.
In the marine ecosystem of North Stradbroke Island, the phylum with the highest abundance of species recorded was Mollusca Molluscs include the following classes: gastropods (whelks, snails etc.), bivalves (mussels, clams etc.) and cephalopods (squids, octopuses etc.). Most species of sessile molluscs live in niches where water washes over them periodically as their anatomical and physiological adaptations have allowed them to successfully respond to abiotic stress. They generally prefer shallow water in order to gain necessary nutrients while maintaining sufficient light exposure
Page 2 of 13
Figure 1: Subdivisions of the Littoral Zone (FIU, n.d.)
(Henderson, 1963) Desiccation is an important abiotic factor as air exposure can cause intertidal organisms to rapidly lose water through evaporation eventually leading to death. Protective anatomical adaptations in molluscs include the closure of the operculum (gastropods) or shell valves (bivalves) to induce temporary isolation from the environment during desiccation stress. A physiological adaptation seen in terrestrial gastropods include reduced evaporative water loss (Grimm-Jørgensen et al., 1986) and mucus production upon exposure to low humidity. Complete submergence can be equally fatal to molluscs as they risk drowning or becoming stranded due to their mucus dissolving and subsequent inability to maintain attachment (Boycott, 1934). This demonstrates that abiotic factors, such as air exposure, must remain within a tolerance range (Figure 2) to ensure survival. Since air/water exposure is directly correlated with the distance from the shore, mollusc distribution varies across the littoral subzones.
From the above analysis of molluscs and the modified experiment conducted in North Stradbroke Island, a research question can be formulated to investigate the relationship between the abundance of the organisms within the phylum, Mollusca, and the distance from the shoreline

2 RESEARCH QUESTION
Does increasing the distance from the shore increase the number of terrestrial molluscs occupying a rocky shore marine ecosystem?
Page 3 of 13
Figure 2: Tolerance Range & Optimum Range for Any Particular Abiotic Requirement (Huxley and Walter, 2019)
3 METHOD
3.1 ORIGINAL EXPERIMENT
This method was adapted from “Oxford Biology for Queensland Units 3 & 4: 3.8A Analysing Vegetation Patterns Using a Transect Line” that was used before the experimentation process at North Stradbroke Island The original experiment discussed the effects of multiple abiotic factors on the flora and fauna in that area. The original experiment investigated these relationships within a tall-open ecosystem in Forest Lake.
Results were conducted by laying one transect line of 20m and then counting the number of organisms per species in ten 0.25m2 quadrats taken at 2m intervals. The data collected from the transect profile were used to record the abiotic factors along a transect, ascertain the relative abundance of certain species, compare the relative densities of plant species and investigate observable relationships between certain species and abiotic factors. The results of the original experiment showed that the species diversity index (SDI) ranged from 0 49 to 0 78 over four quadrats of flora and fauna and the average SDI was 0.62.
3.2 MODIFICATIONS
3.2.1 Modified By:
• Altering the location of investigation from a tall-open forest in Forest Lake to a marine ecosystem in North Stradbroke Island due to its increased biodiversity Specifically, a 18m × 20m area incorporating a high and low energy shoreline of Deadman’s Beach was chosen.
• Additional abiotic factors (salinity, water pH, wind speed etc.) were tested in each quadrat to better characterise a marine ecosystem.
• Defining transect distance from the beginning (ocean side) of the sublittoral zone
• Calculating the subzones by equally dividing the transect distance from the end of sublittoral zone (24m) into the four other subzones.
3.2.2 Refined By:
• Taking a total of 23 quadrats of 1m2 at random intervals along six transect lines perpendicular to the shoreline (Figure 3) to better capture the complexity of the ecosystem and increase the sample size for each zone.
• Six experimenters counted the number of molluscs to minimise human error.
Page 4 of 13
3.3 MANAGEMENT OF RISKS AND ETHICAL CONSIDERATIONS (EC)
Rock pools and uneven ground are potential tripping hazards
Poisonous/dangerous animals within the ecosystem that may attack.
Breakage of equipment can lead to injury/laceration.
Contact/ingestion of seawater may cause infection or discomfort.
EC: Disturbance of organisms and their habitats in rocky shore
4 QUALITATIVE OBSERVATIONS
Carefully walking through the area and wearing fully enclosed footwear to prevent injury
Be informed of dangerous animals and avoid animals and their habitats.
Handling the equipment (refractometer, anemometer etc.) with special care
Avoid close contact of face with seawater and adequately cover and waterproof any wounds.
Aware of all organisms and to take caution around habitats.
During the experimental process, multiple qualitative abiotic factors were observed. The shade was quite consistent throughout the rocky shore where each zone was equally exposed to the same amount of light and moisture. The slope of the low energy rocky shore was seen to have an almost flat slope whereas the high energy rocky shore had a much steeper slope. Furthermore, there were a larger number of rock pools within the high energy area than the low energy area which correlates with the high mollusc abundance since they utilise the rock pools as protection and habitation.

Page 5 of 13
Figure 3 Sampling location with quadrats (white squares) taken along transects (dotted lines) to scale.
Table 1: Management of Risks and Ethical Considerations Table Risk Factors Management of Risks
5 RESULTS
5.1 RAW DATA
Table 2 and Figure 4 reveal the raw data, showing the measured values of transect distance and the number of organisms. Highlighted values in Table 2 show the outliers detected in the data.
Page 6 of 13
Transect Distance (m) No of Molluscs Sublittoral 0 0 Low Intertidal 0.54 9 2.25 7 2.5 34 2.73 18 3.56 41 4 20 Mid Intertidal 8.16 92 8.3 106 8.45 106 8.62 100 10.24 177 High Intertidal 12.14 246 12.34 278 13.42 58 13.67 435 15.37 285 Supralittoral 17.59 167 20 42 20.56 28 21.51 33 22.45 45 23.71 16
Table 2: Transect Distance and Number of Molluscs with Littoral Zonation
5.2 PROCESSED RESULTS
Page 7 of 13
Figure 4: Relationship Between the Number of Molluscs and Transect Distance – Line Graph
Transect Distance No of Molluscs Mean 10.96 103.70 Variance 56.10 12697.95 Observations 23 23 P(T≤t) two-tail 0.0006 t Critical two-tail 2.074 y = -1.5983x2 + 40.707x - 64.706 R² = 0.5318 0 50 100 150 200 250 300 350 400 450 500 0 5 10 15 20 25 Number of Molluscs Transect Distance (m) 0 50 100 150 200 250 300 350 Sublittoral Low Intertidal Middle intertidal High Intertidal Supralittoral Number of Molluscs Littoral Subzones
Figure 5: Relationship between transect distance and no. of molluscs (mean ± SEM) in each littoral subzone Table 3: Statistical Analysis of Raw Data
5.3 PROCESSING OF RESULTS
Sample calculations of the statistical analysis of the raw data is shown in Table 4
• Mean
• Standard error of mean (Figure 5)
• p-values (Table 3)
Standard error of mean: Excel was used to graph the standard error of the data points in Figure 5
Standard error is shown as a variation (±) and is calculated for the mean of the molluscs in each zone.
Excel was used to calculate the p-values outlined in Table 3. Since Figure 6 specifically focuses on two-tail tests (increased accuracy), the values “P(T≤t) two-tail” and the “t Critical two-tail” will be analysed.
Page 8 of 13
• ���� 2 value
Mean of data points: ���� = ∑ ���� ���� ����=���� ���� ���� = number of molluscs within subzone ���� = the mean of all ���� values ���� = number of values within subzone (����) ���� = ∑ ���� ���� ����=1 ���� = 9 + 7 + 34 + 18 + 41 + 20 6 = 21 5 With four significant figures: ���� = 21.5
of determination (�������� value): �������� = ���� ∑(�������� ���� � ���� )���� ∑(�������� �������� )���� �������� = actual ���� value ���� � ���� = predicted ���� value �������� = mean of all ���� values Using the Excel model ���� � = 1 5983���� 2 + 40 707���� 64 706 and point (0,0), ���� � = 1.5983(2.5)2 + 40.707(2.5) 64.706 = 27.07 Residual = actual y value – predicted y value ����1 = �������� ���� � ���� = 34 27 07 = 6 93 Square and then add all residuals together. �(�������� ���� � ���� )2 = � �������� = ����1 2 + ����2 2 + ⋯ + ����23 2 = 130782 Mean of the ���� values: 103 696 �(�������� �������� )2 = (34 103.696)2 + ⋯ + (16 103.696)2 = 279354.87 ���� 2 = 1 ∑(�������� ���� � ���� )2 ∑(�������� �������� )2 = 1 130782 279355 = 0.532
Table
4: Sample Calculations Table Sample Calculations
Coefficient
p-value:
6 ANALYSIS OF EVIDENCE
Figure 4 represents a negative parabolic (polynomial of order 2) relationship between the transect distance and the abundance of molluscs. Despite the outlier at a distance of 13 42m, there is an increase in the number of molluscs from 0 molluscs at 0m until a peak of 435 molluscs at 13 67m
This is followed by a decrease in the number of molluscs until only 16 molluscs were observed at 23.71m.
Figure 5 shows the mean±SEM of the number of molluscs in each subzone and clearly supports the theory in the Rationale which states that molluscs are most abundant in the HIZ where the water is frequently washing over and reduced in zones with too little (SPZ) or too much water (SBZ). This is due to increased desiccation risk with high air exposure and risk of drowning with high water exposure. This dramatic variation in mollusc numbers between the littoral subzones found in the data can be explained by the fact that tolerance range of molluscs to various abiotic and biotic factors translates into an upper and lower vertical species’ distribution limits.
The data indicates that the preferred niche of molluscs was the HIZ due to the abiotic and biotic factors falling within the “optimum range” (Figure 2). On the contrary, their “zones of physiological stress” most likely occurred at the SPZ, LIZ and the SBZ where a smaller number of molluscs (marginal niche) were found.
It should be noted that the correlation between the abundance of molluscs and the distance from the shore does not necessarily indicate causation. It is possible that some confounding factor influenced both the dependent and independent variable leading to this trend. Examples include predators in that area and resource limitations.
7 INTERPRETATION OF EVIDENCE
7.1 EVALUATION OF EXPERIMENTAL PROCESS
Due to the nature of this experiment, there are no reliability/precision calculations as there are no multiple trials of the data. However, the precision of the measurements and the equipment used was discussed. Statistical analysis will also be discussed below.
7.1.1 Affecting Precision
• The method of counting the molluscs may be inaccurate due to human error
• The measurement of the transect distance to the quadrat may be inaccurate since it was not exactly straight.
Standard error of the mean (SEM) (Figure 5) calculations suggests a small variation in the number of molluscs. There is slight overlap between data points, however, this does not hinder the overall trend of the data. Despite the small variation, the data maintains a parabolic relationship since the highest data point does not show any overlap and similarly with the mid data points.
7.1.2 Affecting Accuracy
• All values of the distance from the shore were taken from a tape measure with a measurement uncertainty of ±0 2 cm. Therefore, the tape measure significantly contributes to the imprecision of the data.
Page 9 of 13
• There is a potential for misclassification bias due to the less accurate method used to define the littoral subzones. This could lead to either an increase or decrease in the observed correlation depending on where misclassification occurred.
The significance level (α) refers to the probability of rejecting the null hypothesis when it is true, and in the present experiment, ���� = 0 05 was selected. The t-statistic was calculated to be 2.074 and Excel was used to find the corresponding p-value, which was 0.0006 (Table 3). Since this p-value was less than the significance level (i.e. p < 0.05) (Figure 6), the null hypothesis (increasing transect distance does not increase the number of molluscs) was rejected. Therefore, the relationship between transect distance and number of molluscs was statistically significant.

���� 2 value represents the size of variation in the dependent variable using predictor variables or the estimated model of the sample (Miles, 2014). The ���� 2 value calculated in Table 3 (via Excel) shows a 0.532 which shows a large variation compared to the expected regression parabola.
7.2 SUGGESTED IMPROVEMENTS AND EXTENSIONS
7.2.1 Suggested Improvements
The mitigation of the impact of the significant number of random and systematic errors would improve the overall experimental design and process:
• Using the high tide lines to define the upper limit of the high intertidal zone to increase the accuracy of the zonation.
• Increase number of quadrats to improve the sample size and thus, increasing the accuracy to determine a relationship.
• The experiment should be conducted over a few days which generates a more accurate representation of the total population of species
• Conducting investigation under simulated laboratory conditions so effect of external factors is removed
7.2.2 Suggested Extensions
• Redirecting the experiment to investigate the relationship between the effect of other abiotic factors on the abundance of molluscs.
• Using other species or phyla (e.g. Arthropoda) to determine a relationship between them and various abiotic factors.
• Investigating the predator-prey relationship for molluscs as it may have a significant impact on the abundance of the molluscs in certain areas.
Page 10 of 13
Figure 6: Two-Tail Test Graph - P values (Wright, 2020)
8 CONCLUSION
The experimental evidence suggests that increasing transect distance does not increase the number of terrestrial molluscs within the littoral zone. Instead, when the transect distance increases, the number of molluscs initially increases as it approaches the HIZ, and then decreases toward the land (as the SPZ is reached) The relationship between transect distance and number of molluscs approximately follows a negative parabolic trend. The conducted experiment partially supported the relationship discussed in the Rationale as a negative parabolic trend supports a tolerance range since more molluscs inhabited their preferred niche (HIZ) and less inhabited areas with extreme conditions Despite the experimental data exhibiting a correlation between the abundance of molluscs and the distance from the shore, this relationship does not necessarily indicate causation. Therefore, to fully determine a causative relationship between the number of molluscs and the distance from shore, isolating the molluscs into laboratory conditions and simulating the intertidal zones is necessary.
WORD COUNT: 1997 (excluding tables, equations, in-text citations and this statement)
Page 11 of 13
9 BIBLIOGRAPHY
Baharuddin, N., Basir, N.H.M., Zainuddin, S.N.H., 2019. Tropical intertidal gastropods: insights on diversity, abundance, distribution and shell morphometrics of Pulau Bidong, Malaysia. Aquac. Aquar. Conserv. Legis. 12, 1375–1387.
Boycott, A.E., 1934. The habitats of land Mollusca in Britain. J. Ecol. 22, 1–38.
FIU, n.d. FIU OCB3043 Lecture Notes [WWW Document]. URL
http://www.jochemnet.de/fiu/OCB3043_32.html (accessed 3.19.21).
Garrity, S.D., 1984. Some Adaptations of Gastropods to Physical Stress on a Tropical Rocky Shore. Ecol. Durh. 65, 559–574.
https://doi.org/10.2307/1941418
Grimm-Jørgensen, Y., Ducor, M.E., Piscatelli, J., 1986. Surface mucus production in gastropods is dependent on environmental salinity and humidity. Comp. Biochem. Physiol. A 83, 415–419.
https://doi.org/10.1016/0300-9629(86)90125-8
Henderson, A.E., 1963. On the underwater weights of freshwater snails. Z. Vgl. Physiol. 46, 467–490.
https://doi.org/10.1007/BF00340471
Huxley, L.M., Walter, M., 2019. Biology for Queensland: an Australian perspective. Units 3 & 4 Units 3 & 4, 3rd ed. Oxford University Press, Level 8, 737 Bourke Street, Docklands, Victoria 3008, Australia.
Miles, J., 2014. R Squared, Adjusted R Squared, in: Wiley StatsRef: Statistics Reference Online. American Cancer Society. https://doi.org/10.1002/9781118445112.stat06627
Molles, M.C., 2015. Ecology: concepts and applications, Seventh edition. ed. McGraw-Hill Education, New York, NY.
NOAA, 2020. What is the intertidal zone? [WWW Document]. Natl. Ocean Serv. URL https://oceanservice.noaa.gov/facts/intertidal-zone.html (accessed 2.12.21).
Wright, D., 2020. Tail of the Test: Interpreting Excel Data Analysis t-test output [WWW Document]. Dawn Wright PhD. URL https://www.drdawnwright.com/tail-of-the-test-interpreting-exceldata-analysis-t-test-output/ (accessed 2.14.21).
Page 12 of 13
Page 13 of 13

