


ADDRESSING EXTREME HEAT AND ASSOCIATED ENVIRONMENTAL AND SOCIETAL STRESSORS THROUGH RESILIENT SOLUTIONS & NEXT-GENERATION PREDICTIVE TOOLS
SW-IFL Introduction 01.
Creating Change for the Future 31. Enabling Opportunities for Change 18. Understanding Environmental Parameters & Drivers 07. SW-IFL Story 06. SW-IFL Impact 04.
SW-IFL Journal Publications 40.
SW-IFL In The News 44.
SW-IFL Advisory Board 46.
SW-IFL Collaborating Partners & Organizations 48.
SW-IFL Leadership Team 49.
50.
SW-IFL Research Teams
Acknowledgements 51.
The US Department of Energy (DOE) funds four urban integrated field laboratories (UIFL) to advance the science underpinning our understanding of the predictability of urban systems and their interactions with climate systems, and to provide the knowledge and information necessary to inform equitable climate and energy solutions that can strengthen communityscale resilience across urban landscapes


As one of the four UIFLs, the focus of the Southwest Integrated Field Laboratory (SW-IFL) project is to engage stakeholders and provide scientists and decision makers with high-quality, relevant knowledge capable of spurring and guiding responses to environmental concerns
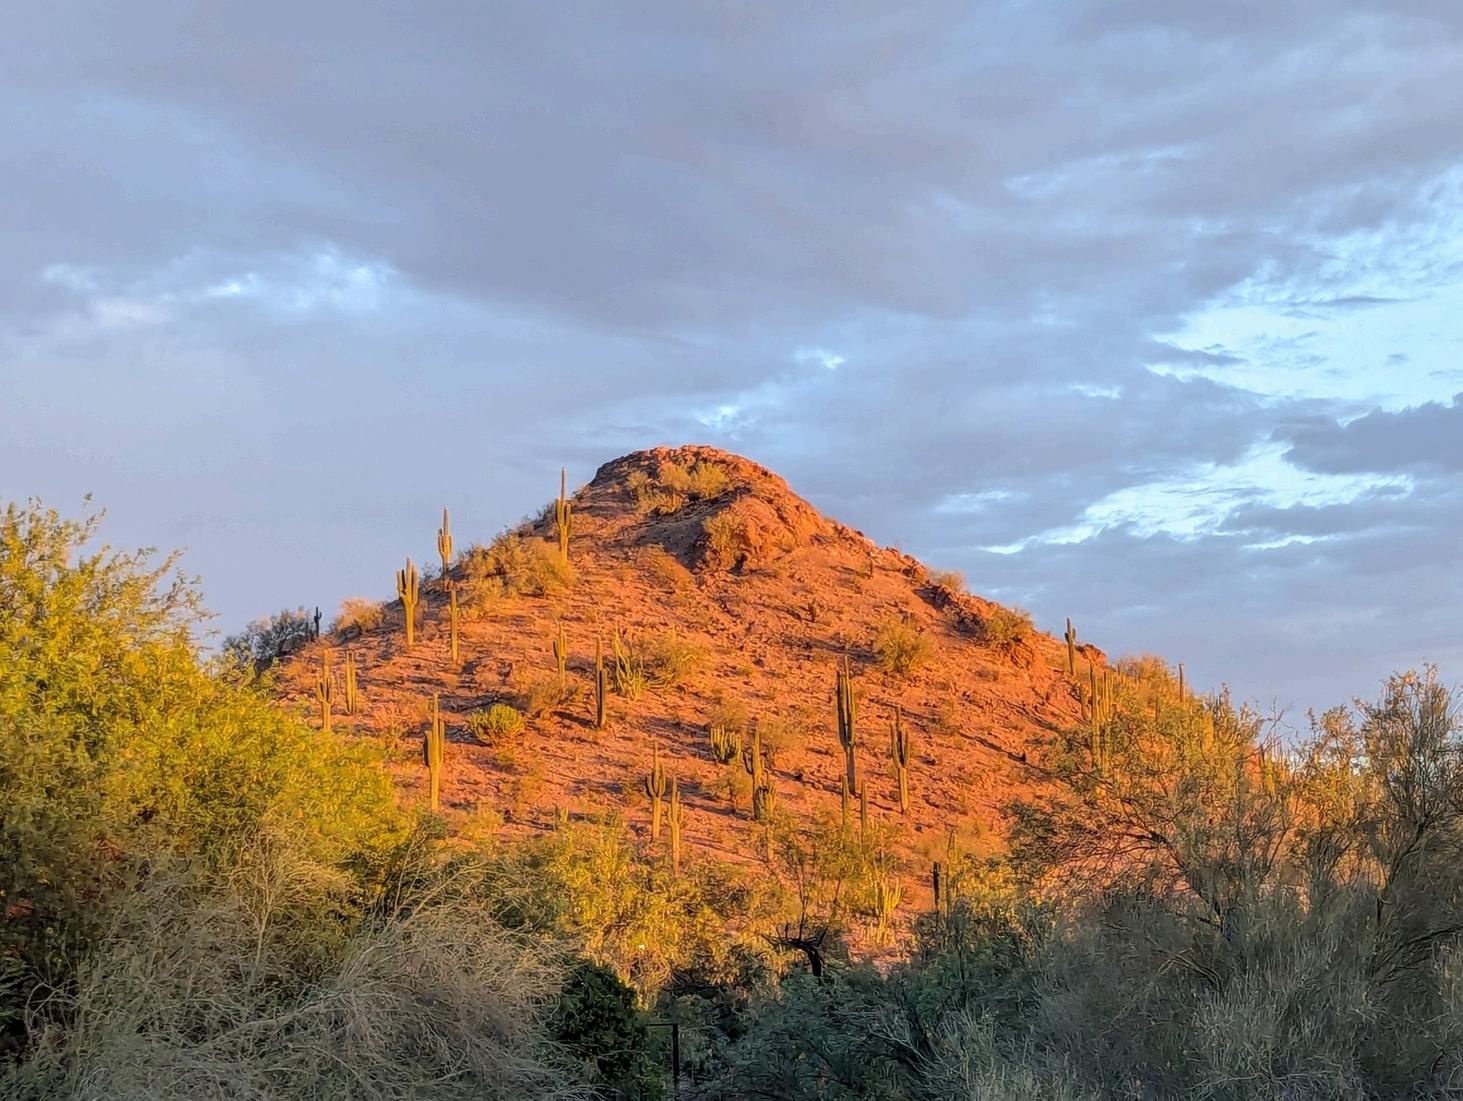
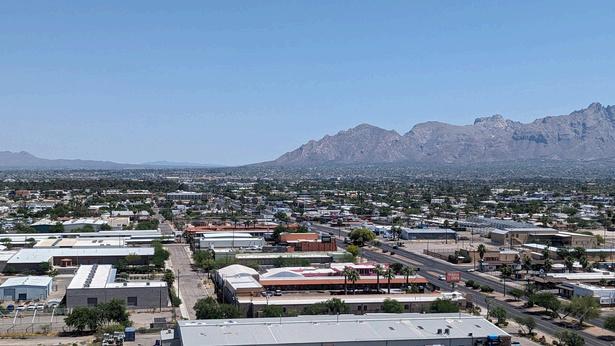
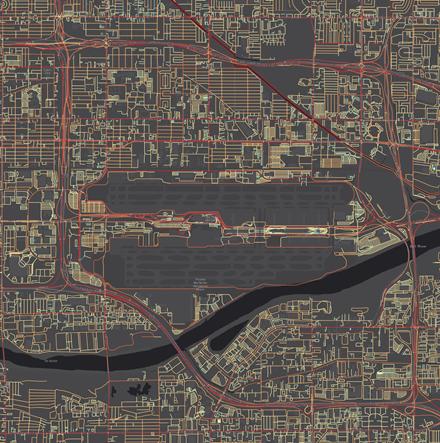
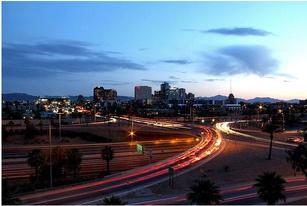
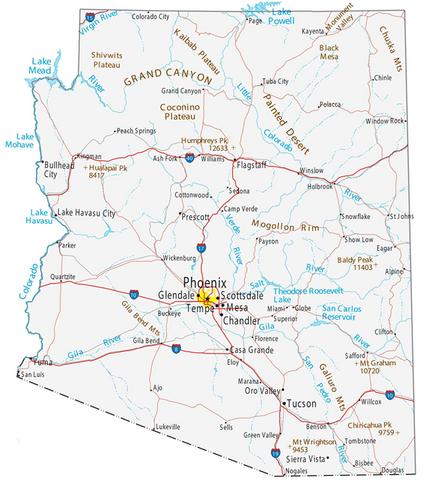
Arizona contains one of the fastest growing urban corridors in the US, including major cities of Tucson, Phoenix, and Flagstaff With many of the region’s urban areas routinely experiencing 30+ days of temperatures above 110 °F (43 °C) each summer, the population is stressed by the complex interactions of extreme heat, atmospheric pollutants, and limited water
This project is a partnership among the three Arizona public universities, two national laboratories, and industry. Our stakeholder network stretches across the region and includes city governments, county-level agencies, community groups, and local non-profits.


Arizona is fifth for year-over-year population growth in US. Current population is > 73M
Average summer nighttime low temperature in Phoenix has increased by more than 5 °C over the past 60 years
Arizona’s current drought of 15 years is the worst in more than 110 years of official recordkeeping, yet monsoon rains still create seasonal flooding.
Phoenix has 5th worst ozone pollution and 7th worst annual PM
Local air pollution is impacted by emissions, temperature, wildfires, and drought.
Heat caused 645 deaths in Maricopa County in 2023, a 52% increase over 2022, continuing a 10-year upward trend
The Southwest Integrated Field Laboratory is composed of an interdisciplinary team that seeks to:
Improve understanding of environmental parameters and drivers by asking the research questions:
What are the links between extreme heat, air chemistry, the urban and agricultural irrigation, and socioeconomic clusters?
What is the impact of urban planning strategies on urban climates.
Enable opportunities for change by asking the research questions:
How do multi-scale climate and surface/human drivers interact?
How will their impacts manifest spatiotemporally across urban environments and into the future?
Create change for the future by asking:
How can SW-IFL science best inform decision-makers and the general public to create a desirable urban environmental future for Arizona?
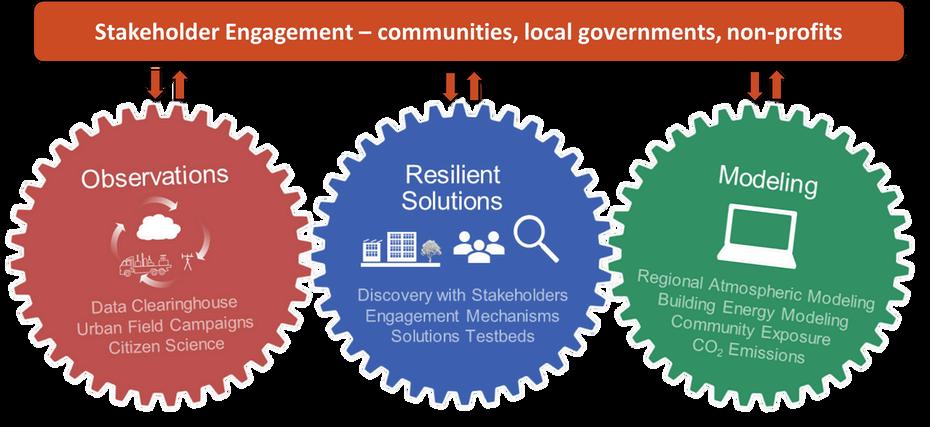
This interdisciplinary team is comprised of three thematic groups: Observations, Modeling, and Resilient Solutions, that engage in activities that include data collection on land-atmosphere exchange processes, atmospheric composition and emissions while leveraging existing networks that collect weather, air quality, and hydrological data in order to address extreme heat and its associated environmental and societal stressors

Intensive observational periods (IOPs) occur throughout the summer months when temperatures are at their highest and utilize fixed assets and mobile observatories that measure boundary-layer processes. Focused, neighborhood-scale, heavily-instrumented test bed experiments elucidate drivers of microclimate variations and evaluate the efficacy of proposed solutions
Test bed experiments leverage data from the IOPs and include additional short- and long-term measurements that engage researchers from across our university network and citizen scientists from our stakeholder organizations and communities. These test beds include a combination of natural or planned experiments that isolate and evaluate specific strategies and technologies Additionally, community test beds use a collaborative codesign approach to develop, deploy, and evaluate solutions for communities
Other activities, such as heat planning and governance, residential thermal comfort, transportation surveys, and K-12 activities, are also currently underway These activities help develop next generation predictive modeling capabilities for urban regions by improving representations of fine-scale physical processes, while coupling existing state-of-the-art models that integrate human behavior and atmospheric phenomena ranging from neighborhood to regional and global scales.


Project Evaluation -
The information below is based upon survey results gathered by Arizona State University’s College Research and Evaluation Services Team (CREST)
Education
What knowledge and skills are gained through participation of year-long students?

Educational Outreach
95% reported openness to diverse disciplinary perspectives when analyzing problems
100% reported being innovative
100% reported conducting research in an ethical and responsible manner
100% reported interpreting research results
100% reported solving research-related problems
What types of outreach are implemented and what is the impact?
SW-IFL HeatMappers and Discovery Fellows

Stakeholders
Reported high satisfaction with their experience and significant gains in preparing research posters and presenting results
Educator Traverses
83% of teachers who participated in the SW-IFL summer traverse campaigns reported they were more optimistic about their ability to contribute to solutions to environmental problems
What collaboration efforts exist among researchers, community groups, and government partners?

Responding Advisory Group members reported they were motivated to attend meetings and provide insights and perspectives into SW-IFL research and activities.
Responding community partners reported that their input is valued and respected by the SW-IFL researchers
Institutional Transformation
What are collaboration efforts across teams, and does convergent research increase over time?
100% of surveyed faculty members were satisfied or very satisfied with the frequency of interactions with faculty and staff
80% agreed or strongly agreed that SW-IFL members... work jointly to advance group goals add value to each other’s work create new knowledge or insights together
To address key research questions for the SW-IFL project, we started by gathering as much existing information as we could regarding the land use/land cover, built infrastructure, emissions, and socio-demographic factors that influence the urban environment system. Sources for these data include U.S. Census, remote-sensed satellite data products, and urban GIS databases. Next, we gathered as much data as possible from existing networks of environmental observational infrastructure. This includes weather and air quality data from the National Weather Service, public utilities, flood management districts, and local air quality management networks These data form the foundation for our understanding of the drivers of the urban climate system
As we continue to explore relationships in the urban system, we also started exploring strategies and solutions for reducing extreme heat and the adverse societal and health effects of heat and related environmental conditions We study solutions through two distinct mechanisms First, we have developed testbeds in which to monitor and evaluate a range of solutions These include technology/solutions testbeds that focus exclusively on field evaluation of the efficacy of different types of solutions such as green and blue infrastructure and innovations in cool materials They also include community testbeds in which we integrate monitoring and evaluation of physical phenomena with inquiries focused on understanding the social science aspects of how environmental drivers and solutions interact with people
While the SW-IFL researchers and efforts are organized in three working groups Observations, Modeling, and Resilient Solutions these teams actually work together closely across a spectrum of inquiry that starts with understanding environmental parameters and drivers, uses this understanding to propose and explore possible solutions, and then works with the public, government agencies, the media, and other stakeholders to create change for the future. This spectrum of inquiry creates the structure for this report on the activities and outcomes from the second year of the SW-IFL project.


This annual report encompasses year 2 (2024) of the SW-IFL project, its activities, findings, and research A full list of the project participants can be found in the SW-IFL Research Teams section of this report
RESEARCH QUESTIONS:
What are the links between extreme heat, air chemistry, the urban and agricultural irrigation, and socioeconomic clusters?
What is the impact of urban planning strategies on urban climates


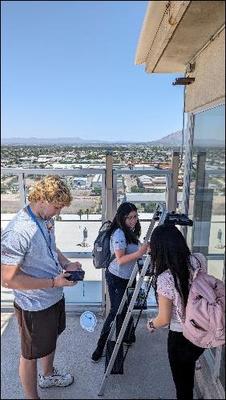
In year two, the SW-IFL researchers focused on the two-way interactions between the climate, the built environment, and people utilizing long-term data sets that provide information about street level and upper environment conditions to understand robust behaviors and trends in how air and air quality changes as a function of height, and how pollutants and heat may be vertically transported and mixed into the atmosphere.
RESEARCH TOOLS:
Data from pre-existing networks and databases
Data from new measurement networks and databases
Data from new field campaigns
In regards to urban climate questions, SW-IFL researchers work closely with both pre-existing data and our community stakeholders to incorporate their insights regarding existing and potential resilience solutions Utilizing these pre-existing networks and databases helps researchers craft relevant research questions

This pre-existing database is a digital twin of buildings that helps SW-IFL researchers identify regions of different sizes so they can extract statistics on building morphology to help create research questions linked to climate, such as: What is the distribution of building height in a certain neighborhood? Or Are buildings more uniform or more different?
ModelofAmerica: https://wwwornlgov/news/ornls-simulation-tool-creates-digital-twinbuildings-coast-coast
This pre-existing NHTS database includes a travel behavior diary. The research team prepared a working paper report summarizing the process for linking archived travel and weather data. The research team has since obtained the limited location- and temporal-specific dataset that enables them to append archived weather data to the travel diary, and are working on reconciling the two datasets for analysis
NationalHouseholdTravelSurvey:https://nhtsornlgov/
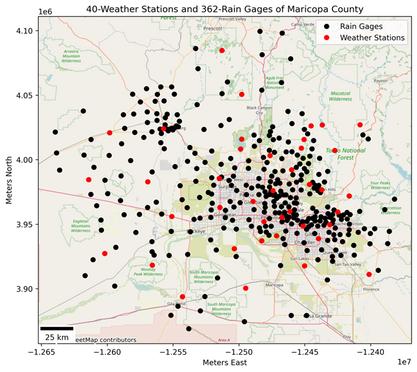
Maricopa County Flood District Data Sets –
This database is composed of information stretching back to 1980 and extending into present day for the Phoenix metropolitan area from 365 rain gauges and roughly 40 weather stations that collect data on air pressure and temperature; wind speed, direction, and peak; solar radiation; dew point; and relative humidity
MaricopaCountyFloodDistrictsDataSets:https://datamaricopaopendataarcgiscom
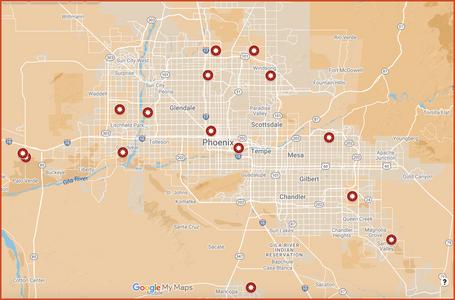
ASOS and AZMET Weather Station Networks –
Using this pre-existing database of 79 weather stations allowed SW-IFL researchers to map station locations indicating the sparse coverage of the existing weather station network in the urban environment Most of these stations are installed at airports which provides limited information on climate conditions in the neighborhoods
Identified
ASOS & ASMET Weather Station Networks
Mapped locations of each station Identified areas with sparse coverage
In year two of the project the SW-IFL team deployed more assets within historically underserved urban neighborhoods to enhance these pre-existing data sets

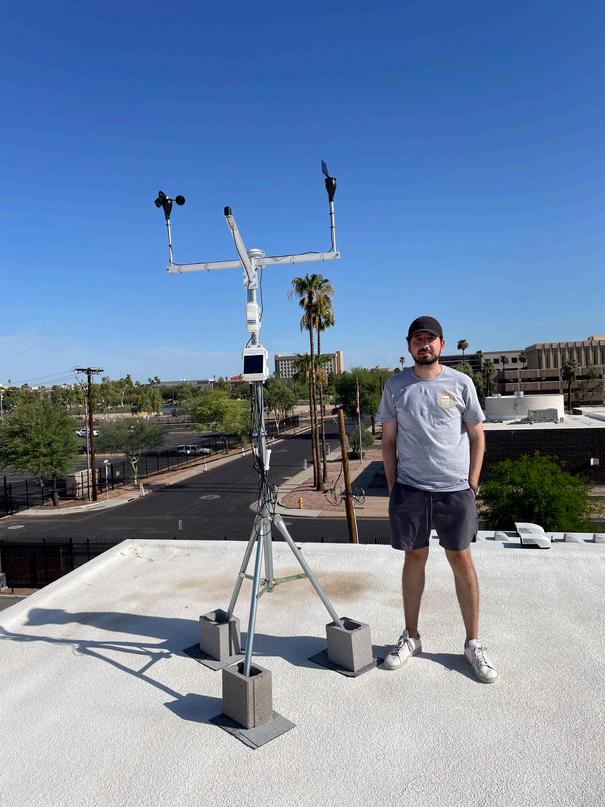
12 Neighborhood Weather Stations installed to gather traditional weather data at street level to contrast with traditional placed stations near airports
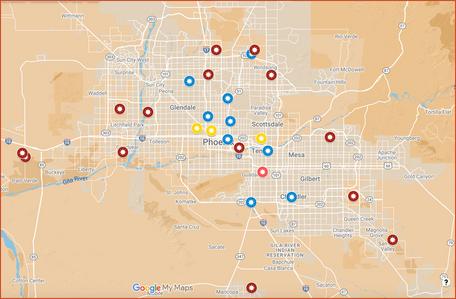

Three low-cost thermal sensing devices were deployed at a park to collect data on the surrounding microclimate They also count the number of people in the shade and sun to determine the relationship between how people use public outdoor spaces and the mean radiant temperature (MRT)--a measure of the net radiation received by a human body


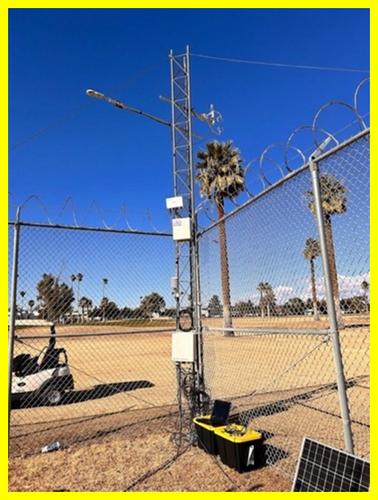
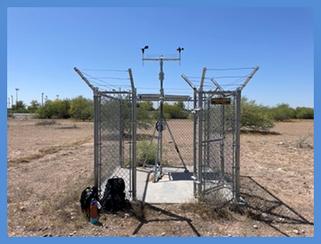
These towers and their instruments measure the exchange of energy particles and gases within the atmosphere They were strategically installed in three different land use regions and registered with DOE AmeriFlux, a network of Primary Investigator-managed sites measuring ecosystem carbon dioxide (CO ), water, and energy fluxes in North, Central and South America.
Data from these towers will be available on the AmeriFlux website. 2
Desert area near urban surfaces – Desert Botanical Garden Site https://ameriflux lbl gov/sites/siteinfo/US-Px1
Low rise, residential neighborhood in Phoenix –Maryvale Neighborhood Site https://ameriflux lbl gov/sites/siteinfo/US-Px2
Managed and irrigated turf grass facility by City of Phoenix – Encanto Golf Course site https://ameriflux lbl gov/sites/siteinfo/US-Px3
To achieve a broad spatial coverage of community engagement, the SW-IFL researchers also worked with citizen scientists to leverage both existing and new data in relation to various research questions
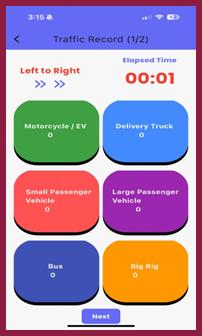
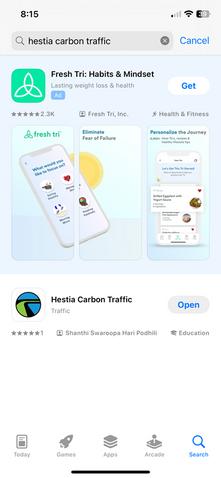
Three undergraduate students worked with SW-IFL researchers at Northern Arizona University (NAU) to collect preliminary data in both Phoenix and Flagstaff of various car types and trucks are passing certain streets This helps to create a more robust database related to carbon dioxide (CO ), air quality, and anthropogenic heat emissions generate by traffic You can help us add to our data by downloading the HESTIA Traffic app which is available in the app store on both Android and Apple devices 2

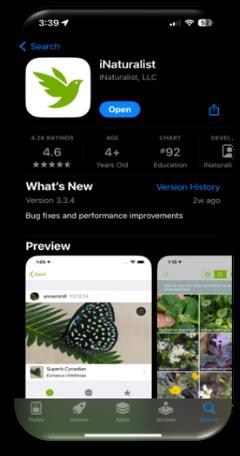
SW-IFL researchers at Northern Arizona University (NAU) in conjunction with NAU Capstone Class students, SW-IFL Discovery Fellows, and community volunteers collected and analyzed annual plants across Flagstaff, Phoenix and Tucson from Fall of 2023 through Spring of 2024 to monitor carbon dioxide (CO ) emissions using iNaturalist
In Fall 2023, 489 observations were collected in Flagstaff by volunteer partners trained by SW-IFL researchers and analyzed for radiocarbon In Spring 2024, 1219 observations were collected in Phoenix and Tucson and are currently being analyzed
Downloadthe appbyclicking ontheQRcodes

In addition to the long-term instrumentation, there are additional, more labor-intensive instruments that were deployed during our intensive observational periods (IOPs), or specifically designed field campaigns in year two
A transportable Eddy Covariance tower, registered with Ameriflux at https://ameriflux lbl gov/sites/siteinfo/US-Px4, was equipped with sensors to measure the exchange of energy, particles, and gasses, on loan from AmeriFlux’s Rapid Response System.
Includes water (H O), carbon dioxide (CO ), and methane (CH ) fluxes 2 2 4
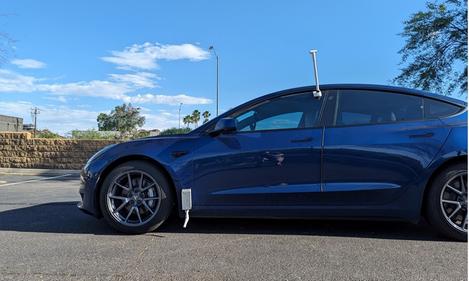
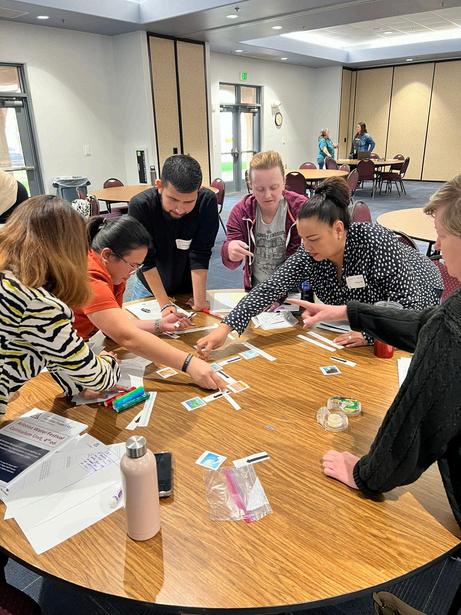
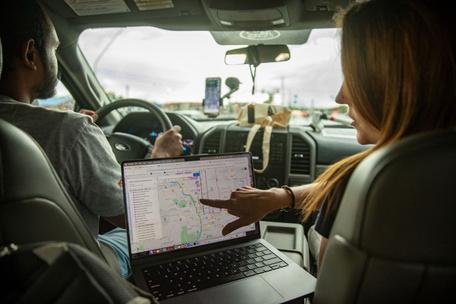
Phoenix teachers and SW-IFL researchers took part in a campaign designed to measure land surface temperatures and 2-meter air temperatures in pre-designated neighborhoods with car-mounted temperature sensors.
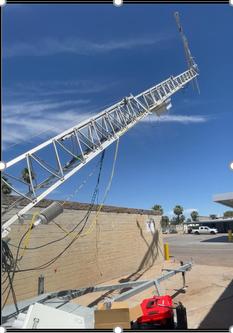
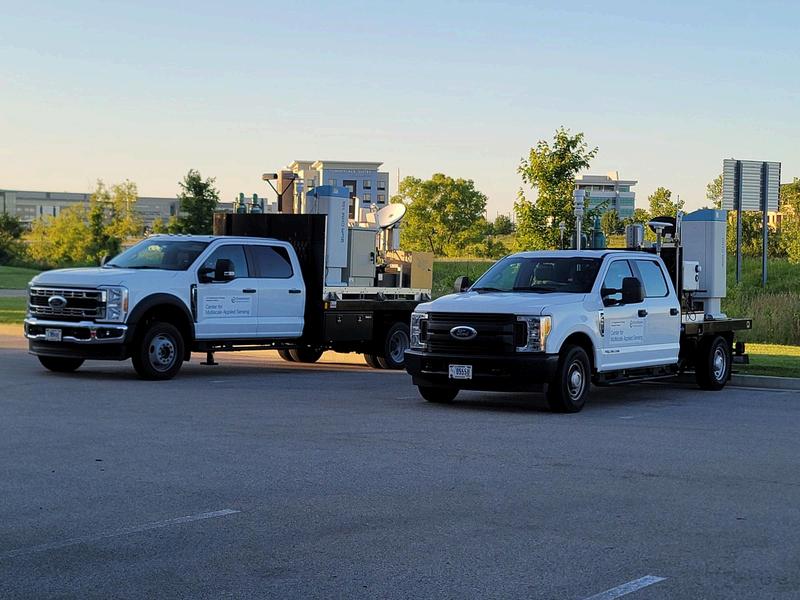
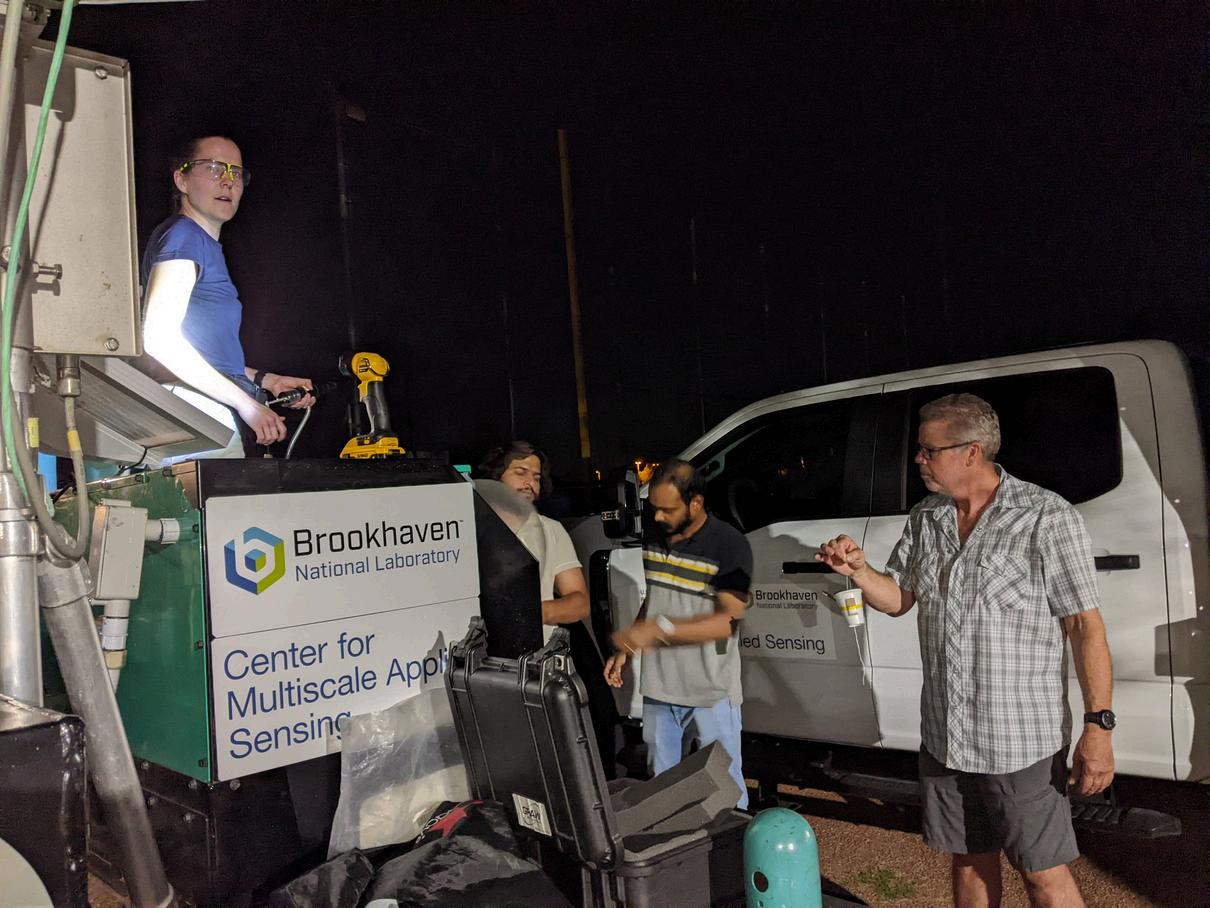
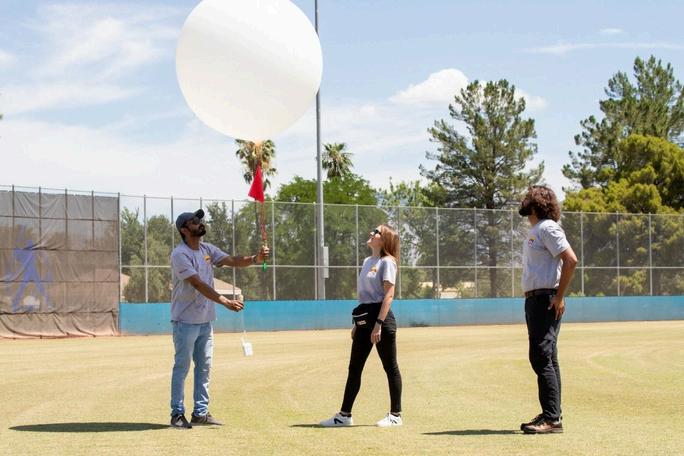
Created by the Brookhaven National Laboratory Center for Multiscale Applied Sensing (CMAS) in New York, these uniquely customized mobile laboratories were designed to study highly heterogeneous urban environments.
Equipped with 11 instruments that remotely measure air temperature, winds, humidity, clouds, and aerosols at street level and throughout the atmosphere, they have their own power generation and supporting onboard computers.
Measurements can be completed while in transit or while parked In addition, some instruments can be deployed using small balloons for vertical capture
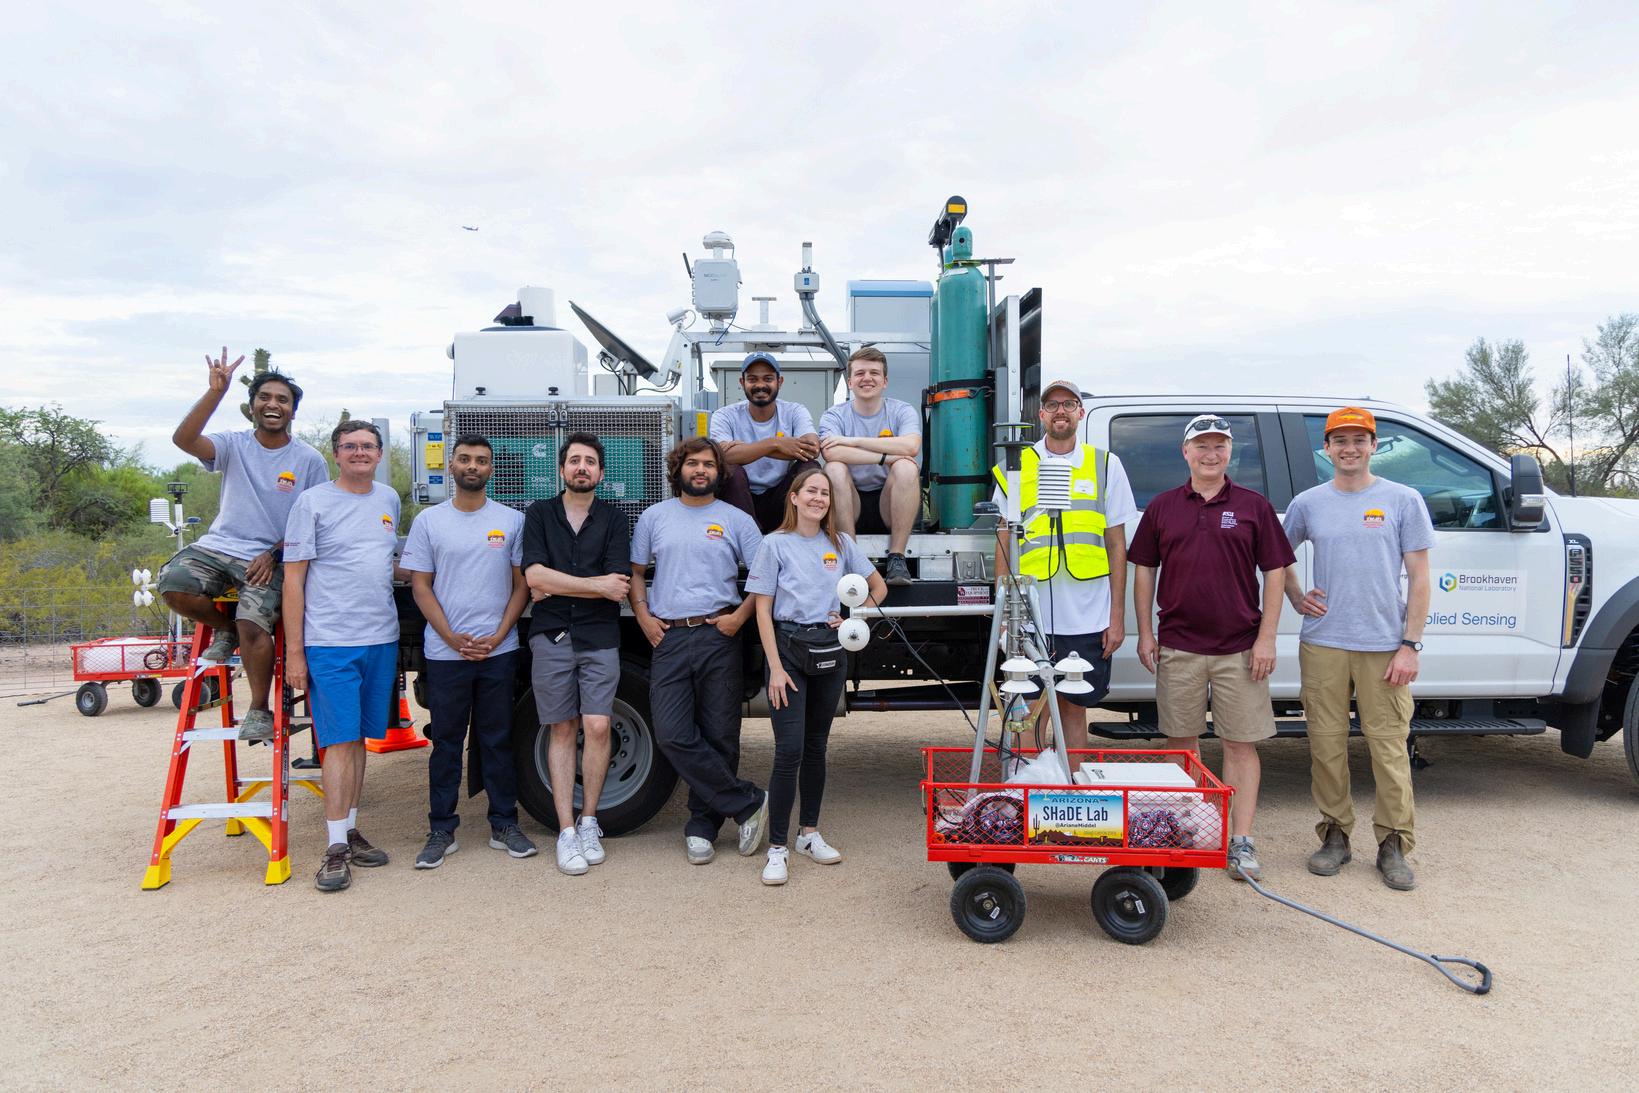
From June 3, 2024 to July 3, 2024 a massive field campaign was conducted by SW-IFL This 28-day endeavor led by Dr Katia Lamer from Brookhaven National Laboratory (BNL) and involved SW-IFL researchers, community partners, citizen scientists, and early career scientists and spanned from the Phoenix metropolitan area and down into Tucson, Arizona In an attempt to fill in spatial gaps all campaign instruments were deployed during the IOP, many simultaneously
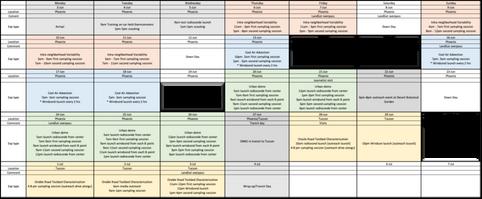
However, the main goal of the IOP was to focus on answering questions aligned with four specific scientific objectives codesigned across the three SW-IFL Research Teams (Observations, Modeling, and Resilient Solutions) and our stakeholders
2: COOL A ECTION
Science objective 1: Intra neighborhood variability
Question 1:
How variable are temperature and air quality in regions the size of urban climate model grids (approximately 1 kilometer by 1 kilometer)?
Question 2:
Does this climate variability correlate with building variability? In other words, are air temperature and air quality more uniform in neighborhoods where structures are more uniform, or do they vary as they would if structures were a mix of skyscrapers and residential homes?
Using an integrated schedule, the two CMAS mobile labs were deployed along with the Educator Traverse campaign vehicles to simultaneously collect data at specific times on air quality, air and surface temperature, and winds in pre-determined neighborhood grids.
A total of 12 neighborhoods were identified in the Phoenix metro area and roughly 45 hours of data was collected during both day and night times
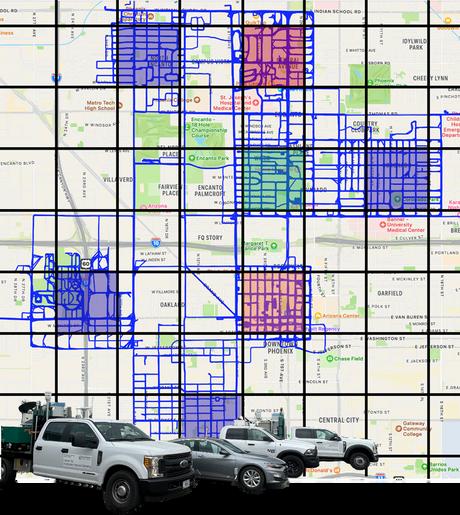
To answer these questions, SW-IFL’s Observation Team mapped designated regions in the Phoenix metro area and again in Tucson, at 1km x 1km to match the Weather Research & Forecasting (WRF) Model provided by the SW-IFL’s Modeling team and used for climate predictions.
Using the Model of America digital twin, regions with different levels of building variability were selected Using input from SW-IFL stakeholders on underserved, data poor neighborhoods with a lack of greenery and experiencing unhoused populations, along with more data rich, economically stable neighborhoods with access to greenery for contrast, were also taken into consideration when creating these maps.
Science objective 2:Cool Air Advection
Question 1:
How much can a large green space cool the air?
Question 2:
If any green space can, will the cool breeze created above this green space travel downwind to benefit a neighborhood that doesn’t have this green space directly mixed in, and how does this change with wind speed? Will a stronger wind result in cooling further downwind, benefitting a larger segment of the population?
To answer these questions, SW-IFL researchers worked with the City of Phoenix to access Encanto Park Golf Course, where an eddy flux tower and AZMET weather station were already installed (marked on the map in red x’s) SW-IFL deployed the mobile eddy covariance tower (marked on the map in yellow dots) to collect measurements within the green space, and at the edge between the green space and the urban environment Educator Traverse routes (marked on the map in blue lines) allowed sensors to map air and surface temperatures downwind of the green space, providing a wider coverage area. The CMAS mobile labs were deployed along routes (marked on the map with orange arrows) to collect measurements, while weather balloons (marked on the map with red dots) were launched every two hours
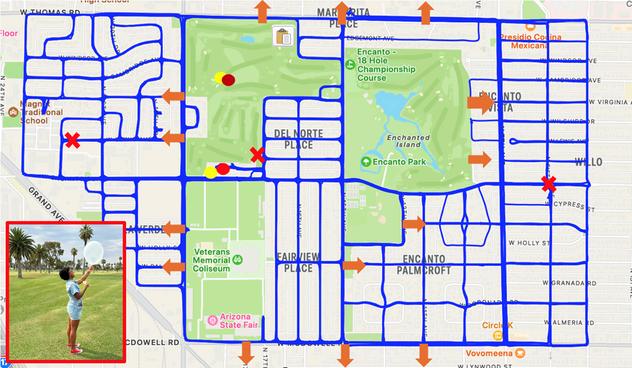
This multi-instrumented data set of air temperature spans from the ground temperature to temperatures up to 300 meters, and includes information on winds and humidity SW-IFL collected roughly 32 hours of data with a mix of day and night collections to determine if there were any shifts associated with the presence of the sun
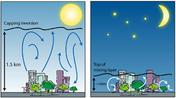
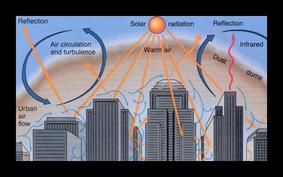
Science objective 3:Urban Dome*
Question 1:
What is the structure of Phoenix’s lower atmosphere?
Question 2:
How does the atmosphere change as we move away from the city center?
*An urban heat or dust dome is a meteorological phenomenon that forms over urban areas in which aerosols, pollution particles, and chemical emissions become trapped above urban spaces.
Phoenix,AZ.
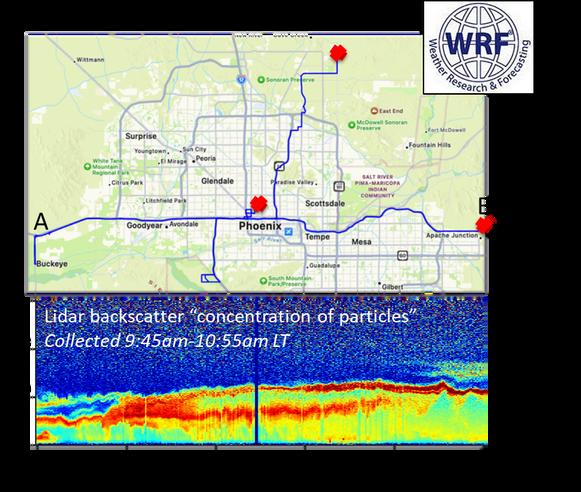
This particular snapshot an initial observation reflects a variability in aerosols along the route, starting small at Point A in Buckeye, thickening as CMAS pass through downtown Phoenix, and then thinning again at Point B in Mesa. More data analysis is needed to quantify how much the aerosol layer changes and why
This allows researchers to better understand the transport of urban air in the natural environments around Phoenix
To approach these questions, the two CMAS mobile labs were deployed along selected transects of the city based on past WRF model studies from SW-IFL’s Modeling team (marked in blue) for one hour
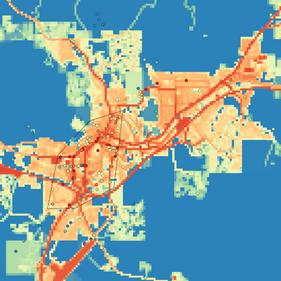
The Lidar backscatter image below denotes data collected from CMAS to measure concentrations of particles. The more red in the image, the more particles are detected
A total of 10 transects were undertaken during day and night times, along with 11 Windsond and 10 radiosonde launches
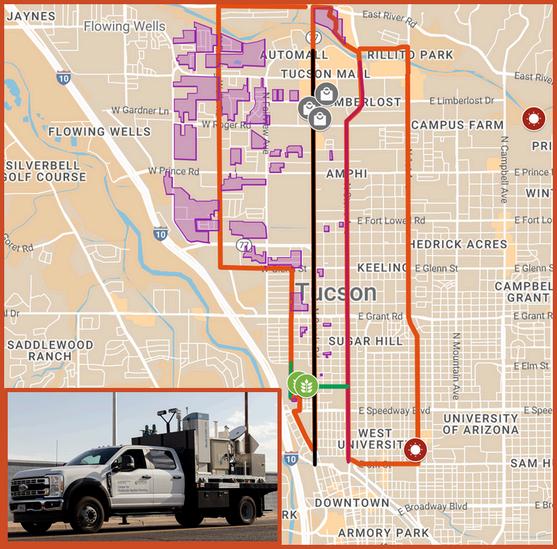
Can we map the current state of Tucson’s urban climate?
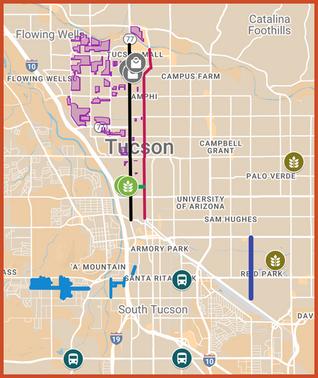
SW-IFL worked with stakeholders to plan a route that would pass through houses participating in our Home Thermal Security survey (green lines on map), along with planned infrastructure changes along the Oracle Road corridor (purple blocks on map) Also identified were bus stops with green stormwater infrastructure installations (leaf icons on map), and the only two weather stations (red suns on map) in the area currently collecting data
Recognizing the need for additional observations and data collection, the CMAS mobile labs were deployed along the designated transect (orange lines on map) to collect data in the neighborhood areas that will remain constant
Areas to the right and left parts of the neighborhood, have slated infrastructure changes Both Windsond and radiosondes were launched simultaneously
SW-IFL will repeat these observations in the coming years to identify relative differences and their changes as a complementary data set
For this objective, 13 hours of data collection during day time was completed
How do multi-scale climate and surface/human drivers interact?
How will their impacts manifest spatiotemporally across urban environments and into the future?
The focus of the SW-IFL project is how extreme heat translates across sectors, across society, and across populations To do this, SW-IFL researchers use a sophisticated modeling approach that differs from traditional urban climate modeling This inventive approach addresses the primary research questions of how multi-scale climate, surface, and human drivers interact, and how their impacts manifest spatiotemporally across urban environments and into the future, with a two-pronged approach that involves test beds and predictive activities
RESEARCH TOOLS:
Community Test Beds
Technology Test Beds
Predictive Activities

The SW-IFL Modeling team works closely with the Observation team to determine what sort of data collection is appropriate for the specific research activity and enhance our predictive capabilities. They add this to work with the Resilient Solutions team to identify which interventions to study for implementation at scale, such as across an entire city, and into the future.

imate modeling community has focused on e by analyzing the evaluation of simulations. undamental observations carried out at of time, such as the IOPs and field the previous section. This allows us to chanisms that lead to an out of a particular ular endpoint For example, traditional focus emperature forecast for today?”, whereas ring “what are the factors that lead to

This collection of various observational data from our Observation team, or ‘data dictionary’, allows immediate and seamless access to data to evaluate and validate not only existing atmospheric modeling frameworks but also novel modeling frameworks currently being developed, with a focus on intervention science that provides quantifiable benefits for people and society.
The SW-IFL project works with community partners to implement large test beds in order to observe the local effects of different types of interventions
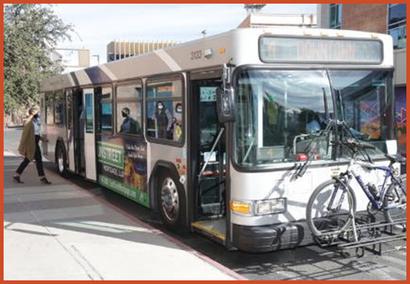
Located in Tucson, SW-IFL researchers worked with community partners to asses ongoing and planned intervention needs in this four-mile transit corridor with high social vulnerability characteristics This test bed was a key part of our 2024 IOP field campaign, and will continue to play a significant role as the project moves forward.
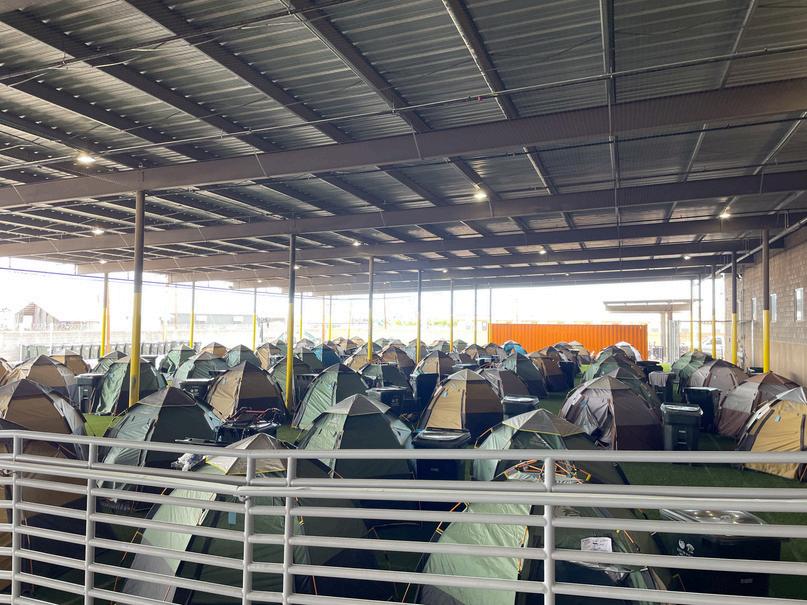
Located in south Phoenix, the Safe Outdoor Space (SOS) was created by the City of Phoenix to provide a safe outdoor camping option for the unhoused population.
SW-IFL researchers have incorporated various cooling solutions such as cool roofing films and vegetations, in conjunction with deployment of existing weather stations and infrared radiometers (IR) sensors to capture environmental changes on surface temperatures
A range of observational campaigns and monitoring of thermal environment activities are planned for this test bed to help inform some micro-scale modeling to assess the impact of various interventions
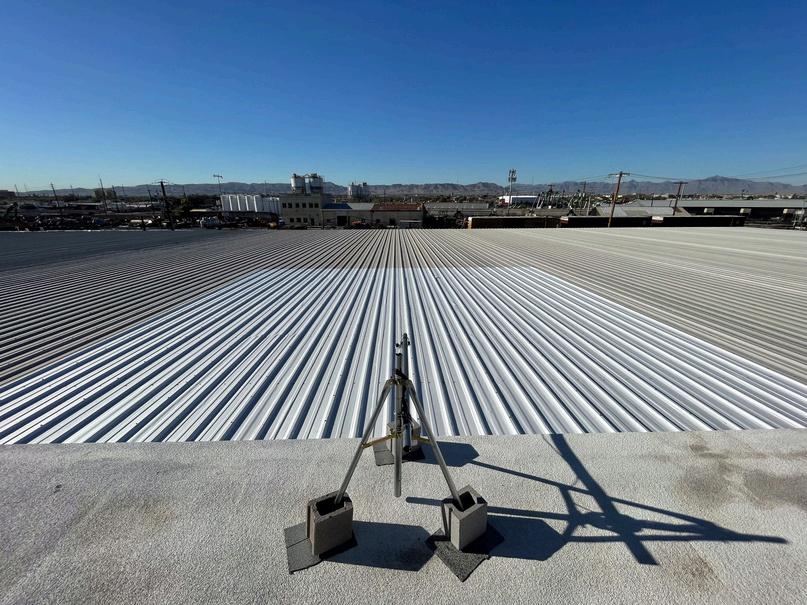
The SW-IFL project utilizes technology test beds to predict performance of cooling strategies applied at scale and into the future One such activity focuses on the ability of passive radiative cooling materials, or coatings with a very high solar reflectance and very high thermal emittance, to prove a range of cooling benefits
The radiative properties of shade structures affect their surface temperatures and when passive radiative cooling materials are introduced, like the cooling film used in this technology test bed in Phoenix, Arizona, structure surface temperatures cooled by 7 °C on average as compared to the control shelter. Summer daytime mean radiant temperature under the shelter with the cool film
was reduced by more than 3 °C The cool film shelter also produced neighborhood-wide cooling by reducing sensible heat exchange with the airshed by a daytime average of more than 200 W/m^2
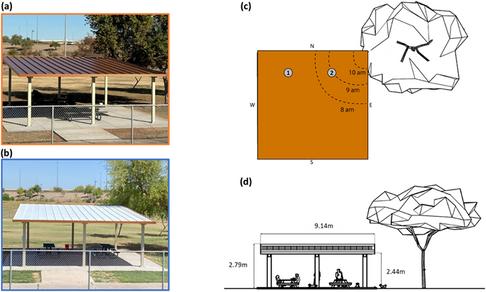
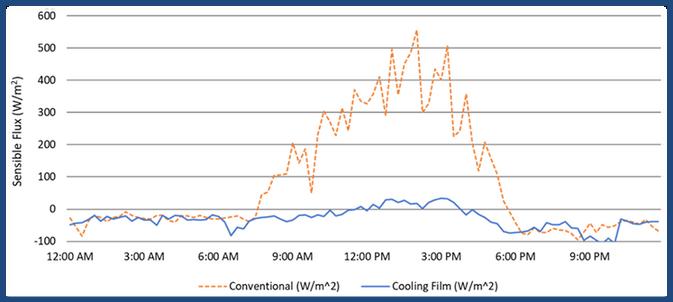
Sailor,Fagliarone,Hebrink,andAmaripadath,2024 Fieldevaluationoftheefficacyofpassiveradiativecooling infrastructure:AcasestudyinPhoenixArizona BuildingandEnvironment,https://doiorg/101016/jbuildenv2024112226
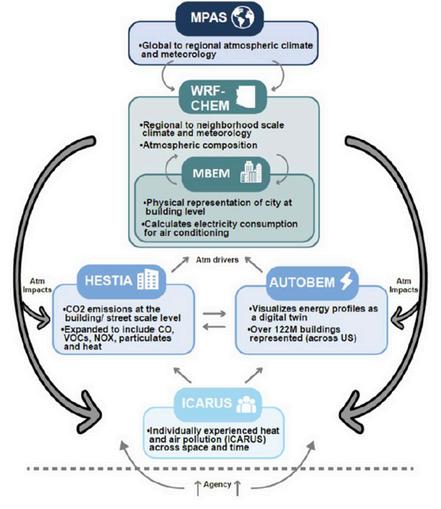
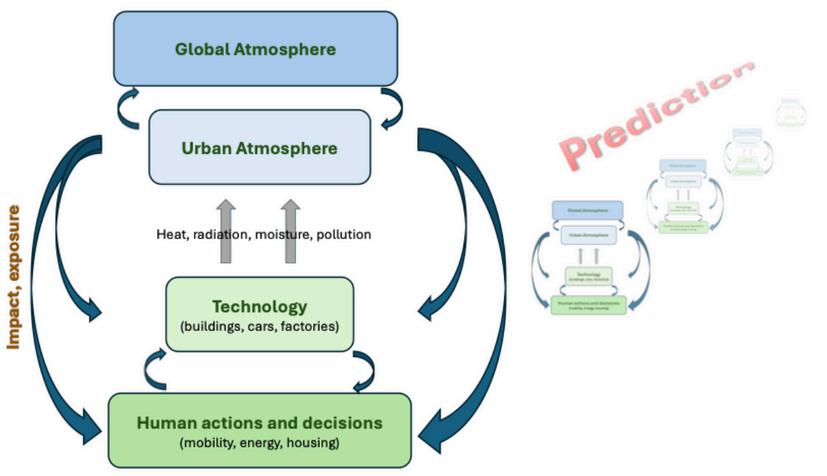
Model of Models (MoM) –
This is the primary tool utilized by the SW-IFL Modeling team It is an amalgamation of direct linkages between various modeling components of the Earth climate system and four distinctive parts: global atmosphere, urban atmosphere, technology (built environment), and human actions and decisions (humans and technology), that interact in distinctive ways both spatially and temporally.
ModelforPredictionAcross Scales(MPAS)
WeatherResearchand Forecastingmodel(WRFCHEM)
ModifiedBuildingEnergy Model(MBEM)
AutomaticBuildingEnergy
Modeling(AUTOBEM)
Modelsforsustainable
Individuallyexperienceheat andairpollution(ICARUS)
The challenge faced by SW-IFL Modeling researchers was how to get the traditional diagnostic models such as Model for Prediction Across Scales (MPAS), Weather Research and Forecasting model (WRFCHEM), and others, to not only talk to one another, but produce meaningful information that can then be scaled from the global level down to the local level while evaluating the associated impacts on predictive outcomes This is especially difficult when adding in scaling issues and meaningful outputs across the various models
-
The diagnostic models include: Model for Prediction Across Scales (MPAS), Weather Research and Forecasting model coupled with Chemistry (WRF-CHEM), Modified Building Energy Model (MBEM), Automatic Building Energy Modeling (AutoBEM), models for sustainable agriculture (HESTIA), and individually experience heat and air pollution (ICARUS) models.
BuildingEnergyModelingmapofArizonaStateUniversityfromORNL https://evenstarornlgov/autobem/Maricopa/Maricopahtml
-
Establishing fundamental, baseline criteria for the various emission models, coupled with human decision makers, help identify opportunities for future policy interventions through location specific, inventory emissions characterizations that are scalable The goal to build a diagnostic product that enables future predictions based on research and determine the impact of various interventions on society is at the heart of the SW-IFL project

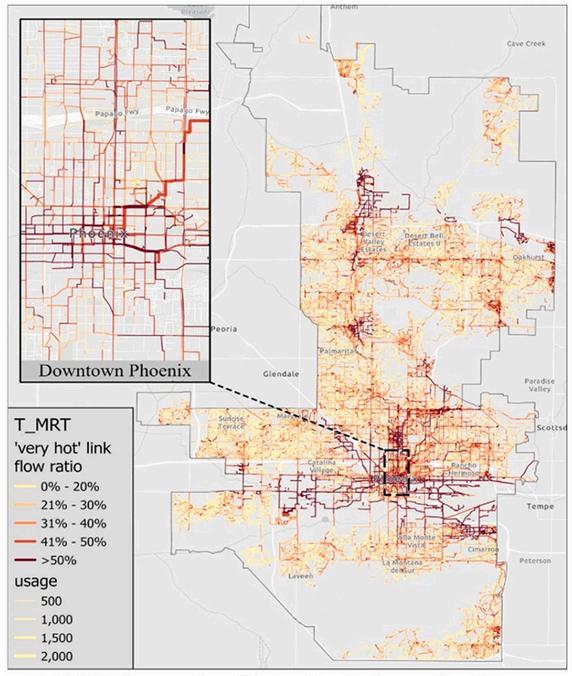
Developed by Dr Mikhail Chester at Arizona State University (ASU) is a statistically based, spatial, temporal, rerouting transit model Its primary objective is to simulate neighborhood to large-scale travel and indoor activities, environmental hazards and exposure, and mitigation opportunities
For example, if exposure to heat or radiation undergoes a change, what is the scale representation of that change and how does that modify or reroute travel behavior? Similarly, how might implementation of heat mitigation strategies translate to such rerouting?

RepurposingMesoscaleTraffic
ModelsforInsightsintoTraveler HeatExposure,RuiLi,Mikhail Chester,DavidHondula,Ariane Middel,JenniferVanos,Lance Watkins,Transportation ResearchPartD,2023, 114(103548),doi: 101016/jtrd2022103548
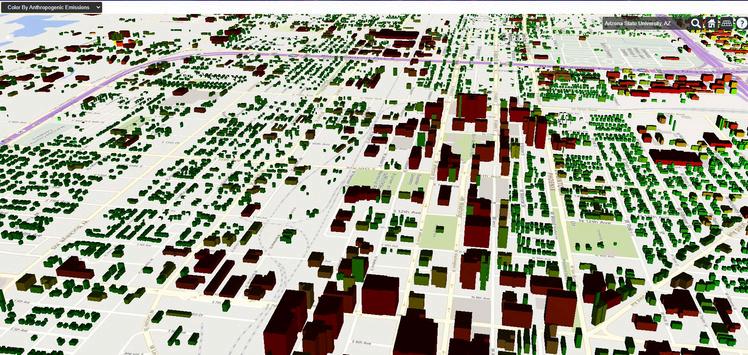
Dr Joshua Ryan New’s team from Oak Ridge National Laboratory have generated building morphology and energy simulation over all buildings in the US, creating a digital twin that includes the state of Arizona
AggregatedBuildingDatabasedon1kmx1kmGridCellsforArizona
In a non-traditional approach, these observed morphological characteristics have been incorporated into our atmospheric (WRF) modeling system to more accurately represent the 3D structure of the built environment ensuring that the physical structure and dimensions, such as the buildings heights, the height to width ratio, and road widths, are accurately represented in these urban canopy models.

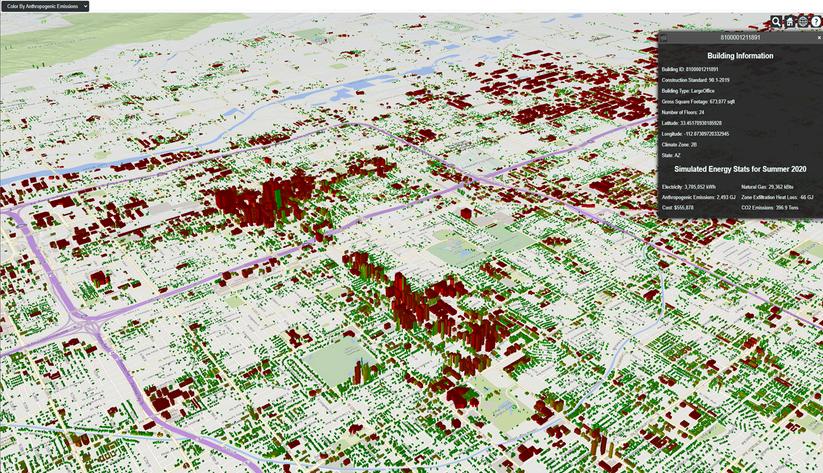
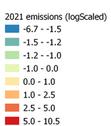
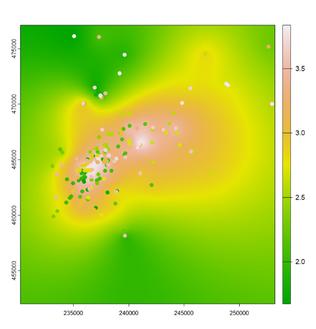
Dr Kevin Gurney’s team at Northern Arizona University completed a spatially explicit, hourly, sector specific (eg, transportation, commercial buildings) and technology specific data inventory of CO emissions, local air pollution and anthropogenic heat emissions from 2010 until the present
This data can now be compared to independently produced AutoBEM results (digital twin) to determine the similarities between two disparate approaches Similarly, the data can be compared to a segment of the WRF results to calculate the anthropogenic heat due to air conditioning 2 2

Cross-comparebuildings withAutoBEM,likeimage onpreviouspagefrom ORNL.,tocompleteasset scaleforallsectors.
Unfortunately, we can not do the same with traffic as some atmospheric activities in WRF don’t readily include this data, which highlights the compatibility challenges in some cases where comparing product A to product B is unavailable due to a lack of source data This point is currently under refinement by the SWIFL researchers
As mentioned previously, this traffic app was developed by SW-IFL researchers at NAU to collect traffic data to improve modeling of carbon dioxide and vehicular heat emissions The goal of this app is to capture this human driven component of atmospheric climate modeling that is not only generally not accessible, but also unable to be simulated effectively
Implementing accurate data into our modeling framework allows researchers to incorporate interventions which translates into improved emissions and modeling of urban environments which can be deployed at scale from the local level (Arizona) to the federal level (US)
SW-IFL researchers at NAU collect C plant samples from Flagstaff, Phoenix, and Tucson to calibrate and validate research observations associated with emissions models that include CO , air pollution, and anthropogenic heat in agricultural models such as HESTIA
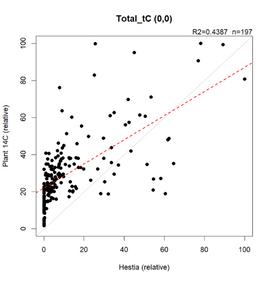
Preliminaryanalysisof
Global and Human Atmosphere -
Traditionally urban climate and meteorological downscaling is performed through the utility of reanalysis data Reanalysis data is a blended observational and modeling product that is put on a horizontal and vertical mesh Reanalysis data serve as initial conditions (IC) and lateral boundary conditions (LBCs) and are used to “force”, or guide, a regional climate model over a particular area of choice This is done because regional climate models need information at their boundaries This approach has produced a lot of great research over the decades
The SW-IFL Modeling team hypothesizes that a more accurate approach is to use the MPAS model, the global parent of WRF, instead of the more traditional European reanalysis product ERA-5, for the duration of a model integration researchers are interested in To enable this, the output from MPAS is used to create the WRF model’s ICs and LBCs for the WRF domain The Modeling team conducted an initial set of evaluation experiments to test this hypothesis We explain these initial results below
MPAS Mesh
Configuration: 20 km grid spacing across SW US
ERA-5: reanalysis at a resolution of 025 degrees

WRF Domain Configuration
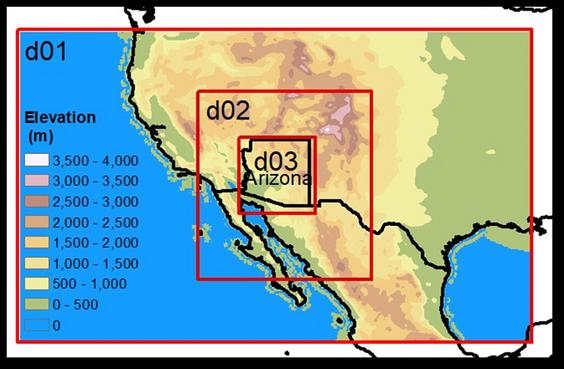
WRF Domain: D01-D02-D03 are 18, 6, 2 km horizontal grid spacing, respectively
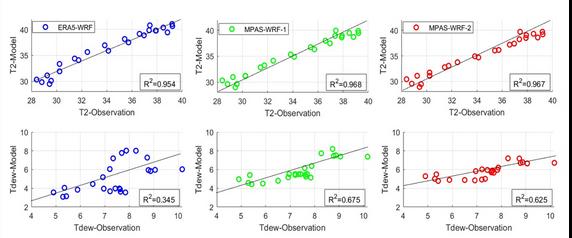
In the first experiment, the Modeling team noted improved performance of this approach – see left panel’s brown and orange contours, which characterize the MPAS-to-WRF approach – relative to the standard urban downscaling approach (ERA5-WRF) for about the first 4 days, for temperature (left hand panel below) The Modeling team also note an improvement in near surface moisture representation (that is, “dewpoint”; right hand panel below) for the full 10-days of simulation (simulation period was June 2020) using the new approach They noted that the dry bias from the ERA5 driver simulation is reduced significantly when utilizing this new approach
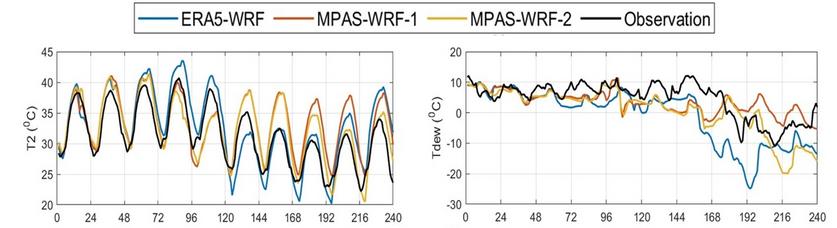
In a second set of experiments, the Modeling team noted the already excellent performance, for the first 4 days of the simulation period, by the traditional approach. They nonetheless highlighted a small improvement when incorporating the MPAS-to-WRF approach, the latter of which are distinguished through their incorporation of Sea Surface Temperature (SST) updates in the MPAS simulation (noted as MPAS-WRF-1 [without SST updates] and MPAS-WRF-2 [with SST updates]).
For dew-point temperature near the surface, an absolute metric of water vapor content, the team highlights significant improvement with our approach (note increase in “R2” values, which characterize how well the model agrees with observations, from ERA5-WRF simulation of about 035 to MPAS-WRF simulations in excess of 06)
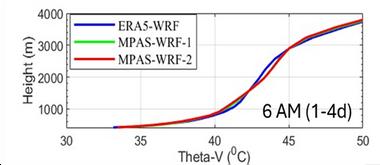
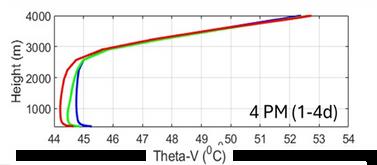
The Modeling team simulated not just surface and nearsurface characteristics using our new framework, but also examined the impacts across the planetary boundary layer (PBL) which is the lowest few kilometers of the atmosphere They highlight that improvements in temperature diagnosed at the surface become magnified during the afternoon hours However, until now, we have not had an opportunity to validate the model physics associated with these impacts; we note this is a common shortcoming for urban meteorological and climatological studies across the community – we simply lack observations of the lower atmosphere. We are working with our Observational team partners to incorporate their work into ours to better represent such “land-atmosphere” interactions.
Thanks to the SW-IFL Observations team, future simulations will focus explicitly on better understanding and validating the physical processes that directly contribute to these PBL changes between our approach and the standard approach The additional data inventory and new observational campaigns will offer unprecedented opportunities for improved understanding of urban-land atmosphere interactions
Model Coupling –
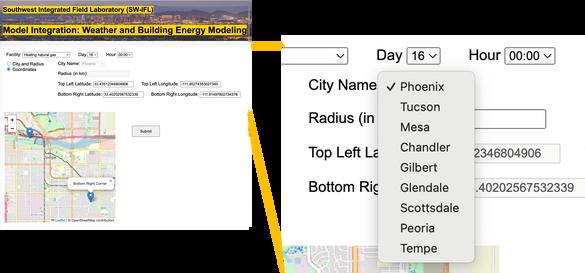
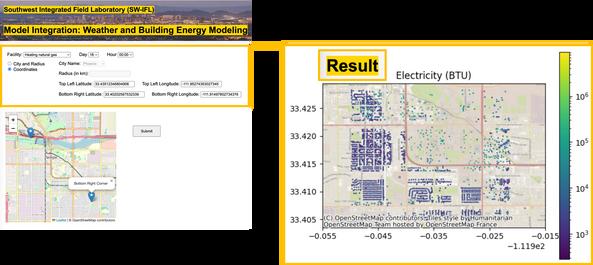
Coupling a diagnostic model with a prognostic model can generate valuable products for human decision makers to incorporate into their policy making SW-IFL Modeling researchers have begun implementation of direct coupling between some of the MoM components, such as AutoBEM, an individual building scale energy demand model from ORNL, and WRF output, to build an interface that allows end users to query a location, either by highlighting coordinates directly, or through a drop-down menu of specific cities for an explicit representation of electricity consumption Our broad-based metro-area calculations reveal nonnegligible differences between WRF as a driver for AutoBEM energy consumption and the traditional datadriven approach that utilizes NASA power data. This interface is not yet public.
Asampleofmodelingcoupling

How can SW-IFL science be best utilized to help decisionmakers and communities to create a sustainable urban environment for Arizona's future?
Arizona currently faces the challenges of extreme heat and air quality. A core goal of SW-IFL is to utilize cutting-edge science to inform Arizona's decision makers and communities to empower them to address these challenges
To do that effectively, the focus of the SW-IFL Resilient Solutions team is to garner community engagement, disseminate the project’s research activities, and then develop a cadre of solutions and tools that will help create positive change for Arizona’s future
Engagement
Dissemination
Solutions and Tools
In this report, we highlight some, but not all, of the team’s activities in addition to the Phoenix and Tucson test beds We start with projects that enable researcher engagement with stakeholders and communities
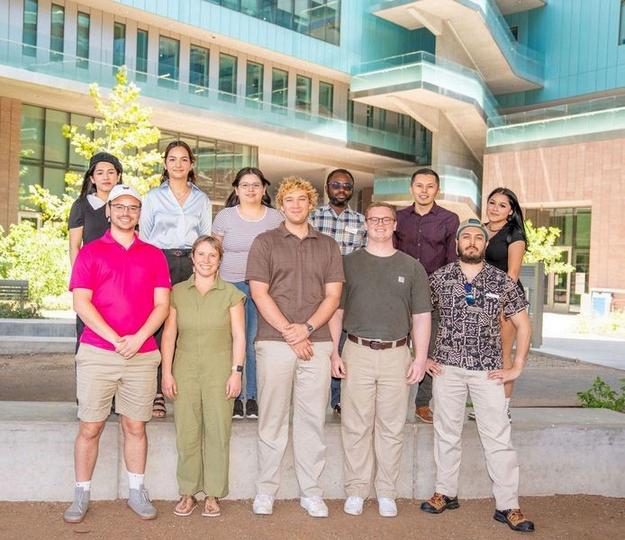
Led by Dr Patricia Solis at Arizona State University, this student cohort program, worked with Resilient Team researchers to collect valuable data in the field, immersing students in hands-on research Student participants were solicited across participating SW-IFL universities, minority-service institutions and tribal colleges to foster diversity and inclusion.
Selected students were then trained and oriented, before being placed with one of three participating universities for a six-week residential period: Arizona State University (ASU), University of Arizona (U of A), and Northern Arizona University (NAU) This allowed them to contribute directly to observational campaigns, ground-truthing, data validation, and co-producing solutions
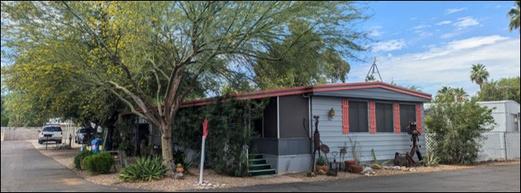
Overseen by Dr Mark Kear (U of A) and graduate student, Elise Otto (U of A), the student team of Isabel Gonzalez (ASU), Jessica Guerrero (Estrella Mountain Community College), and Justinian Tassinari (ASU) conducted field surveys and interviews with approximately 40 residents in mobile home parks and public housing to gather information on their experiences with heat and household comfort.
They collected data on carbon dioxide (CO ), temperature, and relative humidity in indoor environments, gaining experience in environmental data analysis and community engagement Preliminary data visualizations revealed significant variations in household temperature management, providing valuable insights for future infrastructure improvements in Tucson 2
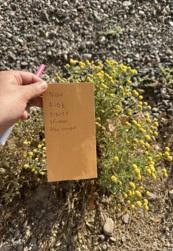
Working with NAU’s Dr Kevin Gurney and postdoctoral researcher, Anna Kato, the student team of Bianca Arreola (ASU), Roberto Madrigal (Estrella Mountain Community College), and Jocelyn Flores (Estrella Mountain Community College) collected traffic data using a NAU-developed app focused on vehicle counts and emissions across Maricopa County and Flagstaff They also gathered plant samples of Stinknet and Cheatgrass, both of which contain carbon dioxide which reveals patterns of car emissions
Their work enhanced data density and accuracy in the SW-IFL urban spaces, contributing to robust modeling and improved environmental assessments, including assisting with pioneering the HESTA Traffic app
ASU students, Reese Gould and Jacob Heid, focused on gathering essential data to assess the impacts of urban heat and air quality resulting from potential land use changes in Mesa’s many vacant lots
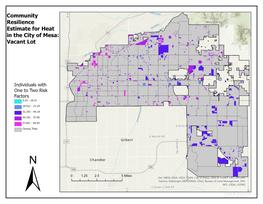
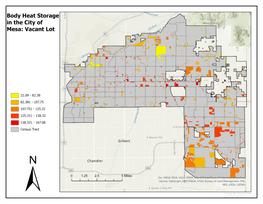
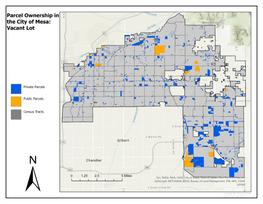
This study, led by ASU’s Dr Patricia Solis with guidance from ASU researchers Dr Ariane Middel and Dr Enrique Vivoni, involved ASU postdoctoral scholars Saeideh Sobhaninia and Ebenezer Boateng as well.
The HeatMappers student participants mapped vacant lots using satellite imagery from OpenStreetMap, and then flagged those lots using parcel attributes across 431 discrete tagging tasks, validating the locations of 1,707 vacant lots This served as a starting point for identifying how land use changes could improve the urban environment
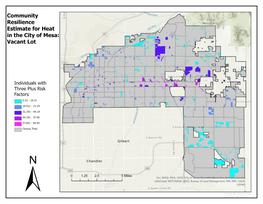
Through direct observation, or groundtruthing, the team verified 66 lots to assess their actual status based on visible imagery, finding that slightly over 70% were completely vacant Utilizing this data, they then analyzed the locations in terms of ownership, parcel data, zoning designations, and land cover, to create a comprehensive GIS-based map of vacancy in Mesa These results were then combined with the Community Resilience Estimates for Heat and the Body Heat Storage methodology, which was developed by U of A researchers, in order to further assess the impact of vacant lots on community health
Led by ASU’s Dr Patricia Solis, three Discovery Fellows were placed and embedded into activities throughout the summer in an effort to engage community decision makers into SW-IFL research Fellows include Dr Challie Facemire, CAZCA Program Director with Desert Botanical Garden; Dr Emily Burns, Program Director with Sky Island Alliance; and Sawyer Routt with Tiger Mountain Foundation


9/24/24 – Flagstaff Festival 4th Grade
Participants: 31 teachers / 694 students
10/3/24 – Prescott 4th Grade
Participants: 11 teachers / 340 students
This University of Arizona program aims to improved science education across Arizona through curriculum design, teacher training workshops, and education events for k-12 students The program aims to incorporate topics related to extreme heat to it's existing education work on water
Year two's focus was on development of a 7th grade STEM curriculum, which will be introduced into educational activities in year three The goal is to create a
In the project’s year one, AZ Project WET partnered with SW-IFL to complete a pilot teacher training workshop focused on extreme heat and related issues. In response to that workshop, the program developed a 4th grade STEM curriculum, which is now being taught during the program's educational workshops science curriculum that incorporates content on heat and air quality for thousands of students, at multiple touch points throughout their K-12 experience, across the state of Arizona
Upcoming: October–Cottonwood&Sedona
November–pilotingamiddleschoolprogram (WSI)atSmithJr. HighinMesa, Arizona
December–pilotingahighschoolprogram (PfaRD)atHamiltonHighinChandler, Arizona
Dr Kristina Currans (U of A) will launch the Mobility Discovery survey in late Spring 2025 to explore how heat influences travel and activity behavior This survey is currently under development
SW-IFL researcher, Chris Lim (U of A), identified sites for installation of purple air sensors, which will collect temperature and air quality data These will supplement the existing University of Arizona Network (SUNet)
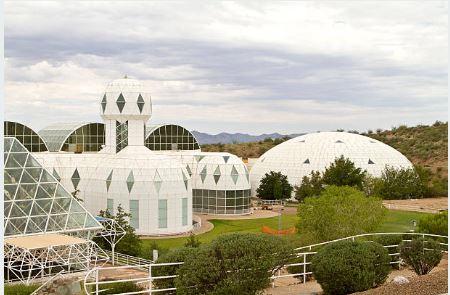
In an additional educational collaboration, SW-IFL researcher, Dr Kenneth Kokroko (U of A), is exploring opportunities to integrate SW-IFL science with Biosphere2’s educational endeavors in Tucson, Arizona
Building Resilience Against Climate Effects (BRACE) and Mosquito Research –
Dr Heidi Brown (U of A) is part of a US Centers for Disease Control and Prevention (CDC) grant program with Arizona Department of Health Services, University of Arizona, and Arizona State University research team that uses a five-step process that allows health officials to develop strategies and programs to help communities prepare for the heal effects of climate change (BRACE) Her current collaborative SW-IFL project looks at county data for mosquito distribution as related to vegetation cover, temperature, and humidity, and future papers are planned
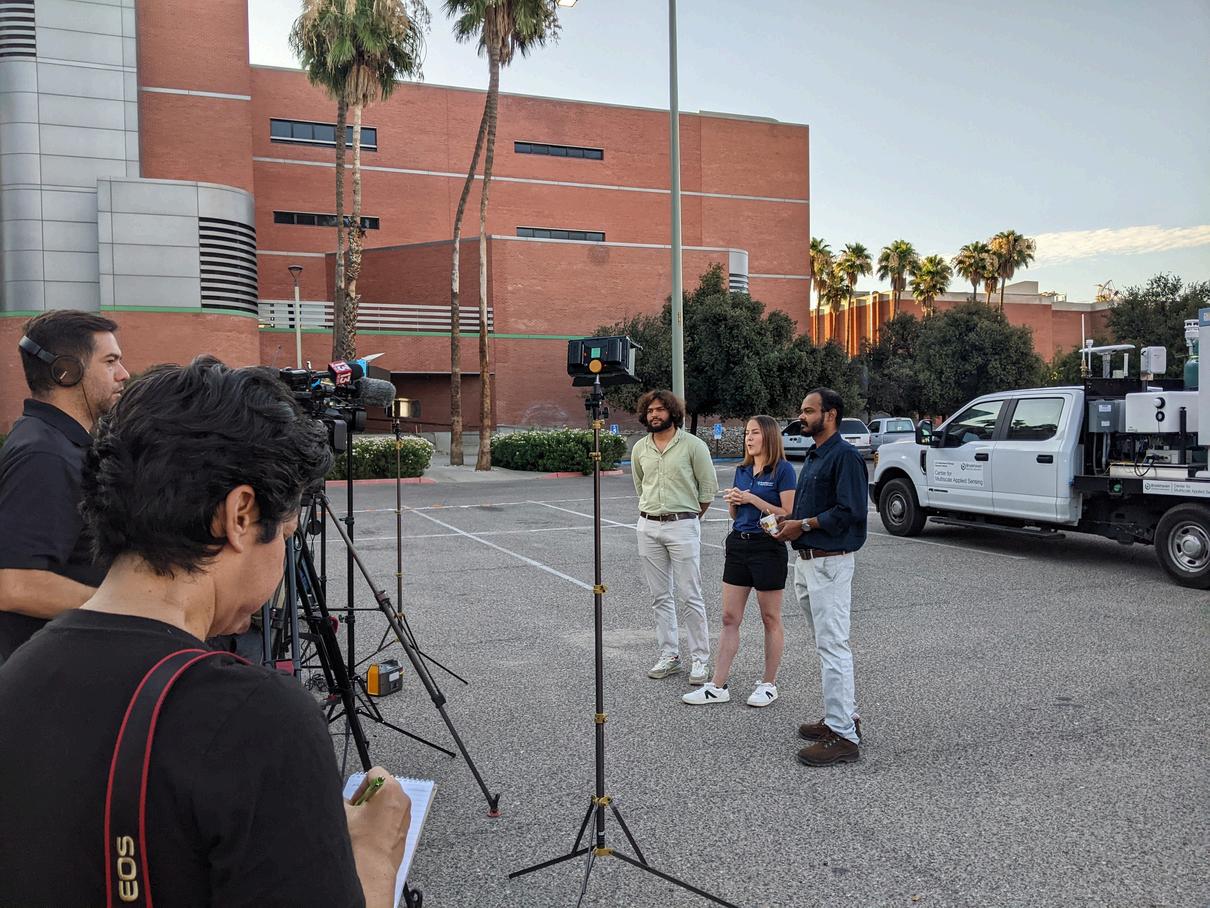
The SW-IFL project strives to share information with different groups and highlight their research through a variety of communication channels, including intrateam meetings, internal and external newsletters, webinars, seminars, journal publications, various media interviews, and multiple conference presentations.

Throughout the year, the SW-IFL project engages in media interviews to showcase our research This is especially robust during the record-breaking temperatures of the summer which garner world-wide attention

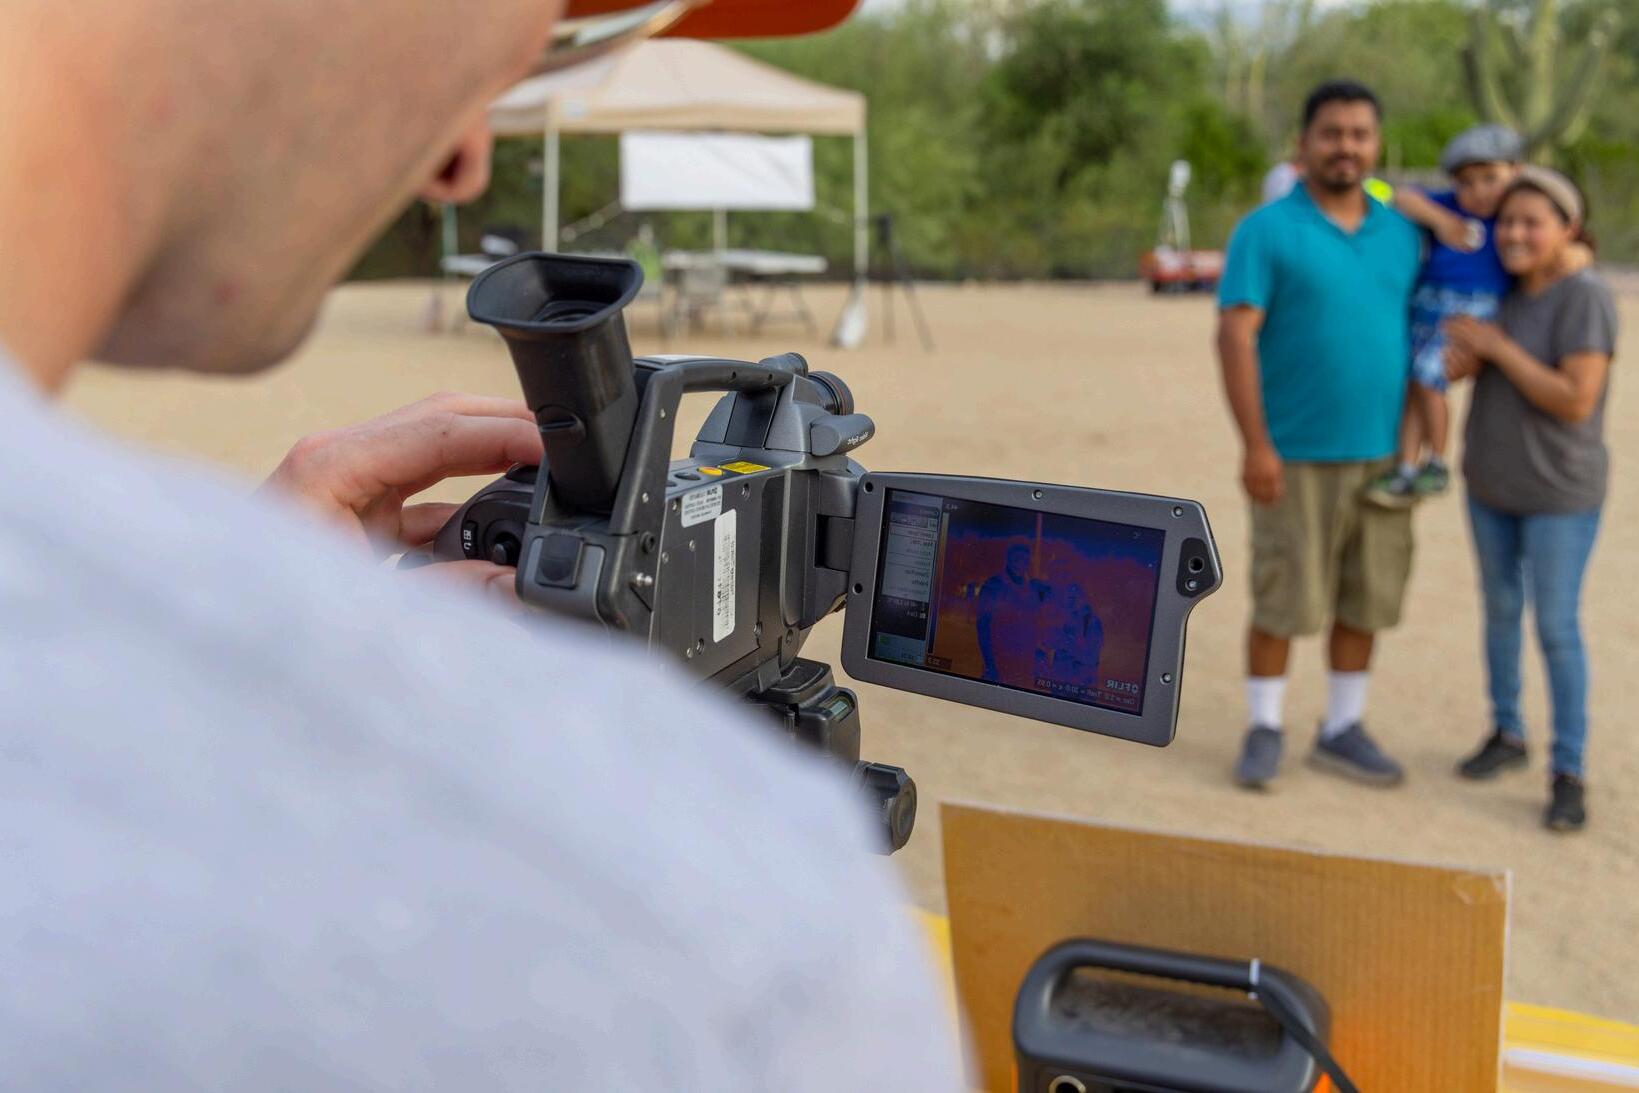
SW-IFL teamed up with Desert Botanical Garden’s “Flashlight Night” on June 22nd to host a SW-IFL Community Night
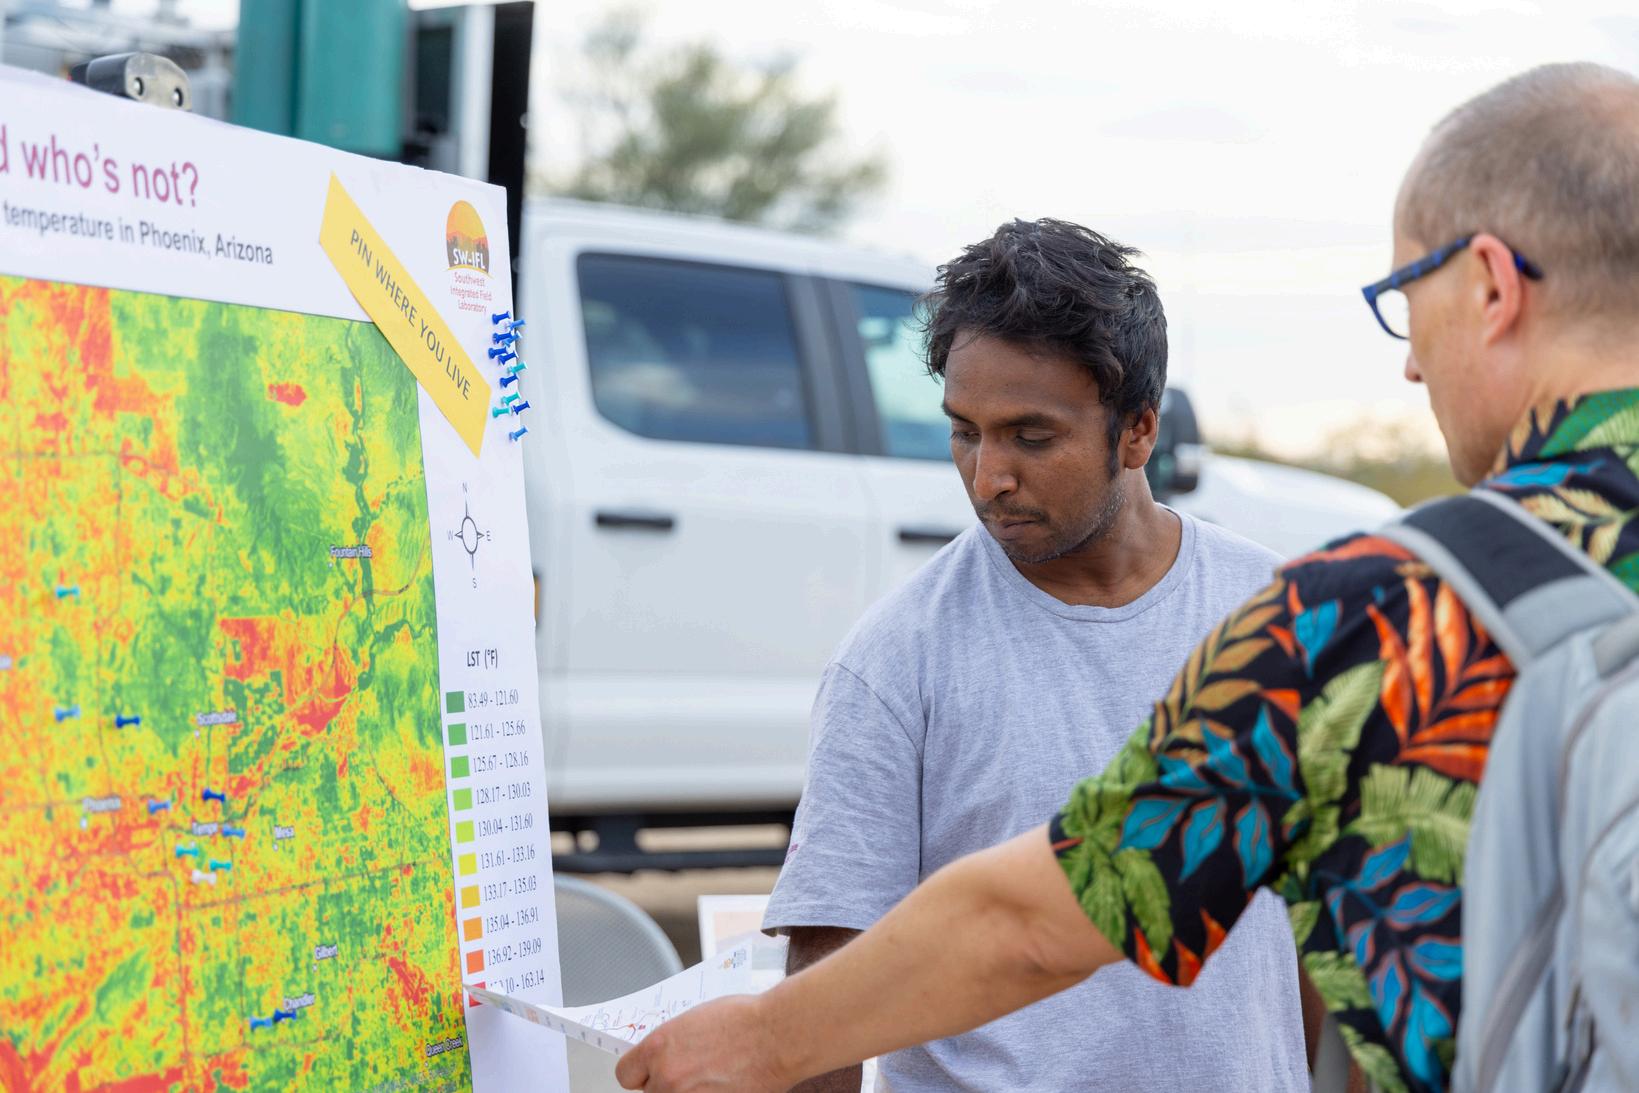
Topleft:AlaminMolla(ASU)discussesvalley hotspotswithGygerfamily
Bottomleft:EliMartin(ASU)takesthermal imageofRamirezfamily
Middle:EdgarRamirezhasquestionsfor SW-IFLresearchers
AllPhotocredits:MeghanFinnerty,ASU CollegeofLiberalArts&SciencesMedia
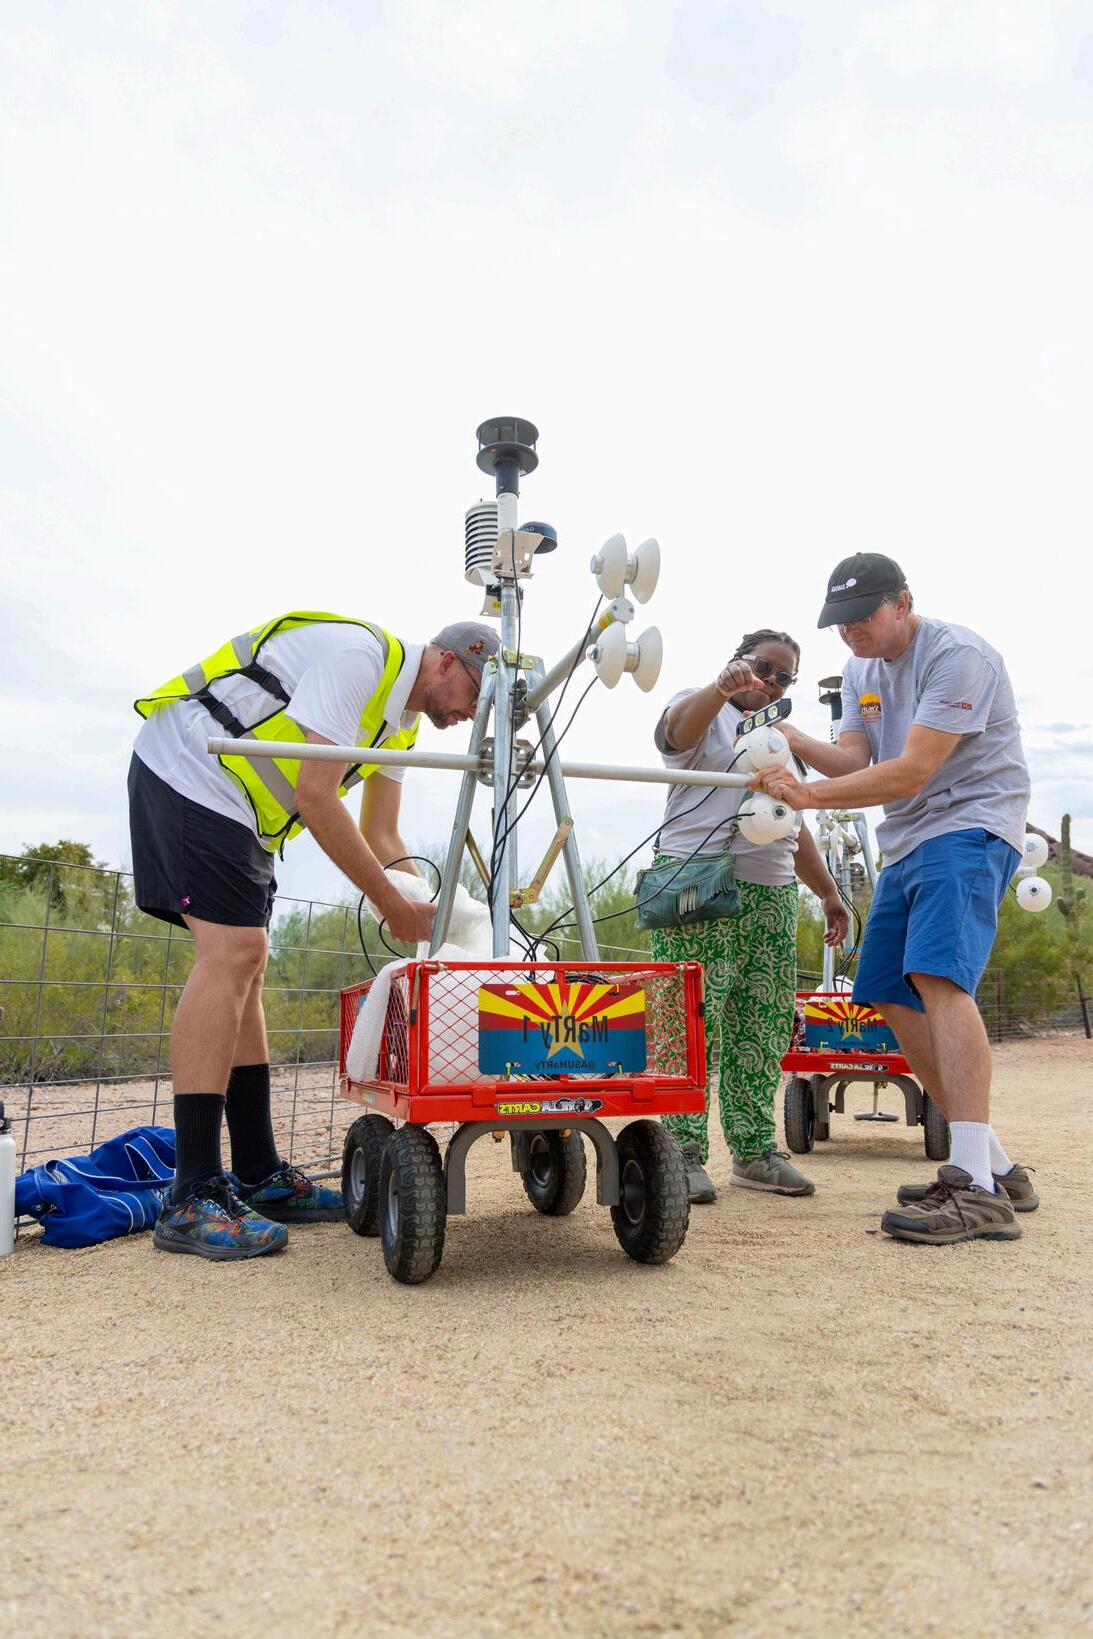
A core team of SW-IFL researchers was onsite to conduct media interviews, answer community questions on our ongoing research This also presented a chance to exhibit the various scientific instrumentation used in the project’s research, including Brookhaven’s mobile lab, ASU’s MaRTy cart, and taking thermal image with the attending public.
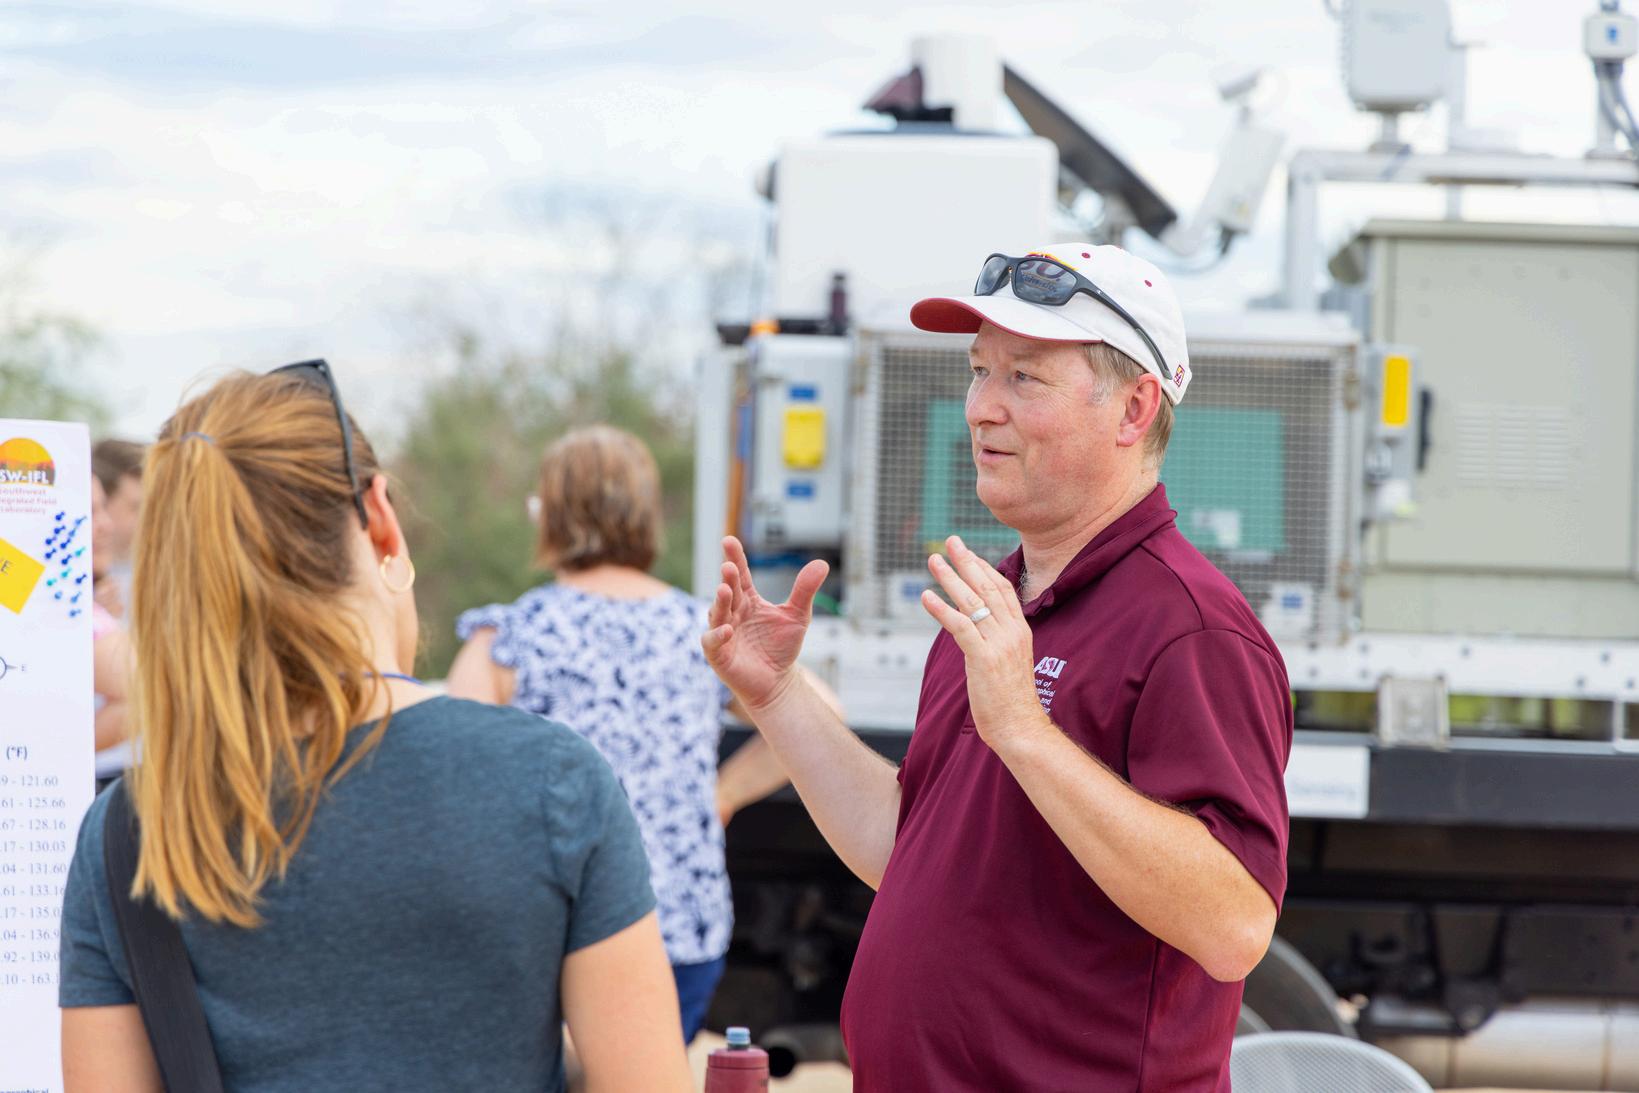

Topleft:DavidSailor(ASU)talkswitha communitymember
Bottomleft:ASU’sMaRTyCartgetssetby PeterPrice(ASU),andvisitingfellows,Pierre BournetandLydiaBrialixfromFrance
AllPhotocredits:MeghanFinnerty,ASU CollegeofLiberalArts&SciencesMedia
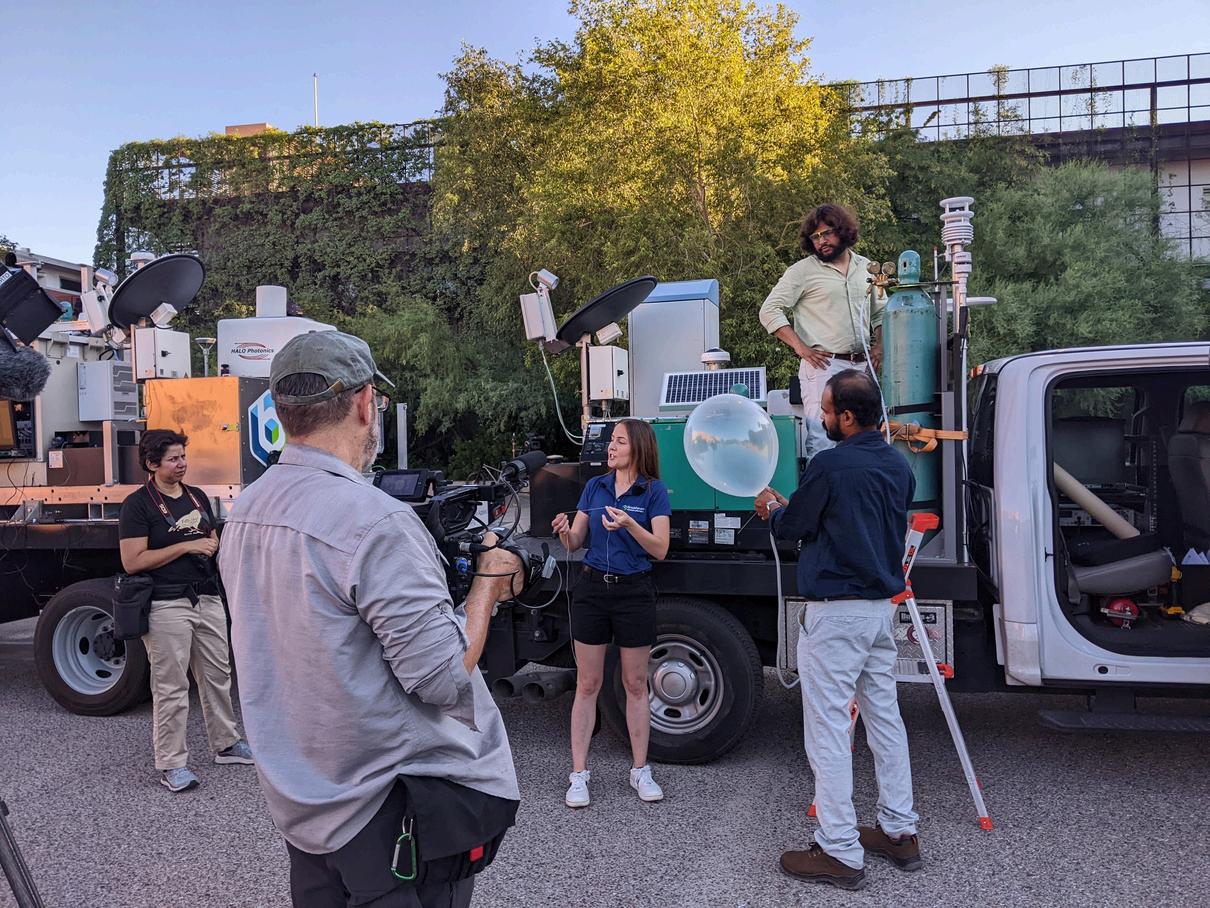
A second media day was held in Tucson and led by U of A and BNL researchers on July 2nd, presenting the local community members and media outlets an opportunity to discuss and participate in SW-IFL research activities
Topleft:KatiaLamer,ParagJoshi,EdwinDavis(BNL)setupforReidParkWindsondlaunchwithfellowResilientSolutionsteammember
Photocredit:Kirsten Lake,UA
Topandbottomright:SW-IFL’sBNLteamprovideinformationonCMASmobilelabstoTucsonmediaoutlets Photocredit:KirstenLake,UA
Bottomleft: KatiaLamer(center)preparesforaweatherballoonlaunchfromReidParkwithBrookhavenNationalLaboratorypostdoctoralresearchersEdwin Davis(left)andParagJoshi Theballoonscollectweatherdataashighupas16milesfromthesurfaceoftheEarth
Photocredit:KyleMittan,UAUniversity Communications
Middle:KatiaLamer(BNL)showsthetruck'sroutethroughmidtownTucsonduringadata-collectiontriponFriday
Photocredit:KyleMittan,UAUniversity Communications
Plan Evaluation for Heat Resilience – Led by Dr Ladd Keith (U of A) and Dr Sara Meerow (ASU)
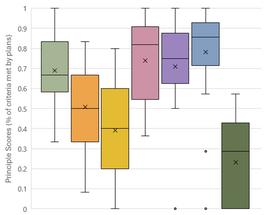
Using three different plan evaluation approaches, in year two Drs Keith and Meerow evaluated the network of plans in seven Arizona cities for heat resilience Reports of the plan evaluation results were given to each city to help guide future plan updates and improve heat resilience planning.
To date, 21 plans in total have been evaluated
The three approaches include plan quality evaluation, Plan Integration for Resilience Scorecard™ (PIRS™) for Heat, and plan cross referencing (see figure below)
This work shows how integrated the network of plans is in each community, and helps identifies areas for future policy improvement
All Cities
Assesses the quality of the plans, including goals, fact base, heat mitigation and management strategies, participation, and implementation measures
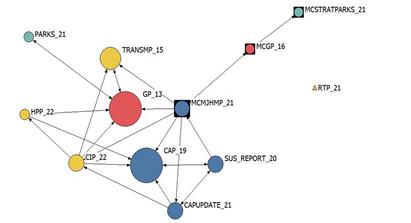
Assesses connections and strength of connections between plans –maps the “network of plans”
Plan Integration for Resilience Scorecard (PIRS ) TM TM
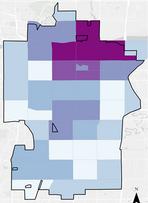
Assesses how a community’s “network of plans” collectively guide development, heat hazard, and heat vulnerability
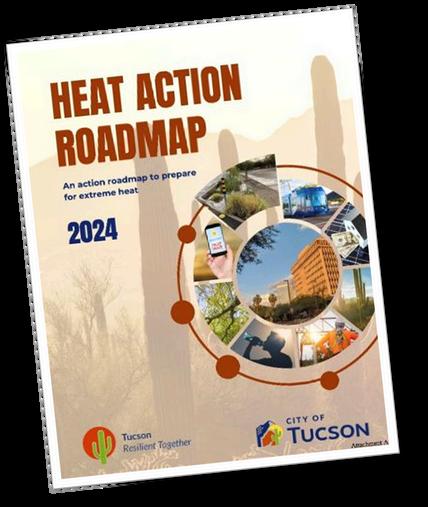
In February 2024, SW-IFL researchers collaborated with the City of Tucson and Pima County to host the first Southern Arizona Heat Summit The summit was attended by over 100 local community members and decisionmakers and focused on identifying heat impacts and policy solutions
Drs Keith and Meerow and Dr Malini Roy, SW-IFL postdoctoral research associate, served as technical experts and evaluated the draft of the Heat Action Roadmap during its development using their approaches, which supported the adoption of the final Heat Action Roadmap in June 2024 Tucson's plan is the first heat action plan adopted in the State of Arizona and won a state planning award in August 2024 for its comprehensive approach to addressing extreme heat

Drs Keith, Meerow, and Roy have extended their plan evaluation work to multi-hazards, developing the Climate Action Plan Evaluation (CAPE) approach The CAPE approach is being piloted in City of Tucson and Pima County comprehensive plan updates to support planning for multiple climate impacts

Drs Keith and Meerow were named co-leads for the National Integrated Heat Health Information System’s (NIHHIS) newly created Center for Heat Resilient Communities which will scale similar activities and research of the SW-IFL project nationally to serve 30 communities across the US
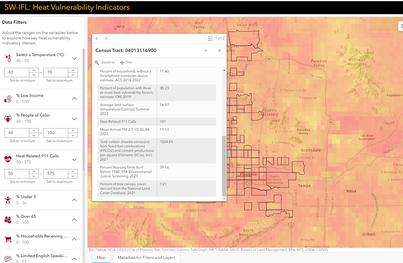
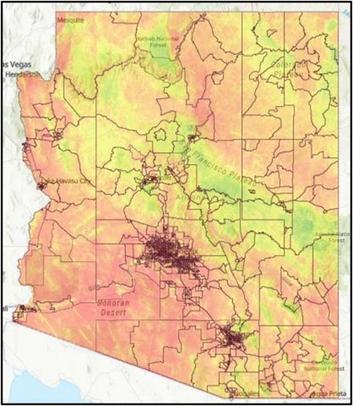
Located on the SW-IFL website, the Arizona Heat Exposure Dashboard is a beta version of a one-stop-shop for heat related information This is a precursor to a comprehensive data tool available to decision-makers that will share valuable information such as heat vulnerability and heat exposures. While some wellresourced cities, such as Phoenix and Tucson, may find this a duplication of existing information, the goal is to scale access to those communities in Arizona who do not have access to such sophisticated tools and resources.
In an effort to provide a foundation on which new scientific discoveries and inventions are built, the SW-IFL research team values sharing research data both internally and externally To this end, in year two the SW-IFL team published their work in a variety of professional journals, technical reports, and media interviews
Climate change induced heat stress impact on workplace productivity in a net zero-carbon timber building towards the end of the century.
Citation:
Amaripadath, Deepak; Santamouris, Mattheos; Attia, Shady Climate change induced heat stress impact on workplace productivity in a net zero-carbon timber building towards the end of the century March 13, 2024, Building Simulation, Volume 17, 893-906, ISSN: 1996-8744, https://doi.org/10.1007/s12273-024-1116-7.
Multi-criteria thermal resilience certification scheme for indoor built environments during heat waves.
Citation: Amaripadath,Deepak; Mirzaei, Parham A.; Attia, Shady, Multi-criteria thermal resilience certification scheme for indoor built environments during heat waves. May 10, 2024, Energy and Built Environment, ISSN 2666-1233, https://doiorg/101016/jenbenv202405001
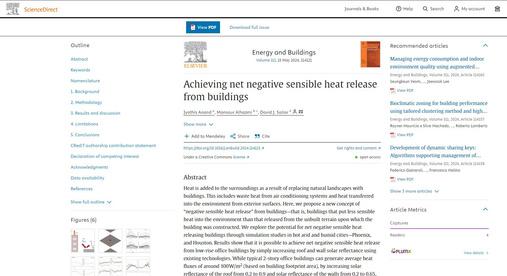
Achieving net negative sensible heat release from buildings.
Citation: Anand, J, Alhazmi, M, and DJ Sailor Achieving net negative sensible heat release from buildings Energy and Buildings, Volume 311, 15 May 2024, 114121, ISSN 03787788, https://doiorg/101016/jenbuild2024114121
Effectiveness of Do-It-Yourself Air Cleaners in Reducing Exposure to Respiratory Aerosols in US Classrooms: A Longitudinal Study of Public Schools.
Citation:
Jehn, ML; Andino,JM ; Russell, B; Rana, V;Akter,S; Creed, MA; Sodhi, H; Holmes, B; Palit,T; Wani, J; Wagstrom, K Effectiveness of Do-It-Yourself Air Cleaners in Reducing Exposure to Respiratory Aerosols in US Classrooms: A Longitudinal Study of Public Schools Building and Environment, Volume 25, 15 June 2024, 111603,ISSN 0360-1323,https://doiorg/101016/jbuildenv2024111603
Open-source automatic extraction of Urban Green Space: Application to assessing improvement in green space access.
Citation:
Estacio, I, Román-Palacios, C, Hoover, J, Li, X, and Lim, C: Open-source automatic extraction of Urban Green Space: Application to assessing improvement in green space access, ISPRS Ann. Photogramm. Remote Sens. Spatial Inf. Sci., X-2-2024, 65–72, https://doiorg/105194/isprs-annals-X-2-2024-65-2024, 2024
Plan evaluation for heat resilience: Complementary methods to comprehensively assess heat planning in Tempe and Tucson, Arizona.
Citation:
Merrow, S., Keith, L., Roy, M., and Shaylynn Trego. Plan evaluation for heat resilience: Complementary methods to comprehensively assess heat planning in Tempe and Tucson, Arizona Environmental Research Letters, https://doiorg/101088/1748-9326-ad5d05
Observations of airflow around a supertall curved building and its impact on temperature and humidity in Houston's urban center.
Citation:
Davis, Edwin V, Lamer, Katia Observations of airflow around a supertall curved building and its impact on temperature and humidity in Houston's urban center Building and Environment, Volume 260, 15 July 2024, 111693, ISSN 0360-1323, https://doiorg/101016/jbuildenv2024111693
Energy performance tradeoff assessment for varying design parameters in office buildings.
Citation:
Amaripadath, D, Alejandro Ramírez-Aguilar, E, Fachinello Krebs, L, & Sailor, D J (2024) Energy performance tradeoff assessment for varying design parameters in office buildings Advances in Building Energy Research, 1–23 https://doiorg/101080/1751254920242387267
Heat exposure mitigation in renovated nearly zero-energy dwellings during concurrent heat waves and power outages.
Citation:
Amaripadath, Deepak; Azar, Elie; Singh, Manoj Kumar; Attia, Shady Heat exposure mitigation in renovated nearly zero-energy dwellings during concurrent heat waves and power outages August 15, 2024, Journal of Building Engineering, Volume 91, 109655, ISSN 2352-7102, https://doiorg/101016/jjobe2024109655
Cities at the forefront of emerging US heat governance.
Citation:
Meerow, Sara; Keith, Ladd Cities at the forefront of emerging US heat governance One Earth, August 16, 2024, One Earth, Volume 7, Issue 8, P1330-1334, ISSN 25903330, https://doi.org/10.1016/j.oneear.2024.07.013.
Impact of tent shade on heat exposures and simulated heat strain for people experiencing homelessness.
Citation:
Karanja, Joseph; Vanos, Jennifer; Joshi, Ankit; Penner, Scott; Guzman, Gisel E; Connor, Dylan S. ; Rykaczewski, Konrad. Impact of tent shade on heat exposures and simulated heat strain for people experiencing homelessness International Journal of Biometeorology, August 26, 2024, SN 1432-1254, https://doiorg/101007/s00484-024-02751-0
Reassessing energy-efficient passive retrofits in terms of indoor environmental quality in residential buildings in the United States.
Citation:
Amaripadath, D and DJ Sailor Reassessing energy-efficient passive retrofits in terms of indoor environmental quality in residential buildings in the United States Energy and Buildings, Volume 319, 15 September 2024, 114564, ISSN 03787788,https://doiorg/101016/jenbuild2024114564
Design optimization of an assisted living facility to improve summer thermal comfort in warming climates.
Citation:
Amaripadath, Deepak; Prasad, Deo; Osman Safi, Taha; Attia, Shady Design optimization of an assisted living facility to improved summer thermal comfort in warming climates Journal of Building Engineering, Volume 93, September 15, 2024, 109814, ISSN 2352-7102, https://doiorg/101016/jjobe2024109814
Field Evaluation of the efficacy of passive radiative cooling infrastructure: A case study in Phoenix, Arizona.
Citation: Sailor, David J; Fagliarone, Gina; Hebrink, Tim; Amaripadath, Deepak Field evaluation of the efficacy of passive radiative cooling infrastructure: A case study in Phoenix, Arizona Building and Envrionment, October 24, 2024, 112226, ISSN 0360-1323, https://doiorg/101016/jbuildenv2024112226
Multi-criteria decision support framework for outdoor heat stress management in urban environments.
Citation: Amaripadath, D, A Molla, L Keith, and DJ Sailor Multi-criteria decision support framework for outdoor heat stress management in urban environments
Sustainable Cities and Society, Volume 14, November 1, 2024, 105799, ISSN 22106707, https://doiorg/101016/jscs2024105799
Coproducing Opportunities to Advance Extreme Heat Resilience in Southern Arizona.
Citation:
Roy, Malini, Ladd Keith, Mona Arora, Fatima Luna, and Julie Robertson
Coproducing Opportunities to Advance Extreme Heat Resilience in Southern Arizona Bulletin of the American Meteorological Society, 105 (11), E2070-E2077, (2024), https://doiorg/101175/BAMS-D-24-02161


How Phoenix is preparing for its next brutally hot summer
Extreme heat watch: Will cities be ready for summer 2024
Some mobile home owners aren’t allowed to install air conditioners. A proposed law could change that.
Local Experts Answer: Why Are People Still Moving to Phoenix?
This Earth Day Vestar’s GreenSTAR Program leads way in sustainability
Hot Weather brings Annual Housing Concerns to Arizona
Heat Awareness Week Press Conference
New federally funded center will rely on Uarizona expertise to help communities manage extreme heat
After a deadly heat wave last summer, metro Phoenix is changing tactics
Arizona has experience planning for extreme heat. New university partnership shares that knowledge.
Mobile home residents have a tougher time cooling house down
Community night at Desert Botanical Garden will be hosted by an ASU-led lab
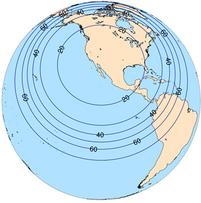
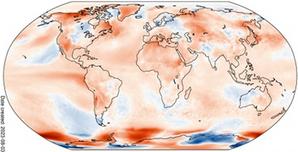
Computer modeling shows where Arizona’s winter precipitation originates
Learn what ASU lab is doing to help tackle Arizona’s extreme heat at June 22 event

Sensing heat: How scientists in Phoenix study summer’s deadliest invisible threat
Mobile weather labs map toll of extreme heat in scorching US cities
Unrelenting heat wave impacting 80 Million from California to South Florida
In U.S. Prisons and Jail, Exposure to Extreme Heat Is Increasing
We Mapped Heat in 3 U.S. Cities. Some Sidewalks Were Over 130 Degrees.
These California counties endured the nations’ longest streaks of excessive heat
Still Too Damn Hot - 2024 is Another One for the Record Books
Heat deaths of people without air conditioning, often in mobile homes, underscore energy inequity
Heat-Related Deaths Highlight Urgent Energy Inequity Crisis
Shade Will make or Break American Cities
The Hidden Ways Extreme Heat Impacts Infrastructure
Weatherwatch: Mobile weather vans sent to monitor heat in Arizona trailer parks
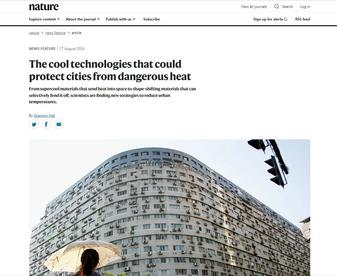
The cool technologies that could protect cities from dangerous heat
ASU Climate Scientists Say Accurate Temperature Readings are Critical
How hot does it get, really, in metro Phoenix? It depends, ASU heat researchers say
As Phoenix works to deal with record heat, this expert sees other cities using similar approaches
Is extreme heat an extreme disaster?
ARM Gears up for desert deployment in Arizona
Warming world, deadly problem; Heat related deaths are surging
The SW-IFL Advisory Board is composed of two groups: Stakeholder Advisory Group (SAG) and the Technical Advisory Group (TAG) Together they address both the process and technical aspects of the project Their goals are threefold:
To expand awareness of and trust in the research program among a broad community of stakeholders
To build consensus around how to responsibly navigate the development and deployment of the models, measurements, and technologies in testbeds
To serve as a resource to enable two-way learning between the research team and decisionmakers


Dr.


Collaboration partnerships are a key component of the SW-IFL project, and the team strives to create working relationships with various professional and community partners to further both the research and resulting resilient solutions


David Sailor, ASU Principal Investigator

Enrique Vivoni, ASU Observations Co-Lead
Patricia Solis, ASU Resilient Solutions Co-Lead


Matei Georgescu, ASU Modeling Co-Lead
Joshua Ryan New, ORNL Institutional Lead


Mukul Tewari, IBM Institutional Lead
CREST Evaluation Team
Emerson Weinbrecht, Research Analyst Assistant, ASU
Karen Gordon, Research Scientist, ASU
Jean Andino, ASU Deputy Director
Ted Schuur, NAU Observations Co-Lead
Ladd Keith, U of A Institutional Lead, Resilient Solutions Co-Lead
Kevin Gurney, NAU Institutional Lead, Modeling CoLead
Katia Lamer, BNL Institutional Lead

Wendy Barnard, ASU CREST Evaluation
Project Staff
Shannon Zweig, SW-IFL Project Manager, ASU
Kirsten Lake, SW-IFL Project Co-Ordinator, U of A Eli Martin, SW-IFL Field Technician, ASU

Jean Andino, ASU
Deepak Amaripadath , ASU
Aashish Aryal, ASU
Ashley Cadena, NAU
Kristina Currans, U of A
Edwin Davis, BNL
Stevan Earl, ASU
Aaron Flores, ASU
Matthew Fraser, ASU
Amanda Grant, U of A
Parag Joshi, BNL
Joseph Karanja, ASU
Katia Lamer, BNL
Chris Chaeha Lim, U of A
Amanda Lucero, U of A
Edward Luke, BNL
Eli Martin, ASU
Giuseppe Mascaro, ASU
Ariane Middel, ASU
Khayrun Nahar Mitu, ASU
Alamin Molla, ASU
Vernon Morris, ASU
Eli Perez-Ruiz, UACJ
Anthony Praino, IBM
Nidia Rojas-Robles, ASU
Helen Rowe, NAU
David Sailor, ASU
Ted Schuur, NAU
Daniel Waxman, BNL
Jennifer Vanos, ASU
Enrique Vivoni, ASU
Efrain Vizuete-Jaramillo, ASU
Jean Andino, ASU
Deepak Amaripadath , ASU
Ebenezer Boateng, ASU
Heidi Brown, U of A
Kristina Currans, U of A
Mary Munoz Encinas, ASU
Ian Estacio, U of A
Aaron Flores, ASU
Gregg Garfin, U of A
Matei Georgescu, ASU
Melissa Guardaro, ASU
David Hondula, ASU
Joseph Karanja, ASU
Kirstyn Kay, U of A
Mark Kear, U of A
Ladd Keith, U of A
Parker King, ASU
Kenneth Kokroko, U of A
Katia Lamer, BNL
Chris Chaeha Lim, U of A
Eli Martin, ASU
Alison Meadow, U of A
Sara Meerow, ASU
Alamin Molla, ASU
Lauren Quigley, IBM
Helen Rowe, NAU
Malini Roy, U of A Alekzander Ryan, U of A
David Sailor, ASU
Sina Sedaghat, ASU
Saeideh Sobhaninia, ASU
Patricia Solis, ASU
Philip Stoker, U of A
Lloyd Treinish, IBM
Lisa Townsend, U of A
Shaylynn Trego, ASU
Jennifer Vanos, ASU
Enrique Vivoni, ASU
Mary Wright, COP

Jean Andino, ASU
Mikhail Chester, ASU
Shovan Chowdhury, ORNL
Edwin Davis, BNL
Pawlok Dass, NAU
Xiangwen Deng, ASU
Melissa Dumas, ORNL
Lech Gawuc, NAU
Matei Georgescu, ASU
Kevin Gurney, NAU
Parag Joshi, BNL
Joseph Karanja, ASU
Anna Kato, NAU
Ladd Keith, U of A
Katia Lamer, BNL
Fengqi Li, ORNL
Alamin Molla, ASU
Mohamed Moustaoui, ASU
Joshua Ryan New, ORNL
Amy Palmer, IBM
Rabindra Pokhrel, ASU
Mattheus Porto, ASU
Anthony Praino, IBM
Lauren Quigley, IBM
Edwin Ramirez Aguilar, ASU
Sneha Roy, ASU
Pankaj Sadavarte, NAU
David Sailor, ASU
Ted Schuur, NAU
Avery Stubbings, ORNL
Huilin Sun, NAU
Ryan Swart, ASU
Mukul Tewari, IBM
Lloyd Treinish, IBM
Enrique Vivoni, ASU
Rob Wolfinbarger, ASU
Xuesong Zhou, ASU
*TeamLeads&Co-Leads
UofA:UniversityofArizona
University