

ASEAN STI ECOSYSTEM FORESIGHT 2035 AND BEYOND
ASEAN AHEAD
Embracing Change, Empowering Progress
ASEAN STI Ecosystem Foresight 2035 and Beyond
©Academy of Sciences Malaysia 2025
All Rights Reserved
No part of this publication may be reproduced, stored in a retrieval system, or transmitted in any form by any means, electronic, mechanical, photocopying, recording or otherwise without prior permission in writing from the Academy of Sciences Malaysia.
Academy of Sciences Malaysia
Level 20, West Wing, MATRADE Tower
Jalan Sultan Haji Ahmad Shah off Jalan Tuanku Abdul Halim
50480 Kuala Lumpur, Malaysia
www.akademisains.gov.my

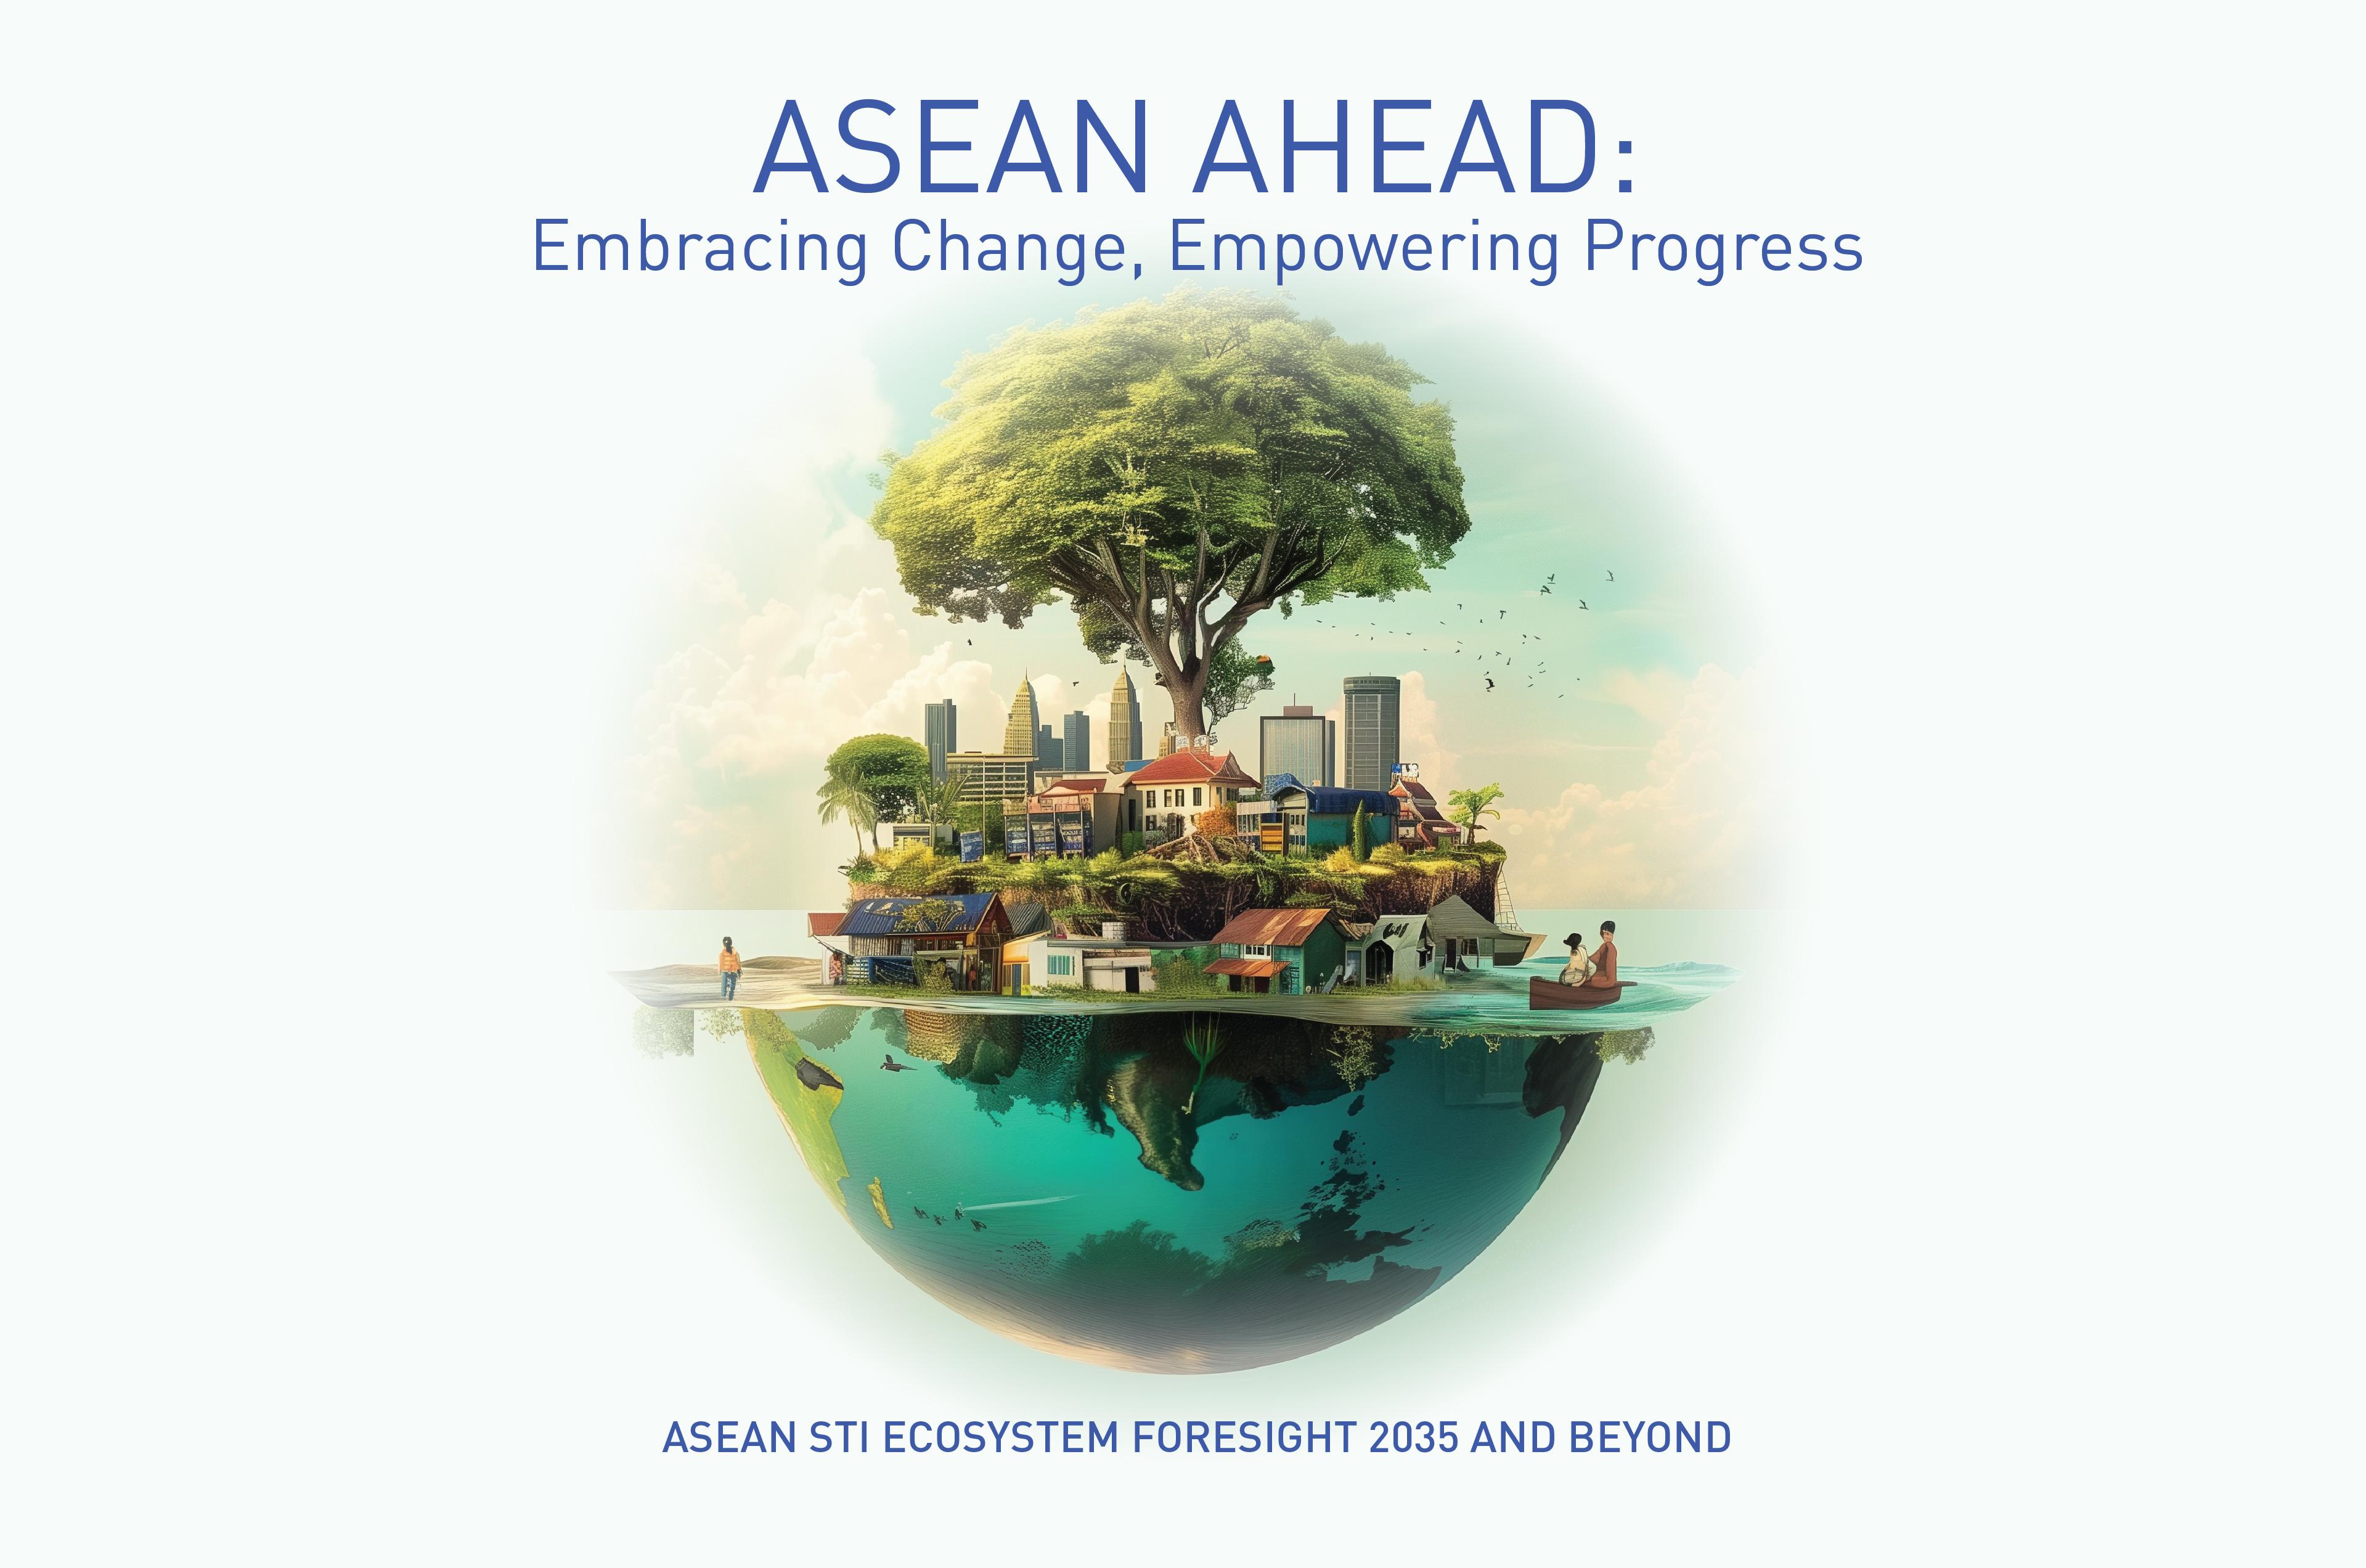
This artwork is an amalgam of ASEAN's aspirations, hopes, and roadmap. The artwork's composition centers on the balance between nature and development among ASEAN members. With nature as our inspiration and responsibility, we strive together as a region toward a better future ahead. With a strong foundation, hand-in-hand with all the ASEAN member states, a strong yet delicate relationship is symbolised by each country's national flower. The future can be attained with clear directions, as represented by icons of Forces of Change as background, creating a matrix of clear goals as catalyst.
Arif Rafhan Bin Othman (Superdoofus)
Visual Artist
1.1
2 Forewords | 8 Acknowledgement | 14 List of Figures,Tables & Appendices |
FORCES OF CHANGE: LEARNING FROM THE PAST| 29
2.1 Force of
2.8

Anwar Ibrahim Chair, ASEAN 2025 and Prime Minister of Malaysia
For decades, ASEAN has stood as a cornerstone of peace, stability, and shared prosperity. From a region of great diversity, we have grown into a dynamic and resilient community, united by our commitment to dialogue, cooperation, and mutual respect. As global realities shift, Malaysia remains confident in ASEAN’s capacity to adapt, lead, and seize new opportunities.
As Chair of ASEAN in 2025, Malaysia has chosen the theme Inclusivity and Sustainability. It reflects our conviction that growth must be equitable, innovation must be purposeful, and progress must leave no one behind. This spirit is embodied in the ASEAN Community Vision 2045, which marks a defining milestone in our collective journey as it pledges to place our people at the centre of regional progress.
Building on this Vision, the ASEAN Ahead: ASEAN Science, Technology, and Innovation (STI) Ecosystem Foresight 2035 and Beyond report presents a bold, foresight-driven agenda that positions ASEAN to harness science, technology, and innovation as engines of sustainable and inclusive growth. It calls for a missionoriented approach that mobilises collective strengths, harmonises standards and protocols, and deepens cooperation across borders.
To realise this aspiration, all ASEAN Member States must share ownership of this report. It is not merely a document of intent but a strategic call to action. We must align national priorities with regional ambitions, cultivate a culture of innovation, and invest in human capital, infrastructure, and governance that sustain long-term progress.
Let us move forward with unity of purpose, deepening partnerships through knowledge sharing, co-innovation, and capacity building. By transforming collective foresight into tangible action, ASEAN can unlock its full potential and secure its place as a global leader in inclusive, sustainable, and future-ready development.
Together, as One ASEAN, we can shape a region that is resilient, confident, and prepared for the challenges and opportunities of the decades ahead.
Dr Kao Kim Hourn
Secretary-General of ASEAN
ASEAN stands at a defining moment in its pursuit of an innovative and sustainable future. With a population approaching 700 million and a rapidly expanding digital economy, the region continues to serve as a dynamic hub for global investment, trade, tourism, and economic development. Yet this remarkable growth trajectory is built upon a foundation of continuous adaptation, strategic evolution, and transformation.
Throughout its history, ASEAN has demonstrated remarkable adaptability to global shifts, embracing new economic paradigms from the circular economy to the green economy, and now pioneering the blue and digital economies. This ongoing transformation reflects our commitment to fostering inclusive and forward-looking development that harmonizes economic progress with environmental stewardship, digital innovation, and social well-being.
To navigate this pivotal moment and chart our region’s future, I am pleased to present the ASEAN AHEAD: ASEAN STI Ecosystem Foresight 2035 Report, the culmination of months of intensive collaboration and strategic foresight. This landmark publication provides a comprehensive strategic outlook on ASEAN’s future trajectory, emphasizing the critical role of STI in driving sustainable economic growth and deeper regional integration. The insights and recommendations within this report have shaped the foundation of the ASEAN Plan of Action on Science, Technology and Innovation (APASTI) 2026-2035, positioning STI as a cornerstone for the region’s continued economic advancement.
The report identifies ten pivotal Forces of Change that will fundamentally reshape our societies and economies over the coming decade, including demographic transitions, technological disruptions, and governance reforms. These transformative forces highlight the urgent need for ASEAN to strengthen its STI capabilities and readiness, not merely to maintain competitiveness, but to future-proof our regional integration in an era of uncertainty. Notably, the report reveals that while ASEAN’s population will continue to increase, the growth rate has declined significantly from 2% to 1.1% today, signalling a demographic shift towards an aging society in the future, hence the strategic imperative to enhance productivity and uplift the well-being of our people before the region’s demographic dividend diminishes.

The scenarios explored in this report demonstrate that ASEAN’s transition to an innovation-driven future depends not solely on financial investment, but on embracing values-based governance that champions inclusivity, sustainability, and strategic long- term thinking. Therefore, the report serves as a call to action for governments, businesses, and research institutions, among others, to synergize their efforts in driving innovation, leveraging STI as key enablers to unlock new opportunities and foster deeper economic integration.
I extend my sincere appreciation to all contributors who made this initiative possible and encourage ASEAN’s policymakers, researchers, and all stakeholders invested in the region’s future to engage deeply with this comprehensive analysis as we work collectively to build a stronger, more resilient, and future-ready region.

Chang Lih Kang
Minister of Science, Technology and Innovation Malaysia
The Ministry of Science, Technology and Innovation (MOSTI) stands at the forefront of STI development in ASEAN, committed to driving regional progress through strategic policies, investment in research, and fostering innovation driven industries. As we navigate an era of rapid technological shifts, economic challenges, and environmental uncertainties, ASEAN must take collective action to embrace the change and build a resilient, future-ready region.
The ASEAN Ahead: ASEAN STI Ecosystem Foresight 2035 and Beyond report provides a vital roadmap for ASEAN’s STI ecosystem, charting the region’s trajectory towards 2035 and beyond. It examines key transformative forces known as global forces of change, presents four plausible future scenarios, and underscores the urgency of regional cooperation, strategic foresight, and innovation-driven policies to ensure sustainable growth and resilience.
To remain competitive in an evolving global landscape, ASEAN must proactively leverage STI as a catalyst for economic leadership, technological advancement, and social inclusivity. This report serves as both a call to action and a guide for policymakers, researchers, and industry leaders, ensuring that a prosperous, thriving, and resilient ASEAN in 2050 and beyond is well within our reach.
This report has received endorsement not only nationally at the National Science Council chaired by the Prime Minister of Malaysia, but also regionally from Sub-Committee on S&T Infrastructure and Resources Development (SCIRD), Committee on Science, Technology and Innovation (COSTI), and ASEAN Ministerial Meeting on Science, Technology and Innovation (AMMSTI), reflecting ASEAN’s collective commitment to advancing science, technology and innovation.
MOSTI remains committed to advancing research, technology and innovation as core drivers of national and regional economic growth. The ASEAN Ahead report presents the Triple-10 Framework, an evolution of the 10-10 Malaysia Science, Technology, Innovation, and Economy (MySTIE) Framework launched in 2020 alongside Malaysia’s National Policy on Science, Technology and Innovation (NPSTI) 2021-2030 which outlines a strategic vision for transforming Malaysia into a high-tech, innovation-driven nation, positioning STI at the core of sustainable development and economic growth.
I am proud that this report also served as the main reference document for the upcoming ASEAN Plan of Action on Science, Technology and Innovation (APASTI) 2026-2035, guiding the region’s strategic direction in building a resilient and forward-looking STI ecosystem in the next decade. Aligned with APASTI, this report provides strategic insights to strengthen regional STI ecosystems, fostering sustainable development, economic resilience, and regional integration. By enhancing collaboration among ASEAN Member States, the report underscores the transformative role of STI in shaping a competitive and future-ready ASEAN, ensuring the region remains adaptive and responsive to global shifts and emerging opportunities.
I commend the Academy of Sciences Malaysia (ASM), ASEAN Foresight Alliance, focal points of ASEAN and all contributors for their dedication to this report. Together, with the guidance of this report, ASEAN as a community will be able to take collective action to drive economic growth through innovation, foster social progress with inclusivity and empowerment, and lead sustainability efforts in shaping ASEAN towards becoming a global powerhouse.
Mohd Azzman Sharifadeen FASc President, Academy of Sciences Malaysia & STI Advisor to the Prime Minister and the Nation

The ASEAN Foresight Alliance (AFA) was formed in 2019 to nurture a culture of proactive planning through foresight and futures studies among ASEAN member states. The Academy of Sciences Malaysia (ASM) is honoured and privileged to lead the development of the first-ever ASEAN-wide foresight study. The resulting report, ASEAN Ahead: ASEAN STI Ecosystem Foresight 2035 and Beyond, to be launched during Malaysia’s chairmanship, is a true reflection of the ASEAN spirit of inclusive and active participatory collaboration.
This report is indeed timely given that the world is undergoing a paradigm shift. Anomalies are building up that cannot be reconciled, creating heightened uncertainty, characterised by chaos, complexity, and contradictions. Futurists call this era the post-normal times. Norms that were once widely adopted are decaying in value and relevance. They need to be re-examined and replaced by new norms that reflect emerging realities. Technological advancements, economic competition, and geo-political shifts are some of the powerful forces of change that are rapidly converging to create instability and disruption.
Science, technology and innovation (STI) rises in prominence as a primary force of change due to its disruptive influence. Systemic links with the economy and other factors of change will give rise to enabling governance systems that can accelerate growth while safeguarding the natural environment. It is thus essential for ASEAN as a region to strengthen its STI ecosystem in order to navigate the increasingly complex world and thereby secure a sustainable and prosperous future.
The foresight report outlines four plausible scenarios. Proper appreciation and understanding of these future possibilities is vital. A scenario of ASEAN as a region of collective prosperity, characterised by a robust and well-functioning STI ecosystem, and an ASEAN community that is cooperative, coherent and cohesive can become a reality if the necessary factors are put in place. Achieving this scenario necessitates a paradigm shift in mindset, strategies and approaches. ASEAN as a community must embrace an out-of-the-box mindset to remain competitive and resilient. Adoption of the integrated framework proposed in this report will enable the region to be better positioned to advance economically, socially and politically, ultimately elevating ASEAN to become a global powerhouse.
At the core of this foresight study is the Triple-10 ASEAN STI Framework, which builds upon Malaysia’s 10-10 MySTIE Framework which was introduced in 2020. The original framework facilitates alignment of ten national socio-economic drivers with ten science and technology drivers to enable the development of high-impact STI initiatives that advance national progress. On the other hand, the enhanced Triple-10 Framework introduces a third dimension that incorporates ten global drivers shaping ASEAN’s trajectory in the global innovation landscape. The Triple-10 framework shows how STI interacts with the economy, generating positive spillovers to drive wealth creation. These interactions affect, and are affected by, the forces of change to facilitate production of desired outcomes.
By working interdependently as a region, ASEAN member states can complement each other and leverage on each other’s strengths to achieve specific national objectives. In navigating through the complex challenges ahead, ASEAN member states need to proactively future-proof themselves. This will permit them to assert their sovereignty and secure their proper positions in the global community. Working together to address common challenges through mission-oriented research and development will further empower the ASEAN community. The ASEAN Ahead report provides a strategic framework to position the region as a global powerhouse, ensuring that we are not only reacting to change but proactively shaping it.
As ASM commemorates its 30th anniversary in 2025, it is very meaningful to all our fellows and partners that the ASEAN Ahead report will be launched in conjunction with Malaysia’s ASEAN Chairmanship this year. I am honoured that ASM as a national STI think tank has been able to make this regional contribution towards building an inclusive, knowledge-driven and futureready society. I extend my deepest appreciation to all contributors in producing this report. Their hard work and dedication will help to forge a prosperous, thriving, and resilient ASEAN in 2035 and beyond.

The ASEAN Foresight Alliance (AFA) was created in 2019 to establish a foundation of foresight expertise in the region. This groundwork then allows ASEAN members to use foresight analysis to strategically plan for future collaboration. Under the AFA banner, the ASM led the development of the ASEAN Ahead: ASEAN Science, Technology, and Innovation Ecosystem Foresight 2035 and Beyond, a deep exploration of global megatrends and their implications for the region. At its core lies a powerful message: ASEAN nations must come together to navigate these changes, not just individually, but as a unified community working toward shared progress.
Academician Professor Emerita Tan Sri Dato’ Seri Dr Mazlan Othman FASc Founding Chairperson of the ASEAN Foresight Alliance
ASEAN has the potential to become a formidable global economic powerhouse by pursuing an integrated and collective strategy that leverages on its abundant natural resources, diverse talent base, and strategic geopolitical position within one of the world’s most dynamic regions. Realising this potential requires sustained investment in science, technology, innovation, and economic (STIE) ecosystems that foster nature-based innovations, advance values-driven industries, create highincome employment opportunities, and promote inclusive growth—delivering greater Return on Values (ROV) for all stakeholders across the region.
Professor Dr Mahendhiran Sanggaran Nair FASc & FCPA (Australia)
Chairperson of ASEAN Ahead: ASEAN STI Ecosystem Foresight 2035 and Beyond Study

Board of Advisors (BoA), ASEAN Foresight Alliance (AFA)
Academician Professor Emeritus Rhodora V. Azanza (Philippines)
Chairperson
Rina DP Hj Sidek (Brunei)
Dr Hul Seinheng (Cambodia)
Khairul Rizal (Indonesia)
Dr Sengphet Keokangdong (Laos)
Academician Professor Emerita
Tan Sri Dato’ Sri Dr Mazlan Othman FASc (Malaysia)
Dr Than Than Htike (Myanmar)
Diana Adnan (Singapore)
Dr Chaiyatorn Limapornvanich (Thailand)
Dr Bach Tan Sinh (Vietnam)
Academician Professor Emerita
Tan Sri Dato’ Sri Dr Mazlan Othman FASc Chairperson
Dr Kartini Rahman (Brunei)
Cheng Kimhaung (Cambodia)
Dedy Saputra (Indonesia)
Dr Sengphet Keokangdong (Laos)
Noratiqah Ahmad
Sharifah Hafizah Syed Ab Aziz (Malaysia)
Dr Min Thaw Tun (Myanmar)
Professor Dr Michael Angelo B. Promentilla (Philippines)
Wang Tianyi (Singapore)
Dr Kampanart Silva (Thailand)
Cao Thi Thu Anh (Vietnam)
ASEAN Ahead: ASEAN STI Ecosystem Foresight 2035 and Beyond
Study Team
Professor Dr Mahendhiran Sanggaran Nair FASc & FCPA (Australia)
Chairperson
Working Group Members
Professor Pervaiz K. Ahmed
Director, Institute for Global Strategy and Competitiveness (IGSC), Sunway University
Professor Santha Vaithilingam
Deputy Director, Institute for Global Strategy and Competitiveness (IGSC), Sunway University
Academy of Sciences Malaysia
Management
Hazami Habib Chief Executive Officer
Nitia Samuel Chief Strategy Officer
Dharshene Rajayah
Chief, International Affairs & Communications
Nina Azrah Razali
Nasiha Syahirah Omar
Noratiqah Ahmad
Ts Jagdish Kaur Chahil
Teng Yu He
Khairunnisa Kadaruddin
Nurul Rahimah Abu Bakar
Hayatun Syamilah Mohammad Jasni
Wan Nur Izzah Alissa Wan Rosli
Anissa Azlan
Nurul Kamilah Kamarul Hatta
Nur Amirah Sofea Saiful Anuar
Abdul Rahim Ismail
Anuar Ahmad
Institute for Global Strategy and Competitiveness, Sunway University
Dr Teow Hui Hui
Dhiviya Gopal Balakrishnan
Naina Afifi Rosly
Mohd Najmie Mohd Yusoff
Najib Mohd Idris
Ilham Syazwani Razman
Nazmi Lao
Syakirah Nurizzati Mohamad Hood
Fig 1.1.1 Emerging Uncertainty Complex
Fig 1.2.1 Timeline of Major ASEAN Initiatives from 1967-2025
Fig 1.3.1 The 4F Framework, Comprising Four Key Steps
Fig 1.4.1 ASEAN Triple-10 STIE Framework
Fig 2.1.1 Number of Population in ASEAN, 2004-2024
Fig 2.1.2 Population by Age in ASEAN, 2024
Fig 2.1.3 Life Expectancy in AMS from 1990-2023
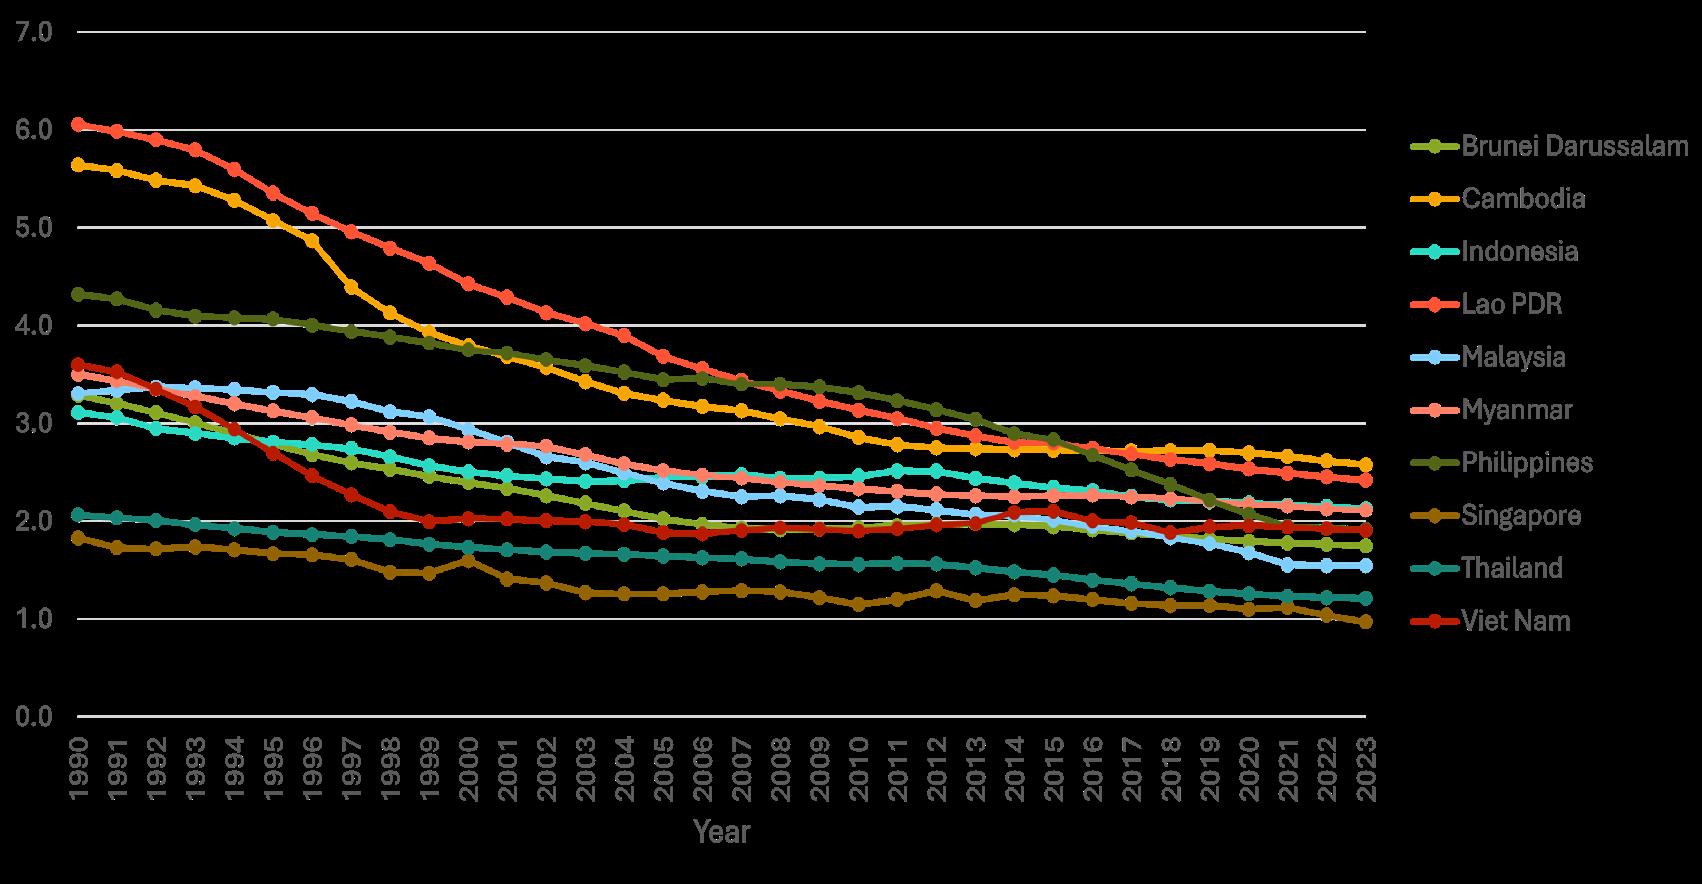
Fig 2.1.4 Fertility Rate, Total (births per woman) in AMS from 1990-2023
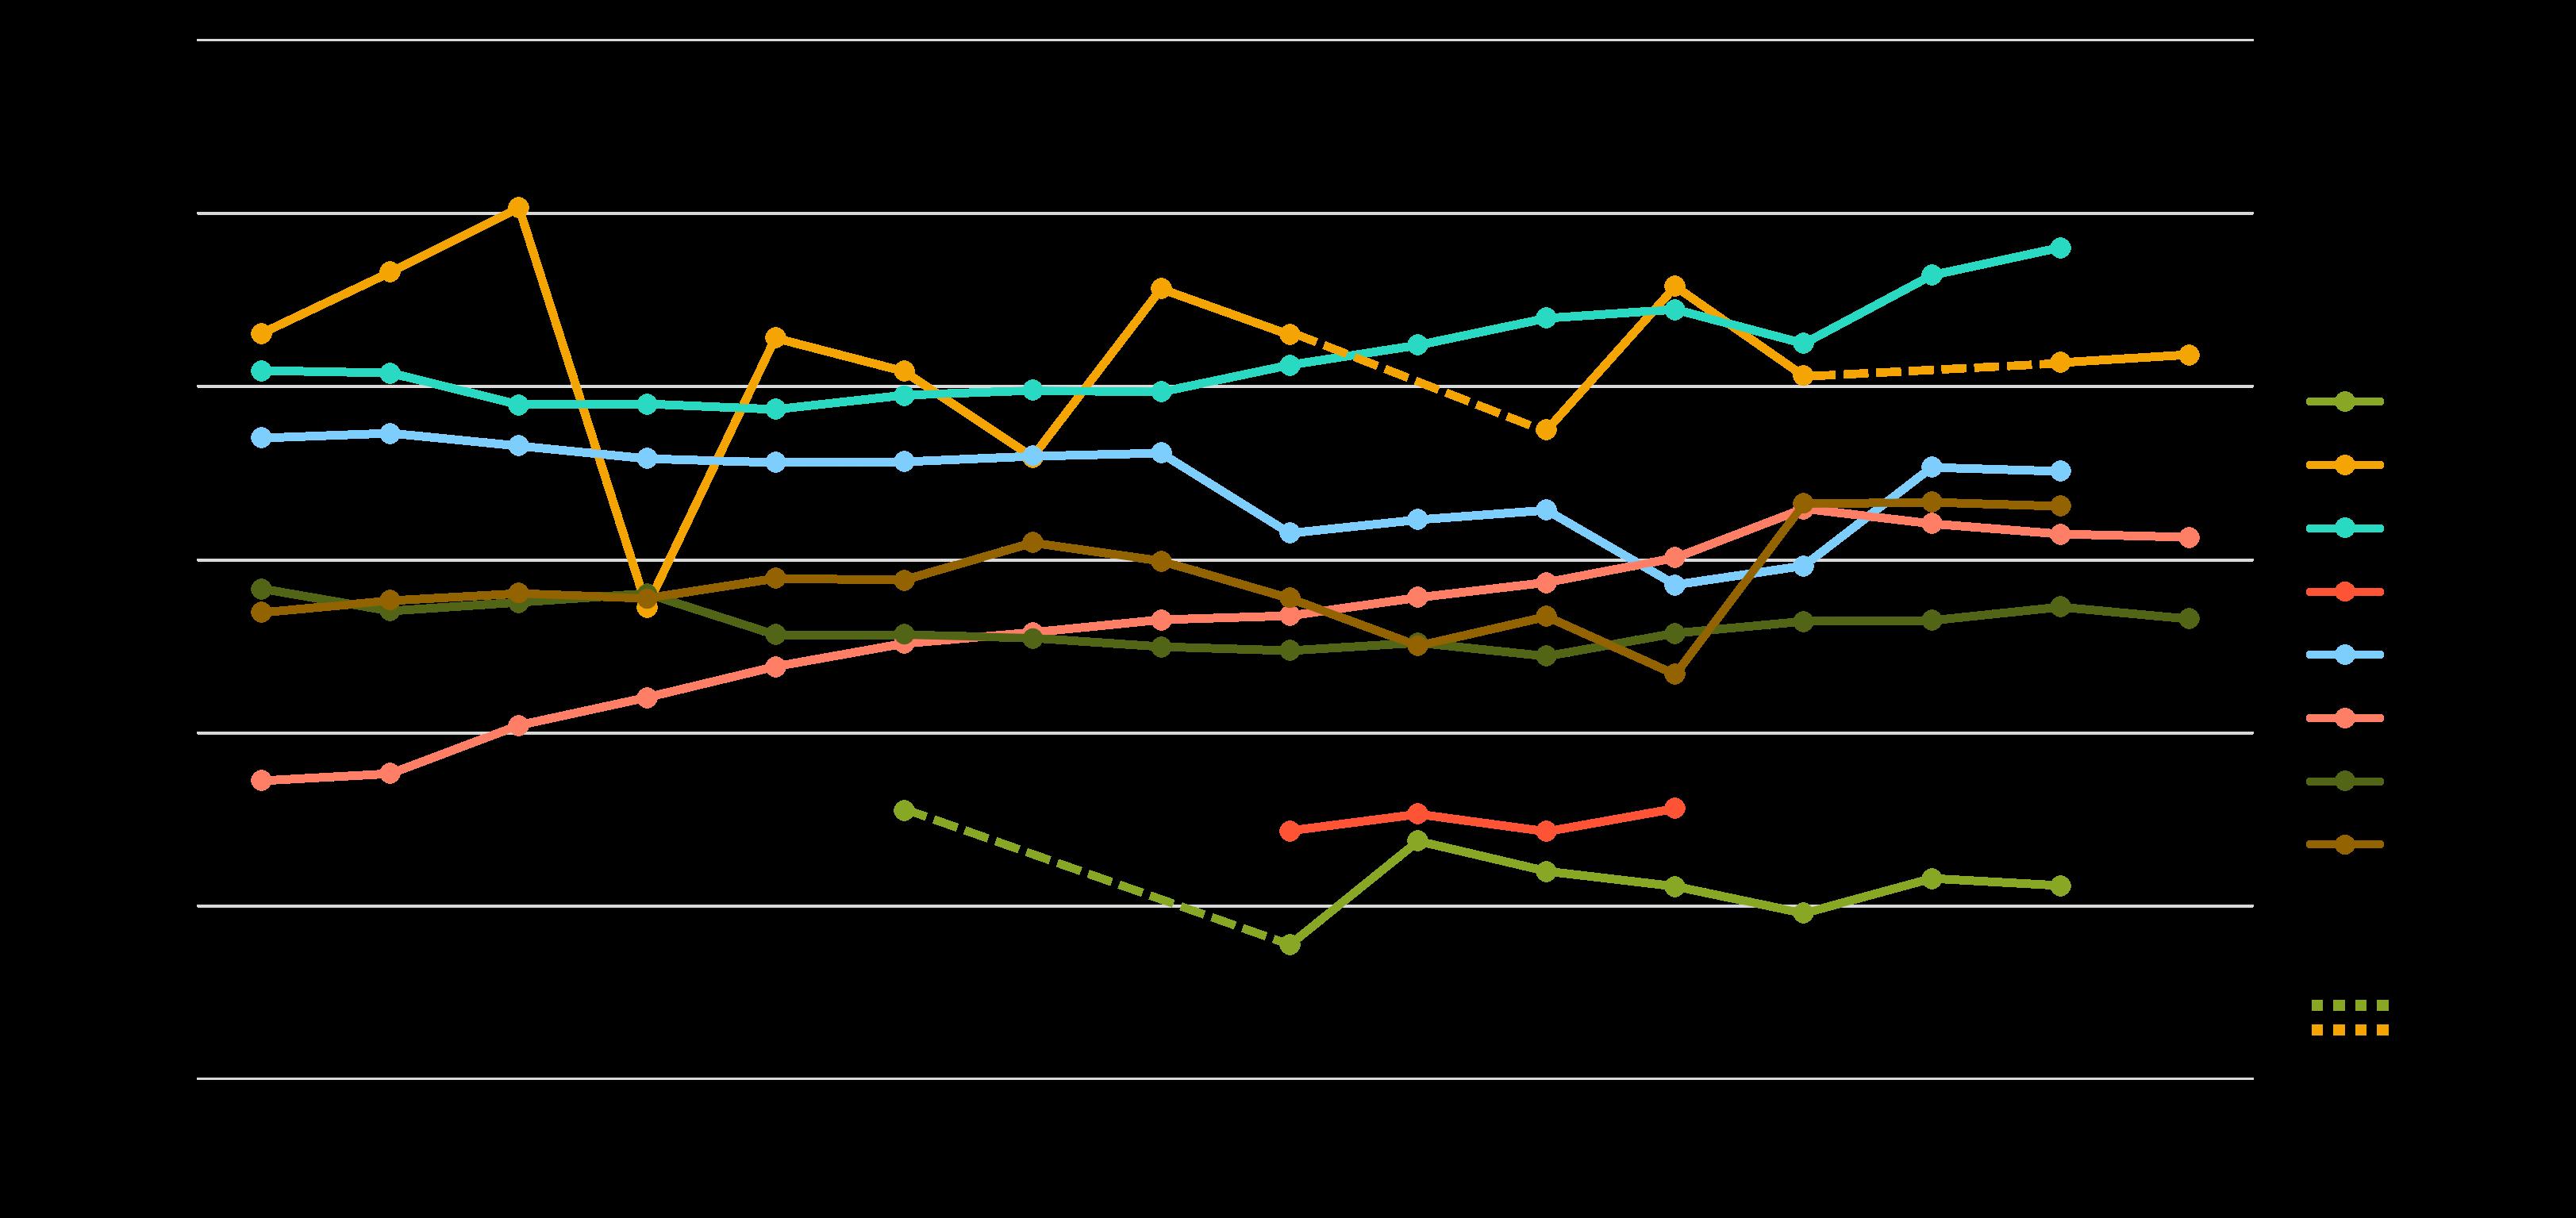
Fig 2.1.5 Percentage of Employment for Elderly Populations (65+ years old)
Fig 2.1.6 Out-of-Pocket Expenditure (% of current health expenditure) from 2000-2022
Fig 2.1.7 Youth Development Index Domain Score Across 10 AMS
Fig 2.2.1 Dengue Cases Comparison in AMS 2018-2020
Fig 2.2.2 Incidence of Tuberculosis (per 100,000 people), 2015-2023
Fig 2.2.3 Immunisation, DPT (% of children ages below 2 years) in the ASEAN region, 2015-2023
Fig 2.2.4 Prevalence of Undernutrition in AMS, 2015-2022
Fig 2.2.5 Prevalence of Moderate to Severe Food Insecurity in the Population (%) in ASEAN
Fig 2.2.6 National Capacities to Control Non-Communicable Diseases in ASEAN in 2022
Fig 2.4.1 Dietary Compositions by Commodity Group and Country, 1990-2022
Fig 2.4.3 Proportion of Population using Safely Managed Drinking Water and Sanitation Services in ASEAN, 2016-2022
Fig 2.5.1 ASEAN Power Grid
Fig 2.5.2 ASEAN Natural Gas Trade Movement in 2023
Fig 2.7.1 Consumer Sentiment on the Importance of Sustainability Versus Two Years ago
Fig 2.7.2 Change in Household Income Profiles Across Developed and Emerging ASEAN
Fig 2.8.1 PISA Performance of Selected AMS in 2022
Fig 2.8.2 Innovation in ASEAN and China
Fig 2.9.1 The Percentile Rank of Government Effectiveness in AMS from 1996-2023
Fig 2.9.2 CPI’s Perceived Levels of Public Sector Corruption
Fig 2.9.3 Percentile Rank of the Political Stability and Absence of Violence/Terrorism
Fig 2.9.4 Percentile Rank of the Voice and Accountability in AMS from 1996-2023
Fig 2.9.5 Freedom and Prosperity Index scores for AMS (except Brunei), 2024
Fig 2.10.1 Population Living Below the National Poverty Levels (%) in ASEAN
Fig 2.10.2 Income Inequality (Gini Coefficent) in ASEAN
Fig 2.10.3 Number of Individuals Using Internet per 100 Persons by AMS, 2019 & 2023
Fig 2.10.4 Infrastructure Spending as a Percentage of GDP in Selected Countries
Fig 2.10.5 Gender Parity Index (GPI) Gross Enrolment Rate in Primary Education by AMS, 2023
Fig 2.10.6 Labour Force Participation Rates (%) by Gender in AMS, 2023
Fig 3.1.1 ASEAN’s Future Scenarios
Fig 3.6.1 ASEAN as a Global Powerhouse
Fig 4.1.1 The 8i STIE Ecosystem Framework
Fig 4.2.1 ASEAN STIE Ecosystem
Fig 4.3.1 The 8i Ecosystem Analysis of the Whole-of-ASEAN
Fig 5.1.1 Current Status Position within the Four Scenarios
Fig 5.1.2 The Entrenchment of a Scenario Through Actions and Investments Over Time
Fig 5.1.3 The Misplaced Confidence to Spiralling out of Control Dynamic
Fig 5.1.4 The Have and Have-Not to Spiralling out of Control Dynamic
Fig 5.1.5 The Misplaced Confidence, Have and Have-Not to Spiralling out of Control Dynamic
Fig 5.1.6 The Have and Have-Not to Collective Prosperity Dynamic
Fig 5.1.7 The Misplaced Confidence to Collective Prosperity Dynamic
Fig 5.1.8a Spiralling out of Control as End-Point
Fig 5.1.8b Collective Prosperity as an End-Point
Fig 5.1.9 Scenario Likelihoods
Fig 5.2.1 Window of Opportunity for the Switch to Collective Prosperity Scenario
Fig 5.2.2 Four Key Paradigm Shifts
Fig 6.1.1 Learning Points from the Four Quadrants of Future Scenarios
Fig 6.2.1 The 8i STIE Ecosystem and Scenario Trajectories
Fig 6.2.2 The 8i STIE Ecosystem and 8R Values-based Philosophy for Collective Prosperity Scenario
Fig 6.2.3 8R Values-based Philosophy
Fig 6.2.4a Current ASEAN STIE Dynamics with Global Regional Groupings
Fig 6.2.4b ASEAN Triple 10 Dynamics
Fig 6.2.4c Network Competition of Regional Blocs
Fig 6.2.5 Iterative Foresight Cascade Model
Table 2.1.1 Causes of Urbanisation Across AMS
Table 2.3.1 PM2.5 Concentrations by AMS in 2024
Table 2.3.2 CO₂ Emission by AMS, 2023 (in million metric tons)
Table 2.4.2 Score Detail of ASEAN’s Food Resource Availability Indicator
Table 2.5.1 Overview of AMS Targets on Energy Sustainability
Table 2.5.2 Commitment of AMS towards Net Zero and NDC Targets in Mitigating GHG Emissions
Table 2.8.1 Education and Training Indicators and Funding for AMS
Table 2.8.2 Workforce Indicators of AMS
Table 3.2.1 ASEAN’s Regional Division Consequences
Table 3.4.1 The Collapse of Natural Ecosystems
Table 3.4.2 The Impact of Natural Ecosystem Collapse on Socioeconomic Systems
Table 3.5.1 Supporting Factors of B-G Consumer-driven Shift
Appendix 1 Blue Carbon Conservation through Restoration of Mangrove Swamps
Appendix 2 Singapore's One Million Trees Movement
Appendix 3 Restoring Raja Ampat's Seagrass Ecosystems
Appendix 4 Driving Change: Hydrogen-Powered Sustainability for Future Mobility
Appendix 5 Pioneering Advanced Building Materials for Sustainable Urban Living
Appendix 6 A Deep Dive into Bioenergy with Carbon Capture and Storage Solutions
Appendix 7 Tackling the Plastic Waste Challenge
Appendix 8 Shaping the Future of Sustainable Agriculture via Technology
Appendix 9 Embracing Circular Economy in the Mining Industry
Appendix 10 Lao PDR's Sustainable Tourism Industry
Appendix 11 Nourishing the Future: Advancing Food Security in ASEAN
Appendix 12 8i Ecosystem Analysis
Over the past decades, the world has experienced many gains in terms of human development and economic wealth. The advancement of STI has propelled the global economy forward. Substantial progress has been made in many aspects – most people live longer and healthier compared to the past, society at large is more educated, cultured, and informed. Infrastructures have also improved.
The world has shown marked progress shaped by renewed diplomatic alliances, robust economic partnerships, and communications. In the last 20 years, institutional change has had people’s participation at its core. Democratic transition in many developing countries, the collapse of socialist regimes, decentralisation efforts, and the rise of a free market powered by globalisation are all part of the historical process that led to this transformation (UNDP, 1993).
On the flip side, these advancements have also contributed to inequality within and across countries, increasing vulnerabilities, especially during periods of economic regression. The 21st century has seen the emergence of new dynamics and challenges in the form of deglobalisation, modern-day territorial disputes, calls for trade regionalisation, social tensions, and disparities. Adding to this, the discovery of the World Wide Web decades ago has created a borderless world of sharing information and communication, but at the same time has raised privacy and security questions. Geopolitical challenges, economic volatility, societal divisions, and environmental damage have become particularly acute in the last decades. We now live in turbulence, which has become the new normal.
In recent times, the world has faced an uncertain, economic outlook and macroeconomic fragilities triggered by COVID-19 and the Russia-Ukraine war. Two decades ago, the likelihood of fiscal imbalances, asset price collapse, oil price shock and income disparity topped the list of global risks (WEF, 2020). However, over the last decade, the risks have diversified. Geopolitical threats such as involuntary migration and interstate conflicts have intensified. Environmental-related challenges such as extreme weather events, natural disasters, and biodiversity loss exacerbated by poor climate action are emerging as the major risks (WEF, 2020). These risks interlink to create an uncertainty mesh that impacts and shapes the lives of people around the globe. The world faces a precarious future as the complex and uncertain milieu unfolds.
The UNDP Human Development Report 2021/22 highlights intertwined layers of uncertainty: the destabilised planetary systems of the Anthropocene, the pursuit of sweeping societal transformations to ease planetary pressures, and widespread intensifying polarisation (UNDP, 2022).
The confluence of risks and uncertainties, such as the health pandemic, climate change, war, and conflicts, has exposed global vulnerabilities, including in Southeast Asia. This has made the task of navigating the future increasingly difficult, and, at the same time, critical.


The pursuit of sweeping societal transformations Dangerous planetary change of the Anthropocene


Widespread, intensifying polarisation
In 1967, the Association of Southeast Asian Nations, or ASEAN, was established by five founding nations: Indonesia, Malaysia, Philippines, Singapore, and Thailand. This intergovernmental organisation welcomed its sixth member, Brunei Darussalam in 1984, followed by Vietnam in 1995, Lao Public’s Democratic Republic (PDR) and Myanmar in 1997, and Cambodia as the tenth member in 1999. The signed document known as the ASEAN Declaration draws upon the spirit of cooperation in the economic, social, cultural, technical, educational and other fields to accelerate economic growth, social progress, and cultural development. As a bloc, ASEAN aims to strengthen its foundation through active collaboration in matters of common interest and promote regional peace, stability, and prosperity by adhering to the rule of law and the principles of the United Nations Charter.
With a population of more than 660 million, the nations of the region are deeply rooted in history and culture. The richness of its languages, ethnicities, and societal values, along with its ecological diversity, positions it as one of the most unique in the world. Over almost six decades since its establishment, ASEAN has notched up many notable successes and has become one of the fastest-growing regions in the world. ASEAN economies have performed well over the last decades with annual GDP per capita growth exceeding the average growth rates of East Asia and the Pacific (ASEAN, 2021). The incidence of poverty has fallen while household income has been rising.
Despite the many successes, the ASEAN region continues to face significant challenges, being the region most vulnerable to climate change, food insecurity, and rapidly increasing inequality among the population (WEF & ADB, 2017). Like many predecessor cases of development, economic prosperity, unfortunately, has been largely built at the expense of the environment. Changing demographics, geopolitical shifts, technological disruptions, and the planetary consequences of unfettered exploitation are posing new questions about the nature of regional development. Faced with these questions, ASEAN needs to be prepared, and prepared well; it is, as of this time, at a critical juncture where each action or inaction will define the shape of the region’s future.
One of the aims of the ASEAN Economic Community is to create a competitive, innovative and dynamic community which fosters robust productivity growth through the creation and practical application of knowledge, innovation policies, sciencebased approaches, technology development and participation in global value chains. It is timely for ASEAN to unite under its One Vision, One Identity, One Community banner to address challenges and widening gaps. ASEAN’s global commitments, pledges, and goals will need to be met to keep the region on track in its progress towards stronger growth. Navigating the future for ASEAN will be challenging as success will depend on exploring and identifying future pathways and understanding how to navigate them effectively. This requires the conduct of a mission-focused foresight exercise.

1967
1970
1971
Founding of the Association of Southeast Asian Nations or ASEAN (Bangkok Declaration)
The Five Power DefenseDefence Arrangement signed by Malaysia, Singapore, Australia, New Zealand, and Great Britain for mutual military cooperation
The declaration of the Zone of Peace, Freedom and Neutrality (ZOPFAN) was signed by the Foreign Ministers of Indonesia, Malaysia, the Philippines, Singapore and Thailand
1974 Australia became ASEAN's first Dialogue Partner.
1975 New Zealand became ASEAN’s Dialogue Partner
1976
Treaty of Amity and Cooperation in Southeast Asia (TAC)
Declaration of ASEAN Concord
Agreement on ASEAN Preferential Trading Arrangements (PTA)
United States became ASEAN’s Dialogue Partner
1977
Canada became ASEAN’s Dialogue Partner
European Union became ASEAN’s Dialogue Partner
Japan became ASEAN’s Dialogue Partner
The establishment of ASEAN Ministerial Meeting on Science, Technology and Innovation (AMMSTI)
ASEAN Committee on Science and Technology (COST)
1978
Development of the first ASEAN Plan of Action in Science and Technology
United States became ASEAN’s Dialogue Partner
Agreement on ASEAN Food Security Reserve was signed in New York
1997
ASEAN Vision 2020
Lao PDR and Myanmar join ASEAN Establishment of the ASEAN Foundation
Regional Haze Action Plan (RHAP)
Asian Financial Crisis severely affected several AMS Launch of ASEAN Power Grid
1998 Hanoi Plan of Action (HPA) ASEAN Investment Area (AIA) Framework Agreement Implementation
1999
2001
2002
Cambodia joins ASEAN as the tenth member Establishment of Cambodia-Laos-Vietnam Growth Triangle (CLV-GT)
Hanoi Declaration on Narrowing the Development Gap for Closer
ASEAN Integration adopted
Adoption of the ASEAN Tourism Agreement (ATA)
ASEAN Agreement on Transboundary Haze Pollution was signed in Kuala Lumpur
ASEAN-China Framework Agreement on Comprehensive Economic Cooperation (ACFTA) was signed in Phnom Penh
ASEAN–India Framework Agreement on Comprehensive Economic Cooperation
2003
1979
ASEAN takes united diplomatic stand against Vietnam’s invasion of Cambodia (Kampuchean Crisis)
1984 Brunei becomes the sixth member of ASEAN
1985
ASEAN Agreement on The Conservation of Nature and Natural Resources was signed
1986 Agreement on ASEAN Energy Cooperation was signed in the Philippines
1987 Adoption of the Manila Declaration of 1987
1991 Republic of Korea became ASEAN’s Dialogue Partner
ASEAN Free Trade Area (AFTA) Agreement was signed in Singapore
1992
Framework Agreement on Enhancing ASEAN Economic Cooperation
Declaration on the Conduct of Parties in the South China Sea
1993 Launch of the CEPT Scheme for AFTA
1995
1996
Vietnam becomes the seventh member of ASEAN
ASEAN Framework Agreement on Services (AFAS)
India became ASEAN’s Dialogue Partner
ASEAN Protocol on Enhanced Dispute Settlement
China became ASEAN’s Dialogue Partner
Russia became ASEAN’s Dialogue Partner
2004
Severe Acute Respiratory Syndrome (SARS) outbreak reported in Asia and spillover to ASEAN
Declaration of ASEAN Concord II (Bali Concord II)
Indian Ocean earthquake and tsunami had severe impacts on several AMS
ASEAN Framework Agreement for the Integration of Priority Sectors
2005 ASEAN Agreement on Disaster Management and Emergency Response (AADMER)
2006
2012 ASEAN Human Rights Declaration (AHRD) adopted in Cambodia Launch of the ASEAN Institute for Peace and Reconciliation (AIPR)
2015 ASEAN Community Vision 2025 and Blueprints 2025
2016 Launch of Master Plan on ASEAN Connectivity (MPAC) 2025 in Lao PDR
2017 ASEAN–Hong Kong, China Free Trade Agreement (AHKFTA) signed in the Philippines
2018 Launch of ASEAN Smart Cities Network (ASCN) in Singapore Adoption of ASEAN Digital Integration Framework
2019 ASEAN Agreement on E-Commerce
2020 COVID-19 global health pandemic impact AMS
Adoption of ASEAN Comprehensive Recovery Framework (ACRF)
Signing of the Regional Comprehensive Economic Partnership (RCEP) Agreement
2021 ASEAN Green Initiative (AGI)
United Kingdom became ASEAN’s Dialogue Partner
2022 Conflicts in Ukraine impacts supply chain in ASEAN
2023 ASEAN Integrated QR Code Payment System
ASEAN Power Grid Advancement Programme (APG-AP)
First Participation of Timor Leste in ASEAN Summit as an observer
2024 IEA Regional Cooperation Centre established in Singapore to support ASEAN Power Grid vision
Endorsement of ASEAN Guide on AI Governance and Ethics
2025 US Tariff on several AMS
Launch of ASEAN Community Vision 2045
ASEAN Co-Production Roundtable and the ASEAN Green Filming and Sustainability Framework
ASEAN–Republic of Korea (ROK) Trade in Goods Agreement signed in Kuala Lumpur
Cebu Declaration on the Protection and Promotion of the Rights of Migrant Workers in the Philippines
2007
ASEAN Declaration on Environmental Sustainability signed in Singapore
ASEAN–China Free Trade Area (ACFTA) Trade in Services
Agreement signed in the Philippines
ASEAN Charter Drafting Committee Established
ASEAN-China Investment Agreement
Establishment of the ASEAN Intergovernmental Commission on Human Rights (AICHR)
2009
ASEAN Trade in Goods Agreement (ATIGA)
ASEAN–Australia –New Zealand Free Trade Area (AANZFTA) signed in Thailand
2010 Adoption of the Master Plan on ASEAN Connectivity (MPAC 2010)
2011 Launch of ASEAN Coordinating Centre for Humanitarian Assistance on Disaster Management (AHA Centre)
Launch of Youth Story Labs to promote inclusive and forwardthinking narratives among the ASEAN youth.
*The list above captures major initiatives in ASEAN from 1967-2025 and is non-exhaustive
As ASEAN looks to the future, maintaining a “business as usual” approach is unlikely to equip it for the increasing uncertainty ahead. ASEAN and its member states need to be prepared for a variety of eventualities that may gradually or suddenly come about as a consequence of shocks arising out of the global or regional environment. Despite the ambiguities and volatility in the environment, one thing is clear; in order to move forward and progress positively, the region needs to find ways to adopt and leverage STI. How a positive future for ASEAN may come about requires a foresight exercise in which an understanding of the historical context and emerging forces of change are used to explore future options.
This ASEAN AHEAD: ASEAN STI Ecosystem Foresight 2035 and Beyond report presents a forwardlooking and multi-disciplinary perspective on ASEAN’s capacity to navigate the future. The report is based on an approach in which key forces of change (FOCs), sometimes referred to as megatrends, are identified, and their potential impact and influence on ASEAN and its member states are evaluated. The foresight exercise adopts an ecosystem lens and focuses on the role of science, technology, innovation and economy (STIE) in shaping future outcomes for ASEAN.
This report explores the STIE outlook for ASEAN and identifies pathways to enable a resilient, vibrant, inclusive and sustainable ASEAN community. It discusses how existing and emerging STIE can be utilised to enable transformation in tackling complex challenges the region faces. ASEAN ecosystems are explored and evaluated through the development of four plausible future scenarios. In doing so, the foresight exercise is able to assess opportunities and threats predicated on ASEAN’s STIE capacity and competency over the long horizon. This report also highlights pathways to the way forward in light of the scenarios, their interaction, and their evolutionary dynamics.
The execution of the foresight exercise for this study is based on the 4F Foresight framework. The 4F framework is a holistic and comprehensive framework that captures the core activities for a foresight exercise (Ahmed, Nair, Vaithilingam and Teow, 2024). The four elements of the framework involve the conduct of forensics, forecasting, future-sighting and futureproofing. Although drawn as a figure (see Figure 1.3.1), the elements on the surface look to be sequential; they are, in fact, iterative, and have feedback loops into one another until the foresight exercise is completed.
Define how to reach chosen plausible future(s) 1.4
Identify what has been and is happening
Evaluate unfolding trajectories and their probable impacts
Identify the range of Possible Futures and their impacts
The foresight exercise followed the key steps of the 4F Foresight framework. In brief, these steps are as set out below.
Collection of contextually relevant data and evidence to put together a detailed picture of the context under study.
Extrapolation of trends and potential impacts based on historical trends and non-historical creative inputs and considerations.
Insights from Forensics and Forecasting steps are used as input to develop possible future pathways and scenarios.
Future possibilities, as encapsulated in scenario options, are evaluated and assessed to define pathways that avoid pitfalls and negative trajectories of future development and actions, and pathways to navigate towards desired futures identified.
The exercise started by conducting the Forensics and Forecasting steps. Within these two highly iterative first steps, the key forces of change for the ASEAN context were first identified. Following this, the impact and influence of the trends were evaluated through historical trend-based evidence in conjunction with forecasts of key dimensions of the FOCs. The insights derived from the Forensics and Forecasting steps were used as inputs into the Future-sighting step, which led to the development of the scenarios. The Future-sighting step involved exposing groups of experts from a wide range of fields and knowledge of the ASEAN context to insights and evidence around the forces of change. The expert panels reacted to the forces of change based on their expertise and knowledge to define potential impacts and trajectories for ASEAN as it moved into the future. Analysis of expert perspectives and insights led to the development of four scenarios for ASEAN. These scenarios were then subject to further analysis in the Future-proofing step, to explore pathways and dynamics of the identified scenarios. The exploration of the scenarios and their pathways then led to the consideration and definition of the way forward for ASEAN.
The process of execution of this exercise within the 4F Framework, as noted earlier, was predicated on the focus on STIE ecosystems and how the forces of change impact these ecosystems. In this study, these interactions and impacts were captured through the Triple-10 framework. The ASEAN Triple-10 STIE Framework captures the dynamics between the forces of change, STIE drivers, and socioeconomic drivers (as shown in Figure 1.4.1). The framework provides insights into the endogenous relationships between the three drivers to generate greater Return-on-Values (ROV) which comprise economic prosperity, environmental sustainability, social transformation, and political empowerment.
The execution of this strategic ASEAN foresight exercise involved an extensive number of experts and parties. Key players in the exercise were the ASEAN Foresight Research Cohort members who participated as representatives of the ASEAN Foresight Alliance, and ministerial representatives from various departments of the ASEAN Member States (AMS) who shared their perspectives and thoughts regarding their national plans and initiatives within the context of ASEAN. The study was executed with focus group discussions involving a total of 102 representatives from AMS and additional regional experts. A total of 43 ministries and institutions were engaged.
The Focus Group Discussion participants were representatives of the following:
Ministry of Mines and Energy
Ministry of Water Resources and Meteorology
Ministry of Industry, Science, Technology and Innovation
Ministry of Health
Ministry of Rural Development
Ministry of Electric Power & Ministry of Science and Technology
Ministry of Energy
Ministry of Cooperatives and Rural Development
Ministry of Labour
Ministry of Health
Urban Redevelopment Authority
Ministry of Education and Sport
Ministry of Education, Youth and Sport
Ministry of Economy and Finance
Ministry of Commerce
Ministry of Environment
Ministry of Planning
Ministry of Agriculture, Forestry and Fisheries
Ministry of Education
Ministry of Health
Ministry of Investment and Foreign Economic Relations
Ministry of Industry
Ministry of Commerce
Policy Formulation for Research, Technology and Innovation, National Research and Innovation Agency (BRIN)
Department of Health
Department of Trade and Industry
Centre for Strategic and Policy Studies (CSPS)
Global Awareness & Impact Alliance (GAIA) Brunei
Ministry of Health
Ministry of Education
Ministry of Science, Technology, And Innovation
Ministry of Local Government Development
Ministry of Investment, Trade and Industry
Universiti Brunei Darussalam (UBD)
British High Commission
Ministry of Natural Resources, Environment and Climate Change
Ministry of Human Resources
Ministry of High Education
Ministry of Agriculture and Food Security
Ministry of Foreign Affairs
Throughout the study, the identities and views of all participants were kept strictly confidential. This ensured that opinions could be expressed freely and not constrained to politically correct expressions. The valuable insights gleaned from the participants are gratefully acknowledged. The information and insights they provided were critical in guiding the foresight exercise to a fruitful conclusion.

The first two stages of foresight, forensics and forecasting, capture a myriad of interconnected and transformative forces that are shaping the region’s future trajectory. This chapter details ten pivotal Forces of Change (FOCs), each exerting a profound influence on the evolving socio-economic and cultural fabric of ASEAN Member States (AMS). This chapter explores the complexities of the following FOCs: population demographics; health demographics; environment and planet; food and water; energy; economics and industry; consumer market dynamics; education and talent; politics and governance; and society – justice, equity, and equality. Through a comprehensive exploration of these forces of change, this chapter offers indispensable insights and stimulus for anticipating future scenarios for ASEAN.
2.1 FORCE OF CHANGE: POPULATION DEMOGRAPHICS
The trends that have shaped population demographics in ASEAN nations over the last 70 years tell a tale of transformation, marked by significant shifts and statistics. This section discusses the most significant of these shifts, the causes, the challenges posed and their consequences. It begins with the demographical trends over the last seven decades in the region, followed by a detailed analysis of the main demographic challenges, which have been divided into two categories: population growth, which concerns issues related to ageing and youthful populations, and population mobility, which focuses on inter-migration and rural-urban migration.
Post-World War II, ASEAN experienced a population surge with high birth rates and limited healthcare infrastructure, resulting in increased mortality, especially among infants. Infectious diseases were widespread, sanitation standards were subpar, and malnutrition was rampant. Limited access to education and preventive measures compounded health challenges. The 1960s and 1970s witnessed rapid population growth and urbanisation, driven by improved healthcare. By the late 1970s, the population tripled to around 330 million. The 1980s and 1990s marked a demographic transition with decreased birth rates, improved family planning and education, and increased life expectancy due to healthcare advancements. Overall, healthcare infrastructure, disease control, sanitation, nutrition, and medical advancements have significantly increased life expectancy in ASEAN, thus significantly reducing mortality rates.
ASEAN’s demographics are notably diverse, with member states experiencing varying population growth rates, urbanisation levels, and ageing trends. Indonesia, the most populous member, had over 270 million people in 2021, while Singapore, one of the smallest, had around 5.7 million. Collectively, the 10 AMS span an extensive 4.5 million square kilometres, ranking third globally in population. In 2024, the region’s population is at 693 million owing to both natural growth and the inclusion of Brunei Darussalam, Lao PDR (Laos), Myanmar, and Cambodia as ASEAN members (World Bank, 2025).
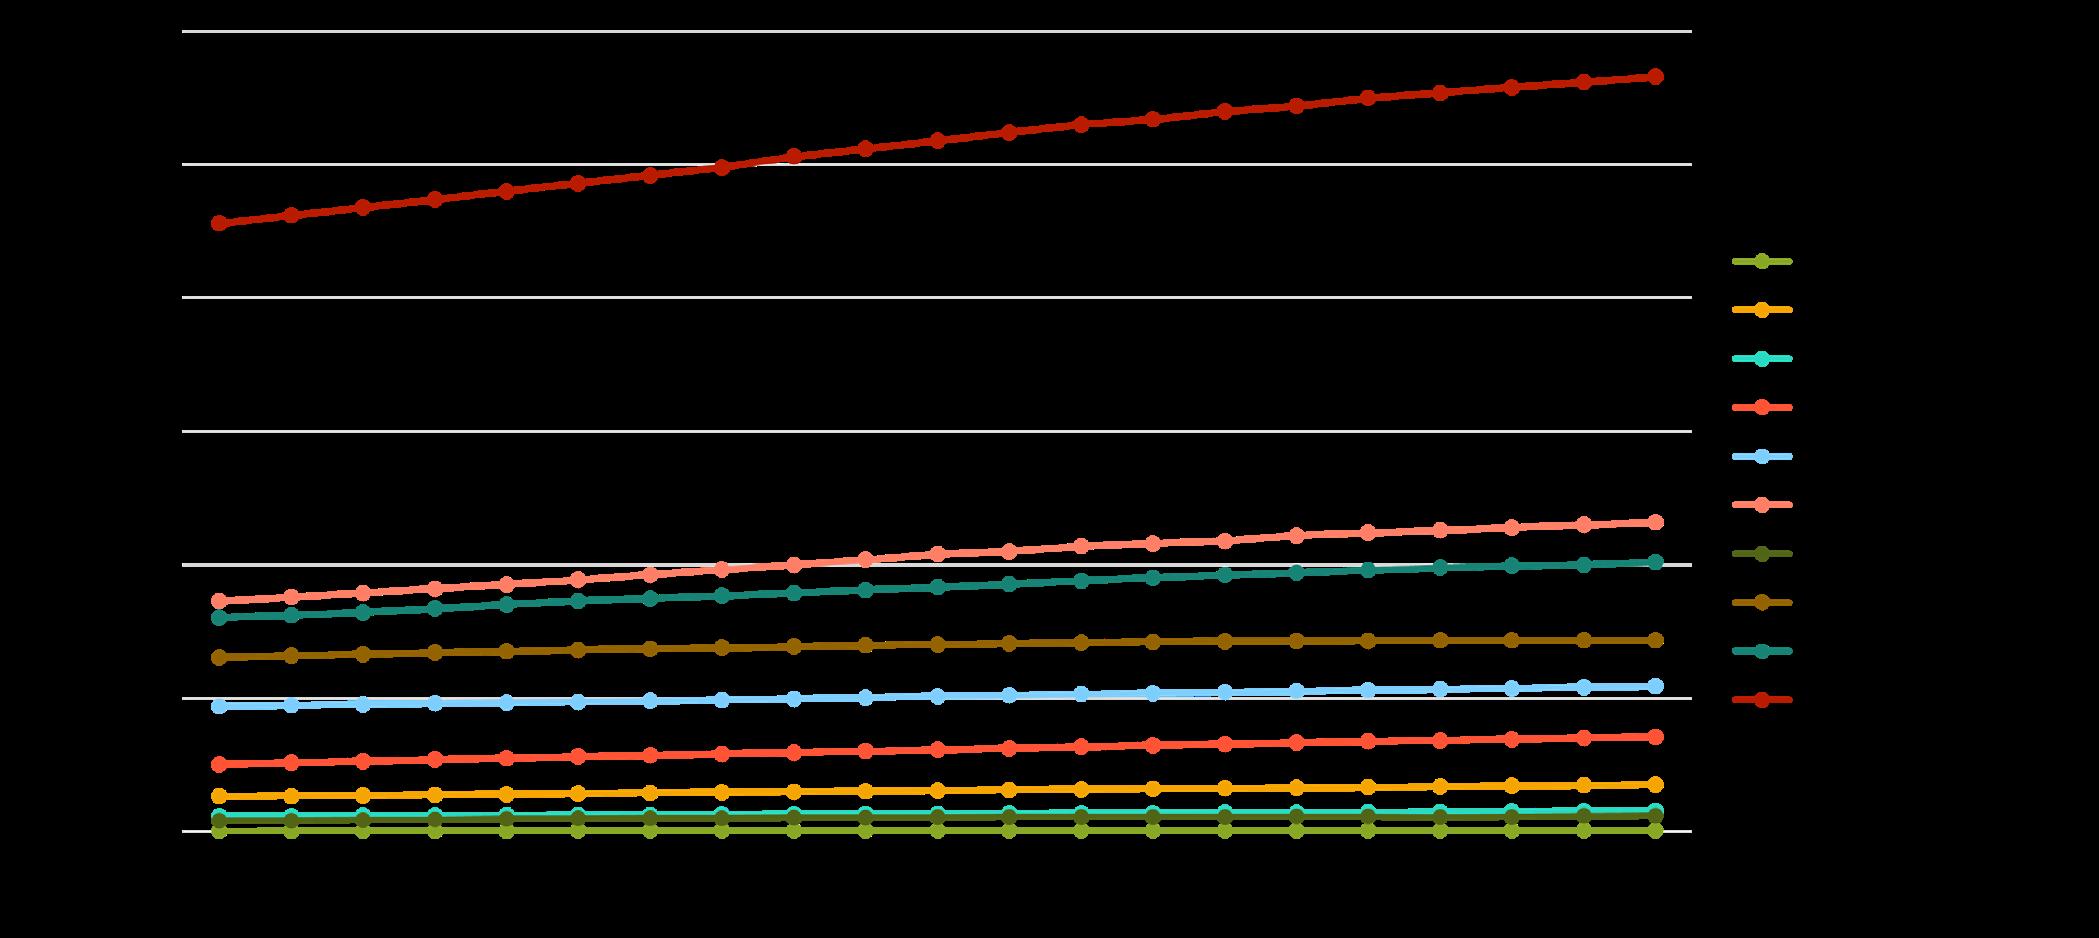
ASEAN’s population grew annually by 1.3%. However, this annual growth rate declined to 1.0% in 2023 (ASEAN Key Figures, 2020; 2024). This indicates that while the population is increasing, the growth rate is slowing down.
ASEAN’s population increase has inadvertently led to significant challenges in population growth, which will be discussed from two major angles: the ageing population and the youthful population.
The increasing population in ASEAN has brought forth a pressing concern – the growing number of elderly citizens. According to a recent report, in 2023, the number of individuals aged 65 or older in ASEAN was 55.9 million, making up 8.1% of the total population. This number is projected to increase to 128.7 million by 2050, making up 16.3% of the total regional population (ASEAN Magazine, 2025). This number is projected to triple by 2050; approximately 168 million elderly citizens. Over time, better healthcare, disease control, sanitation, nutrition, and access to education have boosted life expectancy globally, including in ASEAN. Medical advancements and public health efforts have increased lifespan and reduced deaths in the region, leading to a significant growth in older adults between 1990 and 2023 (World Bank ,2025).
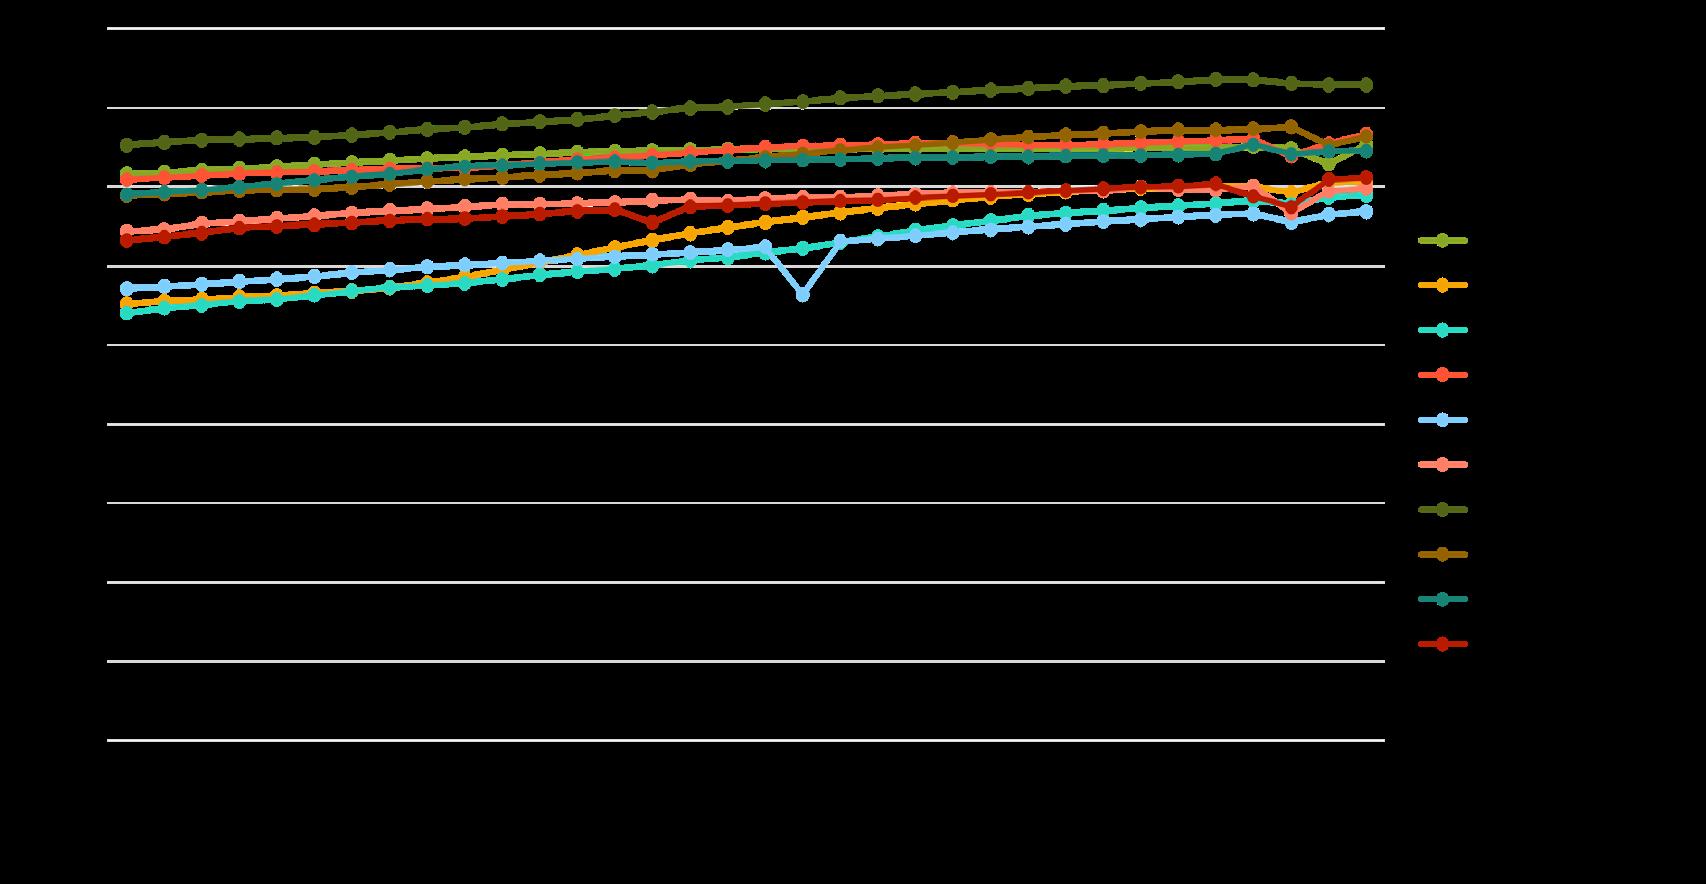
The projected threefold increase in Asia’s elderly population by 2050 underscores the ongoing demographic shift, driven by declining fertility and mortality rates across AMS. This ageing trend in ASEAN primarily results from reduced fertility rates between 1990-2023 (Figure 2.1.4), influenced by shifts in family structure, greater access to family planning, and evolving social norms (ESCAP, 2024; Kearney, 2024).
The growing elderly population raises concerns about supporting retirement and pensions. While pensions offer social security, provident funds usually do not. To meet the ageing population’s needs, various social security options, including pensions and provident funds, are essential. According to the World Social Protection Report (2024), 45.6% of people aged 65 and above in Southeast Asia were covered in 2023, a significant increase from 33.3% in 2015, showing an improvement of elderly people support. In contrast, Eastern Asia demonstrated a higher coverage at 98.6%.
Among the 6 countries reported, Singapore leads the region with an overall score of 78.7 and a grade of B+. The Philippines faces significant challenges with pension adequacy and sustainability, ranking last in the group with a D grade. Meanwhile, Malaysia, Vietnam, Indonesia, and Thailand all scored mid-range, with Malaysia earning a C grade and a score of 56.3, followed by Vietnam (54.5), Indonesia (50.2), and Thailand (50.0), all with C grades as well. These diverse situations within ASEAN underscore the complexity of government effectiveness and the region’s commitment to continuous improvement.
The employment patterns among elderly populations (65+ years) across ASEAN countries from 2009 to 2024 show significant variations, reflecting differing levels of social protection, labour market structures, and policy responses to ageing (Figure 2.1.5). Countries with larger informal economies, such as Cambodia, Indonesia, and Thailand, consistently report high elderly employment rates, driven by limited pension coverage and the need for continued income. In contrast, Brunei and Singapore maintain lower rates due to stronger social security systems, whereas Singapore shows a steady upward trend as policies encourage active ageing. Vietnam and the Philippines remain at a moderate level. The impact of COVID-19 (2020–2021) caused temporary declines of workforce across several countries, but most have since rebounded.
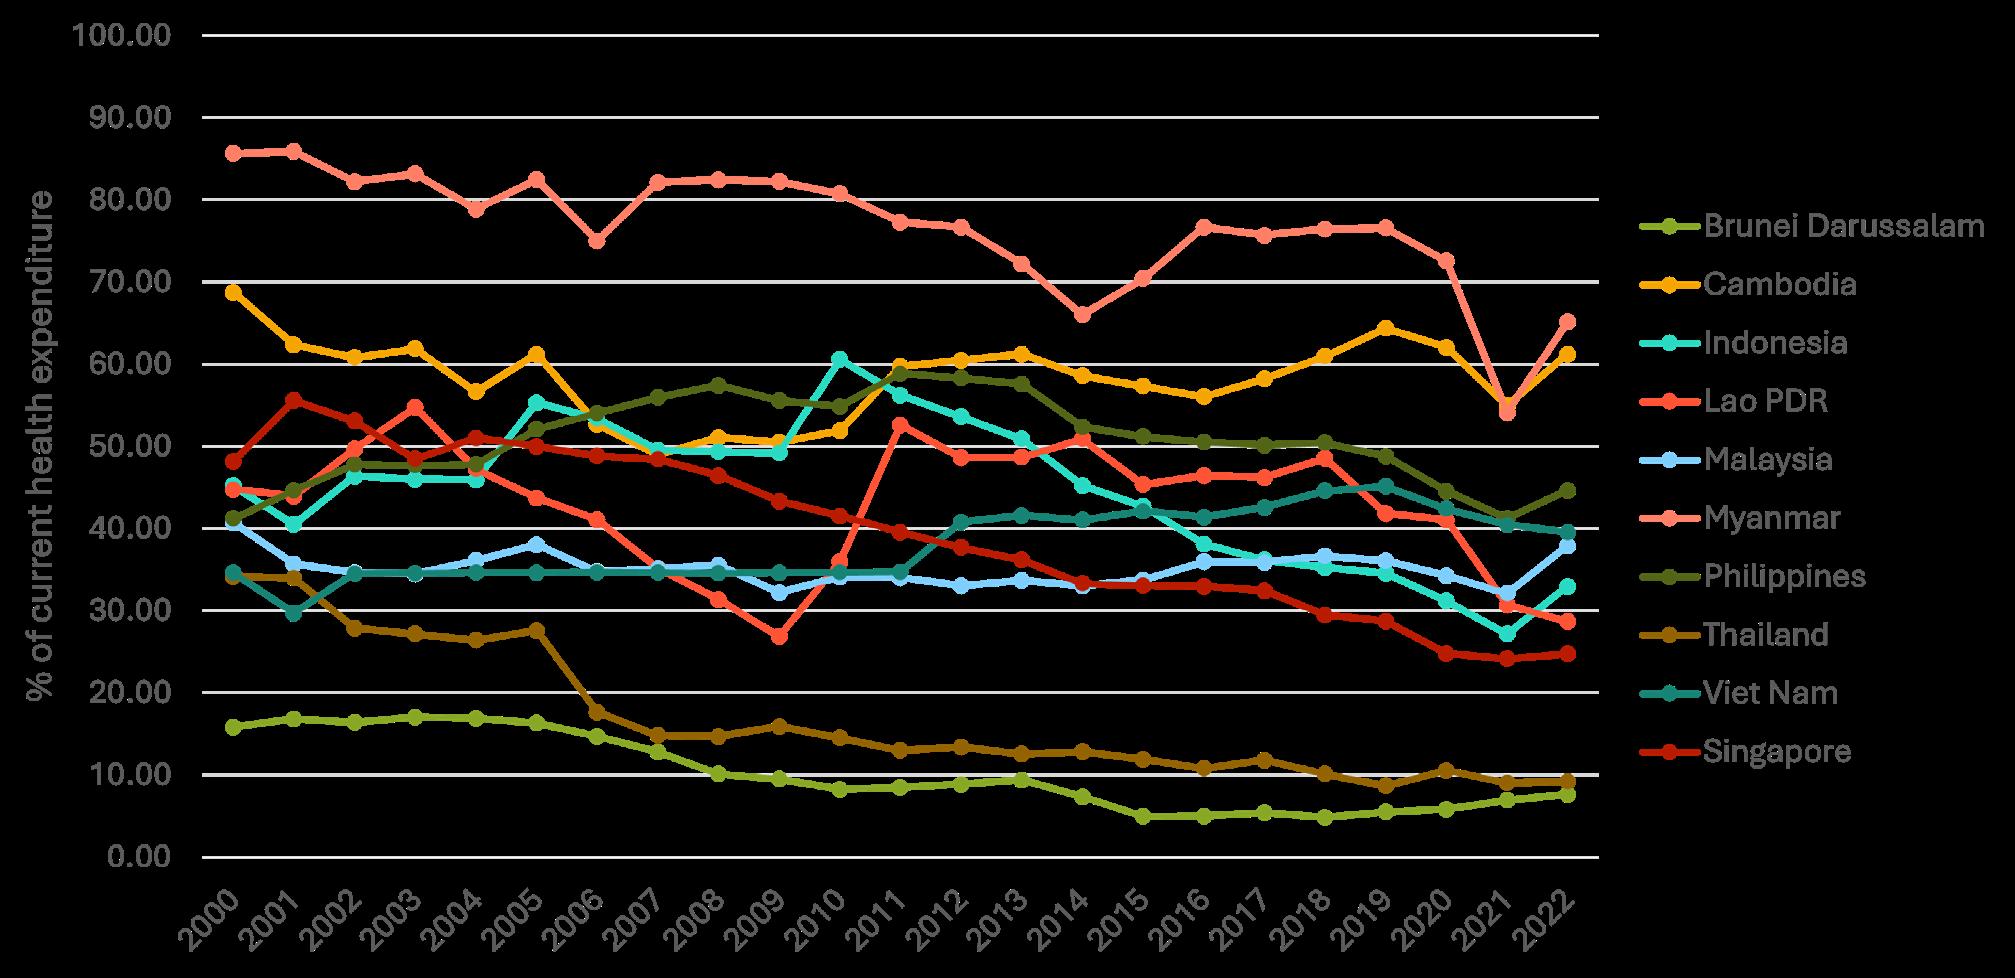
As populations age, out-of-pocket healthcare expenses, particularly in countries lacking subsidised healthcare, can impose substantial financial burdens on the elderly and their families (see Figure 2.1.6).
The World Health Organization (WHO) emphasises the need for various healthcare services for the elderly, including primary healthcare, regular check-ups, disease prevention, and treatment of common ailments like hypertension, diabetes, and osteoarthritis. Since the onset of COVID-19, social isolation and loneliness have emerged as significant challenges for older adults. Technologies such as video chat, social media, and online support groups have proven invaluable (National Institute on Aging, 2021). The active support of older adults’ health and well-being can be achieved through the use of tools like artificial intelligence (AI), machine learning (ML), telemedicine, and age-friendly housing and infrastructure. However, ensuring the equitable distribution and implementation of these tools remains a challenge.

The ASEAN region is characterised by its diverse demographic landscape, with a significant and growing youth population. There were over 200 million individuals aged 15-34 in 2022, representing more than 30% of the total ASEAN population. The proportion of youth in the population is expected to peak in 2038 (ASEAN Statistical Yearbook, 2023).
In ASEAN, the age range of its youth population falls between 15 and 35 years old, as used in the 2nd ASEAN Youth Development Index (YDI) Report. The YDI assigns a score between 0 and 1 to each country, with higher scores indicating better youth development. From 2013 to 2022, ASEAN as a whole improved its YDI score from 0.535 to 0.606, with all countries showing progress (Youth Development Index 2013-2022, 2022). Note that this ratio is calculated by dividing the population below a specific age (often 15 or 20) by the population above that age, shedding light on the working-age population and the nation’s ability to sustain its youth (Youth Development Index, 2022).
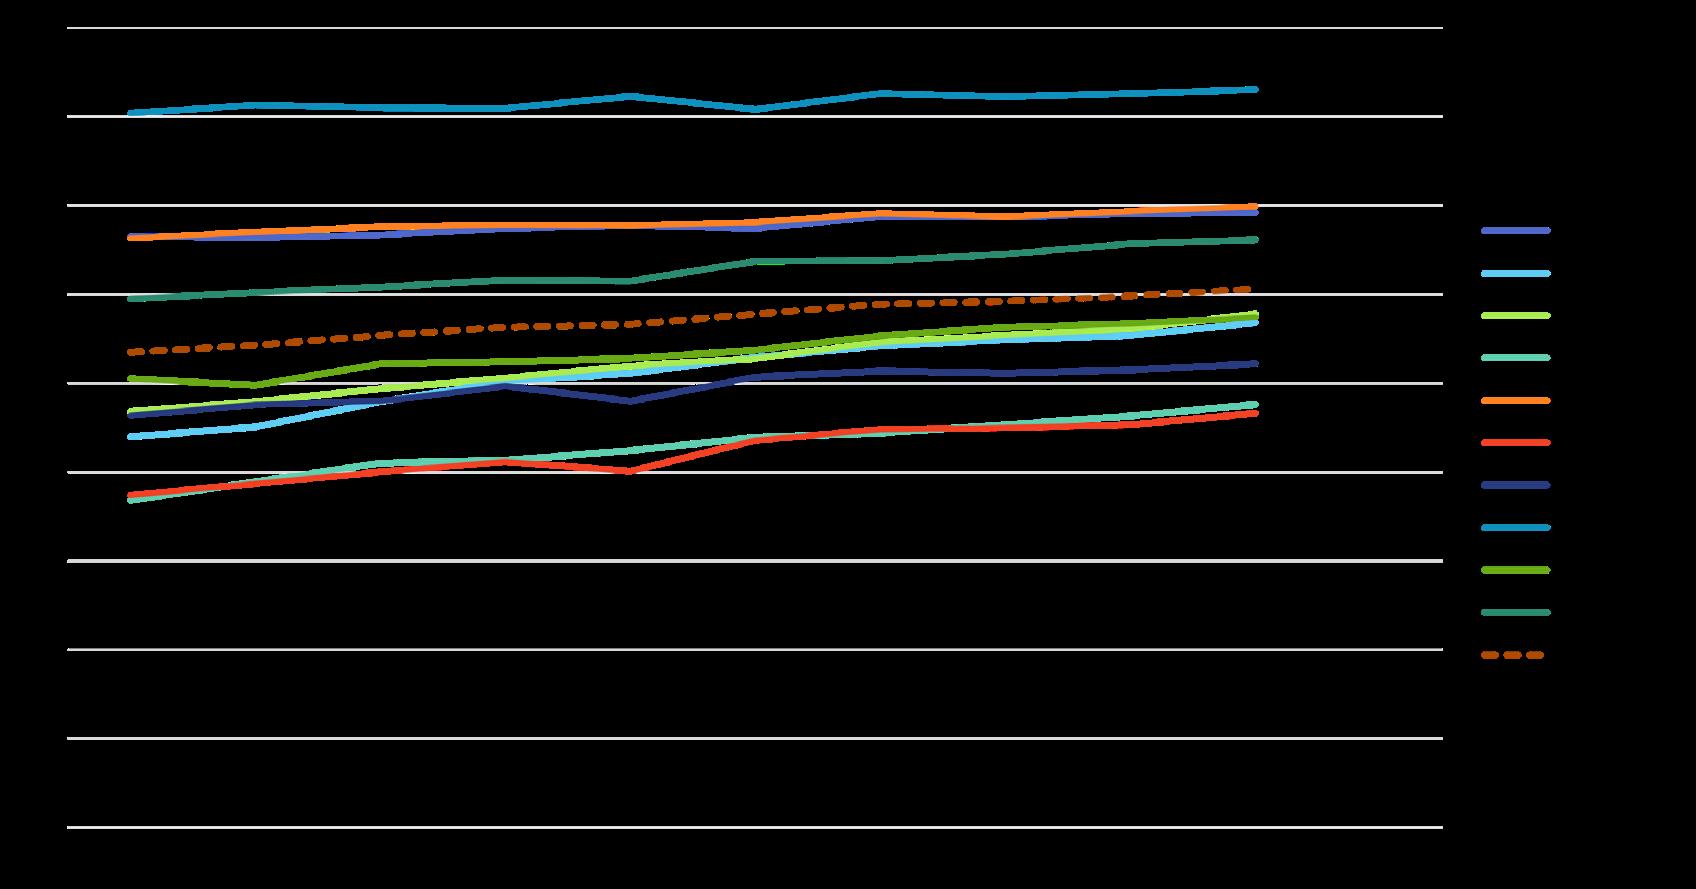
The youth-dependency ratio is a crucial demographic indicator that assesses the proportion of young individuals who rely on others for their daily needs compared to those who can provide support. It is a key measure for understanding a population’s age structure and its economic implications.
High youth-dependency ratios, seen significantly in Cambodia, Laos, and the Philippines within the ASEAN context, signal the challenge of supporting a large young population, affecting education, employment, and social services. Policymakers and economists must grasp this ratio’s importance for informed decisions on investments in youth-focused services, especially in addressing issues like youth unemployment and underemployment to ensure sustainable economic growth.
One of the primary challenges associated with a youthful population in ASEAN is providing quality education and vocational training. Education in the region has made significant progress, with rising enrollment rates and more young people completing secondary and tertiary education (State of ASEAN Cities Report, 2022). However, with a large cohort of young people entering the education system, there is significant pressure on educational resources, including schools, teachers, and infrastructure. Ensuring that this youthful population receives a relevant and high-quality education to meet the demands of the job market is a major challenge (Smith, 2018).
Youthful populations often bring unique social dynamics and cultural changes and can be a demographic dividend, potentially contributing to economic growth. When properly educated and employed, the youth can drive innovation, entrepreneurship, and productivity, which is essential for a country’s economic development (Gupta, 2021).
Despite these opportunities, the challenge of equal opportunity for youth in ASEAN remains a significant concern. Disparities in education, employment, and access to resources can hinder the realisation of youth potential. Ensuring that all youth, regardless of their background or location, have access to quality education, skill development, and employment opportunities is crucial for harnessing the demographic dividend (United Nations, 2020).
As ASEAN continues to grow and evolve, understanding the movement of people within its member states is crucial. There are various causes of inter- and intra-migration between and within AMS. Some people seek to escape political turmoil or environmental instability, while others want to reunite with family or access better education. Most commonly, labour migration is driven by the need to escape poverty and often spans generations (IOM, 2019).
Inter-migration plays a significant role in shaping the demographic and economic landscape of ASEAN today. Inter-migration, involving the movement of people between different countries within the ASEAN region, as opposed to intra-migration, which pertains to movement within a single AMS, reflects the complexities of regional population mobility. These patterns are influenced by a range of factors, including economic opportunities, social ties, and political stability (Smith, 2020).
Singapore, Malaysia, and Thailand have positive net migration trends due to their strong economies and well-developed infrastructure. In contrast, Myanmar, Indonesia, and Cambodia have lower net migration rates due to limited economic opportunities, political instability, and inadequate infrastructure. Cultural differences and language barriers further challenge migrants’ integration into these societies (International Migration Report, 2020).
Socioeconomic disruption
The consequences of inter-migration dynamics are manifold. Inter-migration promotes cultural exchange and diversity as it brings people from diverse backgrounds together, fostering a rich tapestry of cultural interactions (Jones, 2019). It also contributes to economic growth and technological advancement, with migrants often bringing new skills and knowledge to urban areas (Brown, 2018). However, the challenges of social disruption, infrastructure strain, and unequal opportunities persist alongside these migration trends.
Protection of migrant workers
Many migrants are low-skilled workers, and a significant portion are women working in domestic and caregiving roles. The money they send back home as remittances is vital for the economies of many ASEAN nations. The COVID-19 pandemic has disrupted this migration, reduced the number of migrants, and made those already in other ASEAN countries more vulnerable. To address these issues, AMS has implemented agreements and plans to ensure safe and organised migration, such as the ASEAN Declaration on the Protection and Promotion of the Rights of Migrant Workers and the ASEAN Consensus on the Protection and Promotion of the Rights of Migrant Workers (ILO, 2022).

Migration
In terms of rural-urban migration, there are currently 6.8 million people who have migrated within ASEAN. Approximately half of the ASEAN population currently resides in urban areas, and this proportion is projected to increase to 68.0% by 2050 (ASEAN Migration Outlook, 2024). The most prominent consequence of the population’s migration from rural to urban areas is urbanisation, which comes with a unique set of challenges.
Urbanisation is propelled by a confluence of factors, with family, employment opportunities, and education standing as its primary driving forces (see Figure 2.1.8).
Figure 2.1.8 Causes of Urbanisation Across AMS
Notes: Data for Indonesia, Singapore, Timor Leste, Philippines, and Brunei are not available. Urbanisation, People, Mobility and Inclusive Development across Urban-Rural Continuum in ASEAN ,2022
Rural-urban migration in ASEAN has some positive impacts, attracting migrants with economic opportunities and higher wages, and contributing to increased income levels and economic growth (Todaro & Smith, 2020).
Urbanisation in ASEAN poses challenges, with concerns about areas accommodating migrants leading to environmental issues like pollution and deforestation (Brown, 2020). Rapid urban population growth causes traffic congestion and impacts air quality (Gupta, 2021).
Social inequity and urban poverty
Social inequality worsens due to limited job opportunities, varying living standards, and potential discrimination, particularly affecting less educated migrants facing exploitative labour conditions (Davis, 2017). Industrial concentration in and around cities gives rise to slums, overcrowding, and urban poverty, hindering access to essential services (UNESCO, 2018). Many ASEAN countries continue to experience a high number of urban poor populations. For example, in 2022, population living in slums (percentage urban population) are as follows: Cambodia (42%), Indonesia (19%), Laos (55%), Myanmar (58%), the Philippines (36%), and Vietnam (33%) (World Development Indicators, World Bank, 2025). Migration disrupts families, resulting in significant social and psychological consequences (Smith, 2019). Poor living conditions in the urban areas will lead to an increase in crime, social problems and social unrest.
As ASEAN grapples with the stark dichotomy of ageing and youthful demographics, a sense of urgency underscores the necessity for comprehensive and immediate strategies. The rising proportion of elderly citizens necessitates urgent attention to bolster healthcare infrastructure and enhance social connectivity, particularly in the aftermath of the COVID-19 pandemic. Simultaneously, the ongoing trend of rural-urban migration poses formidable challenges, giving rise to the expansion of informal settlements and slums, intensification of resource constraints, and aggravation of issues related to overcrowding in urban areas. The repercussions of failing to take decisive action are far-reaching, impacting both the current state and future trajectory of the ASEAN community. Swift and purposeful measures are essential to effectively leverage the potential of the youthful workforce, cater to the distinctive needs of an ageing population, and adeptly navigate the complexities of urbanisation. Only through such concerted efforts can ASEAN forge a path towards a sustainable and inclusive future, mitigating the adverse consequences of demographic shifts and urbanisation challenges.
The health dynamics of ASEAN present a complex and dynamic landscape shaped by diverse socio-economic, cultural, and environmental factors. ASEAN’s member states encompass a vast and varied population, each contributing to the region’s intricate health profile. From the megacity of Singapore to the rural landscapes of Cambodia, the region exhibits a broad spectrum of health indicators, healthcare systems, and public health challenges. As ASEAN strives for regional integration, understanding the diverse health demographics and the consequences and challenges that follow becomes crucial for formulating effective health policies, addressing emerging health threats, and fostering collective well-being across this vibrant and heterogeneous community. This section begins with a brief historical background of ASEAN’s health demographics, followed by an analysis of communicable diseases, non-communicable diseases, healthcare quality in ASEAN, and their respective challenges and consequences.
ASEAN’s Health Dynamics: A Historical Background
The region’s health history is a journey from post-colonial challenges to modern-day complexities. In the mid-20th century, the newly formed ASEAN sought to address pressing health issues, emphasising primary healthcare and disease control. Over the years, member states navigated transitions in demographic trends, with improvements in life expectancy, maternal and child health, and infectious disease control.
Notable milestones include the establishment of the ASEAN Health Ministers’ Meeting in 1987, underscoring the commitment to collaborative health efforts. The 2000s witnessed a heightened focus on addressing emerging health challenges, including the impact of globalisation on health determinants. The ASEAN Plus Three framework further expanded collaboration on health issues, emphasising joint responses to pandemics and health security threats.
While progress has been made, persistent health disparities, infectious disease outbreaks, and the growing burden of non-communicable diseases underscore the need for continued efforts.
Communicable Diseases in ASEAN
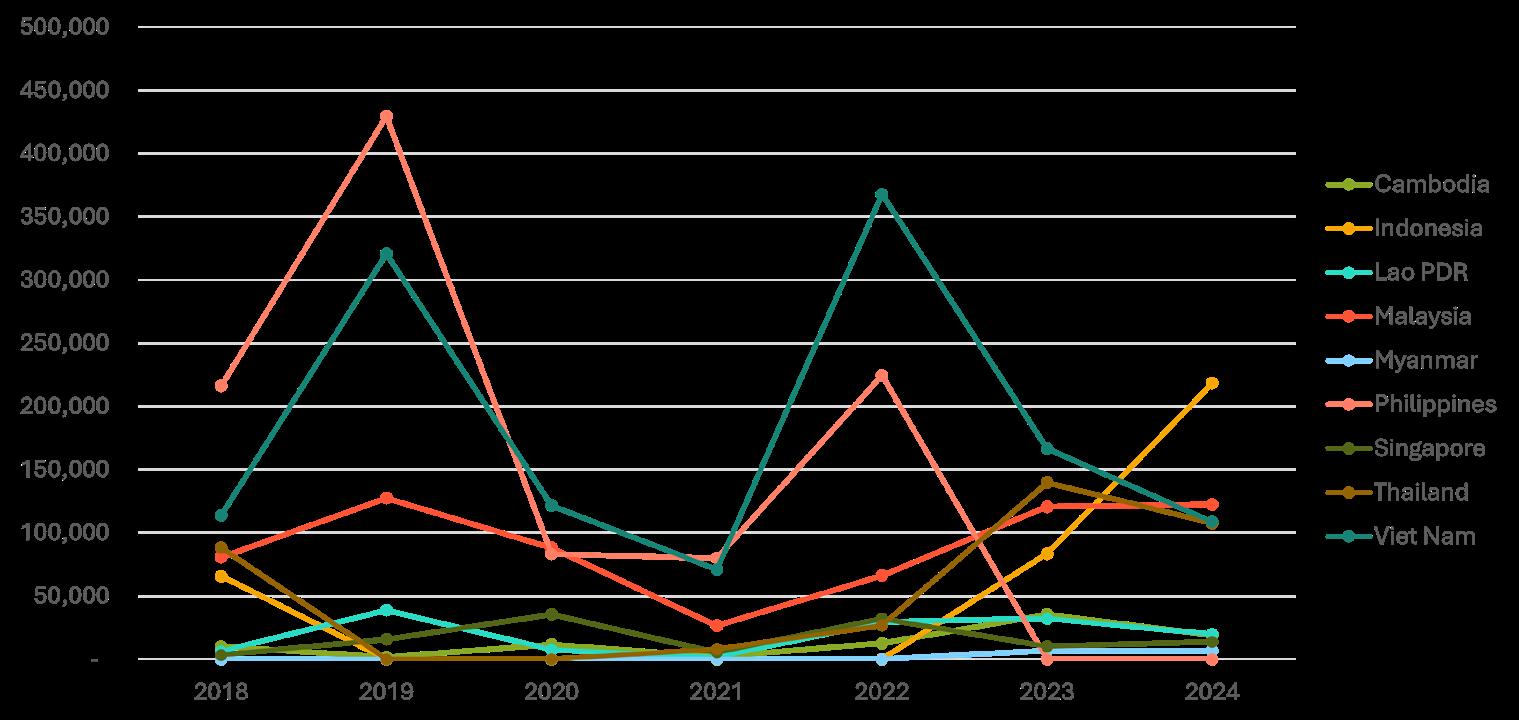
Communicable diseases, including tuberculosis (TB), diphtheria, pertussis, and tetanus (DPT), dengue, and malaria, present significant health and economic challenges, accounting for 30% of global annual fatalities (Shahid Shah et al., 2020). Within ASEAN, malaria remains widespread, affecting about 200 million people in 2023, with the highest burden in Indonesia, followed by Myanmar (WHO, 2024). TB records about 1.2 million cases, while dengue has approximately 1.2 million reported cases (WHO, 2019). Measles, a preventable viral disease, persists due to low vaccination coverage. Hepatitis is also a substantial burden, with about 33 million people living with chronic hepatitis B and 7.2 million with chronic hepatitis C in the region. The Philippines recorded an all-time high of dengue cases in 2019, but this value reduced significantly; however, it surged again during COVID-19, along with other ASEAN countries, including Singapore, Indonesia, and Thailand (Figure 2.2.1). While dengue has a low mortality rate, improving therapeutic management is essential to mitigate its emergence and recurrence.
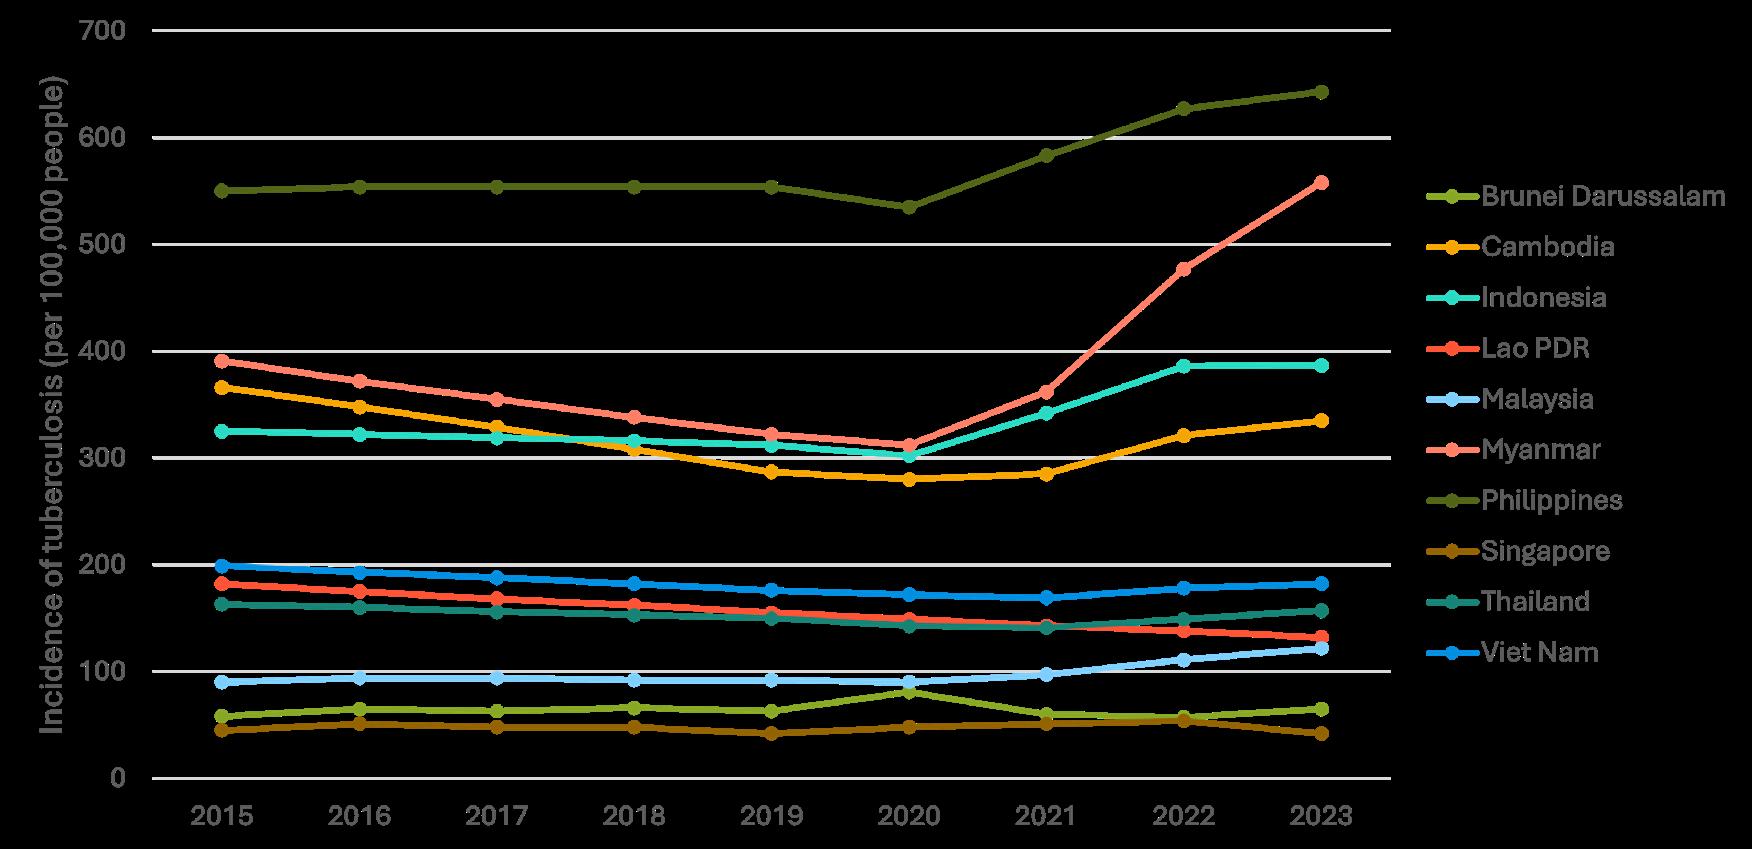
In 2023, ASEAN countries showed varying tuberculosis incidence rates, with the highest rates in the Philippines, Myanmar and Timor-Leste while Singapore had the lowest incidence rates per 100,000 population (see Figure 2.2.2).
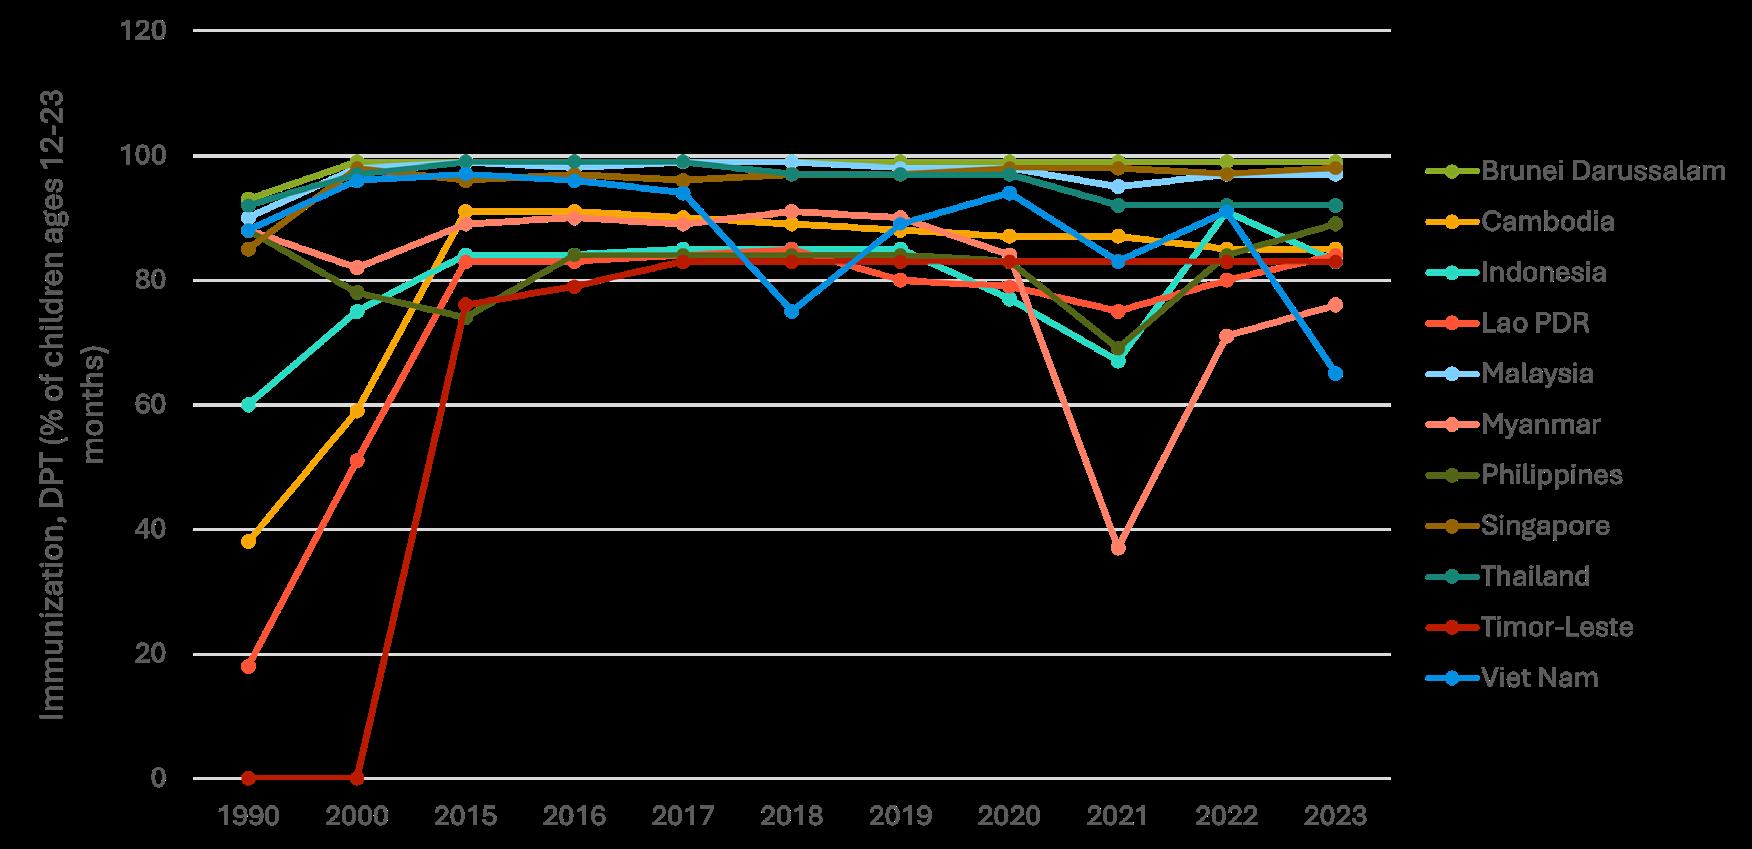
In examining measles immunisation rates for children under 2 years, Brunei Darussalam, Singapore, Thailand, and Malaysia consistently achieve over 90% coverage. Cambodia and Laos have shown increased immunisation rates since 2021 to 2023, while Vietnam experienced a significant decline from 2022 to 2023 (Figure 2.2.3).
Despite significant strides, ASEAN faces several challenges in its preparedness to respond to health disasters, including pandemic. Budgetary constraints in several AMS lead to significant out-of-pocket payments, affecting population welfare. Unequal healthcare resource allocation favouring affluent areas, further deepens inequities, while shifting epidemiological trends and aging populations are increasing healthcare costs, especially for NCDs (Liu et al., 2024). Political divisions and bureaucratic inefficiencies can hinder swift decision-making and resource allocation during crises, as observed in ASEAN's response to regional health challenges (Lim et al., 2023). Enhancing information-sharing and communication within ASM is therefore crucial, as timely, accurate data underpins an effective response (ASEAN Secretariat, 2024). Addressing these challenges is vital for ASEAN to strengthen its resilience and responsiveness to future health emergencies.
Sufficient immunisation of ASEAN’s population remains a challenge. Immunisation relies on the National Immunisation Programme (NIP), a government-led initiative providing vaccines to the entire population, emphasising vulnerable groups like children, pregnant women, and the elderly. According to ASEAN Vaccine Baseline Survey (AVBS), in 2021, each AMS includes no more than 10 to 15 vaccines in their respective NIPs, emphasising the necessity for a consistent and adequate vaccine supply throughout the year to ensure effective vaccination programme implementation.
The consequences of communicable diseases extend beyond health implications, affecting the socioeconomic fabric of ASEAN nations. Outbreaks strain healthcare resources, disrupt workforce productivity, and lead to economic losses. The economic repercussions of the COVID-19 pandemic in particular have accentuated the interconnectedness of health and economic well-being.

Non-communicable diseases (NCDs) are a major public health concern in ASEAN, with high rates of mortality and morbidity due to diseases such as cardiovascular disease, cancer, diabetes, and chronic respiratory diseases. According to the World Health Organization (2022), NCDs account for almost two-thirds of deaths, emerging as a leading cause of death and disability in the region. Timor Leste, Laos, and Myanmar experience a notably elevated burden (World Bank Data, 2025), with mortality and morbidity rates surpassing the regional average of 35% to 44% as of 2020 (ASEAN Socio-Cultural Community Policy Brief, 2024).
NCDs are mainly caused by undernutrition or malnutrition in most of the AMS. While the terms “undernutrition” and “malnutrition” are related, they have distinct implications. Undernutrition refers to an insufficient intake of calories, proteins, or essential nutrients, leading to deficiencies that can contribute to the development and exacerbation of NCDs. Conversely, malnutrition encompasses both undernutrition and overnutrition. In the context of NCDs, it refers to the imbalance in nutrient intake, where individuals may consume excessive calories but lack essential micronutrients. It is essential to consider these nuanced definitions and associations in developing targeted strategies to address both undernutrition and malnutrition-related NCDs in the ASEAN region.
Undernutrition, particularly in early life, may increase susceptibility to NCDs later in life. For instance, malnutrition during childhood can be linked to an increased risk of cardiovascular diseases in adulthood (Barker, 1997). The ASEAN region is home to 63.4 million undernourished people. The proportion of the population that is undernourished varies across AMS. Figure 2.2.4 shows the prevalence of undernutrition in 8 ASEAN member states in the region.

Addressing undernutrition involves promoting adequate nutrition in early life and ensuring that individuals receive essential nutrients to reduce the risk of NCDs later on (Victora et al., 2008).
Food insecurity leads to more severe forms of undernutrition, including hunger. The status of food insecurity in ASEAN’s population is shown in Figure 2.2.5. Cambodia recorded the highest level of food insecurity in the ASEAN region, with Singapore, Indonesia and Thailand leading in the region in food security (World Development Indicators 2025). Land grabbing, development projects, and limited infrastructure in rural areas also make it difficult for people to access markets and transport goods, further contributing to food insecurity (World Food Program, 2021).
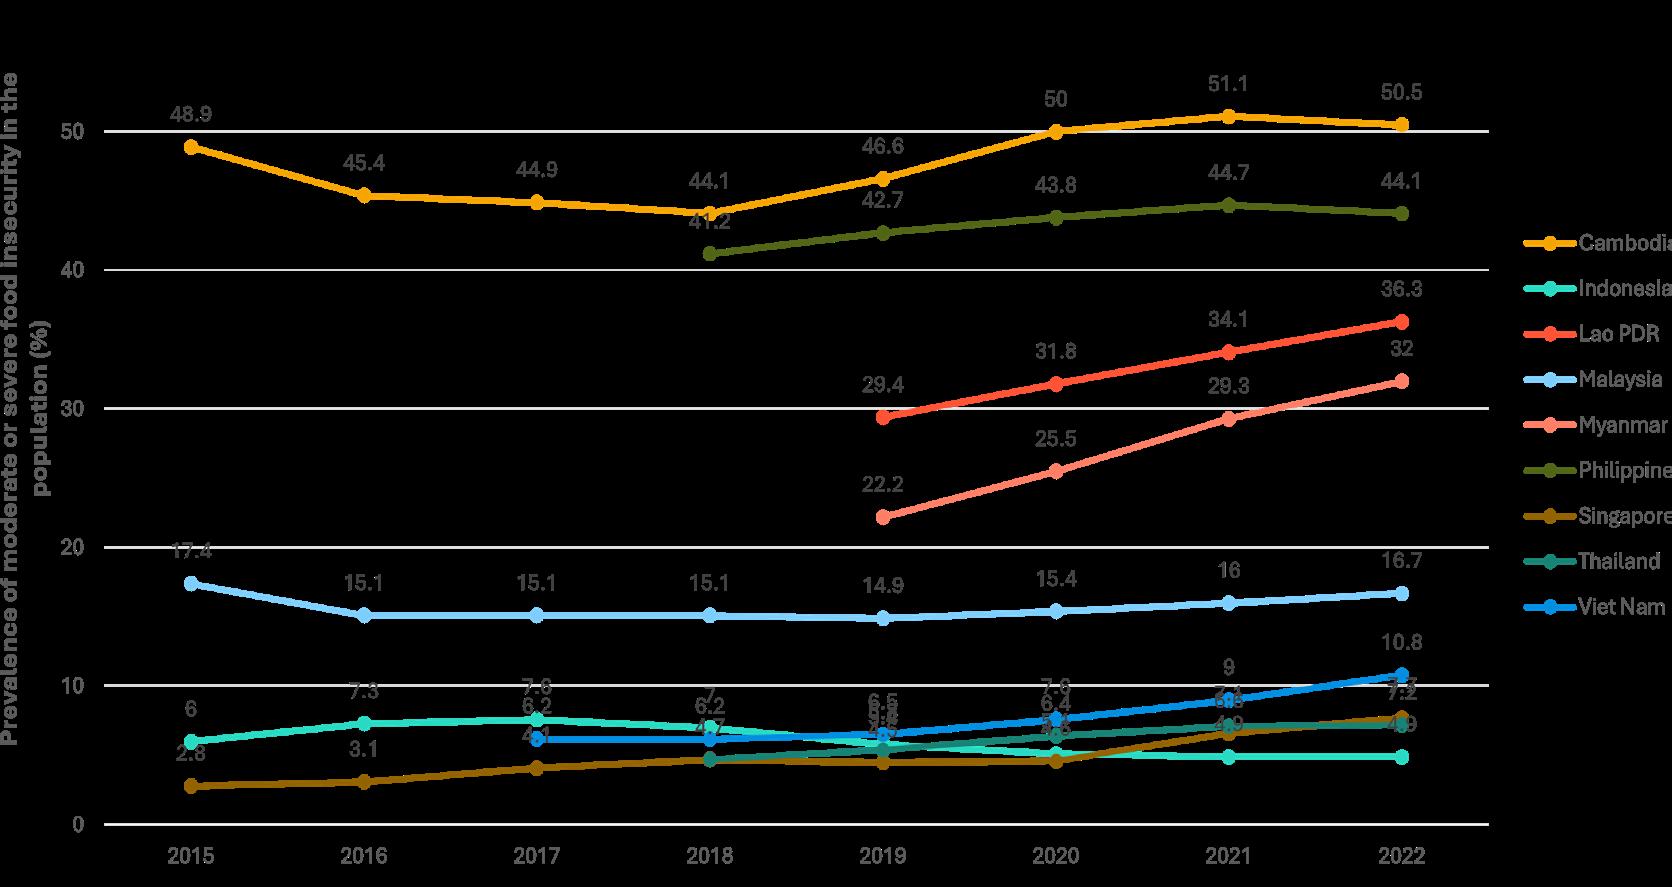
Figure 2.2.5 Prevalence of moderate to severe food insecurity in the population (%) in ASEAN Food and Agriculture Organisation of the United Nations (FAO), 2025
Undernutrition also perpetuates the cycle of poverty and food insecurity. It can lead to reduced productivity, increased healthcare costs, and decreased educational attainment, all of which can further entrench poverty and food insecurity (FAO & World Bank, 2024). Therefore, ASEAN countries must address the root causes of food insecurity, such as poverty and environmental degradation, and implement policies and programmes to ensure consistent access to safe, nutritious, and culturally appropriate food for all populations (World Food Programme, 2025).
Mitigating malnutrition-related NCDs involves interventions that address dietary imbalances, promote healthier food choices, and regulate the availability of processed and unhealthy foods (Popkin et al., 2012). In many ASEAN countries, the cost of healthy foods, such as fruits and vegetables, is often higher than the cost of less healthy options, such as processed foods and sugary drinks. This makes it difficult for low-income households to afford a nutritious diet, which leads to the development of NCDs. Introducing a healthy diet will reduce fatalities caused by poor diet by 22-23% (FAO et al., 2020) Figure 2.2.6 shows AMS’ respective capacities to manage NCDs. By 2030, the cost of treating nutrition related NCDs could be nearly US$ 4.5 trillion in Indonesia (Bloom et al., 2011)
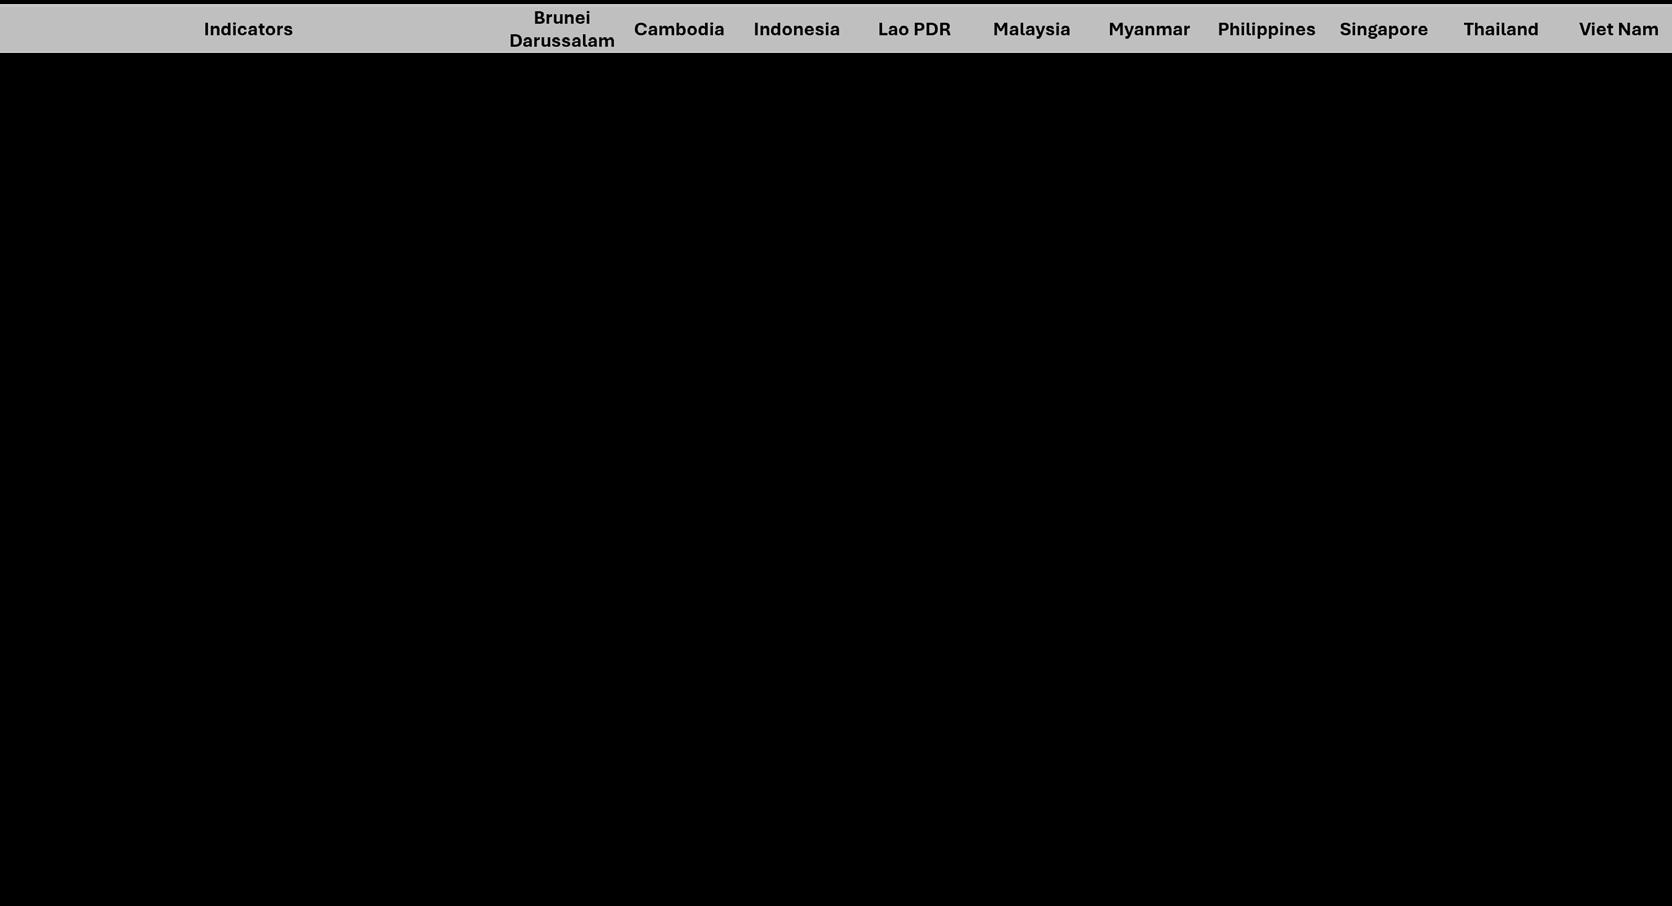
Notes: Good capacity for control NCDs, Poor capacity for control NCDs
Figure 2.2.6: National Capacities to Control Non-Communicable Diseases in ASEAN in 2022 ASEAN Development Outlook, 2021
According to the World Bank data, health expenditure variation in ASEAN is influenced by factors like economic development, government policies, and demographics. Being a developing country with limited resources and a small population, building a robust healthcare system is challenging. ASEAN countries show a wide range in total health expenditure as a percentage of GDP, with Singapore having the highest expenditure per capita in 2022 at approximately US$4,000 (The Global Economy, 2024), while Laos, Myanmar, and Timor-Leste have the lowest. Although higher health expenditure per capita may be associated with better health outcomes, healthcare accessibility and quality also play significant roles.
Healthcare policy
To enhance ASEAN’s resilience, addressing both health expenditure and food affordability is crucial. While increased health spending can improve healthcare access, it may not necessarily ensure access to healthy foods. Policy measures, such as subsidies, community gardens, and nutritional education, can enhance access to healthy foods. Investing in preventive healthcare, including screenings and services, can reduce chronic disease burdens and yield cost savings.
Public funding
As ASEAN aims to elevate health spending to match developed nations, the issue of Out-ofPocket (OOP) health expenditure arises. In low-income countries like Myanmar and Laos, limited public funding results in higher OOP costs, reaching catastrophic levels, causing financial strain and hindering healthcare access. Increasing public funding, expanding health insurance, and implementing cost-sharing based on income can alleviate the burden of OOP expenses, ensuring better healthcare access and improving the overall well-being of the population (Soucat et. al., 2018).
The health dynamics of the ASEAN region reflect a complex interplay of challenges and opportunities. While advancements in healthcare have contributed to improved overall health indicators, persistent issues such as the prevalence of communicable diseases, uneven healthcare access, and the impact of emerging health threats demand continued attention.
The region has made strides in addressing some of its health challenges, with collaborative efforts and initiatives aimed at disease prevention, vaccination programmes, and healthcare system strengthening. However, the ongoing burden of diseases like malaria, tuberculosis, and the periodic outbreaks of dengue underscore the need for sustained efforts and innovative approaches.
The recent experience of the COVID-19 pandemic has highlighted the importance of resilient and adaptive healthcare systems. The pandemic’s impact on dengue cases and the strain on healthcare infrastructure emphasise the interconnectedness of health demographics with broader global challenges.
Moving forward, ASEAN nations must prioritise health equity, bolster healthcare infrastructure, and enhance regional collaboration to effectively address current health disparities and prepare for future health threats. As the region continues to navigate the evolving landscape of health demographics, the commitment to promoting a holistic approach to health—embracing preventive measures, healthcare accessibility, and collaborative research—will be instrumental in achieving sustainable health outcomes for the people of ASEAN.
The environment and biodiversity stand as a formidable force of change, shaping the trajectory of development and progress. As AMS collectively navigate the complexities of economic growth, social advancement, and regional integration, the environment emerges as a pivotal factor influencing the sustainable future of this diverse and dynamic community. This section explores environmental dynamics and planetary influences within the region, examining the key challenges that resonate across member states.
Throughout history, AMS have been custodians of an incredibly diverse and vital natural environment. Home to three of the 17 globally recognised mega-diverse countries (Estoque et al. 2019) —Indonesia, Malaysia, and the Philippines—ASEAN stands as a beacon of biodiversity. ASEAN’s environmental history is a narrative of resilience, diversity, and the interconnectedness of nature with the region’s economic development. Today, however, ASEAN grapples with complex environmental and biodiversity challenges. This section begins by discussing the profound impact of climate change and navigating some of its primary triggers: deforestation, marine and river pollution, and air pollution, followed by the respective challenges and consequences.
The impact of climate change on the ASEAN region is becoming increasingly pronounced, with severe consequences for both the environment and socio-economic well-being. Rising sea levels, extreme weather events, and changing precipitation patterns are among the key climate-related challenges faced by AMS. These changes pose significant threats to agriculture, water resources, and coastal ecosystems, affecting the livelihoods of millions. Southeast Asia is particularly vulnerable to climate change due to its geographical location and dependence on climate-sensitive sectors. The potential for increased frequency and intensity of tropical cyclones in the region exacerbates the risk of flooding and infrastructure damage (Nhamo et al., 2020). The adverse effects of climate change in ASEAN extend beyond the environment, impacting social and economic stability. In 2015, the Asian Development Bank projected that climate change could hit Southeast Asia harder economically than other regions, potentially reducing ASEAN’s GDP by up to 11% by 2100 under a “business as usual” scenario.
Climate-related displacement
Biodiversity loss
Climate change-related displacement is a major concern, with an annual average of 21.5 million people forcibly displaced since 2018 due to climate-related disasters (UNHCR, 2016). If current trends persist, 1.2 billion people globally could face displacement by 2050, potentially causing resource strain, trust issues, and social unrest in AMS host countries. Climate refugees may also face marginalisation due to the lack of international legal protection. Climate change poses a real threat to the rich and diverse ecosystems that inhabit the ASEAN region. Rising temperatures, altered precipitation patterns, and extreme weather events associated with climate change are disrupting ecosystems and leading to shifts in species distribution. Southeast Asia is recognised as one of the world’s biodiversity hotspots, hosting a vast array of plant and animal species. However, the region is experiencing habitat loss and degradation due to climate-induced factors such as rising sea levels and changes in temperature and precipitation (Sodhi et al., 2010). These environmental shifts directly impact the survival and reproduction of various species, contributing to a decline in biodiversity. The complex interplay between climate change and other human-induced stressors, such as deforestation and land-use changes, further accelerates biodiversity loss in the ASEAN region. Urgent and coordinated efforts, both at the national and regional levels, are therefore essential to mitigate these impacts and build resilience in the face of a changing climate.
Forests are vital for the planet’s health, providing essential ecosystem services at local, regional, and global levels. These services include providing food, clean water, and timber; regulating climate and diseases; and supporting soil formation and nutrient cycling (Ballofet N. et al., 2012). Yet, in the heart of Southeast Asia, where 15% of the world’s tropical forests are found, an alarming rate of degradation is taking place. Even by 2015, 35% of the region’s forest cover had been converted, laying to waste prime old-growth forests for non-forest purposes (Estoque et al., 2019).
The ASEAN region lost between 80,000 km2 and 610,000 km2 from 2001 to 2019 (Estoque, 2019; Cowan, 2021). Notably, 31% of this loss occurred in mountainous regions, equivalent to 189,100 km2, converted to cropland and plantations (Cowan, 2021). Borneo alone faces an ominous situation, estimating a loss of around 220,000 km2 of forest between 2010 and 2030 (Lai, 2022).
Challenges and Consequences
Malaysia, the Philippines, and Myanmar have faced challenges in reducing forest loss, highlighting the need for a coordinated, region-wide effort to combat deforestation. While Indonesia historically experienced the highest rate of forest loss in ASEAN, contributing nearly 14% to global tropical deforestation in 2019 (Lai, 2022), recent data has shown a positive reversal of this trend. According to Global Forest Watch (2024), the country reduced its primary forest loss to a record low of 0.23 million hectares in 2023. This significant achievement marks the fourth consecutive year of a decline in deforestation, a trend that is attributed to stronger government policies and corporate commitments to zerodeforestation pledges. This positive change demonstrates that the persistent trend of forest loss can be successfully addressed.
Southeast Asia, surrounded by oceans and intricate river basins, relies heavily on water for survival. Regrettably, human carelessness, including mismanagement of resources and waste, contributes to escalating pollution, encompassing industrial waste, sewage, and plastic pollution (NOAA, 2020).
Six of the top ten contributors to plastic leakage in rivers and oceans, a major pollutant, are ASEAN Member States- the Philippines,, Malaysia, Indonesia, Myanmar, Vietnam, and Thailand—jointly contributing 580,000 metric tons of plastic waste annually (Guzman, 2022).
ASEAN’s rapid urbanisation, expanding middle class, and insufficient waste management infrastructure make it a plastic pollution hotspot. The World Bank reported that the equivalent of $6 billion is lost every year in Malaysia, the Philippines, and Thailand when single-use plastic is not recovered and recycled (Trotsenburg & Lim, 2022).
Urban runoff, agricultural activities, and deforestation contribute to the introduction of pollutants such as sediment, nutrients, and pesticides into rivers, with subsequent implications for marine environments (Dauvin, 2018; Guo et al., 2020). Land-based pollution significantly degrades water quality and poses a substantial threat to aquatic life (Smith et al., 2016). Simultaneously, destructive fishing practices exacerbate the issue by contributing to habitat loss and erosion in vulnerable ecosystems like mangroves and coral reefs (Jackson et al., 2001; Burke et al., 2011). This loss further diminishes the ecological services provided by these areas (Alongi, 2014).
The connection between forests and indigenous communities goes beyond environmental concerns, deeply entwined with their social and cultural identity. As bulldozers and logging operations encroach upon ancestral lands, indigenous communities not only face displacement but also the rupture of centuries-old connections to their land. Indigenous cultures derive medicinal, spiritual, and economic sustenance from the biodiversity within these ecosystems. The diminishing forest translates to the loss of traditional wisdom, leaving communities grappling with the loss of tangible resources and intangible cultural heritage.
Healthy marine and river ecosystems play a crucial role as natural buffers against storm surges and floods, providing a line of defence for coastal areas. These ecosystems act as effective barriers by absorbing and dissipating wave energy, thereby mitigating the impacts of extreme weather events (Narayan et al., 2016; Barbier et al., 2011). However, when mangroves, coral reefs, and other coastal ecosystems are compromised, their capacity to absorb and reduce the intensity of storm surges diminishes, leaving coastal regions more exposed to flooding and damage (Arkema et al., 2013; Gedan et al., 2011). This underscores the critical importance of preserving the health and integrity of marine and river ecosystems as a key component of resilient coastal management strategies in the face of escalating climate-related challenges.
Air pollution is a significant concern in the ASEAN region. Primary sources include industrial emissions, power generation, vehicle exhaust, and open burning, with the latter being a transboundary issue affecting multiple AMS (IQAir, 2025). Overall, the quality of air in most AMS showed improvement in 2024 compared to 2023 (Table 2.3.1). Conversely, Indonesia remains the most polluted country despite slight improvements, while the Philippines experienced a marginal deterioration. Despite these positive developments, only a small number of cities in the region have met WHO’s guideline for PM2.5 in 2024 (IQAir, 2024), underscoring the need for continued and coordinated efforts to address industrial, vehicular, and haze-related emissions.
In the pursuit of economic growth, ASEAN nations are escalating anthropogenic activities, leading to heightened carbon emissions and environmental deterioration. The region releases substantial CO2 from fossil fuel combustion (1,485 MtCO2) and Land Use, Land-Use Change and Forestry (LULUCF) (965 MtCO2-eq), particularly from forest land and cropland. Indonesia emerges as the largest net emitter, primarily due to deforestation and peatland exploitation, followed by Vietnam and Thailand (see Table 2.3.2).
The impact of severe air pollution on global public health surpasses that of smoking, affecting billions indiscriminately. Open burning by some AMS, for instance, spreads substantial pollution, impacting at least seven of the ten AMS, with Singapore and Malaysia being severely affected. The 2019 fires, covering 1.6 million hectares and causing respiratory issues for 900,000 people, incurred an estimated $5.2 billion in damages to eight provinces. The costs extend beyond the economic to the health and social well-being of affected communities, resulting in premature deaths, increased respiratory diseases, and hindered physical and mental growth in children (Faulder, 2021).
The consequences extend beyond public health, affecting ecosystems, agriculture, and climate. Airborne pollutants can lead to soil and water contamination, harming biodiversity and agricultural productivity (Dulac, Henry, & Edy, 2019). Additionally, some pollutants contribute to climate change, influencing regional weather patterns and exacerbating environmental challenges (Lelieveld et al., 2015). Addressing the complexities of air pollution in ASEAN requires coordinated efforts, including the implementation of effective emission controls, sustainable urban planning, and regional collaboration to mitigate the environmental and health impacts associated with poor air quality.
Conserving and sustaining ASEAN’s unique biodiversity comes with challenges, each carrying its consequences. Environmental dynamics demand remediation efforts; however, accurately predicting the true cost of environmental remediation is challenging due to evolving human behaviours, public policies, and emerging technologies (Kahn, 2022). This emphasises the need for wealthier countries to address their high ecological footprints and reduce emissions to equitable levels. ASEAN must unite regionally to mitigate environmental impacts and push developed nations to take responsibility for the consequences of their industrial revolutions and unsustainable growth. ASEAN needs to transition toward a more environmentally conscious mindset for sustainable and resilient development. With a healthy environment and flourishing biodiversity, ASEAN can progress economically while preserving its green heritage for future generations.
As the ASEAN region experiences accelerated growth, the challenge to efficiently sustain its growing population intensifies. From the rustling rice paddies to the flowing waterways, there is promise in the region’s resilience. Yet, challenges like climate change, population pressure, and resource scarcity loom large, necessitating proactive measures to ensure the sustainability of food and water systems. This section begins with a brief historical background of ASEAN’s food and water security trends, followed by an analysis of the main overarching challenges: climate change and its impact on food and water dynamics, resource scarcity versus population growth, and water security in meeting the growing demand for food and water.
The historical trajectory of food and water security issues in ASEAN has been shaped by dynamic environmental, socio-economic, and geopolitical factors. As the region underwent rapid economic development and urbanisation over the decades, demands for food and water surged in tandem with population growth. Climate change, with its unpredictable impacts on precipitation patterns and extreme weather events, further exacerbated vulnerabilities in agricultural practices and water management systems (Hijioka et al., 2014; Erda et al., 2019). Historical studies have underscored the intricate interplay between changing land use, deforestation, and water resource depletion, highlighting the long-standing challenges faced by ASEAN nations (Santos et al., 2018; Le et al., 2019). Additionally, geopolitical influences, such as transboundary water issues and regional conflicts, have contributed to the complexity of food and water security concerns (Keskinen et al., 2016).
The ASEAN region stands at the crossroads of climate change impact, revealing a complex interplay of factors that will reshape the agricultural landscape, alter water dynamics, and intensify the frequency and intensity of extreme weather events. The enormity of the impact of climate change is beyond concerning: we are potentially faced with a global decline in crop yields by up to 30% by 2050 (United Nations Foundation, 2020), with livestock, rice cultivation, and fertiliser production also contributing significantly to greenhouse gas emissions.
Rising temperatures could lead to changes in the distribution of crops, affecting traditional agricultural practices (Erda et al., 2019). Additionally, altered rainfall patterns may pose challenges for rain-fed agriculture, necessitating adaptive measures to ensure food security (Hijioka et al., 2014). The ASEAN region is also anticipated to experience an escalation in the frequency and intensity of extreme weather events, including storms, floods, and droughts. These events can have devastating consequences for agriculture, infrastructure, and communities (Keskinen et al., 2016). Coastal areas may face increased risks due to rising sea levels and the potential intensification of tropical cyclones, impacting both agriculture and human settlements.
The escalating impact of climate change in Southeast Asia, marked by rising temperatures, precipitation fluctuations, and sea level rise poses substantial threats to water resources. This simultaneously jeopardises human consumption and also imperils agriculture, causing erosion, sedimentation, and the infiltration of saline water, which can lead to scarcity. Elevated temperatures compound heat stress and drought, diminishing crop yields. Projections for water availability in the ASEAN region are of significant concern, with a potential decrease in water availability, especially in areas reliant on seasonal rainfall (Le et al., 2019). This poses a threat to both agricultural irrigation and general water supply, necessitating sustainable water management strategies to mitigate shortages.

The consequences of the challenges posed by climate change on food and water security are dire at best and catastrophic at worst if they are not mitigated. Changes in temperature and precipitation patterns can lead to poor harvests, affecting food production in the region. This poses a threat to food security, especially in areas reliant on agriculture for sustenance (Hijioka et al., 2014). Changing climate patterns exacerbate water scarcity, affecting both the quantity and quality of water resources (Mekong River Commission, 2019). Altered water availability and variability can impact irrigation for agriculture and general water supply for communities. This, in turn, affects water security, with potential consequences for both agriculture and human consumption (Le et al., 2019).
Rising sea levels and the potential intensification of tropical cyclones pose risks to coastal areas. This vulnerability impacts both agriculture and human settlements in these regions (Keskinen et al., 2016). Climate change can also exacerbate existing socioeconomic challenges. Vulnerable communities that rely on agriculture and have limited access to resources may face heightened risk of food shortages (Erda et al., 2019). Without a sustainable and secure source of food and water, ASEAN faces rising poverty, the spread of disease and slow economic growth.
By 2030, Asia, including Southeast Asia, is anticipated to have a population of 250 million, representing about 65% of the global middle-class population. As affluence grows in Southeast Asia, a shift is expected in dietary preferences toward protein-based options due to increased income. Figure 2.4.1 illustrates a declining trend in rice demand and consumption, while the demand for meat, eggs, and fish steadily rises—a pattern set to persist.
ASEAN is a significant agricultural producer, contributing to global markets with diverse products such as rice, palm oil, meat, eggs, cassava, coffee, coconut, and cocoa beans. Although the production landscape has remained stable, the rice share of the total gross agricultural production value has continued its decline. This shift is attributed to the sustained palm oil production, which holds higher value, contributed by Indonesia and Malaysia that accounts for over 88% of global palm oil production, overshadowing rice and other agricultural activities (OECD and FAO 2024). According to the OECD-FAO Agricultural Outlook 2024-2033, a decline in yield growth is projected for major palm oil producers, but the commodity will remain a dominant force, influencing regional agricultural trends and global vegetable oil markets.
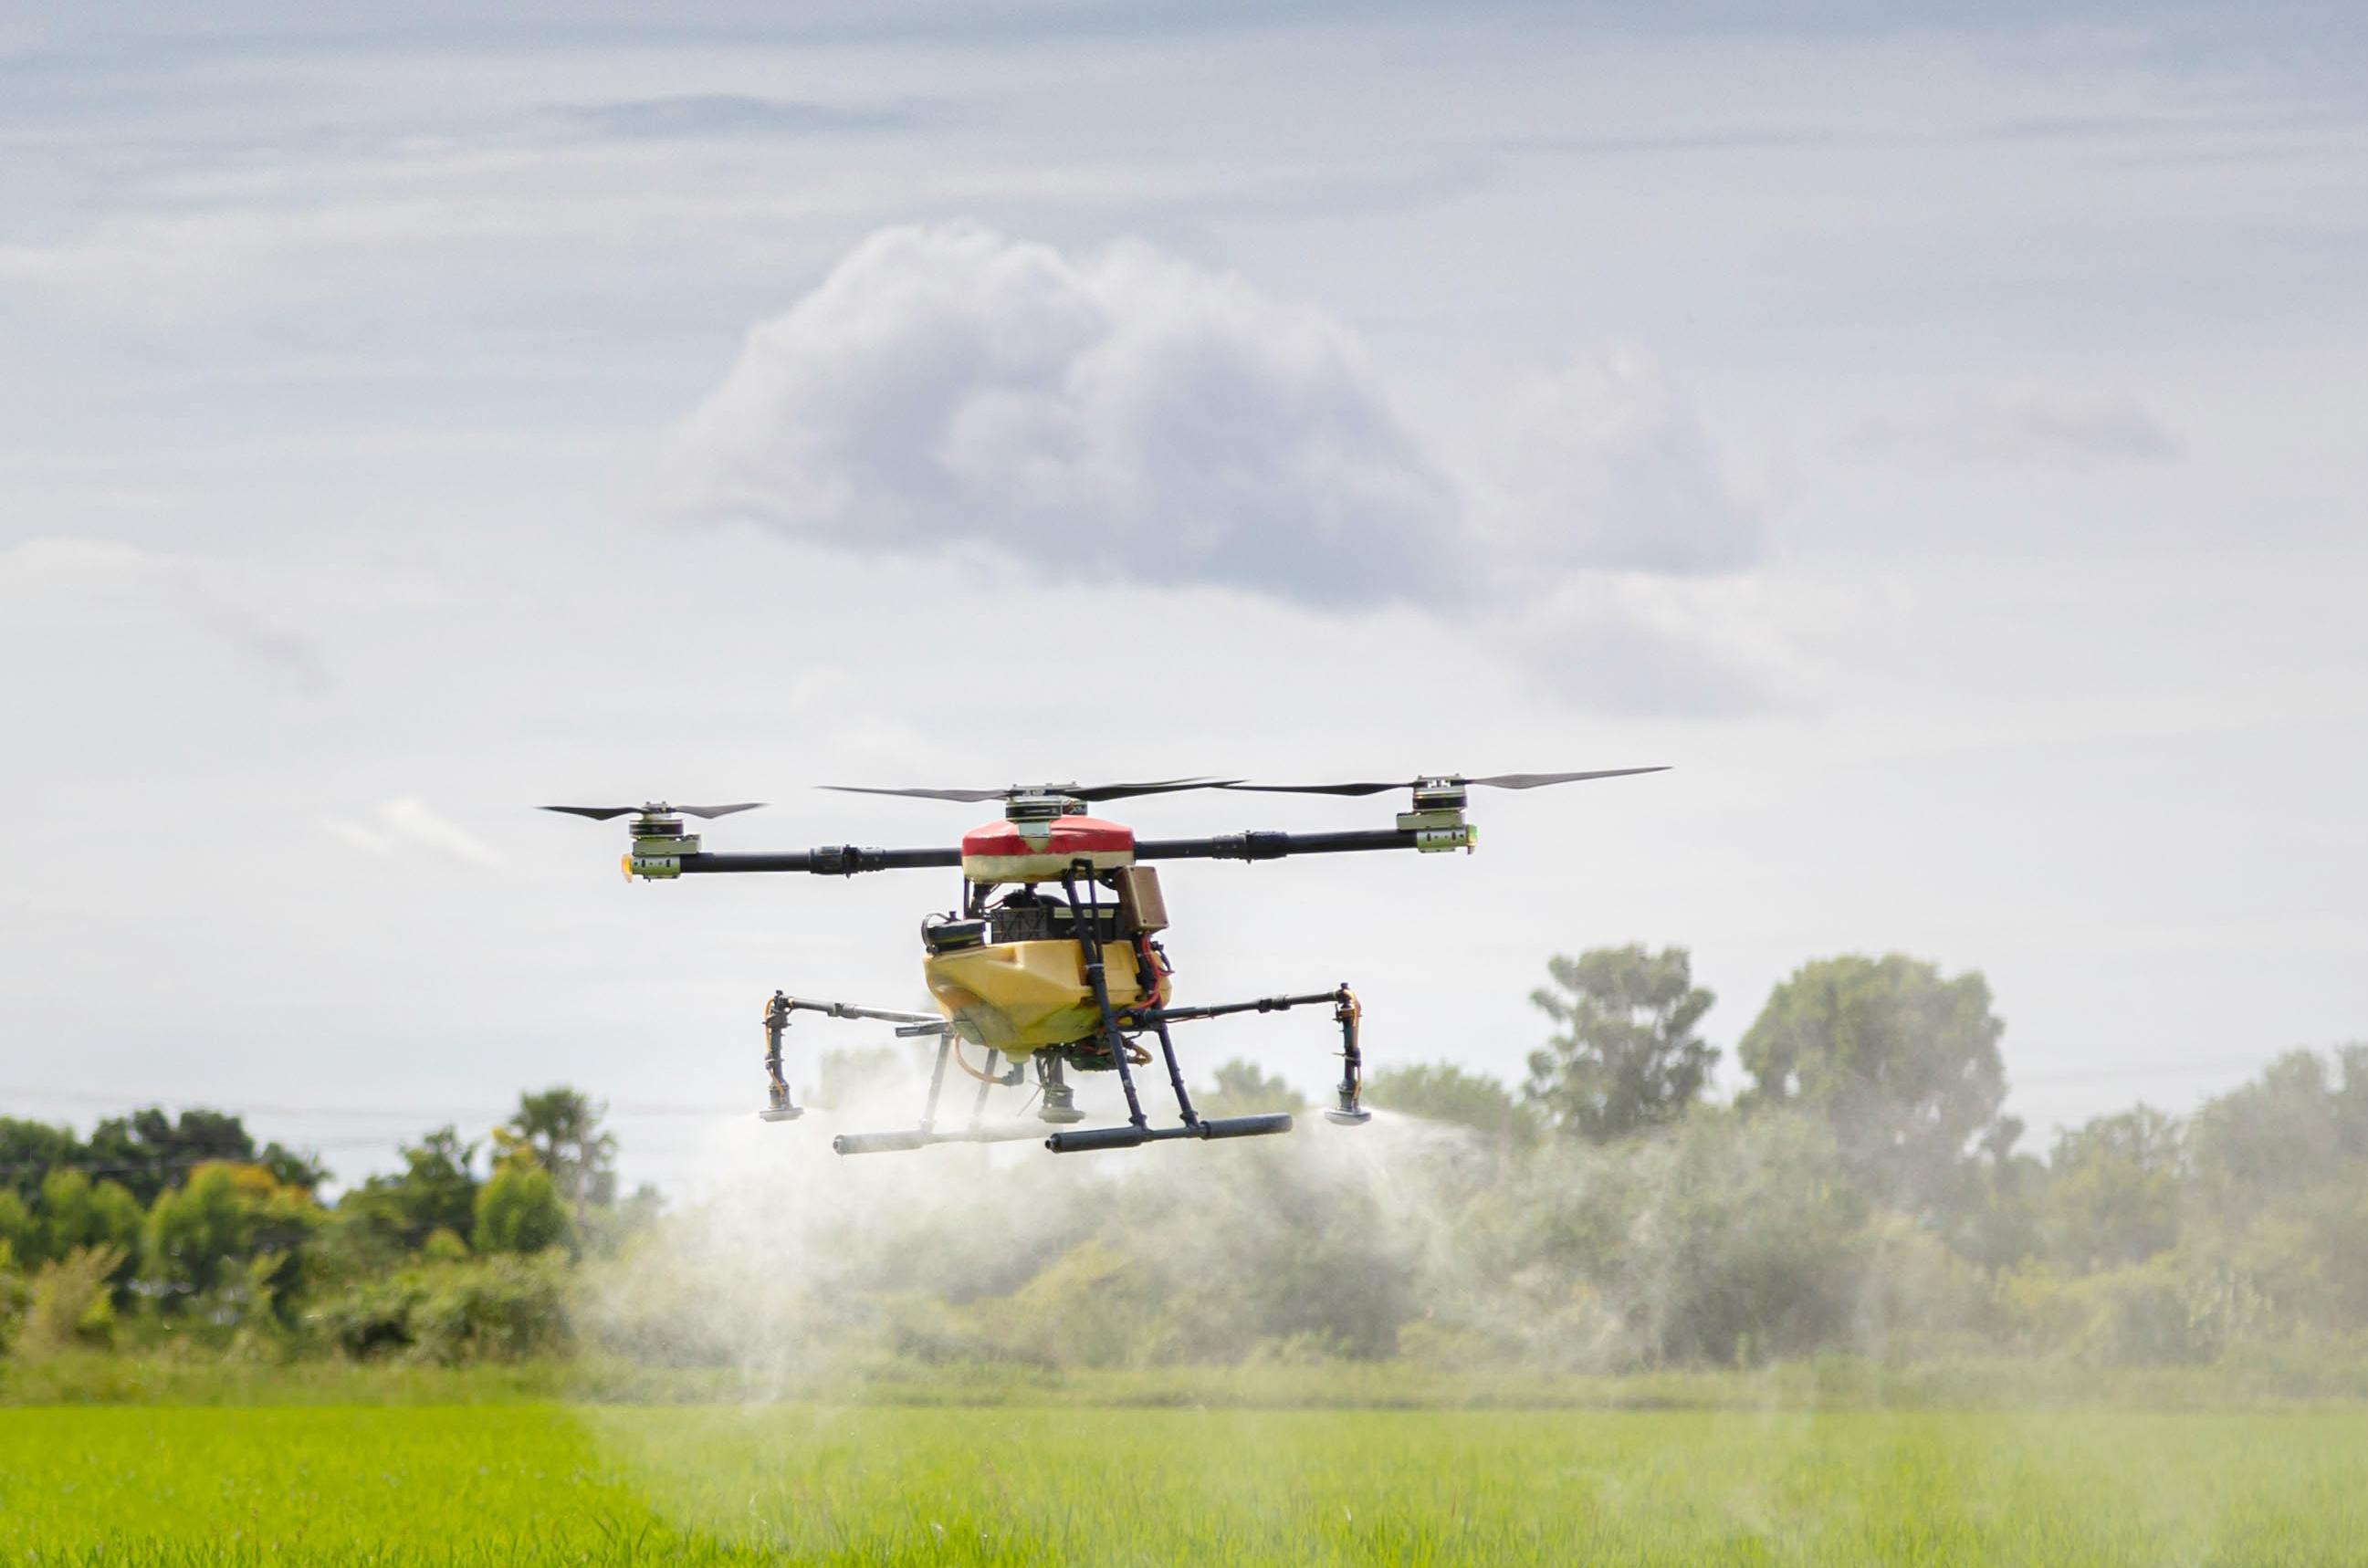
Member states like Cambodia, Vietnam, and Myanmar, are still heavily reliant on rice production, catering to local consumption demands. In contrast, economies transitioning away from agriculture prioritise profitable commodities like palm oil and sugar, benefiting from diversified import-export capabilities, including essential foods like rice and wheat (OECD-FAO, 2017). While ASEAN is undergoing an agricultural transition, it remains integral to communities, employing over 60% of the workforce in some countries, fostering growth and mitigating poverty. As a highly productive agricultural region, it was reported that in 2021, ASEAN boasts a 32.4% agricultural area-to-land area ratio, producing 20.9% of the world’s agricultural exports, surpassing China (19.0%) and the USA (11.4%) (ASEAN, 2023).
The score details of ASEAN’s food resource availability as of 2022 are shown in Table 2.4.2.
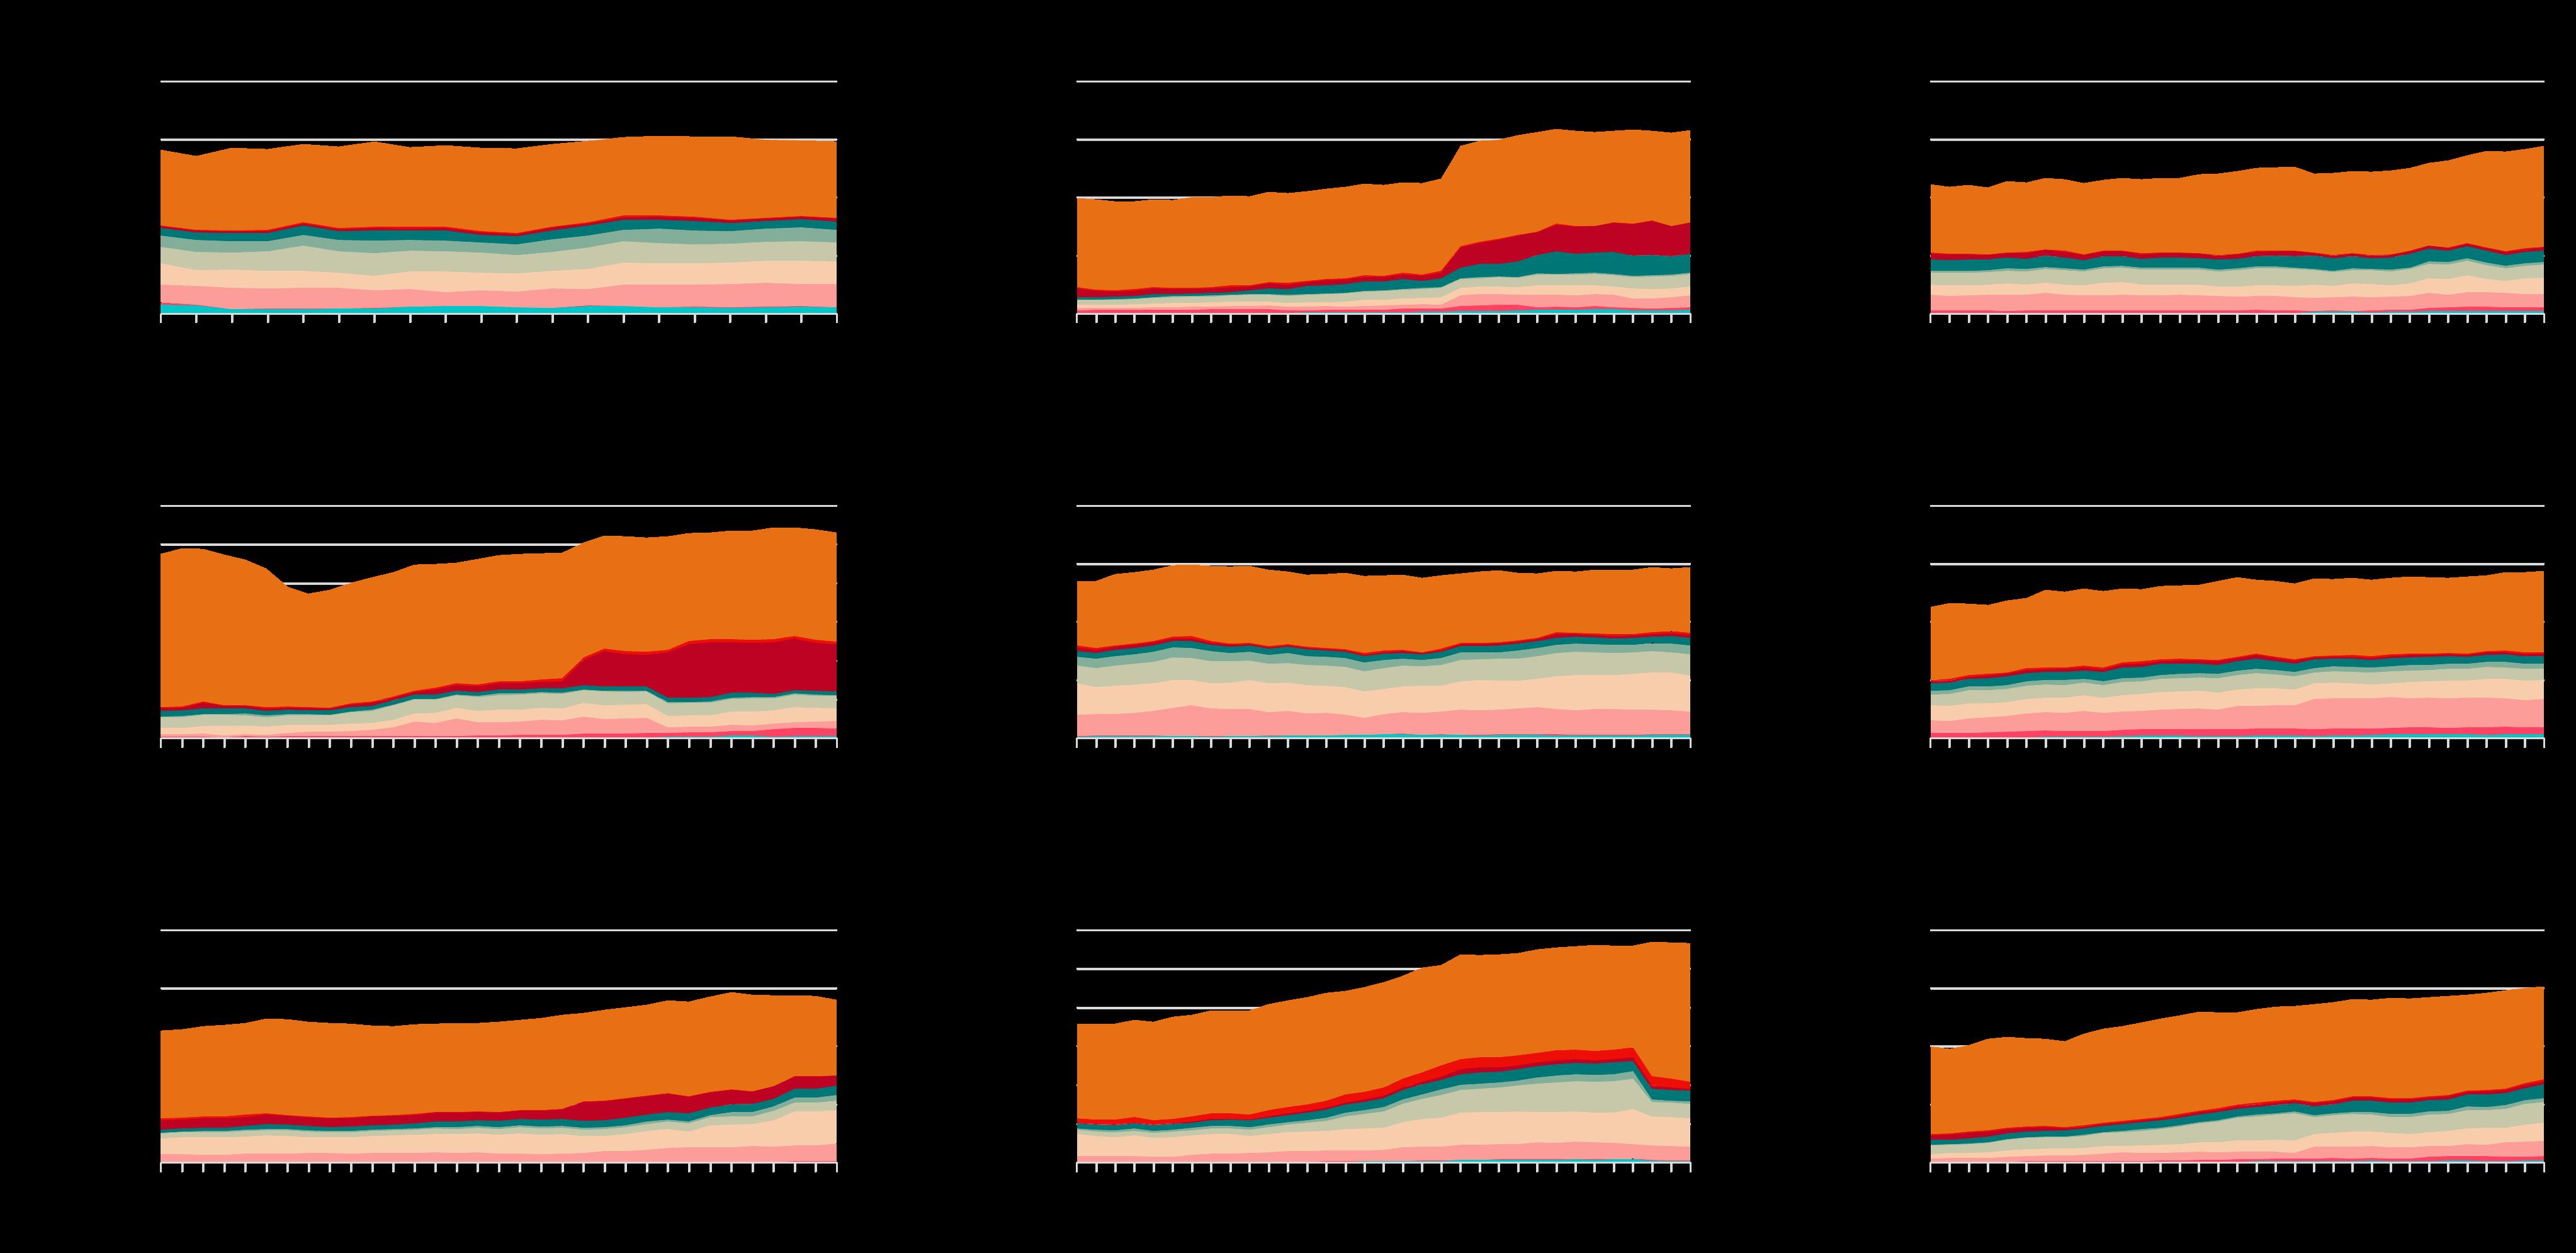
Resource scarcity and population growth in ASEAN have profound implications for food and water security. As the region experiences rapid economic development and urbanisation, the demand for resources, particularly water and food, has escalated. Population growth contributes to rural-urban migration, impacting traditional agricultural practices and creating new challenges in urban food security (Rigg, 2006).
External factors
With 9 out of 11 countries considered, ASEAN records mean average scores of 56.1%, 56.6%, and 55.5% for sufficiency of supply, food supply adequacy, and dependency on chronic food aid, compared to the world average of 61.9%, 58.5%, and 65.5%, respectively. While ASEAN averages 50-60%, some member countries, like Malaysia, the Philippines, and Cambodia, scored relatively low. Various factors contribute to this average, such as Indonesia’s ongoing challenges in meeting local food demand, exacerbated by COVID-19 restrictions hindering vital food imports. Additionally, Thailand faced a decline in sugar yield in 2020 due to drought, disrupting the entire food supply chain dependent on sugar and leading to a 19% decrease in sugar exports that year (Cogan & Scott, 2022).
Water scarcity for non-urban use
Water is increasingly needed for both domestic and industrial purposes to cater to the urban population (Hoekstra et al., 2012). Outside of urban areas, agriculture, a significant water consumer, faces increased demand to feed the growing population. This puts pressure on water resources for irrigation (Brauman et al., 2013). As populations rise, there is a higher reliance on food imports, making countries vulnerable to global market fluctuations and supply chain disruptions (Lam et al., 2015). Smallholder farmers, a significant portion of the population, face challenges in meeting the increased demand for food, impacting their livelihoods (FAO, 2013). The water-food nexus thus becomes evident, with water scarcity affecting agricultural productivity and food production (FAO, 2018).
Water security, which is ensuring adequate and safe water supply, sanitation, and healthy ecosystems, is crucial for sustainable economies. ASEAN has made positive strides towards achieving SDG targets, with Singapore leading in circular water management. Malaysia and Thailand have recorded high coverage for safely managed drinking water, with over 90% of their populations having access as of 2022. In contrast, countries such as Laos, Myanmar, and Indonesia continue to struggle for safe drinking water supplies, with a significant portion of their populations lacking access to safely managed services (Figure 2.4.3) (UN Water, 2022).
The impact of economic factors on food production within ASEAN nations, exemplified by Malaysia’s shift to crops for higher profits, presents a significant challenge to the region’s preparedness for health disasters. This economic decision, driven by profit motives, has led to a situation where crops like palm oil are primarily cultivated for export rather than domestic consumption. Notably, multinational corporations (MNC) play a role in this dynamic by purchasing these crops and selling back processed foods to ASEAN nations at elevated prices. This reliance on imported processed foods creates a dual problem: heightened food insecurity and adverse health outcomes. The impact of global agribusiness on food security highlights the dynamics at play in ASEAN’s food production landscape (Clapp and Moseley, 2015), which needs to be addressed if ASEAN is to have sustainable and accessible food systems.
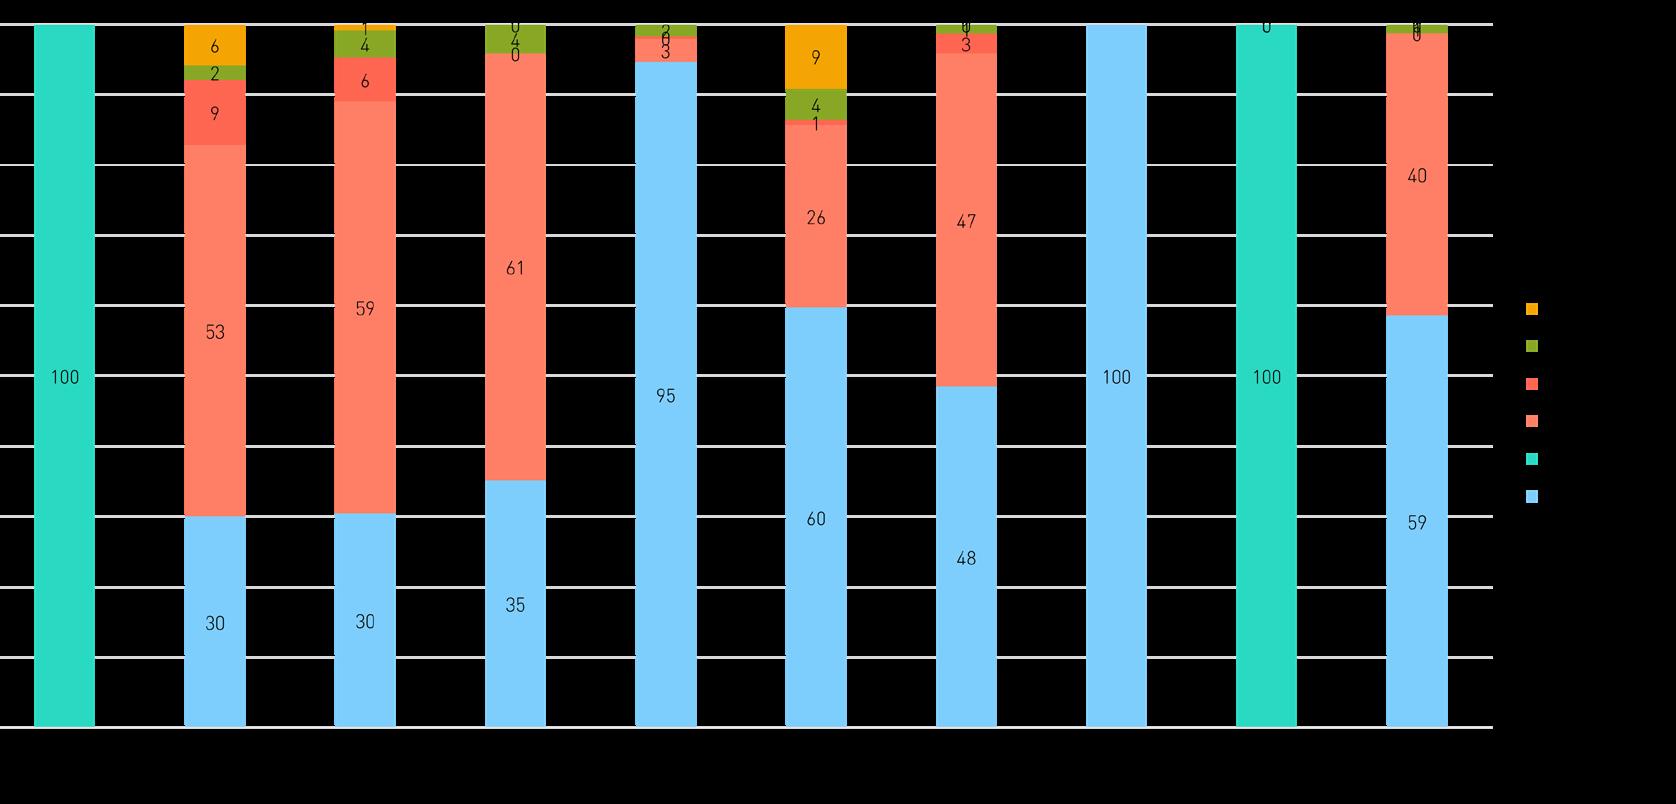
AMS withdrawals for freshwater in 2021 range from 90 million m3 to 220 billion m3 annually, for agriculture, industry, and municipal purposes, including desalination (estimated ASEAN total annual freshwater withdrawals are ~500 billion m3). In comparison, China and the United States used 568.48 billion and 444.4 billion, respectively, in 2021 (FAO of the UN, OECD, & World Bank, 2025).
Agriculture heavily relies on approximately 70% of the water supply, a vital input for sustained production and food security. Irrigated agriculture, which covers 20% of cultivated land, contributes significantly to global food production, being twice as productive per unit of land compared to rainfed agriculture (Ingrao et al., 2023). However, varying water footprints among crops, especially rice, a major ASEAN product, highlight the environmental impact of water usage. Thus, careful water management is paramount for ensuring ongoing food security.
Geopolitical issues
One prominent aspect of water security in ASEAN is the management of transboundary rivers, with the equitable distribution of water resources among member states posing a complex challenge. There is a crucial need for effective transboundary water governance frameworks to ensure fair and sustainable water utilisation, especially in river basins shared by multiple nations (Keskinen et al., 2016). For instance, the Mekong Delta relies on Chinese waters during low rainfall, crucial for rice and fruit production. The strategic positioning of dams influences downstream water availability, impacting agricultural and economic activities. Dams obstruct water flow, decreasing downstream countries’ access from 40% to critical levels. Upstream dams also hinder sediment flow, reducing the income earned by fisheries.
Despite the Mekong River Basin impacting five countries, China’s absence from the Mekong River Commission hampers sustainable resource management, emphasising the need for equitable cooperation and deft navigation of regional hydropolitics (Heng et al., 2016) to avoid the tragedy of the ‘commons’ scenario. Territorial disputes and competing claims over water-rich areas add layers of complexity to water security. The South China Sea, a focal point of geopolitical tensions, is home to contested maritime territories. These disputes impact the allocation of maritime resources, including fisheries and potential offshore oil and gas reserves, influencing both water and food security (Xu and Chen, 2019).
Conclusion
Water security and sustainability
Southeast Asia faces increasing water stress due to growing populations, urbanisation, and climate change impacts. In addition to quantitative challenges, water quality issues persist, posing threats to public health and ecosystems. The degradation of water quality is exacerbated by agricultural runoff, industrial discharges, and inadequate sanitation infrastructure. The uneven distribution of water resources among AMS further compounds the challenge, necessitating collaborative transboundary water management strategies (Cook and Bakker, 2012). Institutional and governance issues, including regulatory frameworks and enforcement mechanisms, play a crucial role in addressing water security challenges in the region (Vörösmarty et al., 2010). As ASEAN nations strive for sustainable development, it is imperative to tackle these water security challenges collectively and monitor ASEAN member states’ water footprint in managing water resources.
Ensuring food and water security as well as sustainability is vital in ensuring ASEAN’s continuous economic growth and socio-economic development. As a region, ASEAN must strengthen its food supply chain and intra-regional trade to enhance food availability, readiness, and self-sufficiency. The more the intra-regional supply chain is interlinked, the more secure and resilient it will be – any surplus or deficit in the supply chain will be equitably distributed and shared amongst AMS.
To address these challenges, ASEAN needs collaborative, sustainable water management practices, advanced technologies, and adaptation strategies for agriculture. Failure to address these issues could lead to food shortages, environmental degradation, and heightened vulnerability to external shocks, posing significant risks to the region’s overall well-being.
Asia is anticipated to face a concerning energy dynamics scenario. Projections until 2035 indicate that Asia will generate less than half of its energy requirements, despite contributing nearly half of the global GDP (Asian Development Bank, 2011). While ASEAN is generally considered an energy surplus area, the energy endowment varies widely among its member states. Thailand, the Philippines, Singapore, and Vietnam are identified as large energy-deficient nations, in contrast to Lao PDR, Malaysia, and Indonesia, which are in a relatively better position. However, by 2035, except for Brunei, all ASEAN countries are projected to face energy deficits. This section discusses energy security from three main perspectives: resource availability, environmental sustainability, and energy equity, as well as the consequences and challenges that follow.
ASEAN, ranking as the world’s fourth-largest energy consumer, heavily relies on fossil fuels, constituting approximately 83% of the energy mix in 2020, while renewables make up 14.2% (ASEAN Center for Energy, 2024). As of 2023, ASEAN continues to be heavily reliant on fossil fuels, with approximately 80% of its energy consumption derived from coal, oil, and natural gas, while renewables account for 15.6% of the total primary energy supply (ASEAN Centre for Energy, 2023; Ember, 2024). This substantial dependence heightens vulnerability to energy price shocks and supply constraints, impacting energy security, economic stability, and geopolitical risks. Forecasts indicate a tripling of ASEAN’s energy demand by 2050 compared to 2020 levels, driven by rapid population and economic growth, with a projected 4% annual increase in energy demand contributing to 7.5% of global consumption by 2025. In 2023, ASEAN’s electricity demand grew by 3.6%, entirely met by fossil fuels, highlighting the urgency for a transition to cleaner energy sources (Ember, 2024).
Notably, Cambodia, Thailand, the Philippines, and Singapore operate as Energy Net Importers, emphasising the critical need to secure energy supplies. In contrast, the other six ASEAN nations, including Brunei, Indonesia, Laos, Malaysia, Myanmar, and Vietnam, function as Energy Net Exporters, focusing on maintaining stable demand. ASEAN’s combined crude oil reserves reached 11.9 billion barrels in 2023, marking a 1.25% increase from 2022 (ASEAN Centre for Energy, 2024). Since 2005, ASEAN has transitioned into a net oil importer, with a 20% decline in oil reserves to 10.9 billion barrels by 2022, posing increased susceptibility to supply disruptions and oil price fluctuations (ASEAN Centre for Energy, 2024). The region faces a parallel trend in declining gas reserves, further accentuating its vulnerability in the coming years.
Energy efficiency
The drive for electrification initiatives in ASEAN seeks to reshape energy consumption, reducing dependency on fossil fuels and curbing carbon emissions for a positive environmental footprint. ASEAN Centre for Energy (2022) anticipates a substantial 39.6% reduction in total energy demand by 2050, achieved through increased shares of electricity, natural gas, and biofuels. ASEAN has implemented measures such as energy-efficient building standards, industrial energy management to minimise wastage, the establishment of minimum energy performance standards for appliances, and the promotion of nonmotorised transportation options. These efforts aim to reduce energy intensity and support the region’s transition towards sustainable energy consumption (ASEAN Centre for Energy, 2023). These initiatives, enhancing energy efficiency across sectors, not only optimise operations and lower costs but also contribute significantly to sustainability goals, aligning with the 2060 net-zero target.
External factors
The energy supply-demand outlook presents several challenges. The 2022 Russia-Ukraine war has brought the energy crisis closer to home, resulting in a global shortage and a surge in oil and gas prices. This has particularly impacted nations heavily reliant on imported oil and gas, leading to increased costs for industries and contributing to inflation. Despite these adversities, substantial efforts have been made to address the situation. As noted by the ASEAN Centre for Energy (2022), the implementation of energy efficiency improvements and conservation measures over the past decade has effectively kept the overall growth in energy demand below 2.6% from 2005 to 2020, despite higher GDP growth. These measures demonstrate the governments’ effective control over energy demand, even in the face of challenging external factors. In 2023, continued energy efficiency and conservation measures helped maintain demand growth under 3.6%, despite rising economic activity (Ember, 2024).
ASEAN’s journey towards environmental sustainability is a complex but coordinated effort, centred on tackling the region’s high carbon emissions. In 2017, the energy sector was the largest contributor, accounting for 73.2% of total emissions, followed by industry and agriculture at 13.3% and 11.4%, respectively (ASEAN Centre for Energy, 2020). Despite rising demand, all AMS have committed to phased emission reductions aligned with global net-zero goals. Most AMS have set ambitious goals to achieve energy sustainability and net zero by 2050, though some have different timelines. Indonesia aims for 2060, Thailand for 2065, and Myanmar has a specific target for forestry and land use by 2040. The Philippines, while not having a net-zero pledge, has set its own ambitious conditional targets (ASEAN Centre for Energy, 2024) (Table 2.5.1).
Table 2.5.1 Overview of AMS Targets on Energy Sustainability
8th ASEAN Energy Outlook 2023 – 2050, ASEAN Centre for Energy,2024
Country Sector
Demand
• Increase the total share of EV
Supply
Access
Demand
Supply
Access
Demand
Supply
Access
Demand
Supply
Official Target
• Increase the total share of RE to at least 30% of total capacity in the power generation mix by 2035
• 200 MW target for solar capacity by 2025 and more than 600 MW by 2035
• Fully electrified by 2030
• Reduce energy consumption-thermal and electrical-by 19% by 2030 to a BAU trajectory1
• Public transport will have a 30% share in urban areas by 2050
• Moderate penetration for EVs: 70% for motorcyles, and 40% for cars and urban buses by 2050
• Compresses natural gas (CNG) penetration of 80% for interregional buses and 80% trucks until 2050
• Aiming to achieve a minimum of 70% renewable energy capcity by 2030
• Reach 100% electrification rate by 2025
• Reduce energy intensity (TPES per GDP) by 1%/year through 2025
• Achieve 2 million units of electric cars and 13 million units of electric motorbikes by 2030
• Increase RE share to 19% in TPES by 2025 and 25% by 2033
• Biodiesel blending ratio targets 30% by 2025 and 50% by 2050; Bioethanol blending ratio of 20% by 2025 and 50% by 2050
• The nuclear power plant is scheduled to commence operations in 2032 with a capacity of 250 MW, gradually increasing to 9 GW by 2060
• Increase the electricity access rate to 98% of total households by 2025
• Reduce TFEC by 10% by 2030 and 20% by 2040 as compared to the Baseline3
• Introduction of 50,000 energy-efficient cook stoves by 2030 (energyefficient gasifier cookstoves using biomass pellets)
• 30% share of RE in total energy consumption by 2025, including 20% renewable electricity share (excluding large-scale hydro) and 10% biofuel share (blending ratio 5%-10%)
• 13 GW total hydropower capacity (domestic and export use) in the country by 2030
Demand
Supply
Access
• By 2040, achieve energy savings of 21% compared to the BAU scenario
• Elevate the public transport modal share to reach 40% by 2040 and 60% by 2050
• Accelerate the penetration of xEV (4W) share of the vehicle fleet to 80%
• Accelerate the penetration of electric two-wheelers’ (E2W) share of the vehicle fleet to 80%
• Maintain the pathway towards achieving a 5% share of rail freight modal utilisation by the year 2030
• 5% of heavy vehicles utilise hydrogen by 2050
• Increase the RE share to 31% in the power capacity mix by 2030 and 40% by 2035
• Biogas is expected to be about 60 million m3 by 2030 Malaysia
• Increase biodiesel blending targets to 30% (B30) by 2030
• Up to 47% sustainable aviation fuel (SAF) blending mandate by 2050
• Increase electricity access rate to 100% by 2030
• Transport: Reduce consumption by 20% by 2030 (raise fuel efficiency and EV share)
Demand
• Industrial: reduce consumption by 3.6% by 2020, 5% by 2025, 6.6% by 2030
• Commercial/Residential: reduce consumption by 7.4% by 2020, 10% by 2025, 12% by 2030
• 5% reduction by 2025 and 7% by 2030 in traditional biomass use, relative to 2012 levels, via the promotion of energy-efficient cooking stoves
Supply
Access
Demand
Supply
• Increase the RE share to 39% in electricity generation by 2030 (28% hydro and 11% other RE)
• Achieve a 100% household electrification rate by 2028
• Total energy saving by 2040: Transport 25%, Industry 15%, Residential 20%, Commercial 25%, Agricultural 10%
• Reach at least a 10% EV share for road transportation (including motorcycles, cars, jeepneys) by 2040
• Aim for at least 35% RE share in the power generation mix by 2030, 50% share by 2040, and more than 50% by 2050
• 1,200 MW Nuclear Energy by 2032, 2,400 MW by 2035, and at least 4,800 MW by 2050
• Reduce energy consumption in residential (existing HDB towns) by 15%
Demand
Supply
Demand
Supply
Demand
• Implement green buildings to see an 80% improvement in energy efficiency (over 2005 levels) by 2030
• Achieve 100% cleaner-energy public bus fleet and taxis by 2040 (electric or hybrid vehicles)
• Increase solar energy deployment to at least 1.5 GWp by 2025 and 2 GWp in 2030
• 200 MW of deployed energy storage systems beyond 2025
• Decrease energy intensity by 30% of the base year in TFEC compared to 2010 level by 2037
• Achieve 30% EVs manufactured and sales by 2030
• Increase the RE share to 30% in TFEC by 2037, which equates to 26.26% renewable electricity in total electricity generation; 39.32% of consumed heating from renewables in total heat consumption; 11.74% consumed biofuel in total oil fuel consumption in the transport sector
• By 2025, reduce energy intensity in TFEC by 5%-7% and keep power losses under 6.5%
• By 2030, reduce energy intensity in TFEC by 8%-10%, keep power losses under 6%, and reduce fuel and oil consumption by 5% in transportation
• Energy saving to 10% in 2030 and 20% by 2050
• The proportion of RE in the TPES will be 15%-20% by 2030
• Green hydrogen production will reach between 100,000 and 200,000 tonnes annually by 2030
• Renewables are t o account for about 30.9-39.2% of Vietnam’s electricity supply by 2030
Supply
• By 2030, electricity exports should be scaled-up to about 5,000 to 10,000 MW
• Increase the absorption area of solar hot water rigs in commercial, service, civil, and industrial production, providing about 3.1 Mtoe by 2030
• Total RE sources for heat production and co-generation of thermal power in 2030 will be about 8 to 9 Mtoe
These commitments are outlined in each country's Nationally Determined Contributions (NDCs). By 2030, unconditional NDCs are measured against a business-as-usual scenario, with countries like Brunei, Indonesia, Lao PDR, and Thailand committing to significant reductions (Table 2.5.2) . Malaysia is targeting a 45% reduction in carbon intensity from its 2005 levels, while Vietnam pledges a moderate reduction. Conditional pledges, which reflect deeper cuts, are particularly ambitious in Cambodia, Indonesia, and the Philippines (ASEAN Centre for Energy, 2023). This collaborative approach demonstrates a unified regional strategy to meet shared climate goals (ASEAN Centre for Energy, 2020; 2023). The ASEAN capability-building roadmap for energy investment (2023–2025) is a key part of this strategy, designed to strengthen the institutional, regulatory, and financial frameworks needed to attract sustainable energy investments (ASEAN Centre for Energy, 2020; 2021; 2023).
Cooperation (APAEC) 2016–2025 (ASEAN Centre for Energy, 2021). On a broader scale, the Asia–Pacific region is a global leader in clean energy investments, surging to US$345 billion in 2022, representing 65% of global investment, a 13% increase from the previous year (Zero Carbon Analytics, 2023).
Beyond renewables, ASEAN is gradually exploring nuclear energy as a complementary low-carbon option. Several countries have concrete plans to introduce it into their energy mix. Thailand's Power Development Plan (2015–2036) aims to introduce nuclear energy to contribute up to 5% to its fuel requirements by 2036, with plans to add 2,000 MW of nuclear capacity. Similarly, Indonesia intends to build a new nuclear power plant by 2039 to help meet its 2060 net-zero goal. The Philippines and Vietnam are also developing their own nuclear infrastructure, with Vietnam targeting its first plant by 2030. These initiatives are supported by the ASEAN Centre for Energy's efforts to develop the necessary human resources and regulatory frameworks for a safe and effective transition to nuclear power (ASEAN Centre for Energy, 2024). Although the adoption of nuclear energy in ASEAN is in its early stages, the positive trend is evident as countries explore the potential of nuclear energy in their policy frameworks.
(sectoral targets)
A major focus of this transition is renewable energy. Fortunately, ASEAN is endowed with abundant natural resources, including critical materials like bauxite, nickel, tin, and rare earth elements across member states, providing a competitive advantage on the global stage. Over the past decade, the region has experienced robust growth in renewable energy. In 2022, the share of renewables in the region’s Total Primary Energy Supply (TPES) reached 15.6%, up from 14.2% in 2020 (ASEAN Centre for Energy, 2024). This progress, however, is still below the 23% target set for 2025 under the ASEAN Plan of Action for Energy
Transitioning to global renewables is vital for planetary health and achieving net-zero goals. The primary challenge facing ASEAN in adopting renewable energy lies in establishing an enabling regulatory framework and policies. Upgrading clean energy policies is crucial for reshaping the energy industry, attracting investments, and accelerating sector development. A business-friendly environment and a robust regulatory framework can drive clean energy investments, leading to economies of scale and competitive pricing compared to fossil fuels. As of 2023, solar photovoltaic (PV) costs in the Asia Pacific region saw a significant decline of 23%, marking the end of two years of supply chain disruptions and inflation, and utility-scale solar PV emerged as the cheapest power source in 11 out of 15 countries (Wood Mackenzie, 2024). Countries like Thailand and Vietnam have introduced more aggressive feed-in tariffs (FiTs) for solar PV, reflecting the growing economic case for renewable energy. For instance, in early 2023, Vietnam set prices of $51/MWh for solar PV, $68/MWh for onshore wind, and $78/MWh for offshore wind (Renewable Energy Institute, 2023). The declining costs of renewable energy technologies, coupled with supportive policies, present a significant opportunity for ASEAN to accelerate its transition to clean energy; however, establishing a robust regulatory framework remains essential to attract investments and ensure the sustainable development of the renewable energy sector.
The second critical driver for energy transition is securing investments for economies of scale and meeting regional sustainability goals. Major oil and gas companies in the region, including PETRONAS and PTT Public Company Limited (PTT), are increasingly diversifying into renewable energy to support clean energy targets and strengthen long-term resilience. PETRONAS, through its subsidiary Gentari, has secured 7 GW of renewable energy capacity currently installed or under construction (Gentari, 2025).
In Malaysia, it signed a landmark PPA to deliver 4.3 MWp of solar power across six Telekom Malaysia facilities, generating 4.82 GWh annually (Gentari, 2025). Moreover, Gentari’s 80 MW wind energy project in Tamil Nadu, slated for mid-2027 commission, is expected to generate 300,000 MWh per annum, supported by a PPA with AWS (Gentari, 2025). Thailand’s PTTEP plans to invest $5.3 billion in 2025 to enhance core assets and accelerate overseas development projects, allocating $1.75 billion for wind energy, carbon capture and storage, hydrogen, and corporate venture capital initiatives (Qu, 2024). Indonesia’s Pertamina is constructing a 1.4 GW solar panel manufacturing facility in West Java in partnership with LONGi, strengthening the nation’s renewable energy supply chain (Bellini, 2025). Brunei Shell Petroleum contributed to Brunei’s renewable energy targets through a 3.3 MWp solar photovoltaic plant launched in 2021, supporting the country’s transition to a low-carbon economy (BSP, 2021).
These investments advance research and development, foster sustainable practices, attract green investments, and facilitate the growth of the green economy. Diversification into sectors such as transportation, industry, and smart city development underscores the importance of securing financial commitments toward renewable energy for a sustainable future. The rising trend of ASEAN oil and gas companies engaging in renewable energy R&D and businesses is evident. This diversification fosters sustainable practices, positively impacts the environment and biodiversity, attracts green investments, and fuels the expansion of the region’s green economy. Energy diversification also cascades into transportation, industry, and smart city development. Hence, securing investments towards this end remains crucial.
The advancement of green technology is pivotal for ASEAN’s energy transition and regional energy security. Clean-energy investment across ASEAN averaged US$72 billion per year between 2022 and 2024; however, it must rise to over US$130 billion annually by 2030 to achieve the region’s declared ambition under the ASEAN Plan of Action for Energy Cooperation (APAEC). Today, ASEAN accounts for just 2% of global clean-energy investment, despite representing nearly 5% of global energy demand (International Energy Agency, 2024).
R&D in green technologies, supported by major conglomerates, is essential to ASEAN in the clean energy value chain. Within ASEAN, Singapore has emerged as a frontrunner through grid-flexibility pilots and its Green Data Centre Roadmap, while Malaysia’s National Energy Transition Roadmap (NETR) has already mobilised RM25 billion in investments under Phase 1, supported by a RM2 billion seed fund, with projected creation of 23,000 jobs and reductions of 10 million tonnes of CO₂-equivalent annually (IEA, 2023; PwC Malaysia, 2023). Together with cross-border power integration under the ASEAN Power Grid (e.g., the Lao PDR–Thailand–Malaysia–Singapore Power Integration Project), these initiatives illustrate how knowledge transfer and collaboration are moving ASEAN from a technology user to a technology provider.
Strengthening R&D capabilities through knowledge transfer and ASEAN collaboration will, therefore, position the region to evolve from a technology user to a provider in these sectors. ASEAN’s rapid economic growth will continue to strain biodiversity and increase vulnerability to climate change. The region already records 5,776 threatened species (ASEAN SOER-6, 2024), and projections indicate a sea level rise of 20–30cm by the 2050s compared to the 1995–2014 baselines, placing major ASEAN cities, such as Bangkok, Jakarta, and Manila, at heightened flood risk (UK Met Office, 2025). In response, ASEAN has become increasingly active in green technology investment to safeguard both the energy transition and regional energy security, as illustrated by a range of flagship initiatives across its member states.
Energy equity is a cornerstone of sustainable development in ASEAN, as equitable access to electricity is fundamental to improving the quality of life, fostering economic growth, and reducing regional disparities. Reliable electricity enables essential services such as education, healthcare, and digital connectivity, particularly in rural and remote areas. Without equitable energy distribution, communities remain disadvantaged, and development gaps persist between urban and rural populations.
Electricity accessibility in ASEAN varies widely. While Singapore and Brunei approach nearuniversal access, other member states face considerable challenges. As of 2023, Indonesia's overall electrification rate stood at 99.8% (World Bank, 2023), yet certain remote areas continue to experience unreliable power supply due to infrastructure limitations (Indonesia Investments, 2023). In Laos, the national electrification rate reached 95.3% in 2021, with ongoing efforts to achieve universal access (World Bank, 2023).
To address these challenges, AMS have implemented a combination of national and regional initiatives. Nationally, governments have focused on expanding rural electrification, deploying renewable energy projects, and modernising grid infrastructure. At the regional level, the ASEAN Plan of Action for Energy Cooperation (APAEC) 2016–2025 emphasises the role of smart microgrids, renewable energy integration, and energy efficiency measures to support energy equity.
The ASEAN Integrated Power Grid (AIPG), initiated in 1997 and officially launched in 2007, aims to enhance energy security by creating an interconnected transmission network. The AIPG operates through three main subsystems: the North Subsystem (linking Vietnam, Lao PDR, Thailand, Myanmar, and Cambodia), the East Subsystem (connecting the Philippines, Brunei, and Malaysia), and the South Subsystem (linking Singapore, Malaysia, and Indonesia). The grid currently has an existing interconnection capacity of 7,700 MW, with an additional 1,245 MW in projects underway through 2025, and a goal of achieving a grand total capacity of 17,550 MW by 2040. This collaboration reduces reliance on fossil fuels, encourages renewable energy adoption, and ensures a stable power supply during emergencies, fostering rural development and minimising development gaps across AMS. These microgrids, powered by renewable energy, offer localised generation beyond the traditional grid, promoting energy equity in rural and mountainous areas. Smart microgrids also integrate seamlessly with Electric Vehicles (EVs), contributing to increased EV penetration in the local energy system.
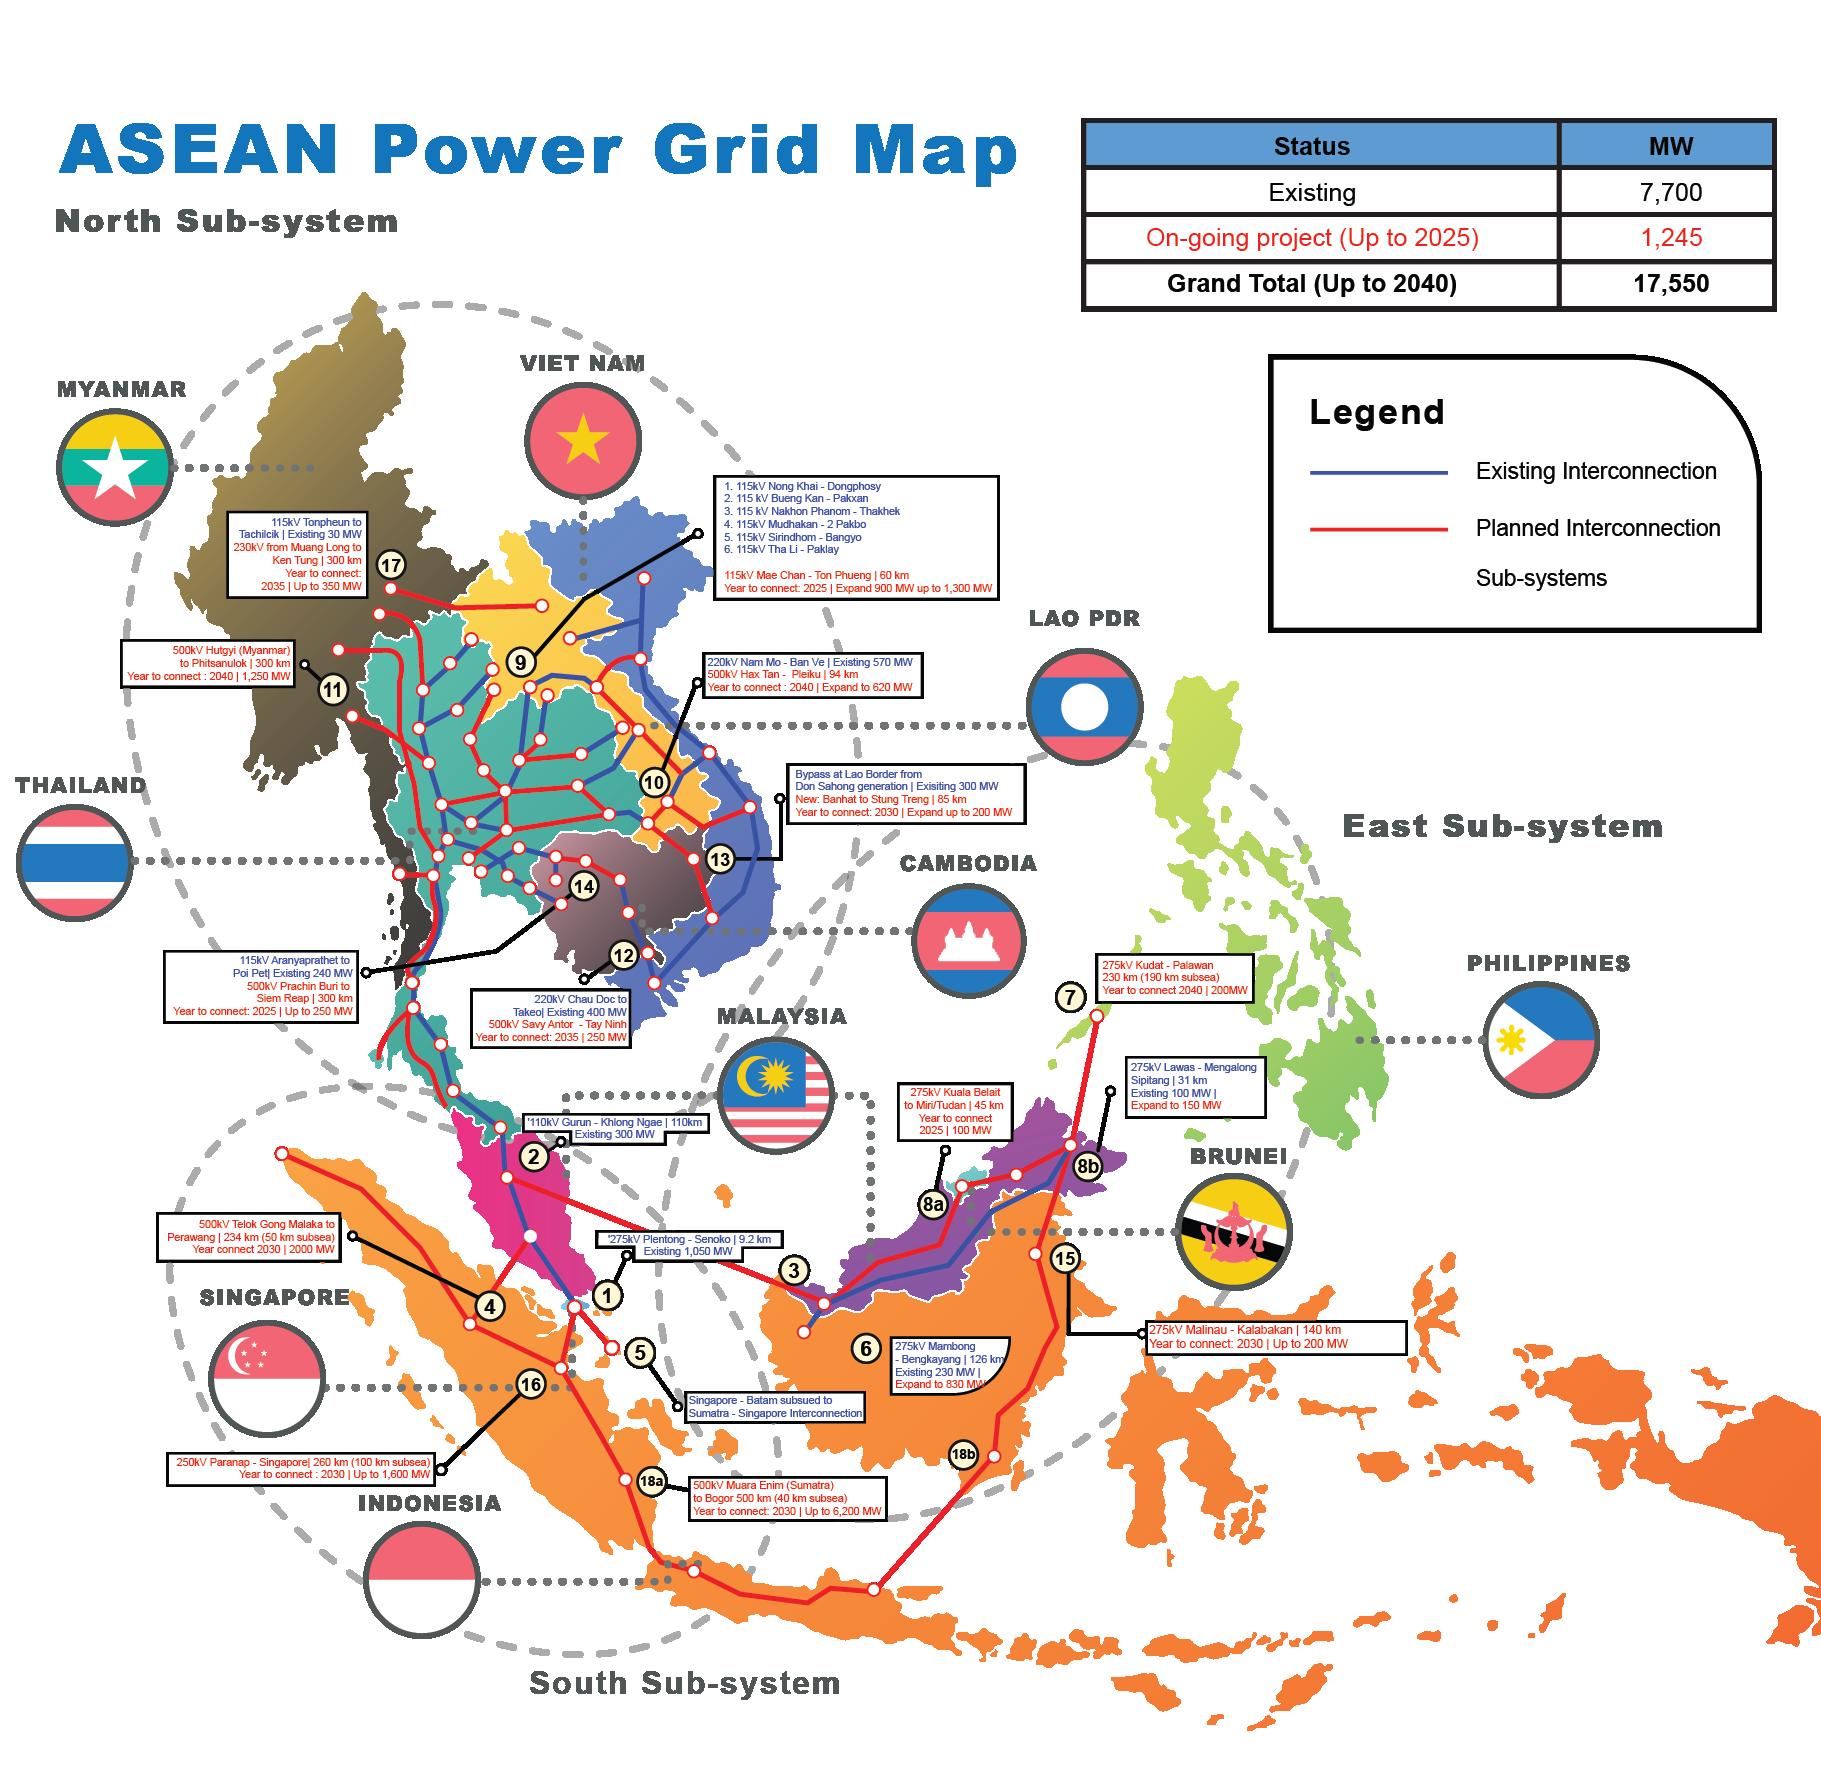
Historically, ASEAN has exported energy resources mainly to major importers such as Japan, China, and Australia. In 2023, however, ASEAN’s overall exports remained relatively modest compared to major global producers (ASEAN Centre for Energy, 2023). In 2023, about 76 –80% of ASEAN’s natural gas exports were shipped to countries outside the region. It also states that Japan, China, and the Republic of Korea together accounted for approximately 95% of those extra-regional exports (ASEAN Centre for Energy, 2024). This underscores the importance of diversifying the region’s energy trade to strengthen energy security and reduce reliance on external markets.
If energy efficiency measures fall short, ASEAN nations may become more vulnerable to volatile oil and gas prices, raising the cost of essential goods (Zero Carbon Analytics, 2024). Although Malaysia, Thailand, and Vietnam have renewable energy targets, challenges remain in tariffs and remuneration mechanisms, with variable renewable energy still under 5% of electricity generation in most countries (Agora Energiewende, 2024). The nascent clean energy sector faces limited financing experience, slowing investment (IEEFA, 2024). Without faster regulatory reforms, ASEAN risks stagnant clean energy development despite strong FDI inflows (ASEAN Secretariat, 2023).
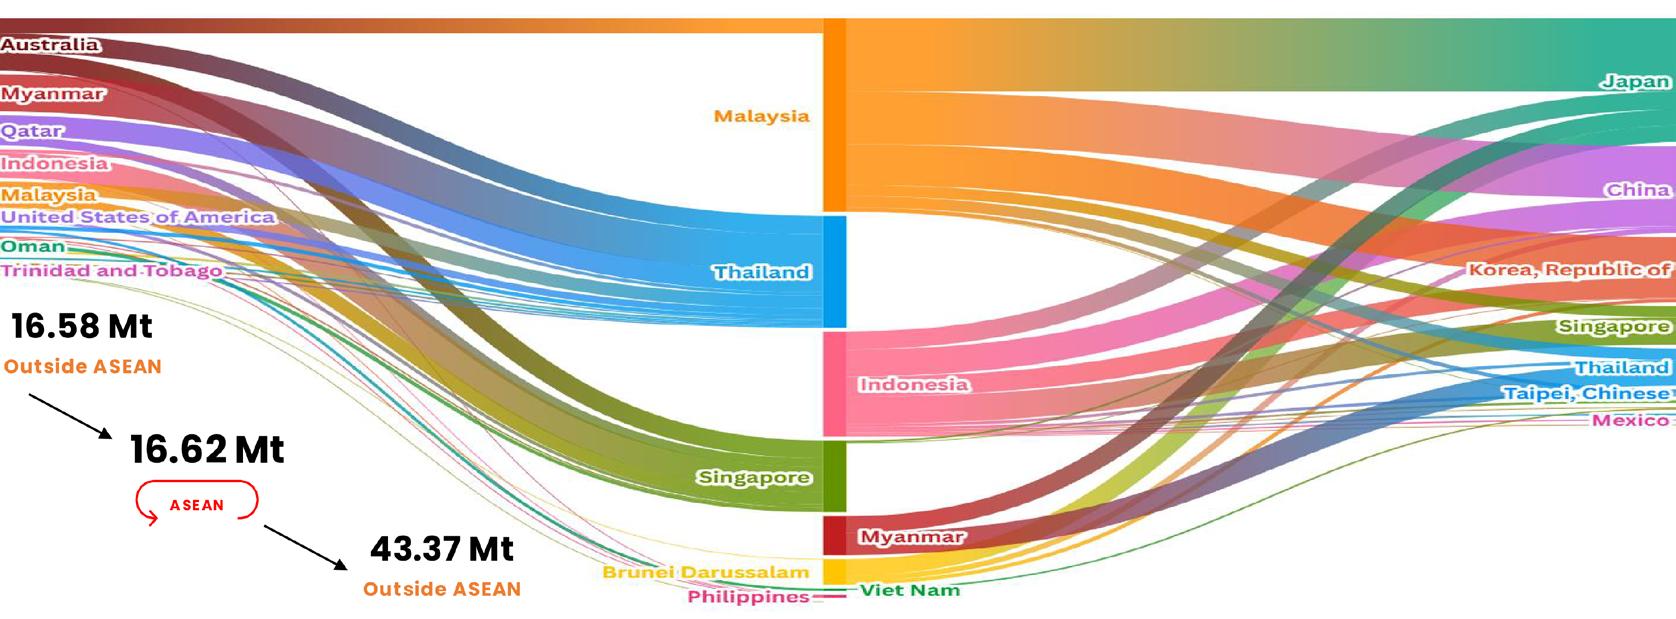
Addressing energy security in ASEAN demands a comprehensive and collaborative approach. The region’s transition to renewable and sustainable energy sources is crucial for economic stability and environmental preservation. As ASEAN navigates the intricate landscape of evolving energy demands, adopting smart grids, enhancing cross-border energy trade, and fostering innovations in green technologies become imperative. Harmonising regulatory frameworks, attracting foreign investments, and ensuring equitable access to energy are pivotal steps. Working independently in silos will maintain the current status of regional energy security, exacerbating inconsistencies in energy supply challenges, particularly for countries with lower energy security. As ASEAN navigates this path, the potential for a resilient, sustainable, and secure energy future beckons.
The economic dynamics within ASEAN play a pivotal role in shaping the regional landscape and fostering comprehensive integration. As a diverse collective of nations with distinct economic histories, cultural backgrounds, and developmental stages, ASEAN has evolved into a dynamic economic force. The importance of economic dynamics and industry competitiveness lies in their ability to drive regional integration, ensuring that member states collaborate for shared economic growth, sustainability, and global competitiveness. This section offers a glimpse into the significance of economic dynamics and industry competitiveness as the engine propelling ASEAN towards greater cohesion, as well as the challenges and consequences that follow.
In its early years, ASEAN focused on regional stability and political collaboration, later shifting towards economic integration in the late 1970s and early 1980s. Initiatives such as the 1977 ASEAN Preferential Trading Arrangement (PTA) aimed to reduce intra-regional tariffs, focusing on building trust among member states for economic cooperation (Heng, 2008). The 1990s witnessed a significant shift as ASEAN established the ASEAN Free Trade Area (AFTA) in 1992, aiming to create a single market and production base, reduce tariff barriers, and foster economic growth (Jones, 2005). Despite facing the Asian Financial Crisis in the late 1990s, ASEAN member states implemented structural adjustments, financial sector reforms, and improved governance to restore economic stability (Menon & Simorangkir, 2001).
ASEAN’s economic evolution has advanced from regional stability to deeper economic integration. As of 2025, the AEC Blueprint 2025 reports 97% implementation, reflecting progress in trade, investment, and digital connectivity (Bernama, 2025). ASEAN is also strengthening partnerships through the RCEP summit and the upgraded ASEAN-China Free Trade Area 3.0, promoting supply chain integration and new sectors such as digital and green economies (Reuters, 2025a, 2025b). The ASEAN+3 region is projected to grow 3.8% in 2025 with low inflation, highlighting the need for resilience amid global shocks (AMRO, 2025). Initiatives like regional QR payment integration further support cross-border trade and financial inclusion, while ASEAN’s strategic plan emphasises sustainable economic practices and regional connectivity (ASEAN, 2021b; Reuters, 2025c). Despite external challenges like financial crises, natural disasters, and the recent COVID-19 pandemic, ASEAN, with a population exceeding 600 million, maintains open economies.
ASEAN’s MSMEs: An economic driving force
Approximately 90% of businesses in the region are small and medium enterprises (SMEs), playing a significant role in the national GDP of AMS. Predominantly located in rural areas, these Micro SMEs (MSMEs) operate across primary, secondary, and tertiary sectors. As technology poses new challenges, MSMEs remain crucial drivers of economic growth in the ASEAN region. While representing around 90% of businesses globally and over 50% of employment, formal SMEs contribute up to 40% of national GDP in emerging economies (World Bank, 2023).
The majority of ASEAN’s MSMEs are concentrated in services, particularly wholesale and retail trade, accommodation, and food services. Manufacturing is another significant sector, with many businesses operating with low technology and focusing on domestic markets. Limited participation in global value chains constrains their global impact. In ASEAN, the manufacturing sector relies heavily on human labour, particularly in garments and electronics, which may face early impacts of workplace automation due to technological advancements (UNESCAP, 2023; UNIDO, 2023).
Financing MSMEs
MSMEs in the region face expansion challenges due to limited access to finance, stemming from a small credit market. While some ASEAN countries provide public finance and fiscal incentives, these are often targeted at specific groups such as women-led MSMEs, agribusinesses, tech-based start-ups, young entrepreneurs, and rural enterprises. Non-bank finance institutions, credit cooperatives, and digital financial services are becoming more prevalent. Despite the presence of a large number of financial institutions, SMEs struggle with limited access to affordable finance due to insufficient information infrastructure. This results in higher collateral requirements and lending interest rates for SMEs.
Regulatory reforms
MSMEs will also increasingly rely on the digital ecosystem for improved productivity. As ASEAN positions itself as a top services exporter, policy reforms will be needed, particularly in boosting digital services exports. The growing dependence on seamless connectivity will require adaptations in regulations to protect virtual consumers, including formulating and enhancing taxation mechanisms for online merchants. Failure to adapt risks significant revenue leakage in the billions.
The green transition
To stay globally competitive, MSMEs are transitioning to green models for sustainable operations. However, challenges arise in implementing green practices due to resource constraints, limited expertise, and uncertainties about suitable technologies.
ASEAN places a strong emphasis on digital transformation, particularly in technological governance, cybersecurity, AI systems, and the digital economy. The digitalisation transformation targets key service sectors for transformation, including health, finance, logistics, education, tourism, smart agriculture, and other professional services. The use of the Internet and digital platforms in the region has increased significantly, particularly during the COVID-19 pandemic, across various sectors, including e-commerce, transportation, food, online travel, online media, entertainment, and digital financial services. The digital economy is expected to grow from approximately $300 billion in 2024 to US$2 trillion by 2030 (DEFA), 2023).
As of 2024, it stands at US$263 billion, reflecting a 15% year-on-growth (Temasek, 2024). With over 125,000 new internet users daily, the region’s economy has expanded, impacting SMEs and job creation across the region (Asian Development Bank, 2024). Digital platform businesses in SEA, as of 2022, have generated around 160,000 direct jobs and 30 million indirect jobs, contributing 5 to 10% of Southeast Asia’s GDP (Asian Development Bank, 2024). The region’s ambition to become a global tech and startup hub is evident, with 52 unicorn startups attracting venture capital and FDI values over US$1 billion in the region as of 2022 (ASEAN, 2023). The recent pandemic has accelerated the adoption of digital channels, particularly in financial services, with SEA’s technology startups reaching a combined valuation of US$340 billion in 2020, expected to triple by 2025.
Enhanced connectivity and digitalisation will also expedite future trade in services compared to trade in goods. The flow of services and data plays a crucial role in the global economy, encompassing digital services such as financial management, entertainment, and communication subscriptions. Factors driving this acceleration include shifts in consumer preferences, changes in consumption patterns aligned with demographic trends, political environments, and technological transformations. In addition to the ongoing digital globalisation, trade between emerging economies, or South-South trade, is expected to rise, driven in part by the expanding middle class.
The swift progress of technology, especially the adoption of AI, poses a threat to traditional industries, offering opportunities but also creating challenges for sectors struggling to adapt, leading to potential job displacement and industry obsolescence. The advent of automation and digital technologies raises concerns about job losses, particularly for lowskilled workers in sectors such as manufacturing. According to the International Labour Organisation (ILO), approximately 2.3% of global employment is at high risk of automation, with clerical support occupations being the most vulnerable. This trend is pronounced in high-income countries, where automation potential is higher due to the prevalence of such jobs (ILO, 2025). The imperative for upskilling and reskilling is crucial to align with the evolving demands of industries, as a lack of digital literacy may hinder the adoption of digital technologies among older or less-educated populations (UNESCO, 2021).
As of 2023, internet penetration exceeded 70% while mobile penetration reached 136% in the region, indicating that many users maintain multiple mobile connections. In Malaysia, nearly 98% of the population has online access, whereas Indonesia’s internet adoption is around 75% as of 2025 (Market Research Asia, 2023). However, a closer look reveals a significant urban-rural divide in internet access. Urban areas benefit from fast fiber connections and 5G technology, while rural regions often rely on unstable mobile networks and frequently pay higher prices for less reliable service. In 2023, 81% of urban residents were online, compared to only 50% in rural areas, reflecting the persistent connectivity divide. This gap is further accentuated in low-income countries, where fewer than 20% of rural residents have internet access, compared with nearly 60% of urban residents (International Telecommunication Union, 2023).
While many countries have developed advanced digital infrastructure, the high costs associated with fixed broadband in low-income AMS further restrict adoption. Additionally, fixed broadband speeds in these lower-income AMS are often three to five times slower than in high-income AMS, limiting access and digital inclusion (Economic Research Institute for ASEAN and East Asia [ERIA], 2021). Limited internet access and the high costs associated with broadband deployment in rural areas remain significant barriers to digitalisation, affecting approximately 67% of the ASEAN population (ADB, 2019). This unequal access to digital resources and opportunities risks exacerbating social inequalities, as certain groups may disproportionately benefit while others are disadvantaged (OECD, 2020). Plans are underway to bridge the digital divide, enhance digital literacy, expand digital transactions, and grow online markets, supported by a comprehensive digital agreement aimed at fostering more cohesive and systematic development of digital infrastructure to meet the needs of diverse communities and stakeholders in the region (Digital Transformation Framework, 2020; ASEAN Digital Economy Framework Agreement, 2025).
Increased digital interconnectedness has amplified the risk of data breaches, fraud, and theft. Such cybersecurity threats pose risks to both individual privacy and national security, potentially leading to public distrust and social unrest (Cavusoglu et al., 2016). The potential misuse of sensitive information, the spread of disinformation, and threats to political stability are therefore ever-present (Rahman et al., 2020). In ASEAN, digital crimes and cybersecurity breaches resulted in economic losses of nearly US$3 million in 2023, up from US$2.78 million in 2022 (IBM, 2023). Many member states continue to face significant challenges in addressing these threats. For instance, Singapore saw a 174% increase in phishing attempts between 2021 and 2022. In Indonesia, the financial impact of cyberattacks is projected to rise from US$4.79 billion in 2022 to US$6.5 billion by 2028 (ERIA, 2025). Increasing cybersecurity risks can undermine the digital economy of the region. To address this challenge, countries in the region have pushed for greater cooperation among member states through the ASEAN Cybersecurity Cooperation Strategy (2017-2020) and ASEAN Cybersecurity Cooperation Strategy (2021-2025) (ASEAN, 2022). The primary focus of these strategies is to achieve the following: strengthen the cybersecurity readiness of member states, coordinate regional cyber policies, enhance trust in cyberspace, intensify capability development programmes, and foster strong international cooperation through multilateral engagement with other dialogue partner countries.
ASEAN actively pursues economies of scale by integrating into the global economy through trade agreements and facilitation initiatives. Influenced by global shifts such as the North American Free Trade Agreement (NAFTA), the European Union (EU), and China’s reforms, ASEAN attracts foreign investments for increased economic integration (ASEAN & UNCTAD, 2022).
The Regional Comprehensive Economic Partnership (RCEP), recognised as the largest freetrade agreement globally, aims to open at least 65% of the services sector to foreign investors, including financial services, telecommunications, and professional services. Surpassing the United States–Mexico–Canada Agreement (USMCA), the EU, and the Comprehensive and Progressive Agreement for Trans-Pacific Partnership (CPTPP) in size, RCEP involves partners contributing to 30% of global GDP and 30% of the world’s population, potentially fortifying supply chains (ASEAN Briefing 2022; ASEAN, 2024).
Despite the anticipation of the service trade outpacing the goods trade, the current Southeast Asian trend differs, with goods trading dominating. However, ASEAN attracted a record of US$229.8 billion in FDI in 2023, with approximately 60% directed towards services, particularly in the digital economy and Industry 4.0-related activities. RCEP partners contributed around US$66.3 billion of this FDI, reflecting continued investor confidence in the region (ASEAN Secretariat, 2022, ASEAN Briefing, 2025).
Services trade, commercial services exports in Southeast Asia grew annually by 0.2% from 2017 to 2021, witnessing post-pandemic growth. Transport services held a significant share in imports, while other business services led in exports, showing an annual increase of 11.7% from 2017 to 2021. Singapore, Thailand, and Malaysia emerged as service trade leaders within ASEAN, with ‘other business services’ playing a pivotal role (WTO, 2022).
Conclusion
Protectionism
Trade and economic growth are closely linked, but political polarisation, power transitions, and policy changes can disrupt economic integration. The rise of nationalism and protectionism, fueled by political influences, poses a threat to globalisation. Ongoing trade tensions between the US and China and the economic viability of shorter supply chains due to the 4IR and digital technologies contribute to a shift towards regionalisation and localisation of value chains.
Global dependency
The COVID-19 pandemic, compounded by the Ukraine-Russia war, has led to business closures and downsizing, impacting global economies with recession and inflation. Countries grapple with crises such as debt, climate change, and food security. Prolonged economic downturns directly affect employment and may lead to an extended cost-of-living crisis. Global supply chain interdependence raises the risk of sustained supply stress, affecting import-dependent markets.
Conducting business sustainably
Industries with significant environmental footprints, like the textile industry, face disruption due to the demand for eco-friendly manufacturing. Changes in global economic conditions, including trade tensions, can impact ASEAN’s economic integration efforts, emphasising the need for proactive measures such as education, skills development, innovation, sustainable practices, and enhanced regional cooperation to navigate uncertainties effectively.
The economic and industry dynamics within ASEAN reflect a complex interplay of regional, global, and internal factors. The region’s commitment to economic integration, as evidenced by initiatives like RCEP and the ASEAN Economic Community (AEC) Blueprint, demonstrates a concerted effort to harness collective strength for sustainable growth. However, challenges such as geopolitical tensions, shifts in global trade dynamics, and the ongoing impacts of the COVID-19 pandemic underscore the need for adaptive strategies and robust policies.
The resilience of ASEAN’s economic landscape is evident in the face of external shocks, with the region displaying agility in reinvigorating economic activities. The emphasis on innovation, technology adoption, and sustainability has positioned ASEAN as a dynamic player in the global market. Nevertheless, challenges in digitalisation and disparities in economic development across member states pose ongoing concerns that require targeted interventions.
As ASEAN strives for economic prosperity and competitiveness, it is crucial to address these challenges collaboratively. Fostering a conducive environment for innovation, upskilling the workforce, and promoting sustainable practices will be instrumental in achieving a more inclusive and resilient economic landscape. The commitment to regional cooperation and integration remains pivotal for navigating uncertainties and fostering a future where ASEAN emerges as a leader on the global economic stage.
Market dynamics, in practical terms, govern commerce, dictating the course of progress. These dynamics shape the behaviour and performance of markets or industries, impacting prices and influencing both producers and consumers. Supply and demand changes serve as pricing signals within the ASEAN region, where market dynamics are notably influenced by factors like competition, government regulations, disruptive technology, and shifts in social values. With a population exceeding 693 million people in 2024 (World Bank, 2025) and a collective economic size of over US$3.8 trillion (in terms of collective GDP) in that same year (ASEAN Annual Report, 2024), ASEAN ranks as the world’s fourth-largest trading bloc in 2024 (ERIA, 2024). Social and cultural aspects of market dynamics in ASEAN vary across countries due to differing income levels and diverse cultural beliefs. This section delves into the significance of sociocultural factors in shaping ASEAN’s market dynamics, exploring consumption patterns, changing consumer behaviour, the rise of the middle-class consumer, and the e-commerce landscape.
The 1967 inception of ASEAN marked a transformative moment in the regional economic landscape. Initially conceived for political objectives such as fostering peace, ASEAN evolved into an agent for economic development through collaborative efforts among member countries. Sociocultural factors played a dual role in shaping market dynamics, presenting challenges and opportunities. Diverse languages posed communication hurdles, while religious practices influenced consumer preferences, contributing to distinct market dynamics. Critical milestones, including the establishment of ASEAN, the AFTA agreement reducing trade barriers, the 1990s financial crisis prompting reforms, and China’s 2001 entry into the WTO, collectively defined ASEAN’s dynamic market trajectory. This section discusses the sociocultural forces at play in shaping the ASEAN market, beginning with changes in consumer behaviour, the rise of the middle class, and the rise of e-commerce.
Shifting demographics in ASEAN significantly influence consumer preferences, particularly with a substantial youth population leading to a surge in tech-savvy and socially conscious consumers. This demographic trend drives demand for innovative and sustainable products. Businesses keen on connecting with evolving consumer mindsets must grasp this agedriven ethos.
Rapid urbanisation in AMS is reshaping market preferences, with urban lifestyles fuelling the demand for convenience. This shift drives the rise of e-commerce, quick-service formats, and on-the-go products (McKinsey, 2024). Urban landscapes serve as platforms for preferences like experiential consumption, diverse cuisines, and digitally infused shopping experiences, all influenced by globalisation and the quest for a global identity. Consumer advocacy for sustainability and ethics is growing in ASEAN, with an increasing demand for eco-friendly products and ethical business practices (BCG, Meta & InMobi, 2023). Consumers are scrutinising the environmental impact of products, endorsing businesses committed to sustainability (PwC, 2024). This conscientious consumerism is reshaping market dynamics and pressuring industries to adopt eco-friendly alternatives.
The premium market in ASEAN is growing, driven by middle-income individuals who are willing to pay more for convenience, well-being, and personalised products. This trend offers local brands an opportunity to excel by tailoring solutions to meet local needs. This, however, challenges local businesses to meet the rising expectations for premium offerings, which in turn impacts customer retention. AI-driven personalised recommendations reshape marketing strategies, making tailored approaches essential. Businesses not leveraging AI for personalised marketing risk losing consumer engagement, as personalised experiences become crucial for successful customer relationships. Despite these shifts, the value tilt towards premium and green products varies across income groups, potentially widening inequality.

Figure 2.7.1 Consumer Sentiment on the Importance of Sustainability versus two years ago The Next Chapter: Decoding The Future Of FMCG In Southeast Asia. BCG, 2024
Sustainable purchasing
sustainability influencing purchasing decisions. A Nielsen Company survey in 2020 revealed that 63% of respondents in Southeast Asia were willing to pay more for products from environmentally responsible companies. The importance of sustainability has significantly increased in Thailand and Indonesia, with 74% and 62% of respondents finding it easier to shop sustainably compared to the global average (NielsonIQ, 2023). Growing importance is placed on sustainability when choosing brands in the Asia Pacific. A World Economic Forum survey reveals that 80% of ASEAN respondents value sustainability, indicating a persistent trend toward a greener consumer market (WEF, 2020). However, the challenge lies in companies integrating sustainability into their practices, as those not aligning with eco-friendly approaches risk being perceived as outdated, affecting brand loyalty. Obstacles include high prices for sustainable products and stagnant or decreasing income and education levels. In such scenarios, consumers may prioritise cheaper, less sustainable products, contributing to non-sustainable practices. A lack of awareness about the benefits of green products may lead lower-income groups to continue consuming unhealthy or environmentally damaging products. Government support is crucial for making certified healthy and green products affordable for these groups.
Adapting to technological advances
Businesses in ASEAN grapple with adapting swiftly to tech-driven transformations, requiring constant updates to align with evolving consumer habits. Failure to adapt promptly may lead to obsolescence, as consumer preferences increasingly rely on technology-driven experiences. Technology integration depends on robust infrastructure and widespread digital access. Disparities in technology infrastructure across ASEAN may hinder the comprehensive adoption of tech-driven habits. The increasing reliance on technology also exposes businesses to cyber threats, necessitating investments in robust cybersecurity measures to protect consumer data and maintain trust in the digital marketplace.
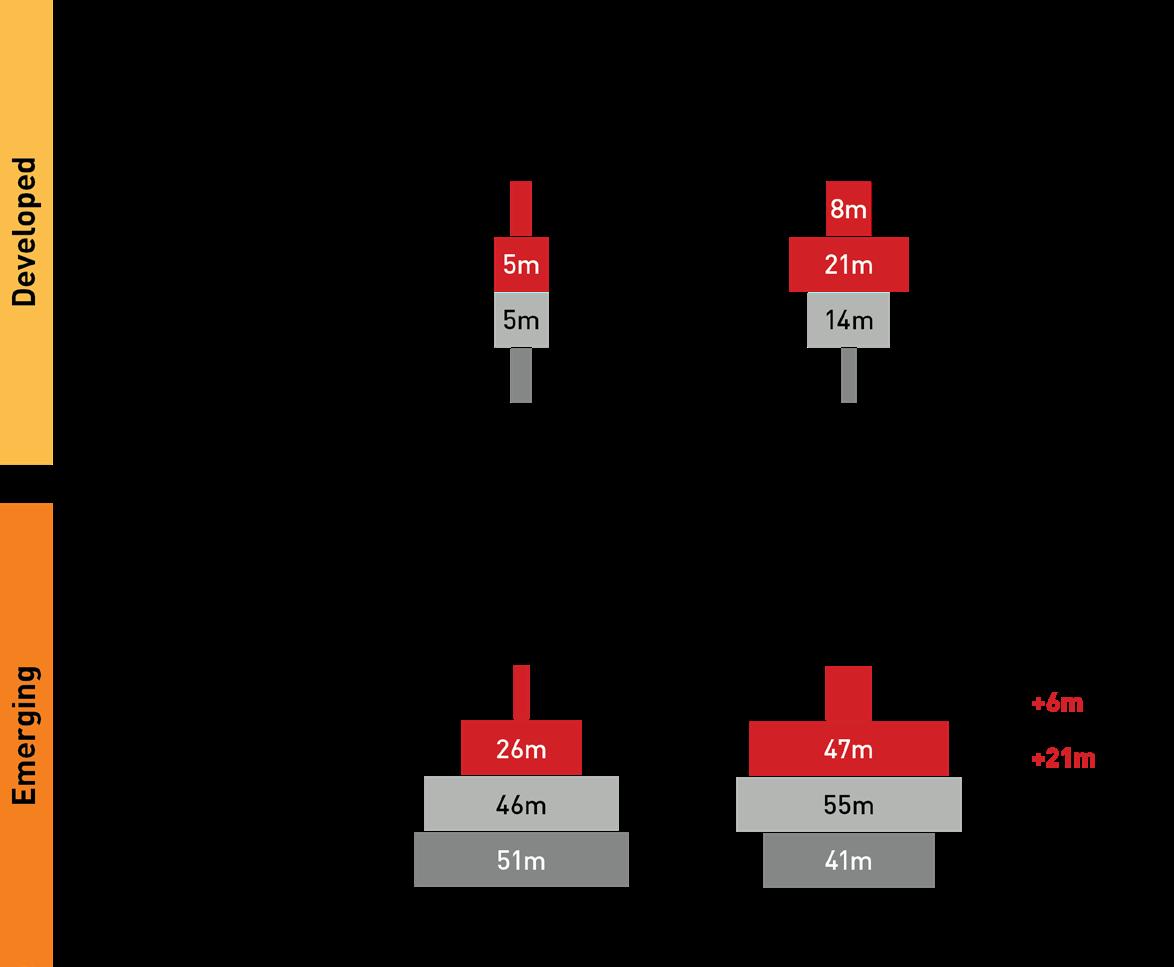
• 11 million new highand-upper-middleincome households in developed ASEAN
- 1 in 2 households today
- 64% of househoulds by 2030
• Low-income households down by 40% 2030
• 27 million new high-and upper-middle-income households in emerging ASEAN
- 1 in 4 households today
- 1 in 2.6 households by 2030
Figure 2.7.2 Change in Household Income Profiles Across Developed and Emerging ASEAN WEF, 2020. Future of Consumption in Fast-Growth Consumer Markets: ASEAN
By 2030, it is estimated that 64% of ASEAN’s population will be middle class (World Economic Forum, 2020) (Figure 2.7.2). With the increase in wages in households, ASEAN reflects falling rates of poverty and rising incomes and spending power. Inferred from the expenditure patterns of lower-middle-income, higher-middle-income, and high-income countries in ASEAN, it is likely that with an increase in spending power, the percentage of expenditure on necessities will decrease, while expenditure on non-essentials will increase. The middle-income consumer’s higher spending power also means they are more likely to have access to education, healthcare, and other social services. Overall, living standards, education levels, and increased awareness of environmental and health factors are expected to increase in ASEAN.
The rise of the middle class in ASEAN heightens market competition, pressuring businesses to differentiate and meet evolving demands. This surge in demand by the middle class presents challenges to supply chains, necessitating resilient strategies to ensure consistent product availability and timely deliveries amid potential strain and disruptions. Insufficient infrastructure and logistical bottlenecks in some ASEAN regions may hinder smooth distribution to the expanding middle class. Overcoming these challenges is crucial for businesses to unlock the full potential of the middle class market, requiring investments in infrastructure and efficient logistics.
A significant consequence is the middle class’s shift in preferences toward diverse and sophisticated products, often emphasising sustainability and ethics (BCG & PWC, 2024). This behavioural shift demands that businesses realign their strategies with middle-class values. The rise of the middle class aligns with increased urbanisation, shaping consumer behaviours towards urban-centric products and services (McKinsey, 2024). Businesses must tailor their strategies to suit the urban lifestyle, recognising its impact on middleclass purchasing patterns.
E-commerce is reshaping traditional norms, delivering unmatched convenience and a wide range of options, notably in sectors like fashion, electronics, and groceries. This shift not only benefits established brands but also empowers small and medium enterprises to access a broader market (Google, Temasek, & Bain & Company, 2024). Beyond transactions, e-commerce influences supply chains, logistics, and customer service. Businesses that seamlessly integrate e-commerce gain a competitive edge by providing personalised services and online experiences.
Social commerce, the intersection of e-commerce and social media, is gaining traction, allowing consumers to seamlessly discover, evaluate, and purchase products within their preferred social platforms. The impact of social media on brand awareness and consumer engagement is poised to be a defining element in the success of businesses in the dynamic ASEAN market. The surge in e-commerce expands market reach, enabling businesses to access a broader customer base beyond traditional geographical boundaries. Effective utilisation of e-commerce platforms allows businesses to tap into previously untapped markets, fostering growth and increasing market penetration. E-commerce growth creates opportunities for digital entrepreneurship, empowering small and medium enterprises to thrive in the digital economy (McKinsey & Company, 2024). Entrepreneurs and startups can establish and scale their businesses more easily. E-commerce platforms also generate valuable data, enabling businesses to tailor their offerings based on consumer preferences. The creation of job opportunities in areas such as logistics, digital marketing, and technology development has made a positive impact on ASEAN’s overall economic development.
E-commerce growth is hampered by concerns regarding online security, fraud, and consumer trust in handling personal and financial information. Building and sustaining consumer trust necessitates robust cybersecurity measures and transparent business practices.
Another challenge to consider is last-mile logistics, especially in densely populated urban areas, for timely and cost-effective delivery. Delays and logistical bottlenecks can impact customer satisfaction and loyalty, influencing the overall success of e-commerce ventures.
Varied regulatory frameworks across ASEAN countries complicate compliance for e-commerce businesses. Navigating diverse regulatory landscapes may lead to operational complexities and increased compliance costs.
In navigating ASEAN’s consumption trends, forward-thinking businesses can excel amid evolving consumer expectations, e-commerce dominance, the need for personalised marketing, and the imperative of data-driven decision-making. The convergence of technology and consumer habits raises expectations, compelling businesses to offer seamless, tech-enhanced experiences. Failing to meet these expectations risks companies losing relevance and market share in a tech-centric environment. Online shopping, propelled by tech integration, transforms the retail landscape, making e-commerce a dominant force. Traditional brick-and-mortar establishments face competitiveness challenges, necessitating a reevaluation of business models to incorporate digital elements.
The tech-driven transformation generates vast amounts of data, necessitating data-driven decision-making. Companies proficient in leveraging consumer data gain a competitive edge, while those lagging may struggle to understand and cater to evolving market demands. In essence, the tech-driven transformation of consumer habits in ASEAN brings both challenges and consequences. Proactive adaptation and strategic investments are therefore imperative for businesses not only to survive but to thrive in this digitally influenced market environment.
In ASEAN, the role of education, skills, and competencies stands as a cornerstone for sustainable growth and regional development. As ASEAN continues its journey towards economic integration and global prominence, the focus on nurturing a skilled and adaptive workforce becomes paramount. This section focuses on literacy among ASEAN’s youth, education levels among ASEAN’s workforce, and moving towards the green agenda, followed by discussions on the respective challenges and consequences.
Educating ASEAN: A Historical Background
The roots of formal education in the region can be traced back to ancient civilizations, where knowledge was transmitted through oral traditions and apprenticeships. With the spread of Hindu-Buddhist influence, educational institutions known as “wats” or temples emerged in places like Angkor Wat in Cambodia, serving as centres for learning and spiritual development.
During the colonial era, education systems were introduced by European powers, leaving a lasting impact on the educational landscape. The establishment of formal schools and universities by colonial authorities aimed to impart Western values and knowledge. Postindependence, ASEAN nations embarked on educational reforms to forge their unique identities. Notable efforts included language reforms to promote national languages and policies to address issues of access and equity in education.
The latter part of the 20th century witnessed a concerted effort by ASEAN nations to enhance regional cooperation in education. The establishment of the ASEAN University Network (AUN) in 1995 and the ASEAN Qualifications Reference Framework (AQRF) in 2015 reflect collaborative endeavours to standardise educational practices and facilitate academic mobility within the region. These initiatives align with the broader goals of ASEAN integration, emphasising the importance of a skilled and adaptable workforce for regional development.
Literacy among ASEAN’s youth
The rapid changes in today’s world significantly impact education and skills. To remain relevant in the future workforce, individuals must acquire a diverse skill set to tackle complex challenges. The productivity of a country hinges on the education levels and workforce quality. As the world progresses, ASEAN’s burgeoning young population must be equipped with the necessary knowledge and skills for productivity and competitiveness. Deficiencies in education systems and institutions impede human capacity building, posing constraints on ASEAN countries’ ability to enhance their productive capabilities. In most AMS, primary education enrolment exceeds 90% (ASEAN Secretariat, 2021).
Approximately 25% of the region’s population is school age (5 to 19 years), and net enrolment ratios in primary and secondary schools have shown improvement from 2010 to 2018. Secondary enrolment rates have risen, even in countries where secondary education is not mandatory, such as Myanmar (64%), Laos (68%), and Malaysia (85%). Attendance at the secondary level is compulsory in Thailand and Singapore (OECD, 2021). However, amid rising demand for higher levels of skills, the quality of education offered remains a challenge.
The Programme for International Student Assessment (PISA) results, as shown in Figure 2.8.1, highlight significant disparities in educational performance across the region. Singapore consistently leads with the highest scores in mathematics, reading, and science, setting the regional benchmark. Vietnam also performs strongly, with results above those of most ASEAN peers, while Brunei Darussalam shows a moderate performance, particularly in science. In contrast, Malaysia and Thailand remain in the mid-range, with Malaysia showing relative strength in science but continued weaknesses in reading. Indonesia and the Philippines lag behind, with the Philippines and Cambodia recording the lowest scores across all three domains. With the exception of Singapore, the performance of selected students in the ASEAN region in reading, mathematics, and sciences, as measured by PISA, is relatively lower than that of many of the high-tech and developed nations. For example, Macao China scored 552, 543, and 510 for mathematics, science, and reading, respectively. Japan scored 536, 547, and 516; Korea scored 527, 528, and 515; and Estonia scored 510, 526, and 511(OECD, 2023).
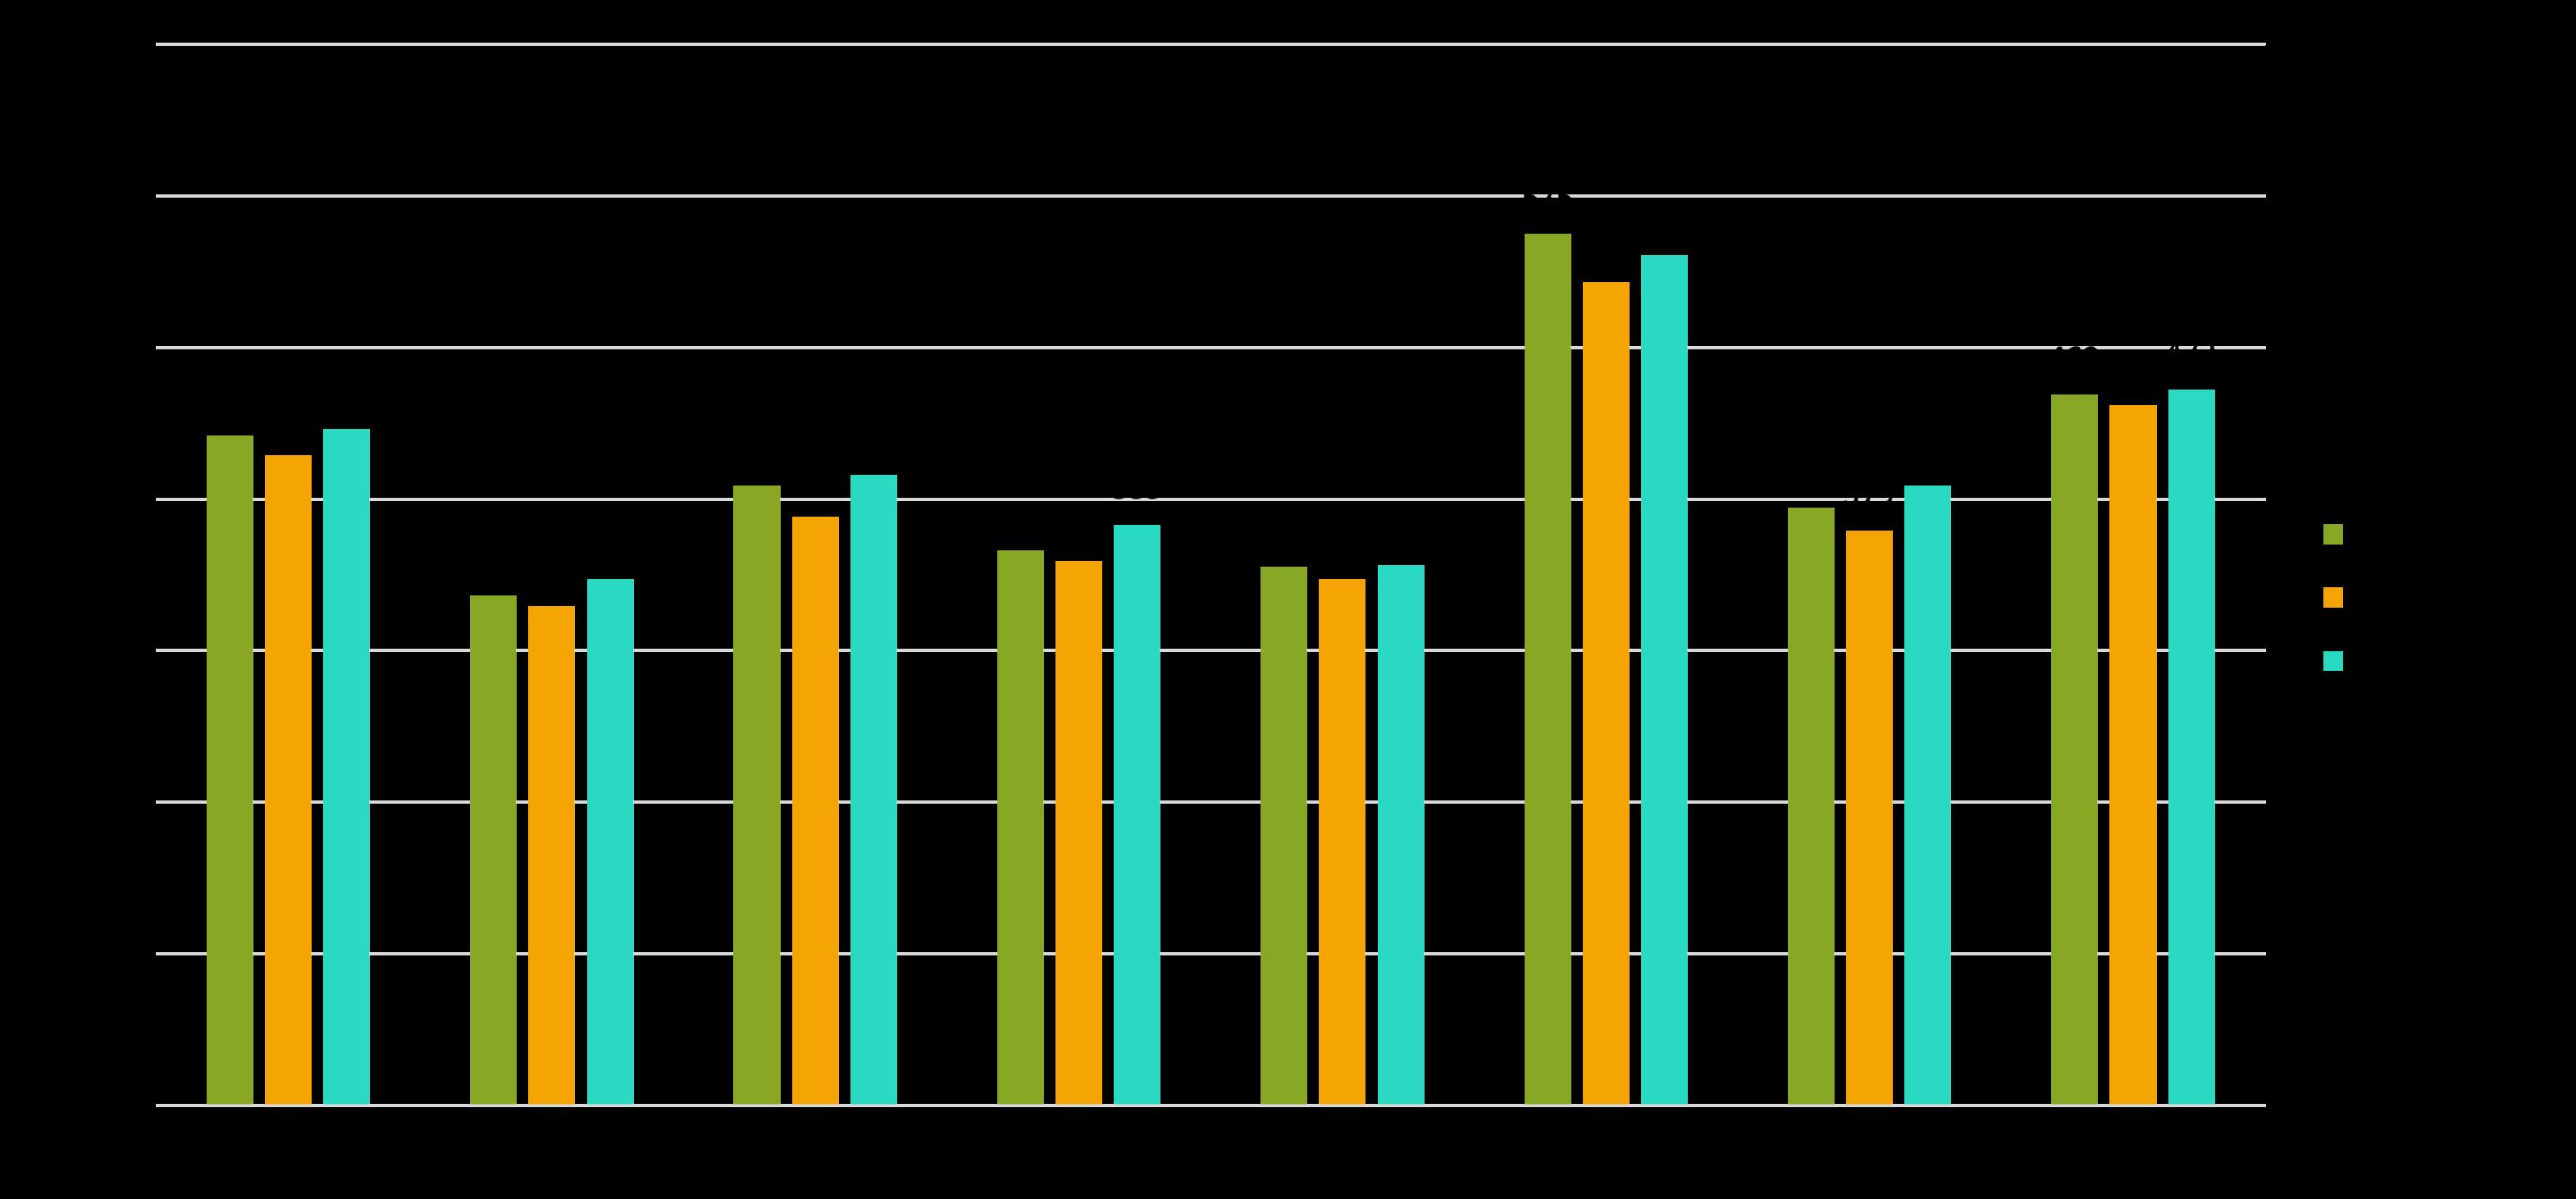
The completion rate for both education levels varies across AMS, with generally lower completion rates for lower secondary education (Das et al., 2022). Despite the increasing enrolment in schools, the quality of secondary and tertiary education is important and requires significant investments to take place. As the economy, ASEAN, and the world shift towards more service-oriented, high-tech, and value-added activities, there is a pressing need to enhance secondary and vocational education in AMS for a workforce with more relevant skills.
PISA scores also indicate that a significant portion of Southeast Asia students lack basic competencies, demonstrating challenges in critical thinking, making inferences, connecting concepts, and performing non-routine and non-procedural skills. As these low achievers enter the workforce, they are more likely to be employed in low-skill occupations with routine tasks, which are at a higher risk of being automated. Inadequate mastery of subjects and skills may hinder the development of more complex workplace skills in the future, emphasising the importance of a strong fundamental knowledge base.
Education and skills development are critical for enhancing the socioeconomic development of AMS. Figure 2.8.1 shows that Vietnam has the highest spending, while Myanmar records the lowest spending for education. In terms of enrolments in primary school, AMS was above 90%. In secondary school enrolment, Singapore records the highest rate at 103%, while Cambodia records the lowest rate at 46.1%. In vocational education enrolment, Indonesia records the highest rate at 42.4%. In tertiary education, Singapore records the highest enrolment of 69.8%, while Cambodia has the lowest enrolment rate of 13.1%.
Increasingly, the global economy is becoming technology- and knowledge-intensive. AMS countries have high enrolments of graduates in science, technology, engineering, and mathematics (STEM) disciplines. Malaysia, Brunei, and Singapore recorded more than 35% graduates enrolled in STEM education (Lim et al. 2022).
A survey of the quality of education and training (Table 2.8.1) shows that Singapore and Malaysia are perceived to have the highest quality of education. In terms of staff training quality, Singapore and Malaysia recorded the highest scores. These recognised rankings are comparable to several developed countries such as Norway, Switzerland, and Germany (Paryono, 2021).
The Human Capital Index (HCI), which combines both the health and education of the human capital on a scale of 0 to 1, was assessed for AMS. Higher value HCI will result in higher human capital. Singapore recorded the highest HCI (Table 2.8.2), comparable to many developed countries. Three countries recorded HCI below 0.5: Laos, Myanmar, and Cambodia.
The labour profile of AMS is given in Table 2.8.2. The percentage of youth not in employment, enrolled in education programmes, nor undertaking training is highest in Indonesia, the Philippines, and Myanmar. This highlights the urgent need to address underemployment among young people. The table also shows the percentage of people employed with at least a tertiary education (classified skilled workforce) and a secondary education (semi-skilled workforce). Singapore had the highest proportion of skilled workers, with close to 56.2% of the workers having a tertiary qualification. This is followed by Brunei, where 40.8% of its workforce are skilled workers. These figures are closely correlated with labour productivity (in US dollars) in these countries, where Singapore and Brunei recorded the highest labour productivity. Cambodia and Laos recorded the lowest percentage of skilled workers. A majority of the workforce in AMS is medium-skilled, which is consistent with the labour productivity measures recorded for these countries.
Table 2.8.1 Education and Training Indicators and Funding for ASEAN Member States
2.8.2 Workforce Indicators of ASEAN Member States
Investments in a skilled workforce will enable firms to adopt new technologies, expanding their market reach and richness. Key drivers for enhancing market opportunities and sustainability are the adoption of digital technology and AI. Use of automation and AI systems will have significant positive spillovers on many economic sectors in AMS.
Firm-level measures of innovation shown in Figure 2.8.2 show varying degrees of performance of countries with respect to process innovation, R&D spending, introduction of new products or services, and use of technology licensed from foreign firms. The figure shows that many of the AMS lag behind China in most of the measures mentioned above. This information highlights that firms from most AMS countries operate at the lower end of the innovation value chain.
The imminent wave of technological disruption is poised to impact diverse sectors within ASEAN. Increases in the adoption of new technologies, such as AI and Industry 4.0 technologies, are envisaged to alter the competitive nature of the main economic sectors in AMS. While these new technologies open new opportunities for economic sectors in AMS to increase their efficiency and productivity, low digital literacy, low enrolments in STEM education, weak digital infrastructure, and infant regulatory architecture to govern the digital economy in many of the member states will hinder the competitiveness of these sectors.
Rapid transition towards automation without careful planning of training and capability development programmes, investments in the digital infrastructure, and a significant stepup in digital regulations & governance systems will result in the economic sectors not being able to derive return on value (ROV) from these new technologies. A fast transition towards automation of the economic sectors will result in an acute shortage of skilled workers. These transitions will also displace unskilled workers, who may not have the skill set to take up employment in a new tech-savvy sector. These will increase unemployment rates and erode the competitiveness of the economic sectors.
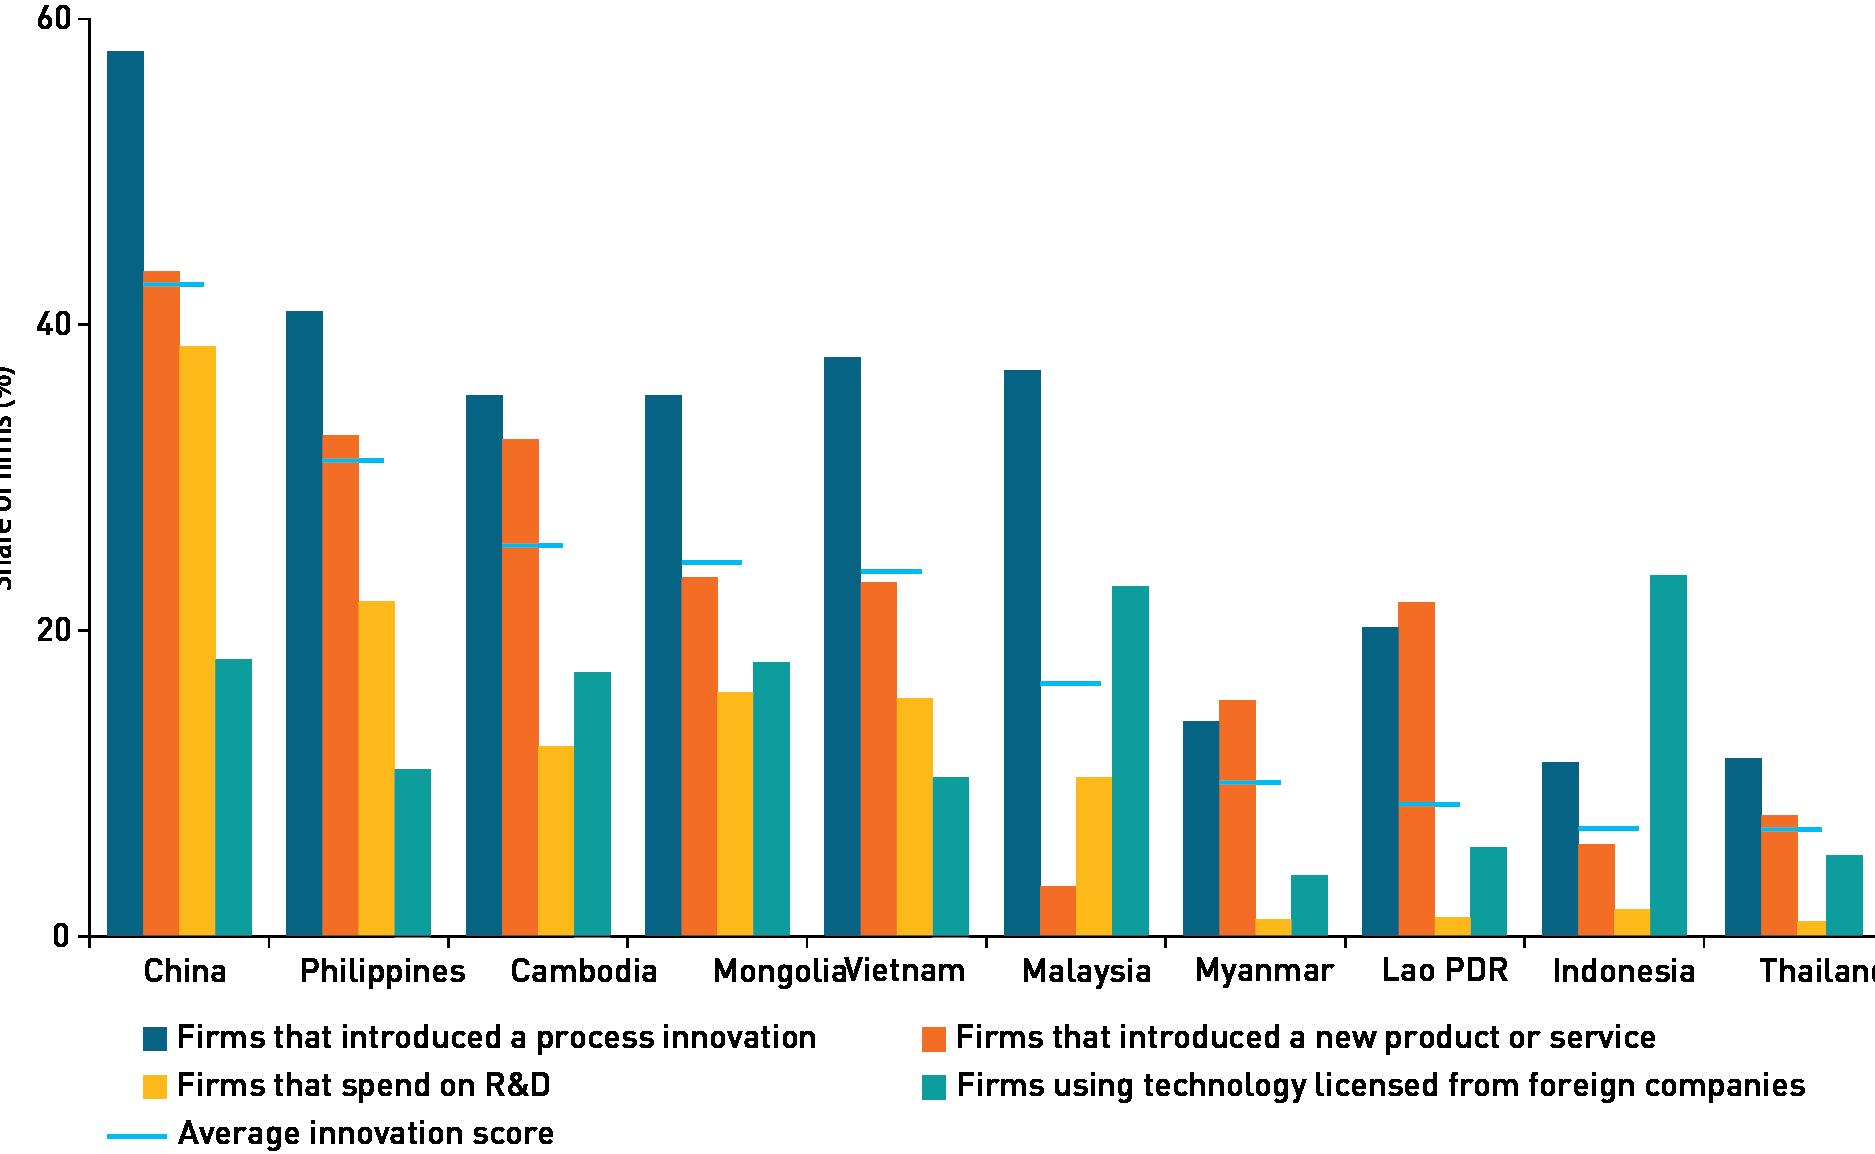
Note: E&E products include those under the International Standard Industrial Classification of All Economic Activities (ISIC, Rev.4) Divisions 26 (‘Computer, electronics and optical products’), 27 (‘Electrical equipment’), and 28(‘Machinery and equipment’). Total manufacturing refers to ISIC, Rev.4, section C, divisions 10-33.
Climate change poses a significant threat to the global GDP and, notably, to the vulnerable ASEAN region, which faces risks from floods, droughts, typhoons, heatwaves, and rising sea levels. Sectors like agriculture, manufacturing, construction, environmental services, transportation, and energy are therefore expected to be affected. The global economy may lose between US$1.7 trillion to US$3.1 trillion per year by 2050 due to climate change (World Economic Forum, 2023).
Climate-related risks will also result in major challenges for many countries in Southeast Asia. Climate change is expected to increase sea levels, flooding, extreme weather patterns, loss of fertile coastal land, and adverse impact on the irrigation system. These have a major impact on the agriculture and fishery industry, migration patterns, increase food insecurity, disrupt livelihoods, increase the spread of diseases, and health risks. It is projected to shave 11% off the GDP by 2100 (Overland et al., 2021).
Climate change will drive market and industry changes, necessitating a transition to green technologies and creating opportunities for green jobs. ASEAN member states have committed to promoting green jobs for sustainable and inclusive growth, with Technical and Vocational Education and Training (TVET) serving as a pathway to develop skills related to these jobs and support the transition of existing employment to green skills. OECD defines green skills as those needed to adapt products, services, and processes to climate change and related environmental requirements and regulations. Generic green skills may encompass quantification and monitoring, management systems, material use and impact quantification, impact and use minimisation, impact assessment, and risk management. Moving towards
and
The shift towards a green agenda and adherence to Environmental, Social and Governance (ESG) policies will lead to the development of green sectors, creating jobs in energy, automotive, manufacturing, and waste management. These emerging roles demand individuals with proficiency in green skills, essential for reducing environmental impacts and facilitating economic restructuring amid rapid environmental changes. The issue lies in sourcing adequate training to equip workers with these skills from ASEAN’s existing talent.
Limited talent pool
As ASEAN advances its green agenda and embraces 4IR technologies, education, training, and skills development will undergo significant changes. The revolution is expected to lead to the displacement of workers, but it will also create a higher demand for skilled workers in high-value industries. Individuals who transition to new fields without upskilling and acquiring the necessary competencies remain vulnerable. The inability to train the local workforce could limit the talent pool, potentially increasing economic migration within the region and exacerbating inequality.
Conclusion
The education, skills, and competencies issues affecting ASEAN’s population have significant implications for the region’s socio-economic development. The gap in educational quality and accessibility across member states leads to disparities in skills acquisition among ASEAN’s workforce, which needs to be addressed urgently in order to create a cohesive and competitive labour market. Additionally, the mismatch between the skills acquired through education and those demanded by evolving industries contributes to underemployment and limits the region’s ability to fully harness its demographic dividend.
Rapid technological advancements, particularly in the 4IR, pose the risk of job displacement for workers with outdated skills, leading to unemployment and economic inequalities. The inability to address these challenges may result in a shortage of skilled workers for emerging green sectors, hindering the region’s transition to a sustainable and circular economy.
The lack of a coordinated and standardised approach to skills development and training across AMS is likely to impede regional integration efforts and hinder the establishment of a seamless labour market. Addressing these issues is crucial for ASEAN to ensure inclusive and sustainable economic growth while preparing its workforce for the demands of the future.
ASEAN member states’ (AMS) respective political landscapes have undergone significant transformations over the years, shaping the region’s journey towards stability and cooperation. This section reviews historical developments that have influenced political stability in the region, followed by an overview of service quality, government integrity, political stability, and civil liberties and rights.
ASEAN emerged amid a rapidly changing Southeast Asian geopolitical landscape, initially formed by Indonesia, Malaysia, the Philippines, Singapore, and Thailand, aiming to foster regional cooperation and prevent post-colonial conflicts (Acharya, 2001). The Cold War context, notably the nearby Vietnam War, added urgency to Southeast Asia’s need for stability and unity.
In its early years, ASEAN prioritised building trust among member states through non-interference and consensus decision-making principles (Emmers, 2011). The 1976 Treaty of Amity and Cooperation in Southeast Asia (TAC) played a crucial role in promoting political stability, and committing states to peaceful dispute resolution and non-aggression (Khan, 2003).
The end of the Cold War brought both challenges and opportunities. Expanding to include Brunei (1984), Vietnam (1995), Laos, Myanmar (1997), and Cambodia (1999) demonstrated ASEAN’s commitment to inclusivity in the post-Cold War era (Acharya, 2009). Economic and financial crises in the late 1990s tested the political stability and resilience of ASEAN.
In the early 21st century, ASEAN grappled with issues of political legitimacy and regional security, exemplified by maritime disputes in the South China Sea (Storey, 2011). Addressing these challenges, the ASEAN Charter in 2007 provided a legal framework, affirming a commitment to democratic principles and good governance (Busse, 2014).

Notes: Government Effectiveness, a composite indicator encompassing public service quality, civil service independence, policy formulation and implementation, and government commitment credibility, is represented by percentile ranks, ranging from 0 (lowest) to 100 (highest) among all nations.
Over the last two decades, AMS have shown varied performances in government effectiveness. Singapore consistently leads globally with a score of 100, reflecting its stable public service delivery (The World Bank, 2025). Within ASEAN, several nations have shown notable examples of effective government and the respective people’s satisfaction. Singapore, under the Digital Government Blueprint, garnered widespread approval, with 86% of citizens and 77% of businesses expressing satisfaction (DGB, 2020). In Malaysia, the government showcased remarkable agility during the 2019 pandemic, implementing the Movement Control Order effectively to control the spread of COVID-19 (The World Bank, 2019).
To address competency issues, the ASEAN Cooperation on Civil Service Matters (ACCSM) Work Plan for 2021-2025 sought to establish a citizen-oriented civil service. Building upon the ACCSM 2016-2020, ACCSM 2021-2025 aims to include strengthening civil servant capacity in key areas like digitalisation, cross-agency coordination, and transformative leadership to foster a more responsive, transparent, and adaptable civil service to meet future challenges (ACCSM, 2017; 2025). These efforts align with the broader public administration reforms identified across the region as essential for effective governance (ADB, 2024).
In the early 2000s, the Lao PDR faced challenges attributed to weak public administration. Issues such as low pay for civil servants hindered sector performance and impeded progress towards an efficient and accountable public service (ADB, 2011). Today, the country continues to grapple with these issues, with a new focus on improving public financial management to address high debt and inflation (ADB, 2024). Meanwhile, in Indonesia, the country continues its significant steps to enhance transparency and accountability within its civil service. Following the implementation of a computer-based entrance exam in 2013 to curb malpractices, the country is now undertaking comprehensive bureaucratic reforms, including restructuring its civil service and preparing for the transfer of government offices to the new capital city, Nusantara (ASEAN SEC, 2021; Antara News, 2025). These diverse situations within ASEAN underscore the complexity of government effectiveness and the region’s commitment to continuous improvement.
Standardising governance models
ASEAN faces a challenge in standardising government effectiveness due to diverse governance models, hindering regional coherence (Emmers, 2011). Variations in political structures and decision-making processes among member states pose a challenge in developing a more cohesive and effective ASEAN governance model. Divergent approaches to government effectiveness on a regional scale can impede efforts for greater integration, impacting overall ASEAN coherence (Busse, 2014).
Socioeconomic factors
Socioeconomic disparities contribute to varying levels of public service access and quality among ASEAN states. Inadequate investments in infrastructure, talent development, and support for institutional reforms in the governance and public services can hinder economic efficiency. Bridging these gaps requires targeted efforts to ensure equitable access to essential services, enhancing regional development (World Bank, 2019).
For over 20 years, Southeast Asian nations have actively combated corruption. The most recent Corruption Perception Index (CPI) highlights Singapore as a regional leader in maintaining high standards of integrity, consistently ranking among the least corrupt nations globally (Figure 2.9.2). Malaysia, despite its establishment of the Malaysian AntiCorruption Commission (MACC), continues to grapple with corruption challenges, ranking mid-tier on the global scale. Similarly, the Philippines faces corruption concerns despite efforts such as the creation of the Presidential Anti-Corruption Commission (PACC). Many of the other AMS countries, too, experience major challenges with respect to combating corruption; though there are concerted efforts taken to address this scourge that tunnel resources of the country away from national development needs, and this undermines investor confidence.
Myanmar, despite the ratification of the UN Convention against Corruption, ongoing political instability following the military coup in 2021 has caused a sharp decline in its CPI score, where in 2024, the CPI score dropped to 16 out of 100, ranking it 168th out of 180 countries (Transparency International, 2024). While Cambodia has shown progress on some fronts, such as strengthening its anti-money laundering and anti-corruption laws to comply with international standards, it still ranks poorly on its CPI score. Cambodia needs to accelerate reforms and enhance transparency to significantly improve its standing (UNCAC Coalition, 2024).
These diverse rankings and statistics underscore the complex and multifaceted nature of government integrity within the ASEAN region, reflecting both achievements and challenges across member states.
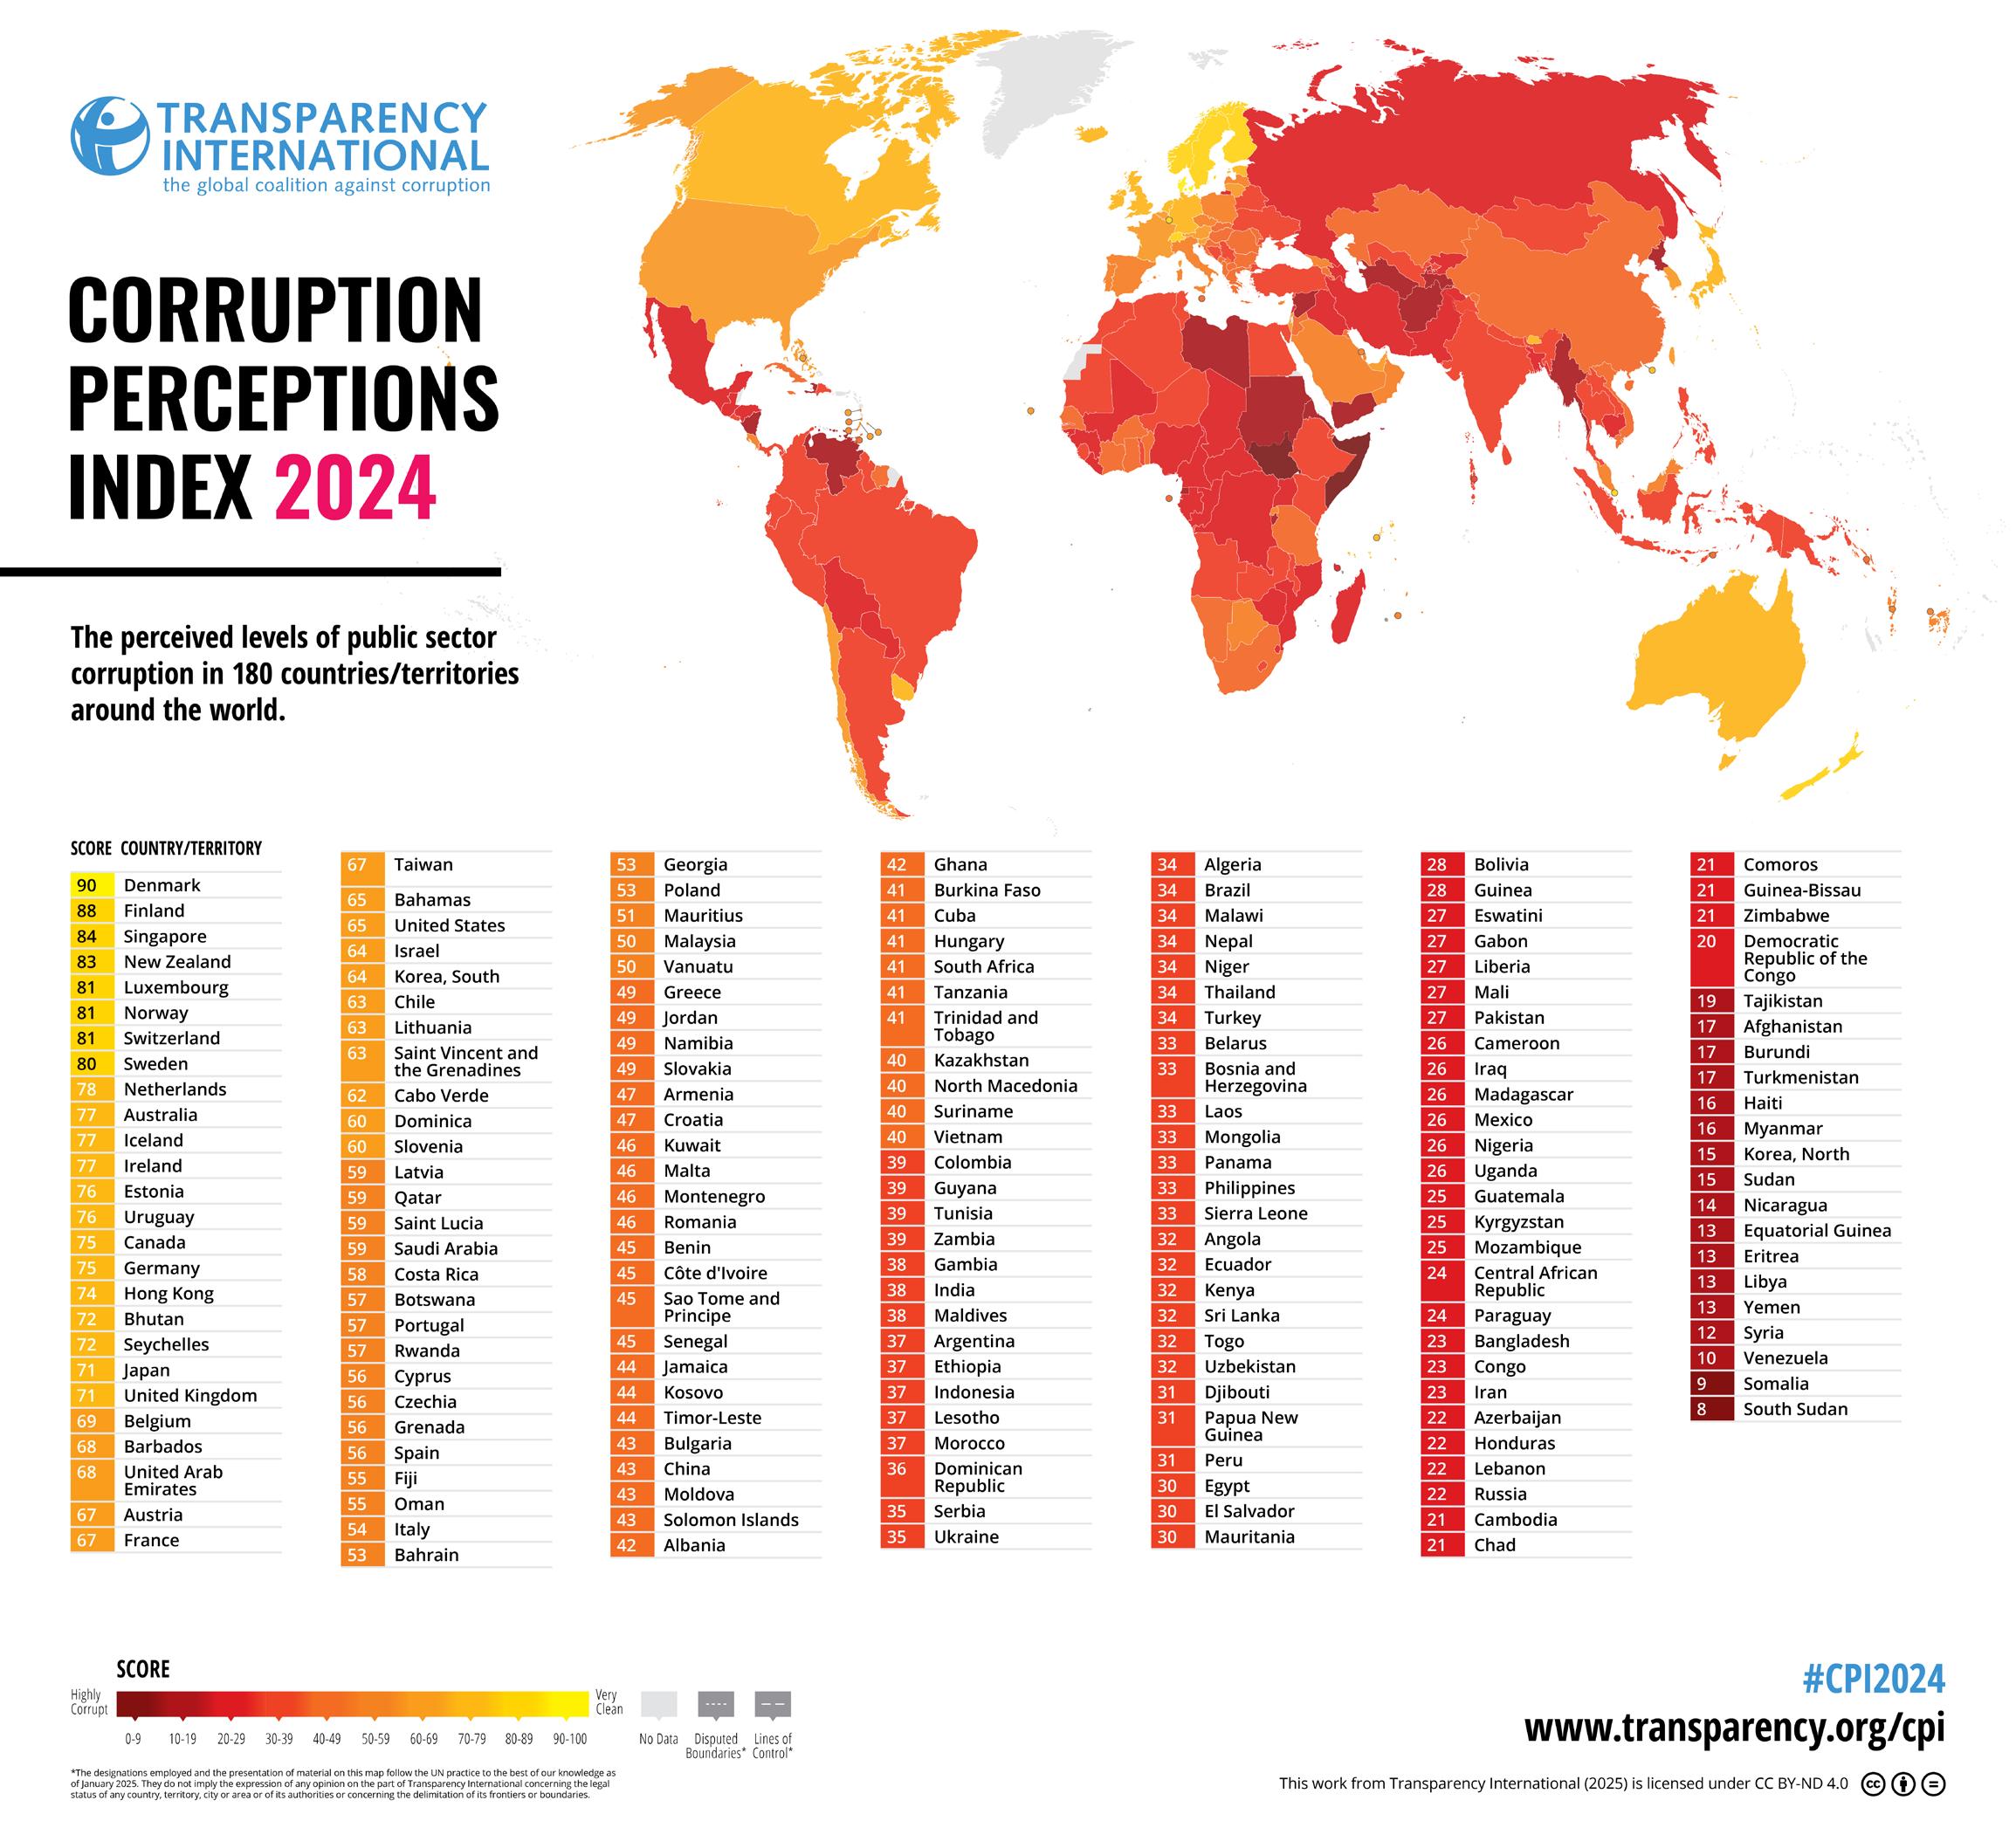
Divergent approaches to anti-corruption measures among ASEAN member states present challenges for harmonisation, hindered by varying legal frameworks and enforcement mechanisms (Transparency International, 2021). Threats to government integrity, such as political interference and nepotism persist, making impartial decision-making and appointments an ongoing challenge (Khan, 2003).
Widespread corruption and ethical lapses erode public trust in government institutions, risking a decline in legitimacy and potentially fueling social unrest (Acharya, 2009). ASEAN nations with compromised government integrity risk damaging their global reputation, deterring foreign investments, and limiting opportunities for international collaboration (Transparency International, 2021).
Some ASEAN nations grapple with weak regulatory frameworks and ineffective enforcement, allowing corruption to persist. Strengthening these systems is vital for fostering transparency and accountability (World Bank, 2019). Rampant corruption hampers economic development by discouraging investments and fostering inefficiency, hindering overall progress in ASEAN nations (Busse, 2014). Corruption exacerbates social inequality by diverting resources from essential public services, widening existing disparities and fostering injustice within society (Khan, 2003).
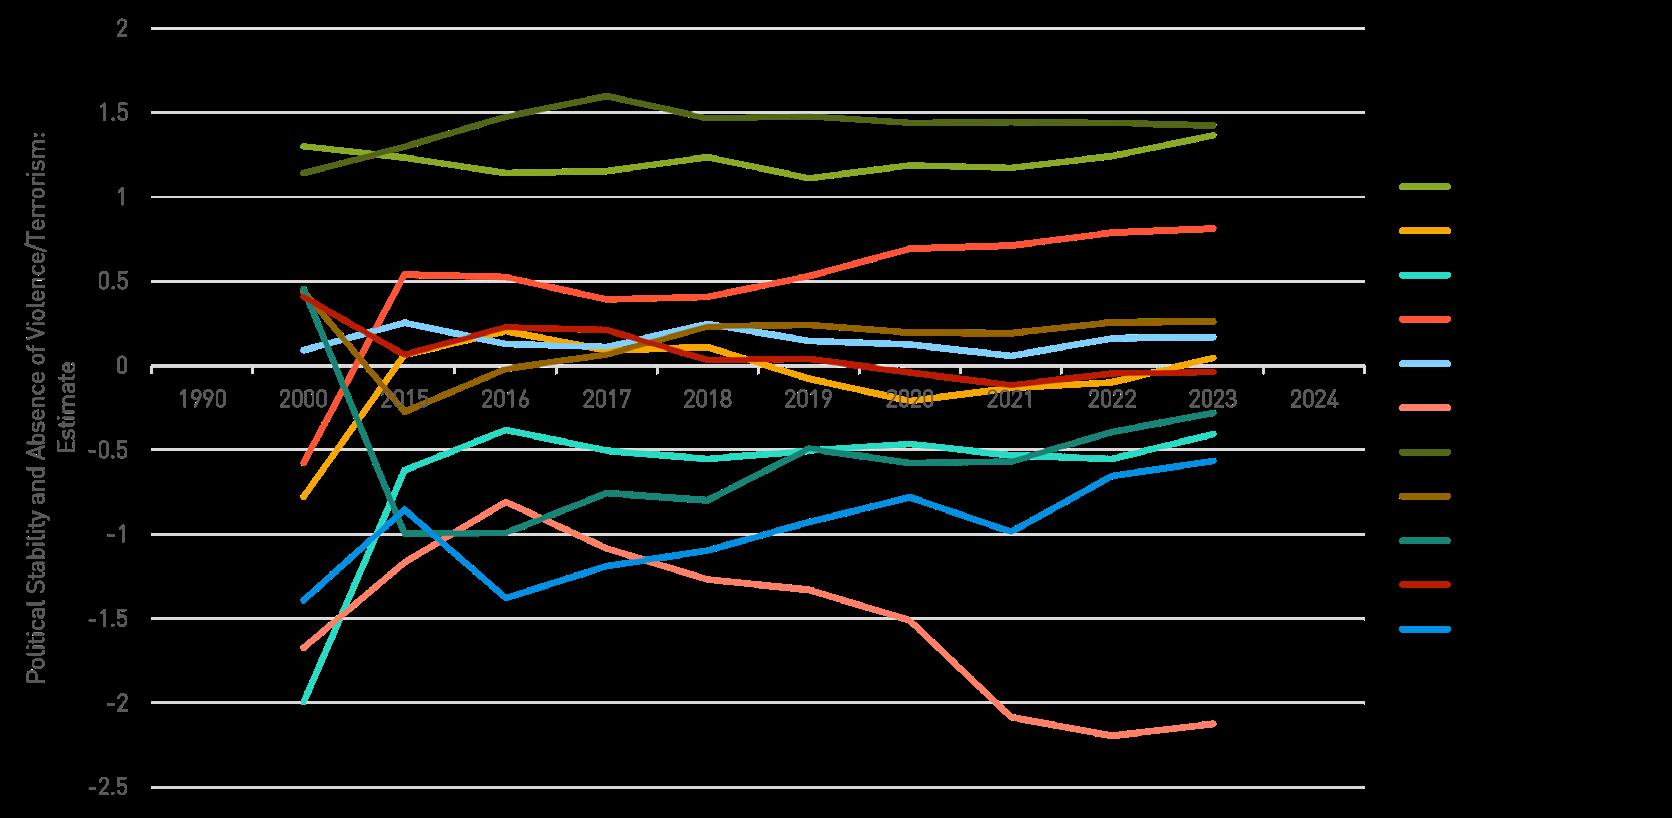
Figure 2.9.3 shows the rank of political stability among AMS between 1996 to 2020, with Singapore in the lead as ASEAN’s most politically stable nation.
In recent years, some Southeast Asian nations have faced political challenges that have had significant societal and economic impacts. Political transitions leading to shifts in governance have subsequent adverse effects on stability. In 2021, Myanmar’s change in leadership following political developments resulted in restrictions on internet usage, public protests, and instances of violence. These events had profound consequences, creating social divisions and hindering economic progress (CNA Insider, 2023).
The Philippines experienced a challenging period characterised by a government-led campaign addressing issues related to drugs. While aimed at combating illicit activities, the initiative faced criticism for its disproportionate impact on vulnerable communities. The resulting tensions raised concerns about justice and governance (Amnesty International, 2017). Historical events in Cambodia have left a lasting impact on its political landscape, with efforts made towards reconciliation. However, challenges such as human rights concerns, corruption, and slower economic growth persist, influencing the overall stability of the country (AlJazeera, 2019). It is crucial to acknowledge these complexities arising from political instability and work collectively towards fostering stability, respecting human rights, and promoting inclusive development in the region.
Geopolitical disputes
ASEAN nations face territorial disputes, particularly in the South China Sea, which could escalate and jeopardise regional stability. The overlapping claims and strategic importance of this waterway make it a focal point for geopolitical tensions (Asia Maritime Transparency Initiative, 2022).
Internal political instability
Some AMS grapple with internal political strife, marked by disagreements among political factions, protests, and civil unrest. These internal challenges can spill over into neighbouring countries, affecting regional stability (Oxford Research Group, 2018).
Transboundary threats
The rise of transnational threats, including terrorism, cyberattacks, and organised crime, poses a significant challenge to territorial security. The porous borders within ASEAN create opportunities for these threats to permeate the region, necessitating collaborative efforts to mitigate the risks (ASEAN Secretariat, 2020).
Impact on the economy
Political instability and territorial insecurity can have profound economic and humanitarian consequences in the region. Uncertainty and conflict deter foreign investments, disrupt trade routes, and hinder economic development, with countries experiencing significant declines in investor confidence (World Bank, 2023). Escalating political instability may lead to humanitarian crises, displacing communities and placing immense strain on regional resources. The consequences of territorial insecurity, particularly in conflict-prone areas such as Myanmar, have resulted in a significant increase in human rights abuses, indiscriminate violence, and community displacement (Human Rights Watch, 2025).
Regional discord
Persistent political challenges and territorial disputes can diminish ASEAN’s collective influence on the global stage. A lack of unity and resolution in addressing these issues weakens ASEAN’s ability to shape international discourse and promote regional interests (International Crisis Group, 2019).
The significance of freedom of expression, a fundamental human right, necessitates attention. In Southeast Asia, authorities tend to exert greater control, resulting in a perceived limitation of citizens’ freedom of expression.
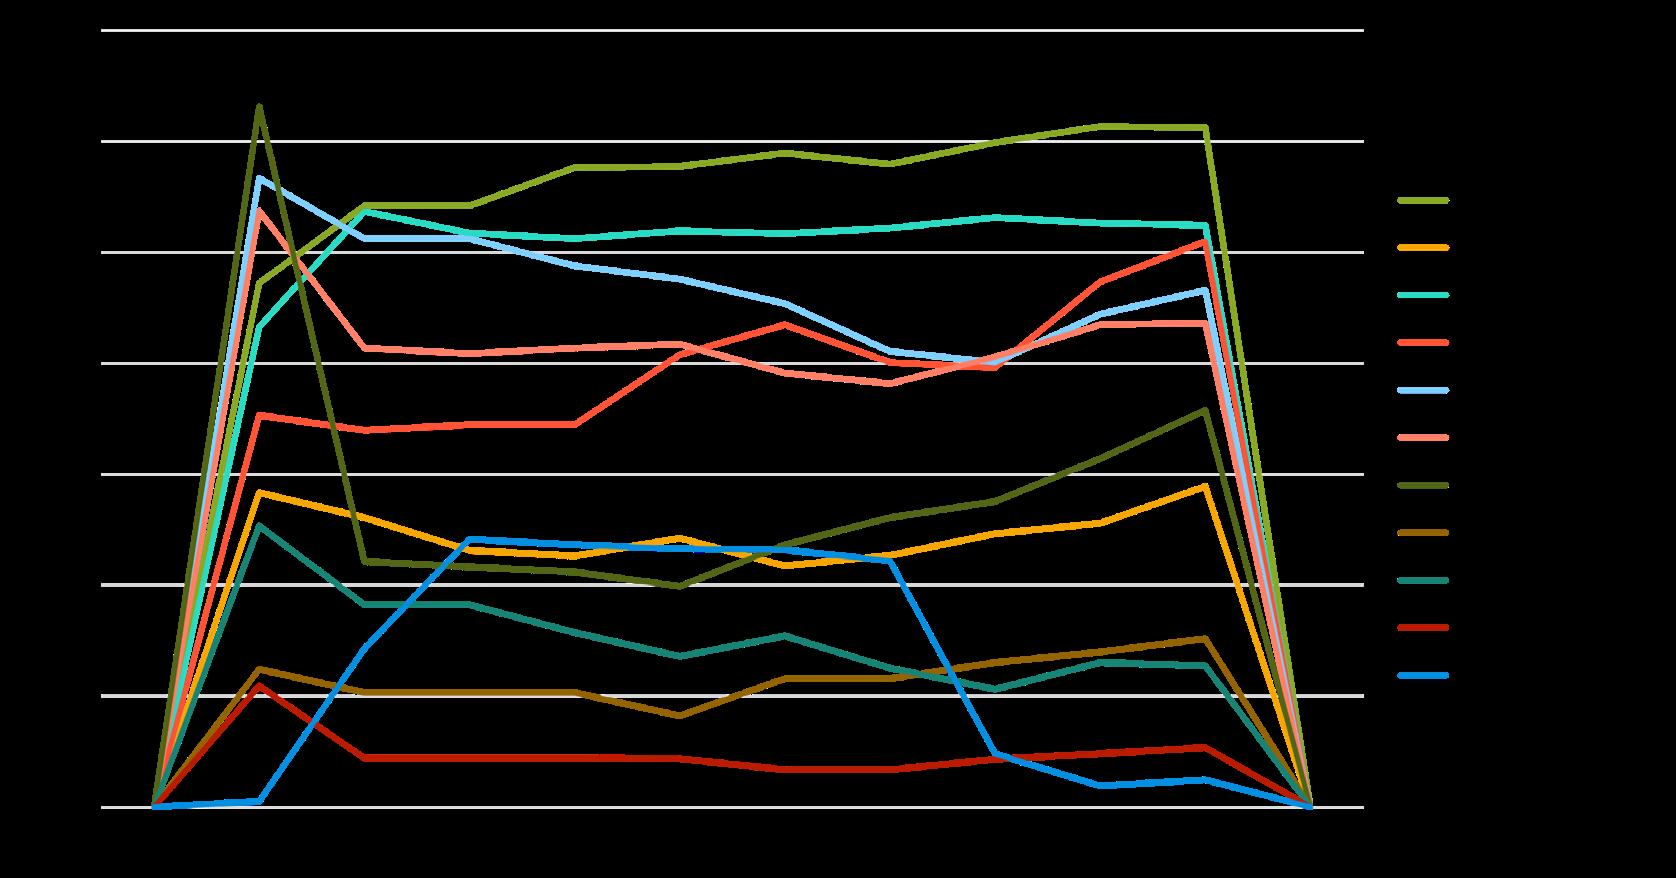
Figure 2.9.4 illustrates the percentile for voice and accountability in the AMS from 1996 to 2021. The ranking, ranging from 0 to 100, signifies the strength of a country’s voice and accountability, with higher rankings indicating better freedom of expression. In 2016, Malaysia, Indonesia, and Singapore witnessed a significant drop in their voice and accountability scores. Singapore, in particular, continues to restrict freedom of speech, exemplified by the detainment of activists criticising the government (Human Rights Watch, 2022). Malaysia introduced Article 10 of its Federal Constitution to enhance freedom of speech among citizens, while Indonesia has developed protective laws to ensure transparency and freedom of expression (Human Rights Watch, 2021; The Law Reviews, 2021).
Despite recent efforts, the overall trend in AMS reveals a decline in personal freedom, including freedom of expression and media coverage. The Freedom Index indicates different levels of personal freedom among AMS, with Singapore leading the other AMS, maintaining a steady performance from 1995 to 2024. Myanmar has shown a sharp decline in the past five years (Figure 2.9.5), highlighting governmental restrictions on media and speech in the region (Legatum Prosperity Index, 2025).
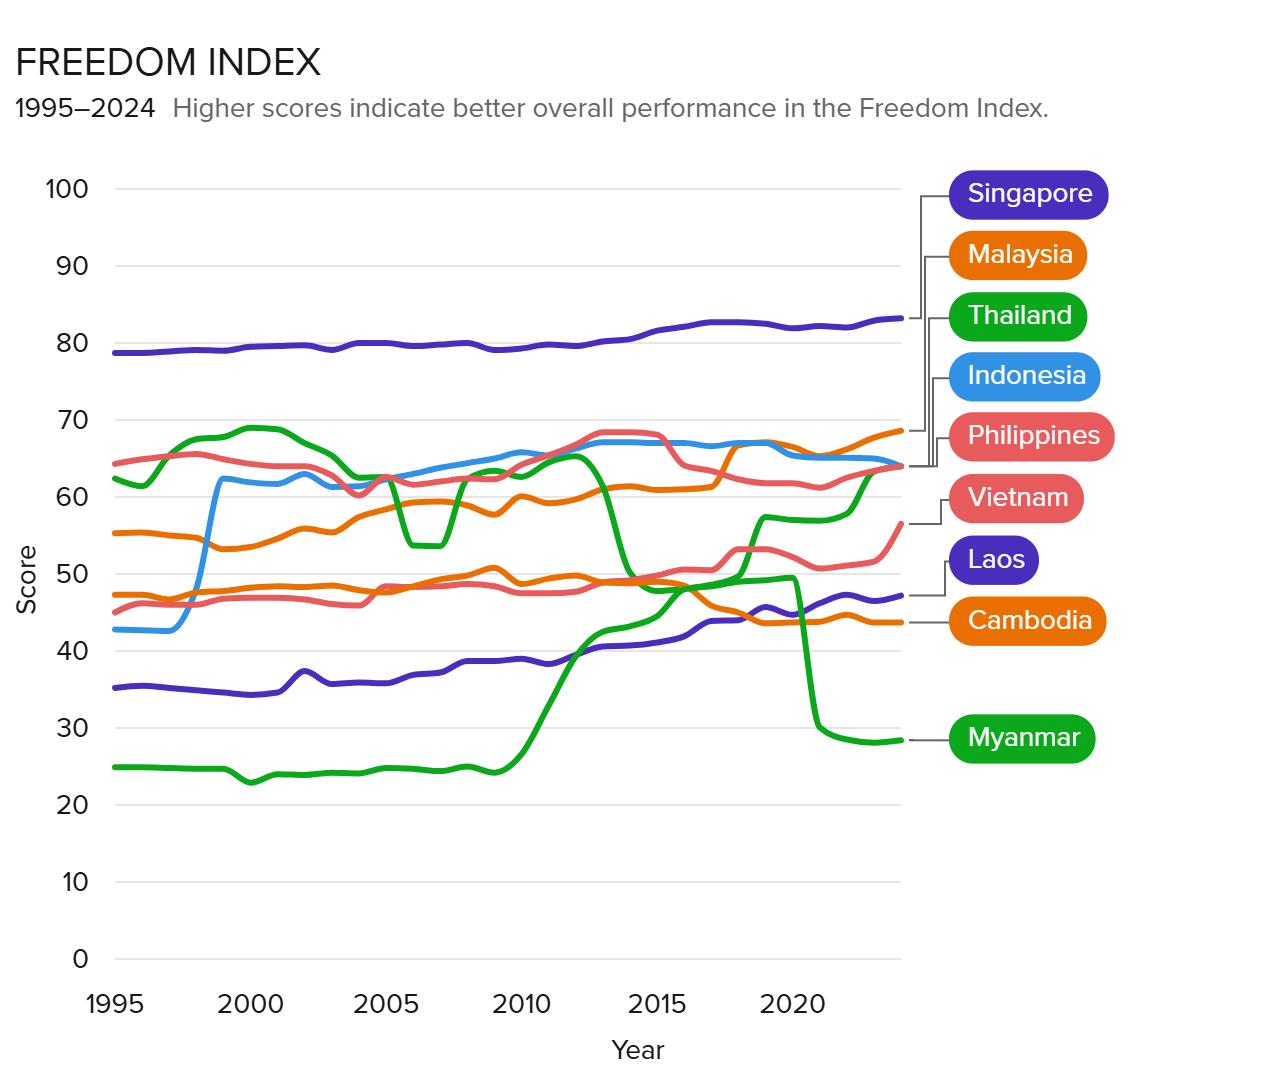
Governments often use legal measures to suppress dissent, limiting citizens’ space to voice opinions without fear of repercussions (Human Rights Watch, 2022). Certain ASEAN nations mired in political instability also exhibit high incidences of human rights violations. ASEAN has a history of military coups and crackdowns on dissent, resulting in widespread human rights abuses (Reuters, 2022; CFR, 2023).
Persistent threats to civil liberties can hinder democratic processes in ASEAN countries, restricting citizens’ participation in governance and accountability of leaders (Legatum Prosperity Index, 2023). Continuous violations of civil liberties and entrenched corruption in some AMS may erode public trust in government institutions, leading to heightened dissatisfaction and social unrest (ShapeSEA, 2020).
Absence of standard framework
Diverse approaches to civil liberties within ASEAN create regional disparities in human rights standards, making it challenging to establish a cohesive framework for protecting fundamental freedoms across member states (The Law Reviews, 2021).
Conclusion
Political stability within the ASEAN region remains a complex and dynamic landscape, marked by a range of challenges and trends. While some member states have demonstrated strong democratic institutions and governance, others have faced setbacks in the form of military coups, human rights concerns, and social inequalities. Historical legacies, such as the trauma of past conflicts, continue to influence the region’s political climate. Addressing these challenges often requires sustained efforts toward human rights protection, reducing corruption, and promoting inclusive economic development. Overall, the political stability of ASEAN is a critical issue that requires ongoing attention, collaboration, and commitment from member states to ensure a more stable and prosperous future for the entire region.
Social justice in Southeast Asia is essentially the equal distribution of basic needs to the entire population. To facilitate, enable, and realise this in an association of countries as diverse and disparate as ASEAN is, however, a complex exercise. This section explores several key topics that are crucial to understanding social justice in ASEAN. It begins with a brief account of social justice in ASEAN from a historical perspective, followed by these key aspects: wealth distribution, access to basic needs, and gender equality and social inclusion. This section ends with a contemplation on the way forward for ASEAN to achieve a more inclusive and equitable future that is accessible to all through STIE.
ASEAN’s commitment to social justice has persisted since its inception, rooted in the region’s struggle for independence from colonial powers. Nations like Indonesia, Malaysia, and the Philippines, grappling with a history of colonisation and social inequalities, framed their fight for self-determination as a pursuit of social justice (Smith, 2005).
Post-independence, ASEAN leaders acknowledged the importance of addressing social inequalities for political stability and economic progress. Prioritising poverty reduction, education promotion, and equitable resource access became central initiatives. Visionaries like Sukarno in Indonesia and Tunku Abdul Rahman in Malaysia championed social justice, asserting that independence should usher in a fairer society (Tan, 2011).
The formation of ASEAN in 1967 marked a pivotal moment in the region’s quest for social justice. The Bangkok Declaration that established ASEAN highlighted the member states’ commitment to social and economic development, peace, and stability. Foundational documents and goals integrated social justice principles such as equal opportunity, social welfare, and poverty alleviation (ASEAN Secretariat, 1967).
Rapid economic growth in ASEAN in the late 20th century presented opportunities and challenges for social justice. While lifting many out of poverty, it also exacerbated income inequalities. Governments responded with social policies, including land reforms, education initiatives, and healthcare programmes to address these disparities (Anwar, 1998).
Throughout its history, ASEAN has recognised the intrinsic link between social justice, political stability, and economic growth. Adapting strategies to evolving challenges and consequences faced by member states is essential.
Poverty is a significant issue in the ASEAN region. It affects millions of people and negatively impacts the region's overall development. The causes of poverty in ASEAN are complex and multifaceted, including factors such as lack of education, inadequate healthcare, and limited access to resources and opportunities.
Poverty rate is measured as the percentage of people living below the national poverty line (NPL). The NPL represents the minimum income required to live in AMS, and the proportion of people living below this poverty line varies across the region. Figure 2.10.1 shows the number of people living below the NPL in AMS in 2016 and 2023. From the figure, Cambodia experienced the highest increase in poverty rate, an increase from 13.5% to 21.5%. Most other AMS experienced a reduction in the poverty rates.
Income inequality is characterised by the uneven distribution of income among households or individuals in a country. The income inequality is measured by the Gini Coefficient, which is a ratio between 0 (perfect equality) and 1 (perfect inequality). Figure 2.10.2 shows the Gini Coefficient for AMS for 2010, 2015 and 2023. Most AMS have made progress in reducing income inequality except for Laos. The rate of reduction varies across countries.
The above information highlights that more inclusive and targeted social development policies are needed across the AMS to reduce poverty rates in the rural and urban areas; and reduce income inequality within AMS and across member states.
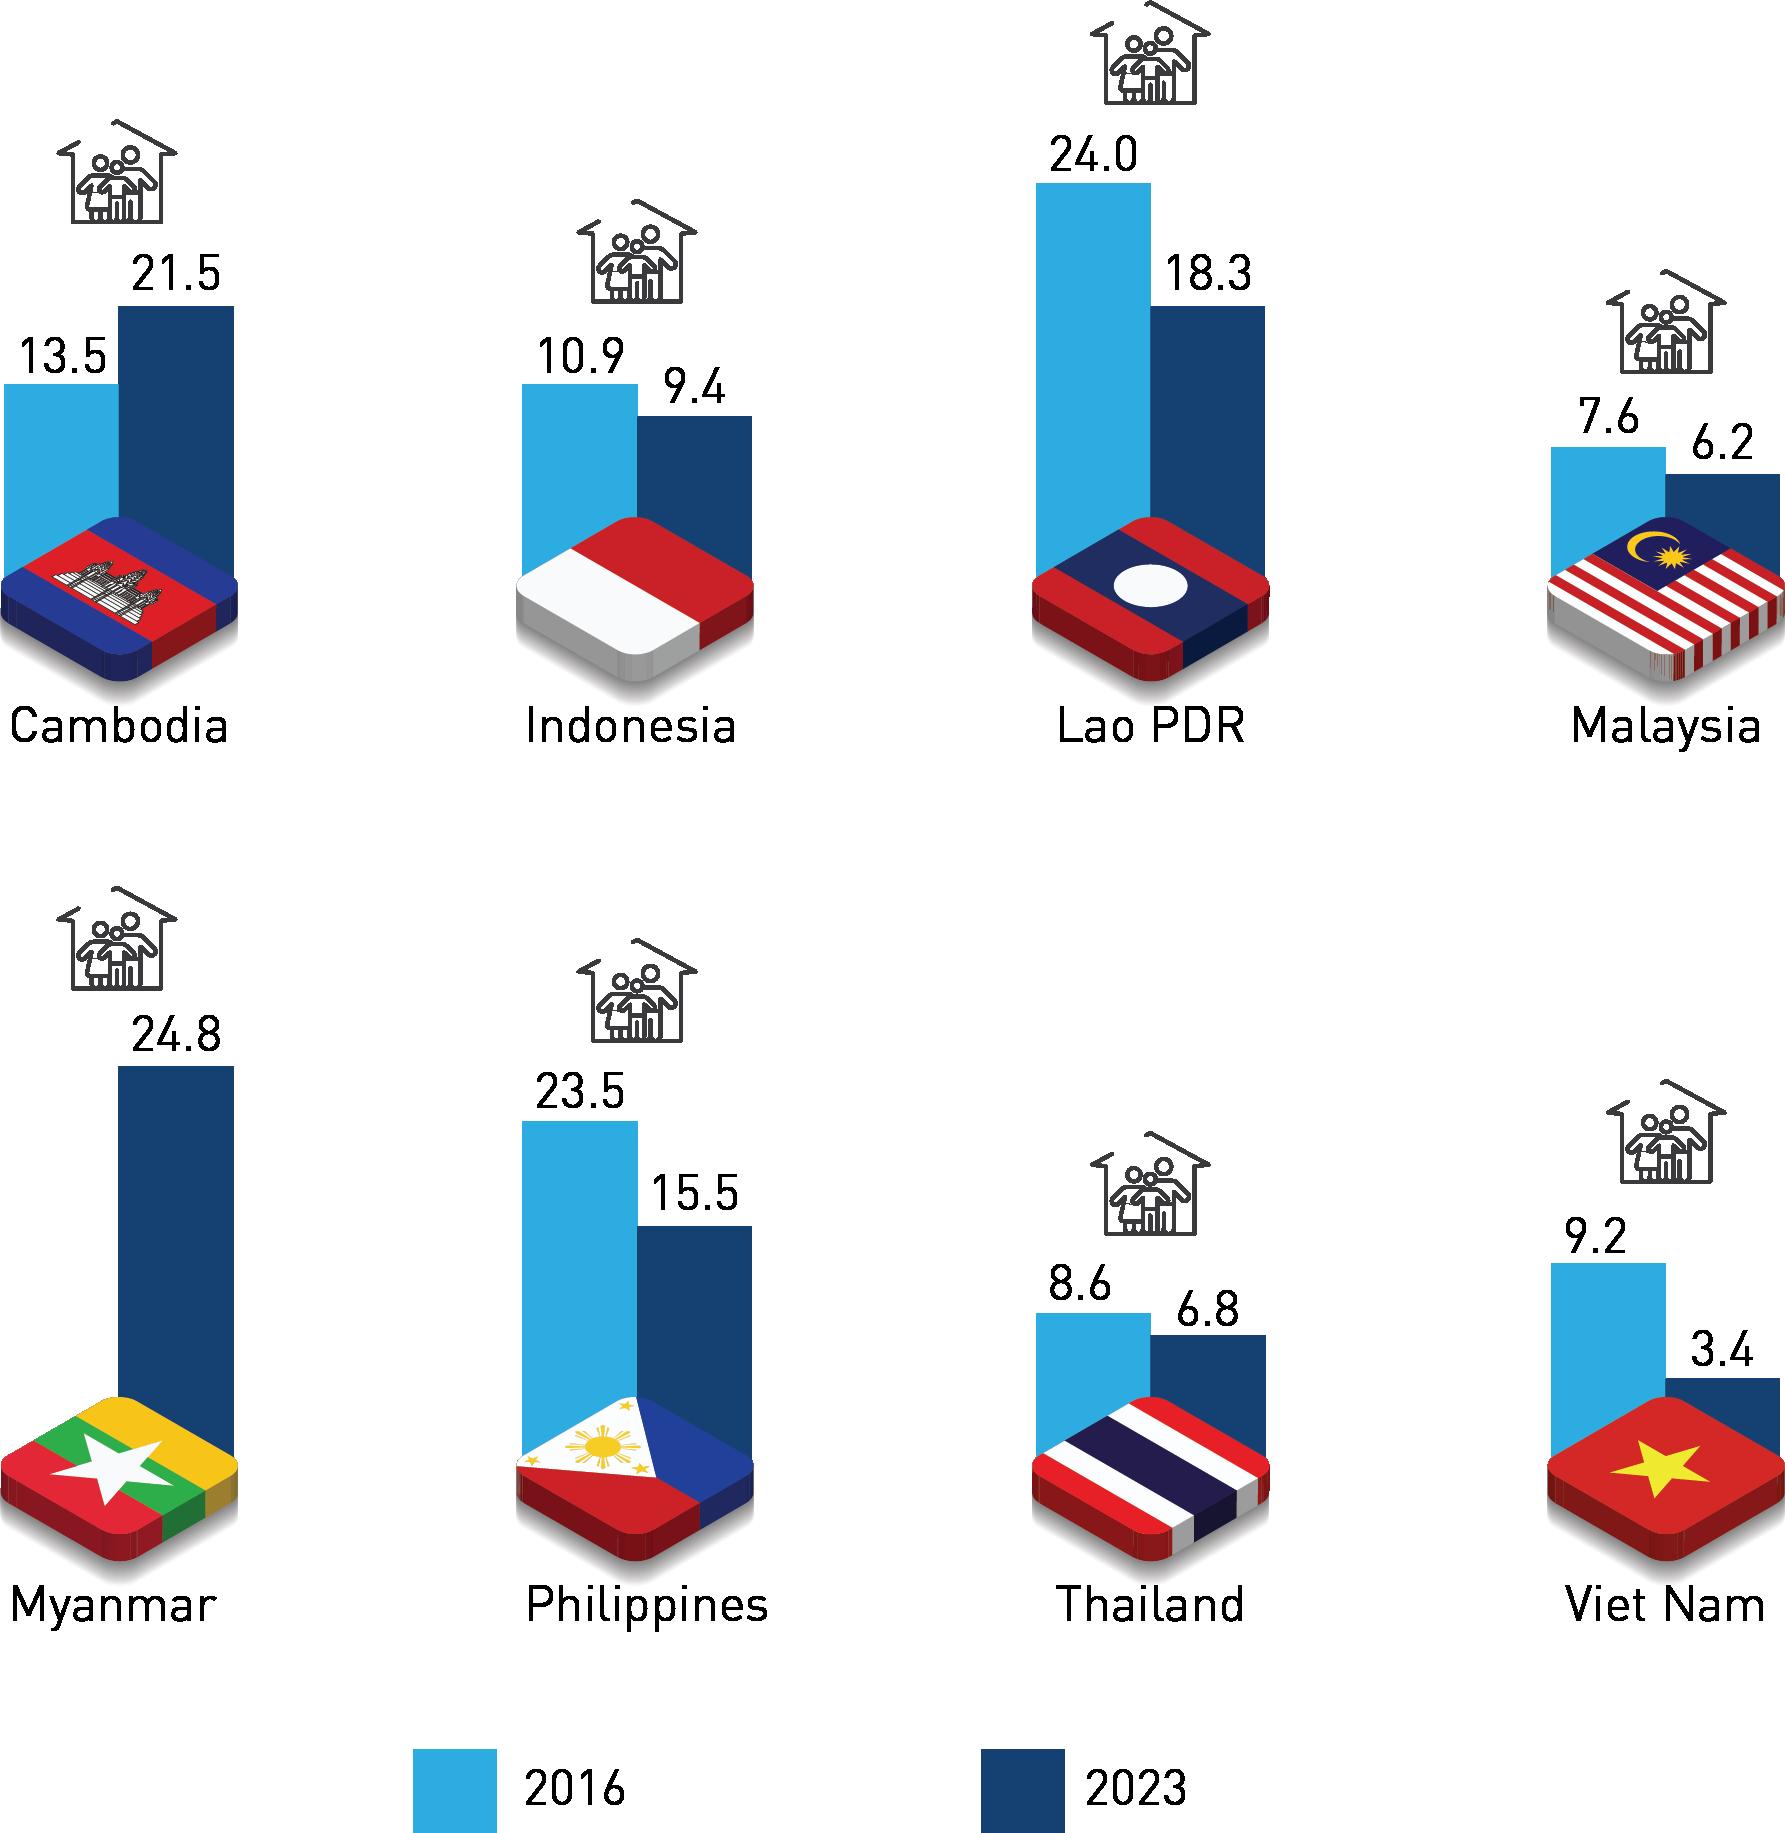
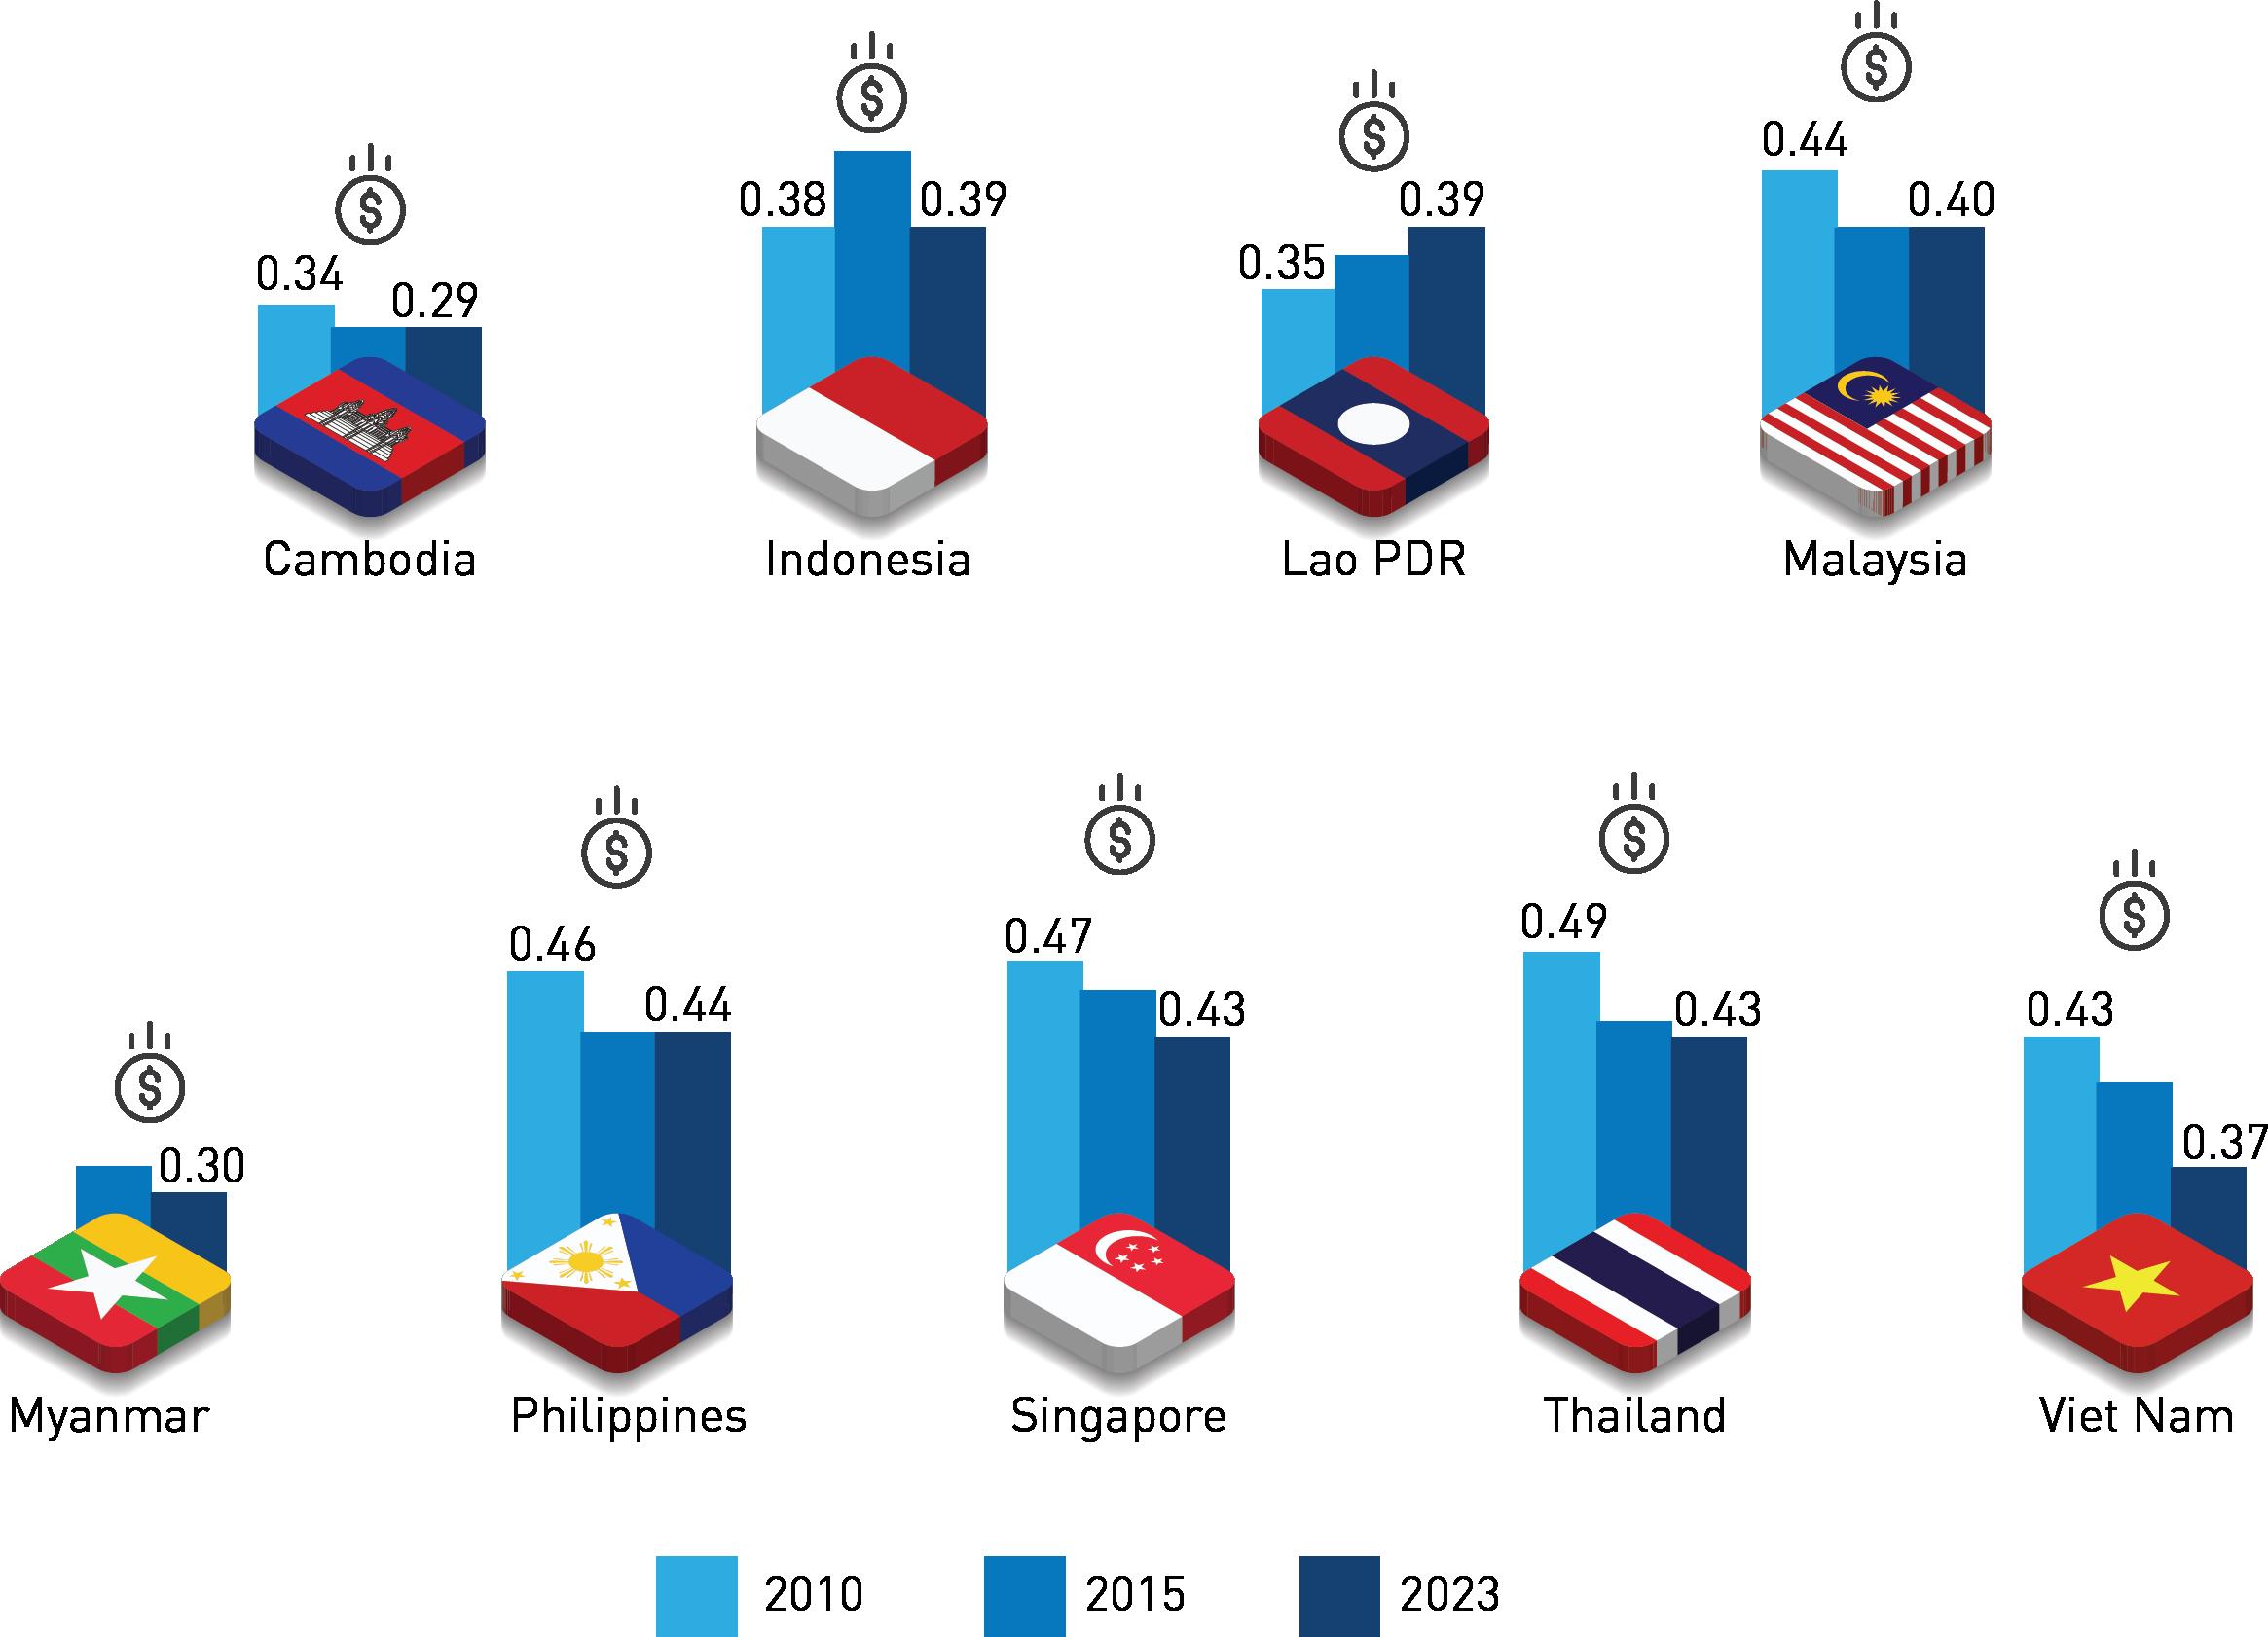
Socioeconomic inequality
Income inequality creates political instability, discontent, and potential social unrest, affecting governance (Stewart, 2015); moreover, educational disparities hinder quality education access, trapping individuals in poverty cycles (World Bank, 2020). Socioeconomic inequality within ASEAN is a multifaceted challenge, reflecting disparities across member states. Income inequality persists in the region, with factors such as education, employment, and access to healthcare contributing to the widening gap (ADB, 2020). Countries like Indonesia and the Philippines have witnessed notable improvements in poverty reduction, but inequality remains a concern due to uneven economic growth (Ranis et al., 2019). In Cambodia and Myanmar, challenges related to rural-urban disparities and limited access to opportunities exacerbate socioeconomic inequality (ADB, 2020). Singapore, while boasting high overall prosperity, contends with income inequality, prompting government initiatives to address the wealth gap (Chua, 2019). The ASEAN Economic Community (AEC) aims to promote inclusive growth, but its success in mitigating socioeconomic disparities requires continual assessment and adaptation (ASEAN, 2015).
Urban vs rural poverty
Rural-to-urban migration for better opportunities leads to persistent urban poverty, exemplified by Singapore’s challenges (SSR Snippet, 2018). In the Philippines, about half of the population resides in urban areas. Nearly 45% of those living in informal settlements are highly exposed to flooding and climate shocks, making urban poverty closely tied to climate vulnerability (World Bank, 2022; Reuters, 2024), while Malaysia grapples with rising urban poverty rates due to high living costs (NST, 2023). Thailand has achieved significant poverty reduction, falling from 58% in 1990 to 6.8% in 2020; yet, 79% of its poor population still resides in rural areas, with rural households disproportionately affected by income losses during the COVID-19 pandemic (World Bank, 2022). The COVID-19 pandemic exacerbated rural poverty, creating regional disparities (The World Bank, 2021).
The importance of internet access, recognised as a basic need by the United Nations Human Rights Council in 2016, is particularly vital for rural communities; however, limited network coverage in certain regions hinders their accessibility. A significant gap in internet access was evident from 1985 to 1995, with numerous ASEAN countries lacking the necessary infrastructure for connectivity (ASEAN Issue, 2022). Efforts to enhance internet accessibility are ongoing. Initiatives are underway to establish an ASEAN Single Telecommunications Market, demonstrating a commitment to improving internet connectivity within the region (ASEAN SEC, 2017). Figure 2.10.3 shows that internet penetration has improved in most AMS except for Cambodia and Indonesia.
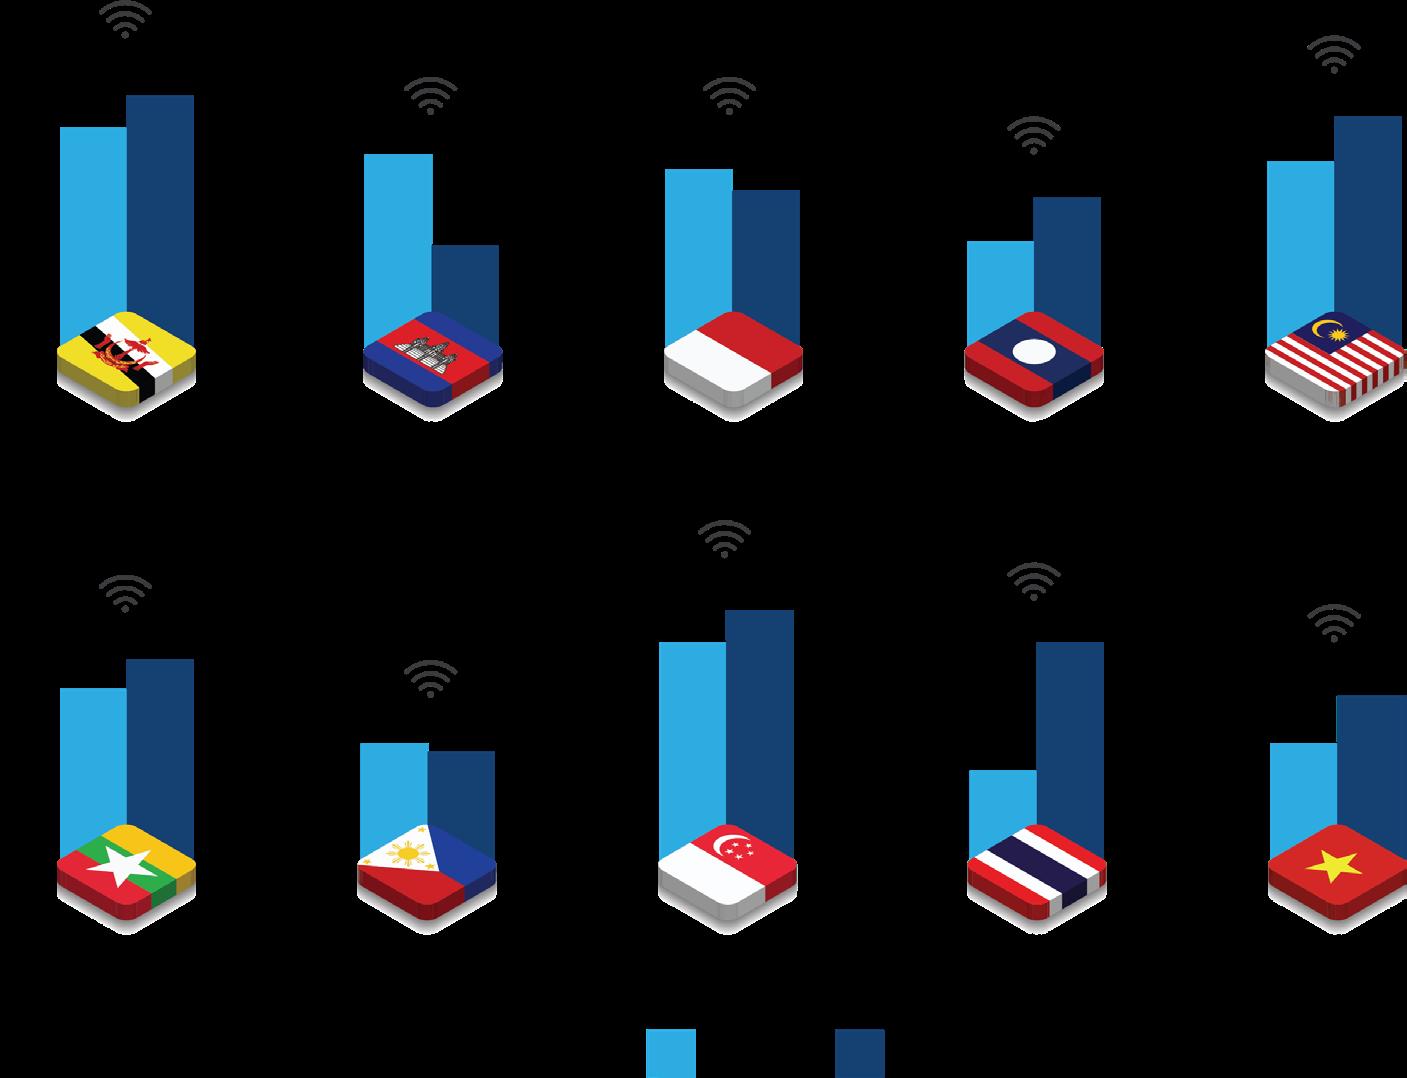
In today’s world, access to electricity is a fundamental necessity. Access to electricity in urban AMS areas has improved over the last 20 years, with all urban AMS now achieving 100% electrification, ensuring widespread access (World Bank, 2023).
Despite Singapore’s limited natural resources, it has consistently maintained 100% electrification since 1990, surpassing other AMS. Singapore’s commitment to infrastructure development, power plant investment, and transmission line expansion, combined with diversified power sources and efficient technologies, has ensured a reliable energy supply (ADB, 2013). Conversely, challenges persist in rural areas of some AMS. Cambodia had one of the lowest electrification rates in Southeast Asia. While slow progress was observed until 2000, the country made rapid advancements in electrification, surpassing Timor Leste and Myanmar. By 2021, Cambodia successfully achieved 100% electricity usage for urban populations (World Bank, 2023). However, challenges persist in rural areas where households rely on clean fuels and technologies like electricity, solar lanterns, rechargeable flashlights, and biogas lamps for lighting (Khmer Times, 2023).
Economic growth in Southeast Asia has raised incomes, enabling more people to afford healthcare services and increasing average life expectancy from 52.1 years (1965-1970) to 69.3 years (2005-2010). In response to growing healthcare demands, governments are rapidly increasing healthcare expenditures and improving healthcare infrastructure. The rise in non-communicable diseases has prompted AMS to enhance its healthcare systems, particularly in the public sector, ensuring healthcare access for all citizens. Simultaneously, wealthier individuals seek higher-quality healthcare services and access to the latest medical technologies offered in the private sector (The Lancet, 2011).
Since 2014, universal health coverage has been a key priority in the Southeast Asia region, with service coverage improving from an average of 47% a decade ago to over 61% in 2020. Nevertheless, challenges persist, and the COVID-19 pandemic has prompted innovation and new problems for member states striving to implement primary healthcare (WHO, 2021).
Inequitable access to education within the ASEAN region remains a pressing issue (especially for tertiary and STEM education), with disparities in educational opportunities leading to profound consequences and challenges. Despite the overarching goal of fostering regional development and integration, educational inequalities persist across many member states. Variations in educational infrastructure, resources, and quality contribute to disparities, particularly affecting rural and marginalised urban populations (World Bank, 2021). The absence of adequate educational facilities and qualified teachers in certain areas exacerbates the problem, limiting the educational prospects for many of ASEAN’s youth.
Across ASEAN, at least 140 million children and adolescents saw their schools closed for an average of 30 weeks during COVID-19, and an estimated 35 million learners had no access to their schools for almost two full academic years (The ASEAN, 2022). Many more millions of the most disadvantaged children and adolescents lost learning opportunities due to the digital divide, as well as other negative impacts of the pandemic. Tremendous inequity and learning losses are now looming over the ASEAN community due to the loss of quality education during the pandemic period. The latter is due to the fact that many students in rural and disadvantaged communities lack access to quality digital learning platforms. Access to online learning infrastructure and support services remains a challenge for many rural communities in AMS. This will adversely impact the learning outcomes and prepare the next generation from these communities for a knowledge-intensive global economy.
Bridging the infrastructure gap
An infrastructure gap refers to the disparity between required and actual infrastructure investment. PwC’s report on Southeast Asian Infrastructure Spending forecasts an increase in annual spending until 2025. Comparing this with the estimated actual spending in 2015 reveals a significant gap, as projected by ADB for 2016-2020. This gap poses a challenge: without increased infrastructure spending, the demand will not be met, potentially slowing economic growth. ASEAN’s infrastructure spending as a percentage of GDP is comparatively low compared to other nations (see Figure 2.10.4 below), emphasising the existing gap. Most countries lack sufficient public sector capital, especially emerging economies. Government spending alone cannot bridge the gap, necessitating significant involvement from the private sector.

The challenges and consequences of accessing basic needs encompass a range of critical issues. The region has made notable progress in improving access to essentials such as electricity, healthcare, education, and the internet, particularly in urban areas. However, disparities in access persist, affecting rural populations and vulnerable groups.
The disparity in access to basic needs is often interrelated, with challenges often merging to create new ones. For example, disparities in digitalisation and education have far-reaching consequences, impacting not only individual lives but also the overall socioeconomic landscape of the region. Unequal access to education perpetuates social and economic inequality, hindering the development of human capital essential for sustainable growth. Moreover, the digital divide poses a significant challenge in the modern educational landscape. As digital technologies play an increasingly vital role in education, the lack of access to digital resources and connectivity further widens the gap (PHIC, 2020).
The inability of ASEAN to ensure universal access to multiple basic needs thus has repercussions that reverberate across the region and affect the entire population.
The prevailing inequity in access to basic needs within ASEAN stems from weakness in the region’s infrastructure, including electricity, healthcare, and internet services. The inability to achieve 100% internet usage across member states is indicative of the connectivity and digitalisation challenges in ASEAN (World Bank, 2021). Limited internet is primarily attributed to the inadequacy of digital infrastructure, broadband networks, and fibre-optic cables, particularly in rural areas (Jalli, 2020). The consequential absence of reliable and affordable internet access is, therefore, a major challenge.
While economic growth and government investments have positively contributed to improved healthcare access, universal coverage remains elusive. The phenomenon of urbanisation and the expansion of the middle class have propelled private healthcare; however, the lack of private-level hospital infrastructure, specialists, and skilled workforce in rural areas has created disparities in access to high-quality healthcare, which is increasingly becoming a privilege available only to the wealthy.
Simultaneously, advancements in infrastructure investments have notably improved access to electricity in urban areas. However, rural areas across ASEAN still face challenges in this regard due to the lack of the necessary infrastructure for equitable electrification.
Globally, gender gaps in primary and secondary school enrolment have narrowed, with high overall enrolment rates of 90% for boys and 89% for girls. However, in low-income countries, girls face lower completion rates, with only 63% finishing primary school, compared to 67% of boys. Similarly, lower secondary school completion rates for girls are lower, at 36%, while those for boys stand at 44%. The gender gap persists in upper secondary education, with completion rates of 26% for young men and 21% for young women in lower-income countries (UNICEF, 2021).
Within ASEAN member states, the percentage of female students’ enrolment at the primary level has shown varying patterns over the past two decades. However, many of the AMS have managed to close the gender gap in primary education. Figure 10.2.5 shows the gender parity index (GPI) for primary school enrolment. If GPI is below 1, this indicates that girls face more challenges in accessing education. On the other hand, a GPI higher than 1 indicates a higher enrolment rate for girls compared to boys. The figure shows that most countries have a positive trend towards achieving gender parity in primary education. Malaysia, Vietnam and Thailand’s GPI were above 1, which suggests that these countries have more female enrolment than their male counterparts. Only the Philippines has recorded a GPI below 1 –female access to primary education continues to lag behind male enrolment.
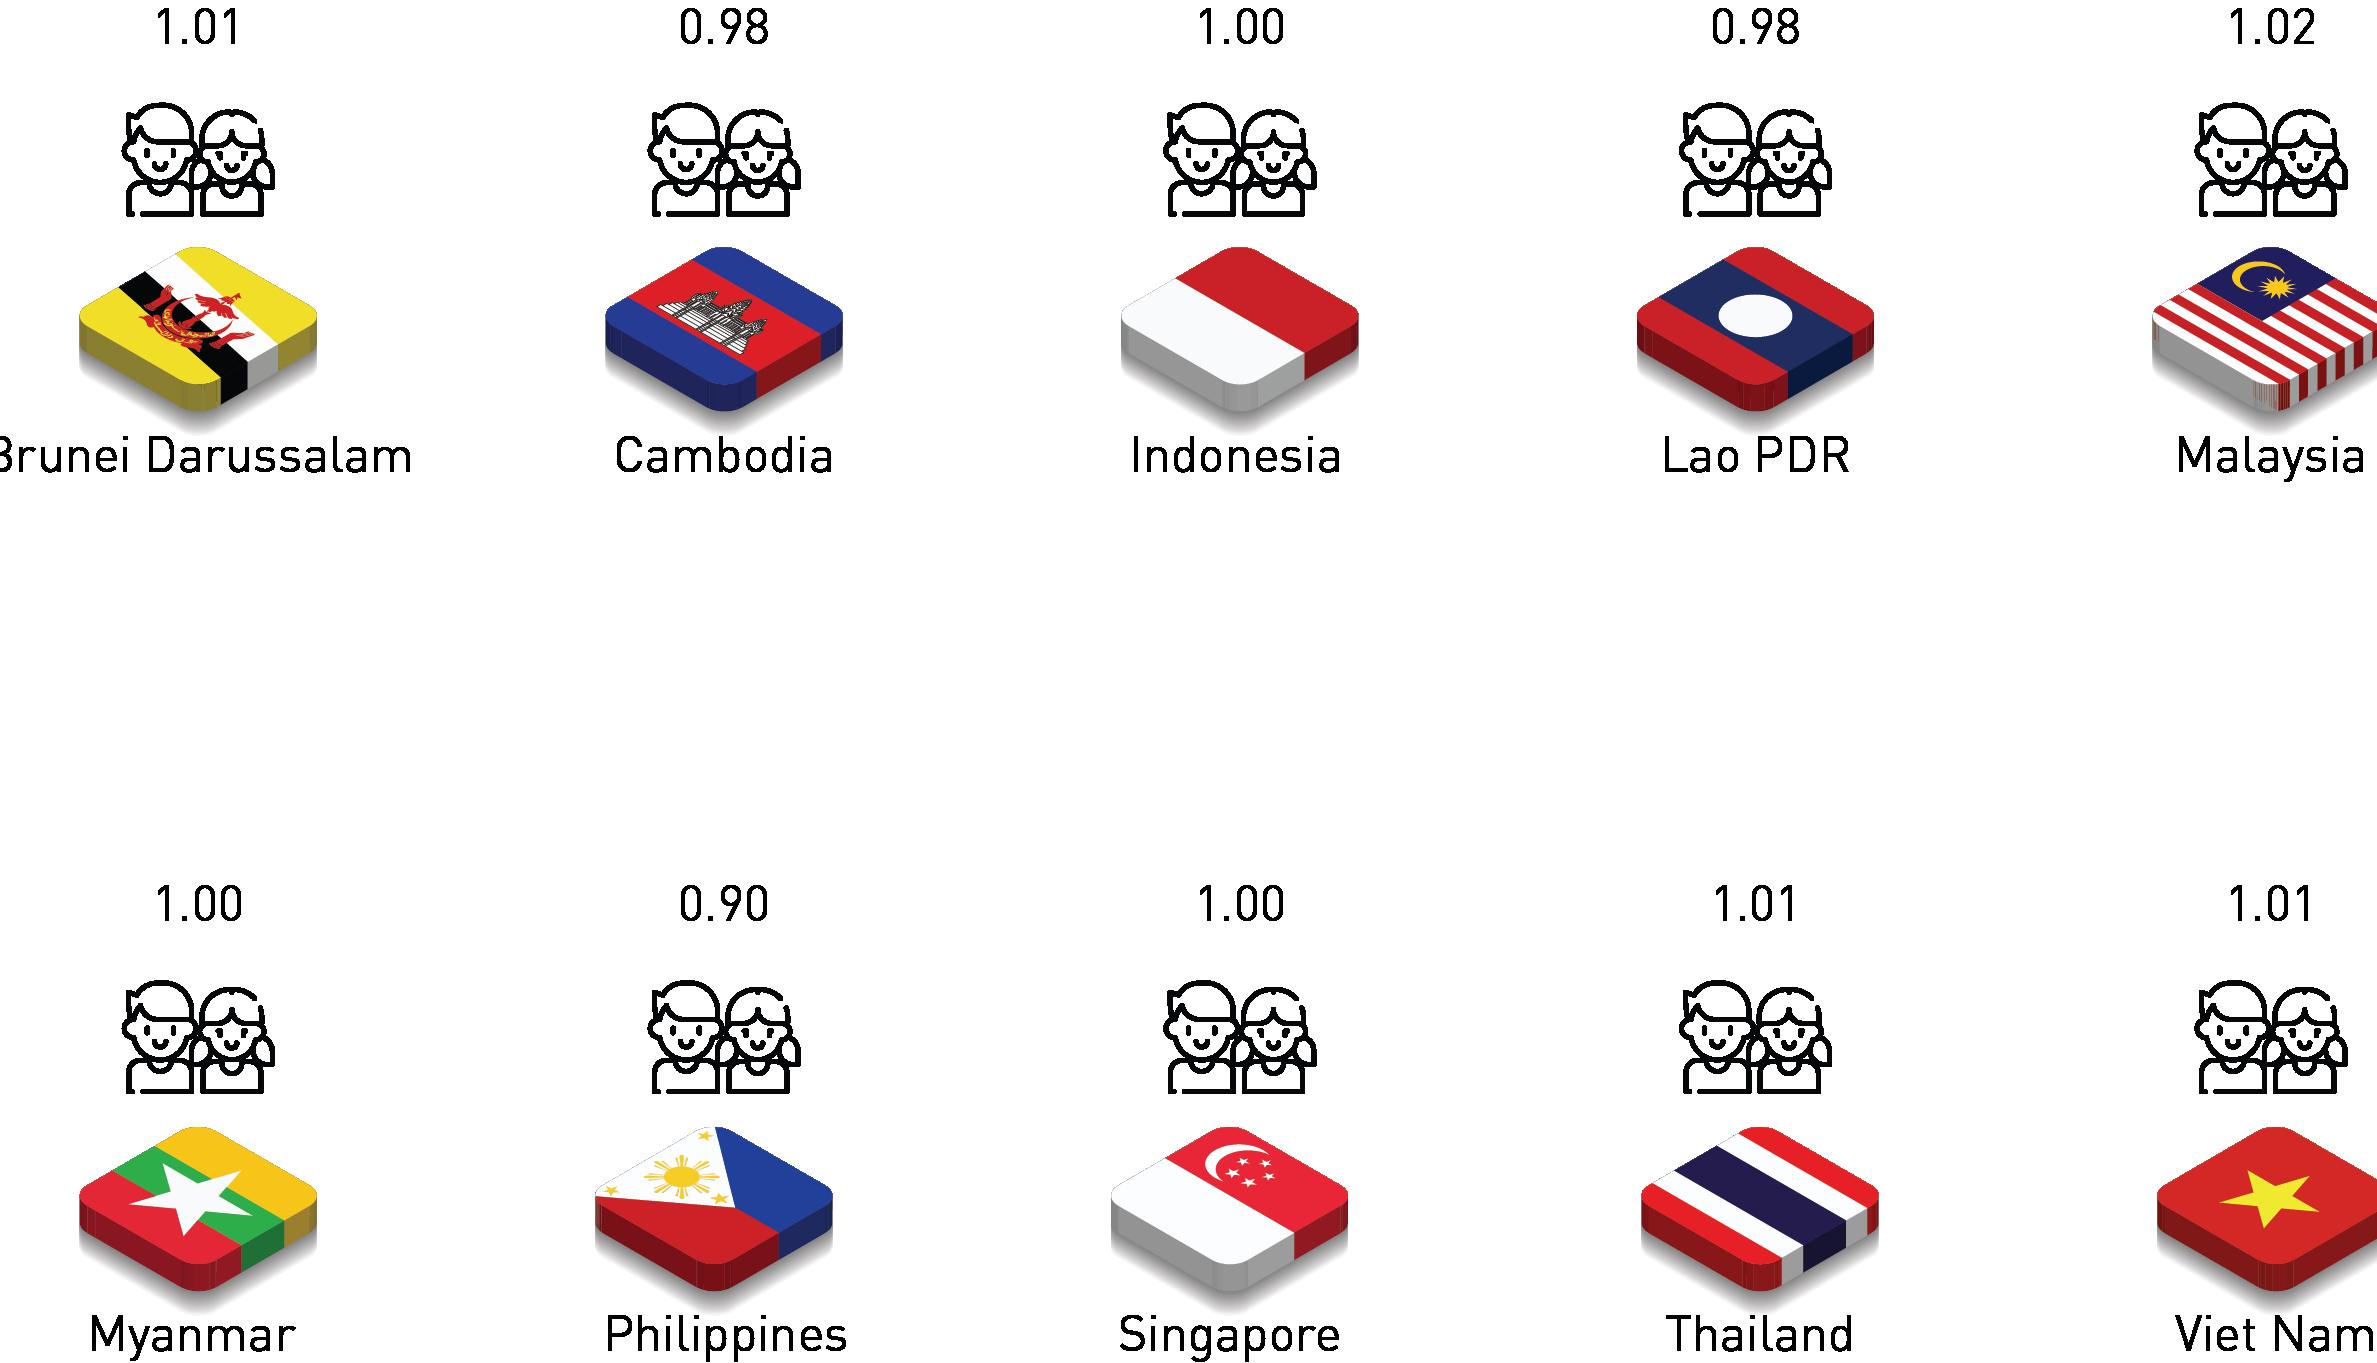
The labour force, defined as individuals aged 15 and older engaged in work for goods and services (World Bank, 2023), reveals varying degrees of progress in female workforce participation across ASEAN nations. Lao PDR achieved the second-best ranking in the region, signalling significant advancements in offering women opportunities in the workforce (AEC Blueprint, 2020). Singapore secured the third position, attributed to its robust economic development and the availability of workforce opportunities for women, potentially influenced by policies promoting gender equality (The ASEAN, 2021).
Vietnam demonstrated excellence by closing 98.2% of the gender gap in educational attainment, achieving gender parity in tertiary enrolment, and substantially reducing the gender gap in economic participation and opportunity by 76.5%. This favourable position is further reinforced by a relatively small income gap between men and women (The ASEAN, 2021). In contrast, Malaysia and Myanmar ranked lower at 112th and 114th, respectively, indicating challenges in addressing gender disparities across economic opportunities, education, health, and political empowerment (The ASEAN, 2021). Across ASEAN, women account for about 48% of researchers but hold only 32.8% of managerial positions (ASEAN Secretariat, 2023).
In education, gender disparities, especially in STEM fields, persist across ASEAN due to societal stereotypes and biases. These biases limit women’s aspirations, affecting academic and career choices and resulting in disparities in labour market participation and job segregation (The Interpreter, 2022). Early marriage is a prevalent issue in some ASEAN countries, hindering women’s education. Young brides often discontinue schooling, face early childbirth, and are at a higher risk of partner violence, impacting women’s long-term well-being and economic prospects (UNICEF, 2021).
In the labour force, challenges arise from the gender wage gap and occupational segregation, with women earning less than men for equivalent work. In 2024, the average female labour force participation rate across the region was only 55%, significantly lower than that of men (The Global Economy, 2024). Figure 10.2.6 shows the labour participation rate by gender in AMS. The figure shows that women's participation is low compared to their male counterparts. Occupational segregation limits access to higher-paying jobs, perpetuating economic disparities despite regional economic development (World Bank, 2022). Lack of support systems, such as affordable childcare, poses a challenge for working women, especially where traditional gender roles persist. Insufficient policies and infrastructure hinder women’s labour market participation and career advancement (International Labour Organisation, 2023).
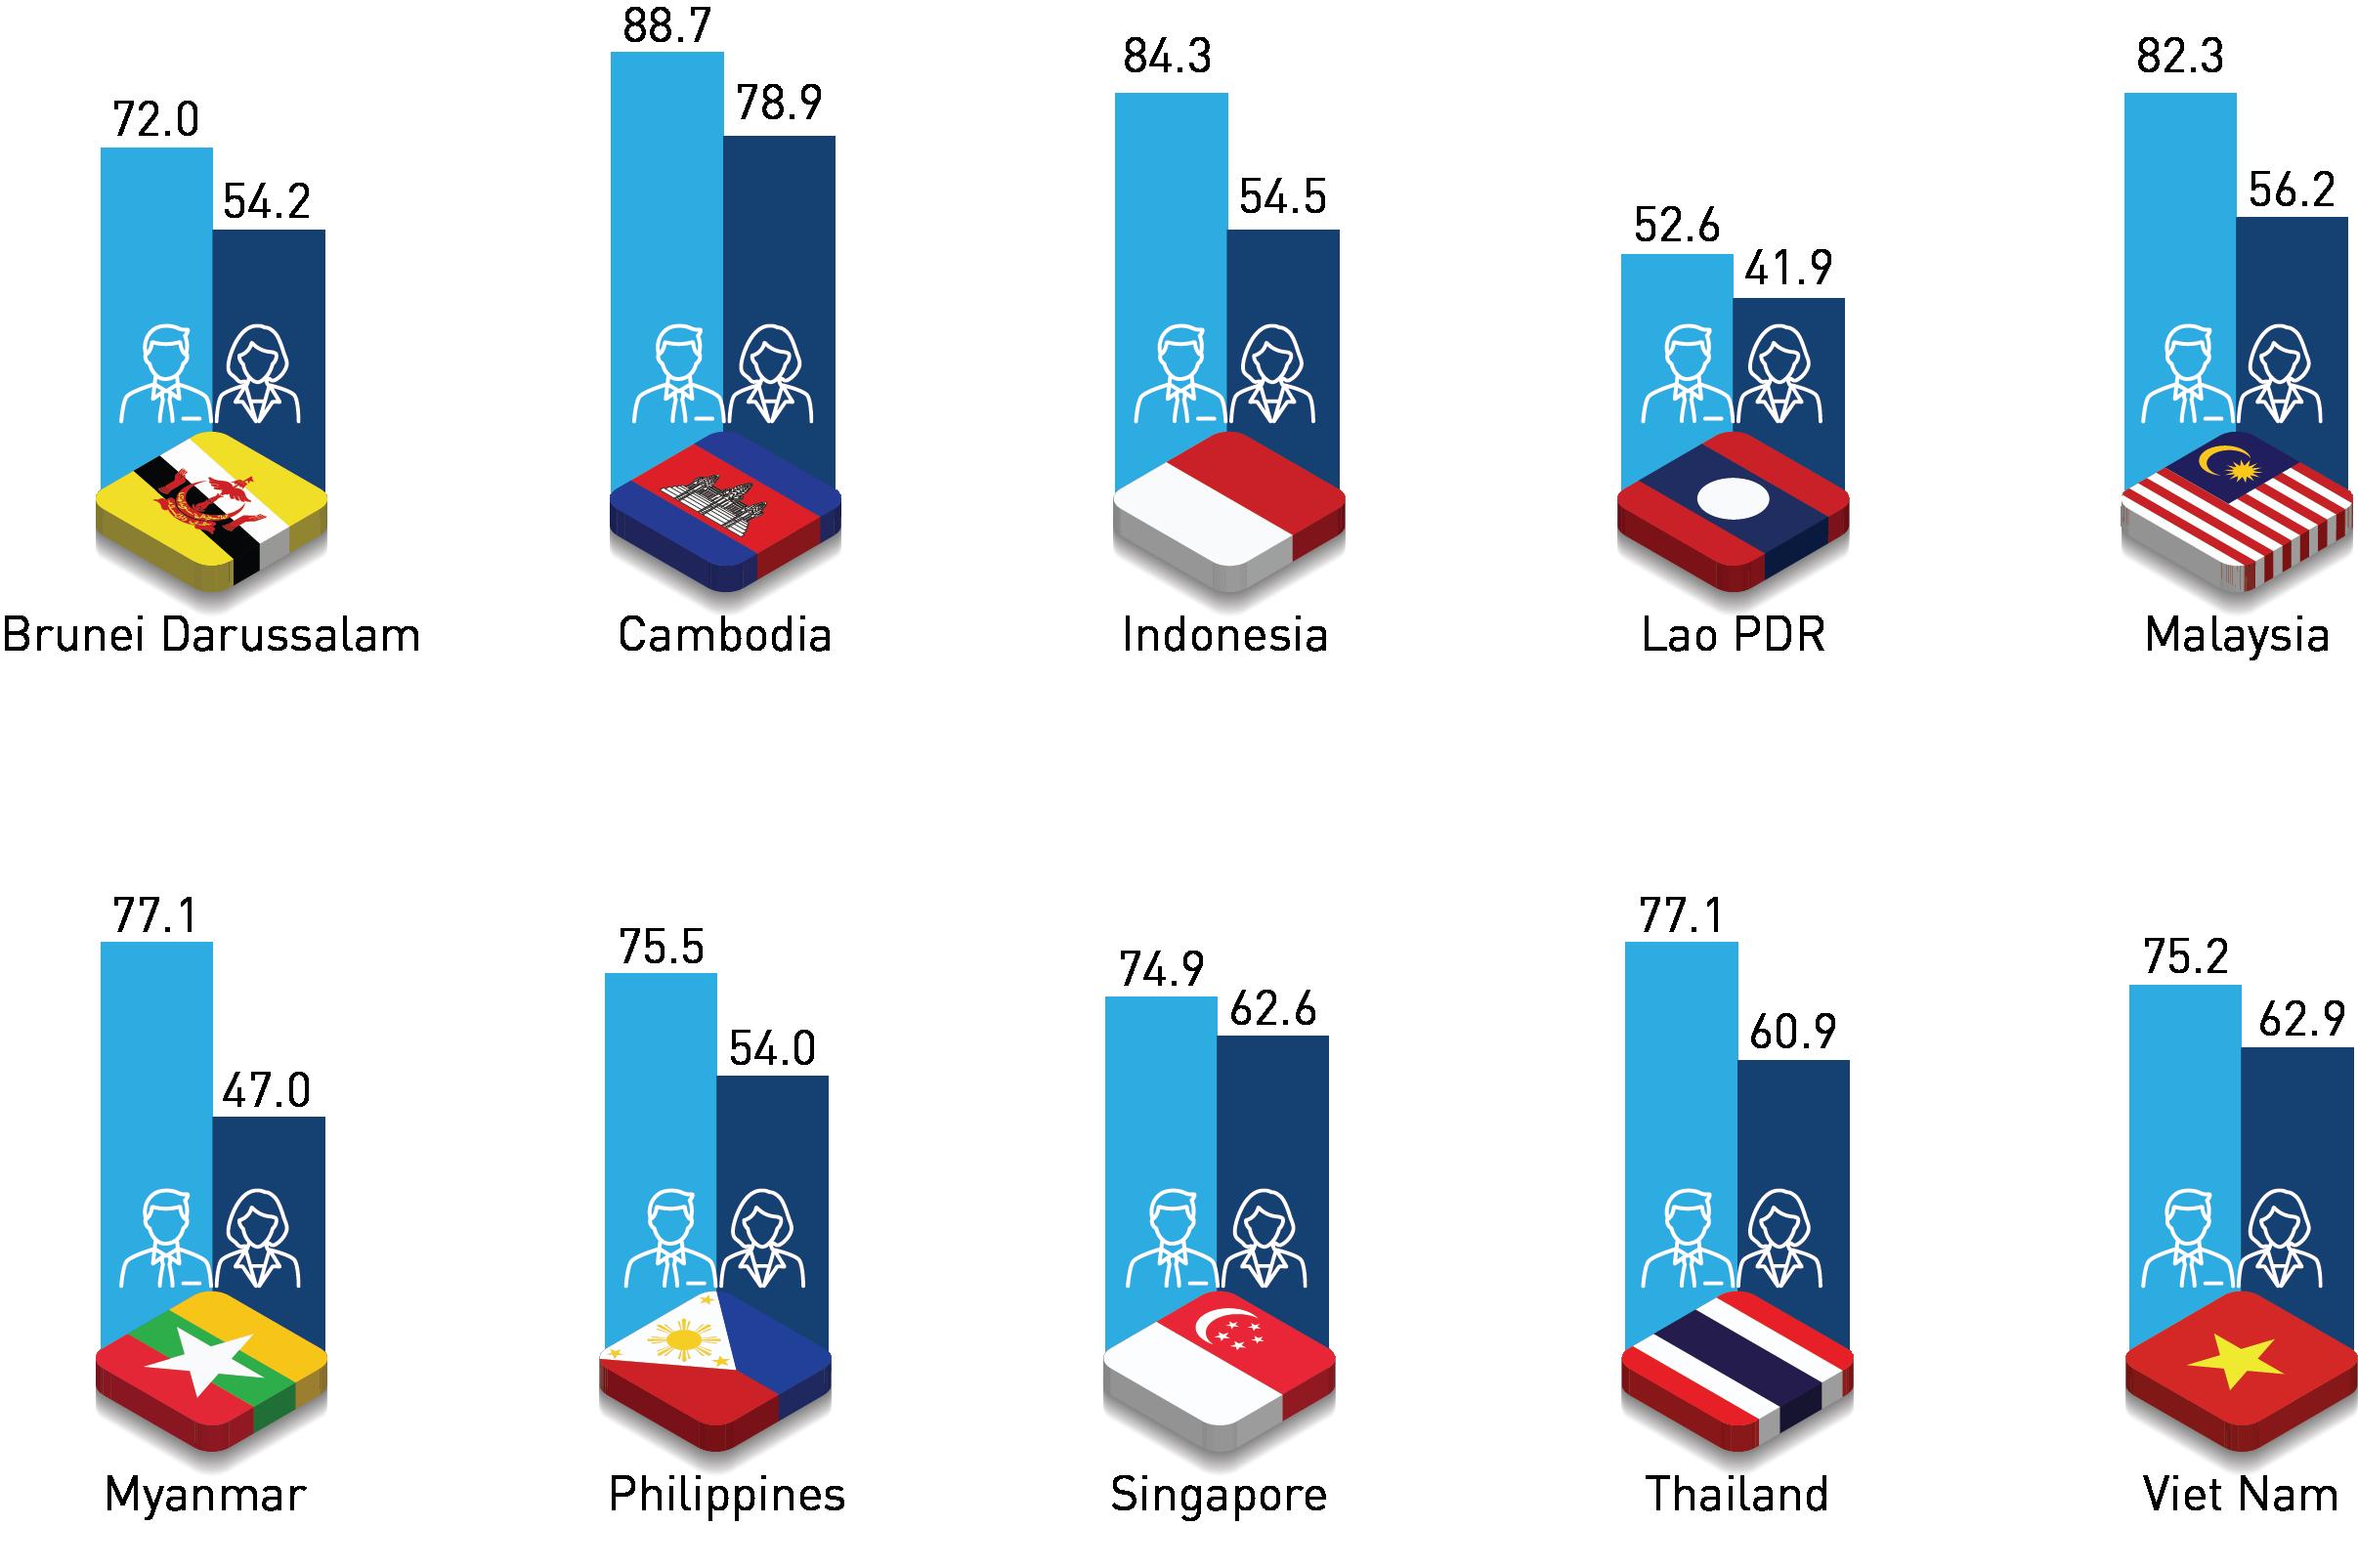
Conclusion
Social justice in ASEAN is a multifaceted and dynamic undertaking that encompasses various dimensions, including economic, educational, and gender equality. As we look to the future, it is evident that the region is making strides in promoting social justice and equitable development. However, significant challenges remain, particularly in addressing income inequality, providing quality education for all, and achieving gender parity in the workforce and society.
To shape a more socially just ASEAN, proactive policies and sustained efforts are required. These policies should aim to reduce disparities in income, enhance the accessibility and quality of education, and advance gender equality in all sectors. The ASEAN community must prioritise the rights and well-being of its people, especially those who are disadvantaged or marginalised. In the years to come, continued collaboration, innovation, and inclusivity will be essential in building a more equitable ASEAN.
“Anticipating the future is an art mastered by those who understand the intricacies of the present”. The words of Nobel laureate and economist Paul Samuelson resonate as they set the stage for this chapter, which explores future scenarios for ASEAN in 2035 and beyond.
The foresight process, driven by data and meticulous consideration of its aims and objectives, identified two pivotal dimensions, shown in Figure 3.1.1. The vertical dimension captures the robustness and well-functioning of the ASEAN STIE ecosystem. As one moves upwards, the ecosystem becomes stronger and with fewer gaps or shortcomings in its functioning. The downward movement depicts an ecosystem with deficiencies and shortfalls. Meanwhile, the horizontal dimension shows the collaboration levels needed for regional prosperity. To the right, a harmonious convergence propels shared prosperity and equitable wealth distribution—a vision of a Collective-Inclusive society. Conversely, a shift to the left unveils a stratified landscape marked by competition and strife—an Individualistic-Exclusive focus with concentrated wealth and power. The vertical dimension is chosen on a systems logic, which underscores the understanding that progress cannot be made by continuing to focus on isolated programmes executed ad hoc as is the pervading practice, but must be managed holistically as an ecosystem. Moreover, the ecosystem is likely to deliver the greatest impact if it is supported by the robust and systematic use of STI enablers. The horizontal dimension is chosen on the premise that AMS do not have the capacity and capability to address the grand challenges they face alone. ASEAN nation states need to join resources and effort to tackle these challenges and must come together as a cohesive and well-coordinated region to effectively mitigate the adverse impacts of emergent change and do so in a way that allows them to optimally leverage opportunities. These dimensions form the foundation for the four possible scenarios that depict ASEAN.
SCENARIO
Have and Have-not envisages a future with a moderately strong STIE ecosystem, yet marked by intense competition and robust social stratification.
TRAITS
• Intra-regional competition but overall losers in global competition of regional blocs
• Social inequities persist, with increasing wealth, health and education divide ACTION
• ASEAN must retain authority over STI in their respective economic sectors to prevent monopoly
Collective Prosperity envisions a highly robust STIE supported by a collective, collaborative, and cohesive approach towards regional challenges.
TRAITS
• Empower society with equal access to economic and societal opportunities
• ASEAN to embrace change and diversity, leaving no one behind ACTION
• Transition from “tech-taker” to “tech-maker”
and Sharing
TRAITS
• Planetary and
• Urgency of immediate action to avoid irreversible
Spiralling Out of Control presents a poorly functioning STIE and a severe lack of collaboration to address the critical challenges of the times.
• Complacency and passiveness exarcebate existing ecosystem gaps and challenges ACTION
• To stay competitive, ASEAN needs to synchronise its actions to avoid being overshadowed by stronger blocs
Misplaced Confidence portrays a moderately weak STIE ecosystem coupled with moderate competition and societal stratification.
The Misplaced Confidence scenario is characterised by a moderately weak STIE ecosystem coupled with moderate competition and societal stratification. Scenario Two, named Have and Have-Not, refers to a future with a moderate to strong STIE ecosystem, but one that is marked by intense competition and robust social stratification. Scenario Three, Spiralling Out of Control, reflects a future with a poorly functioning STIE and a severe lack of collaboration and cooperation to address the pressing challenges of the times. The final Scenario Four, or Collective Prosperity, is distinguished by a highly robust and well-functioning STIE supported by a collective, collaborative approach to regional issues.
The essence of each scenario is explored and explained in detail in the following discussion from the vantage point of the future; in other words, the scenario’s narrative will be voiced, looking back on what ‘happened’ over the years.
Evoking “Hubris in the Fog”, the narrative for the Misplaced Confidence scenario taps into the region’s current sense of self-satisfaction and contentment with how things presently are, despite a glaring lack of clarity about the events that are unfolding inside and outside of each member state’s borders, with some taking place right in the neighbour’s backyard. The core theme revolves around economics, whereby the current modus operandi in the region is maintained, resulting in the Misplaced Confidence scenario.
Within the Misplaced Confidence scenario, AMS were strategically invested in pivotal infrastructure projects to stimulate and sustain economic growth, prioritising energy, transportation, urban renewal, and agricultural modernisation aimed at bolstering regional competitiveness. However, this period saw the region grappling with significant challenges that strained and stretched public resources. The global struggle to control climate change led to a surge in disasters, including intense rainfall and prolonged droughts due to shifting weather patterns. Simultaneously, the aftermath of the Russia-Ukraine war introduced persistent tensions, disrupting supply chains and influencing commodity prices. Despite substantial progress in various sectors of the regional economy, economic vulnerability pervades the entire region in this complex setting.
Over time, many AMS accumulated substantial debt for infrastructure projects and unforeseen disasters, straining government finances and hindering investment in public services such as education and healthcare. Fiscal reforms aimed at improving revenue collection had limited impact due to sizable informal sectors. Seeking external financial assistance became a necessity, with a few AMS on the brink of sovereign debt default and resorting to debt restructuring efforts to manage the situation.
Inflation, fueled by global commodity price increases, supply chain disruptions, and regional currency devaluations, increased costs for essential goods and services. This, coupled with scarcity and hyperinflationary pressures, led to a decline in purchasing power for the ASEAN population. Central banks in ASEAN states raised interest rates to curb inflation, causing increased borrowing costs and reducing investment and consumption, particularly affecting nations reliant on traditional commodity sectors like agriculture and mining.
Weakly diversified ASEAN economies experienced stagnant or declining GDP growth. The combination of high debt, inflation, rising interest rates, and sluggish economic growth undermined confidence in regional financial markets and government policies. This loss of confidence prompted investors to withdraw funds, exacerbating the region’s economic challenges.
Of all the key impacts of the economic slowdown, four stand out in the Misplaced Confidence scenario. The first is widespread regional unemployment caused by the significant contraction of economic activity, leading to rampant unemployment and a surge in extreme poverty. This is followed by the brain drain, where skilled professionals, seeking better opportunities abroad for themselves and their families due to challenging circumstances, contributed to the loss of human capital, adversely affecting the long-term competitiveness of domestic industries.
Another key impact is the expansion of the vulnerable population, with rural communities, urban poor, women, and children facing difficulties in accessing education, health services, and employment opportunities. Stratification and social unrest mark the final most notable impact of the slowdown, where the severe economic conditions fostered dissatisfaction among large segments of the population, sparking protests and demonstrations in the most affected areas and destabilising the region’s political landscape. The result: a region divided, unable or simply uninclined to collaborate with other member states.
In the Misplaced Confidence scenario, economic instability triggered and exacerbated divisions within ASEAN, with profound and lasting consequences for its population shown in Table 3.2.1 below:
Restricted access to job markets and reduced educational opportunities trap vulnerable communities in a cycle of underachievement and unemployment. Digital serfdom ensnares individuals economically reliant on platform overlords, perpetuating an increasingly steep economic hierarchy.
Intensified resource exploitation, accelerated depletion, and reluctance to invest in renewable energy contributed to environmental instability, impacting public health and overall planetary well-being.
The Misplaced Confidence scenario is extremely plausible, in which economic pursuits have compromised planetary health, redirecting attention and resources away from conservation efforts. The unintended consequences of digitalisation and reliance on traditional fossil fuels hinder progress in mitigating climate change, causing a cascading impact on the region’s wellbeing and environment.
Evoking the notion of powerful actors vying for control over the regional economy, this scenario symbolises fierce competition and contestation for dominance, characterised by the imagery of a Puppet Master. The overarching narrative centres on STIE and technology, with geopolitics and economic rivalry in the battle to control the STIE ecosystem.
The Winner Takes It All
In this divided world of economic blocs, heightened geopolitical tensions have ushered in a new Cold War era marked by aggressive expansionary policies and military posturing. Within ASEAN, countries are entangled in intense economic rivalries, leading to protectionist measures and economic hostility as they vie for control over crucial industries and markets. The scenario envisions a landscape where nations pursue expansionist policies as the primary avenue for economic growth. The key to profit lies in securing power and control over the STIE ecosystems within nation-states, thereby amassing wealth and consolidating power.
In the Have and Have-Not scenario, the world is sharply divided between the affluent and the less privileged, bearing witness to increasing wealth disparities. Despite rhetoric advocating for societal equality, economic policies favouring the wealthy persist. Over time, a potent elite emerged, controlling a substantial portion of wealth while people in ASEAN struggled. The fusion of wealth, power, and control among influential individuals results in a highly stratified and controlled society, forming a techno-economic oligarchy most prominently embodied by powerful corporations. These entities, referred to as Ecosystem Playmakers (EPs), exert influence across major industries, including technology, energy, finance, healthcare, and media.
EPs, comprising individuals from diverse backgrounds such as CEOs, politicians, military leaders, and media owners, shape and define the rules of the ecosystem in favour of their best interests. The dominance of EPs traces back to events like the global financial crisis, where government interventions reinforced their influence.
In this scenario EPs gained control of governments through political contributions, lobbying, and placing their executives in key positions. Elected officials prioritised EP interests over the general population due to dependency on sponsors. EPs influence extended to regulatory agencies, leading to lax enforcement of environmental, labour, and consumer protection regulations. Corruption pervades government organs, eroding trust in public
institutions, and governments had become mere administrative bodies as EPs wielded real power, shaping policies and decisions that bolstered their control over not just the STIE ecosystem and its resources, but natural, human, and financial resources as well.
In this scenario, they fiercely compete for control over STIE ecosystems that operate across sectors, nation-states and the region, influencing governance systems and enabling unchecked resource exploitation. Advanced technologies intensify resource wars, causing destabilisation in the region.
Key flashpoints of competition and conflict arose in specific natural resource areas, such as energy, marine, water resources, and rare earth elements. The competition for oil and natural gas reserves intensified over the years, notably in the South China Sea. Overfishing and competition in shared waters led to conflicts, especially among AMS reliant on coastal areas for food security. Transboundary river systems, like the Mekong River, sparked conflicts over water access. Furthermore, the growing demand for rare earth elements triggered conflicts over mining and export, aggravating tensions within ASEAN and with global players. Border disputes soon followed suit, with ongoing conflicts over resourcerich areas escalating into larger regional disputes.
As resource basins depleted, intense battles for control ensued, leading to critical scarcity. EPs tightened their grip on ecosystems and associated supply chains, neglecting various societal aspects. Food and water shortages drove migration, turning resource-rich regions into conflict flashpoints, and exacerbating regional and global conflicts over vital resources.
In response, ASEAN nations invested heavily in advanced technologies and military capabilities to secure resource access, resulting in an arms race that disregarded ethical and environmental considerations. Frequent conflicts cause economic collapse in resourcerich AMS that lack STIE ecosystem control, leading to large losses of employment and financial instability. Resource richness has become a liability, hindering economic growth and development.
Resource dominance is achieved subtly in the Have and Have-Not scenario, with EPs strategically employing persuasive communication to depict themselves as transformative partners for the betterment of AMS. Their narratives emphasise economic development, technology transfer, infrastructure investment, job creation, and global market access. EPs, therefore, position themselves as crucial contributors to the prosperity of developing ASEAN nations, downplaying potential drawbacks, and highlighting positive impacts.
The effectiveness of the EP narrative lies in their control and influence over media, allowing them to shape narratives and manipulate perceptions. Collaborating with governments, EPs utilise emerging technologies to create powerful surveillance systems, developing algorithms and AI to filter and manipulate information, control narratives, and suppress dissent. Independent news sources are scarce, and opposition voices are systematically silenced, fostering an environment of fear and silence.
Resource dominance seldom relies on military power; EPs typically employ subtle strategies to secure and expand their influence over ecosystems. Through strategic and persuasive communication, EPs portray themselves as transformative partners for AMS’s betterment, utilising various tactics to sway decision-makers and maintain control. Key narratives include:
1 Economic Development:
EPs emphasise significant economic growth through Foreign Direct Investment (FDI), industry strengthening, job creation, and overall enhancement of the host national economy.
2 Technology Transfer and Expertise:
EPs highlight their role as crucial partners capable of transferring cutting-edge knowledge and technologies to modernise industry sectors to develop the host AMS.
3 Infrastructure Investment:
EPs stress their commitment to building essential infrastructure and supporting the host country’s industry and economy through projects like ports, roads, and manufacturing plants.
4 Employment Opportunities :
EPs emphasise their role in invigorating industry sectors, creating jobs, and upskilling employees,positioning themselves as vital partners in reducing unemployment rates and improving living standards.
5 Global
EPs position themselves as gateways to global markets, stressing their established presence in the global supply chain and their ability to provide access to international markets for goods, services, and resource commodities.
Essentially, EPs present themselves as partners bringing numerous benefits, linking their success to the prosperity of AMS. The narrative underscores transformative opportunities, emphasising economic growth, technological advancement, and global integration while downplaying potential drawbacks.
In the Have and Have-Not scenario, EPs wield power over AMS STIE ecosystems, offering advanced technologies and expertise. However, negotiation asymmetry often results in arrangements favouring EPs, with confidential agreements concealing terms that heavily benefit them. Weak regulatory frameworks in host AMS enable discreet economic extraction, especially in resourcerich regions. The economic gains from such activities, particularly in high-demand natural resources, are repatriated without sufficient reinvestment, contributing to economic hollowing out.
EPs gain access to resources in exchange for technology and knowledge transfer, but they strategically limit the sharing of advanced technologies. At the same time, they attract top talent from host AMS, creating a brain drain and perpetuating dependency on external expertise. Moreover, by exploiting legal loopholes and tax havens, EPs minimised their tax contributions, leaving local economies underfunded and susceptible to further exploitation.
EPs hollow out AMS economies through various means by discreetly draining natural resources, talent, and finances. This form of covert economic hollowing out raises concerns about transparency, accountability, and the need for vigilance to address these hidden dynamics.
The Spiralling Out Of Control scenario presents a disturbing thought; that the planet is in a state of irreversible decline, resembling a free fall, evoking the terrifying image of the Earth spinning out of control. The central theme of this narrative revolves around the plummeting of planetary health and the repercussions of surpassing critical thresholds to the point of no return.
Spiralling out of Control: The End of the Earthly Realm
It is almost too easy to take for granted that the world we live in today will be here tomorrow. The end of the earthly realm as we know it is described in sobering detail in numerous scriptures, ancient texts, and holy books. What is strikingly similar is the way the end is described – as a transformative event that completely decimates the Earth’s mountains, seas, and lands. ASEAN, with its multicultural and multi-faith population, may be spiritually attuned to the concept of what will ultimately be the ‘end’; however, there is little change in its exploitative treatment and behaviour towards the planet, with day-to-day lives continuing as if this planet and its abundance will last forever. This scenario is preventable, provided the world undergoes a great paradigm shift away from treating nature as a resource for exploitation. This scenario demonstrates what happens when ASEAN fails to prevent it.
Planetary Apocalypse – ASEAN’s Downward Spiral Towards Spiralling out of Control
Due to crippling weaknesses in the ASEAN countries’ governance systems, environmental exploitation reached a critical point, leading to frequent natural disasters, extreme climate conditions, and societal breakdown. Coastal cities are submerged, regions are uninhabitable, and basic necessities such as clean water are luxuries reserved for the wealthy. Governments, overwhelmed by crisis upon crisis, struggle to maintain social order, resorting to heavy-handed measures and limiting civil liberties. International aid is limited as each nation grapples with its own challenges. This scenario is the result of a convergence of challenges, with three key triggers acting as falling dominoes that ‘trigger’ the next one, propelling the unfolding polycrisis.
intense strain, the pandemic caused a global health crisis, with hospitals reaching capacity and essential medical supplies becoming scarce. Supply chain disruptions followed, leading to shortages, unrest, and conflicts. The economic fallout affected businesses, causing closures, job losses, financial instability, and widespread poverty. Governments struggled to contain the crisis, facing questions about leadership, while social unrest prompted authorities to tighten control through strict censorship, compromising and undermining freedom of speech. The contagion effect that was set in motion could be neither stopped nor reversed from its dystopian destination.
Initially aimed at enhancing crop yield and disease resistance to meet the growing population’s demands, biotechnology’s use to solve food security issues inadvertently sparked a global bioengineered pandemic with severe consequences. The purposeful modification of pathogens resulted in uncontrollable, highly contagious diseases affecting animals, humans, and ecosystems. With healthcare systems overwhelmed and under
The rise and adoption of advanced technologies, particularly higher-order AI such as quantum computers, made digital security and privacy especially vulnerable. Quantum computers enabled sophisticated hacking and decryption, rendering traditional security methods obsolete. This vulnerability opened the door to rampant theft of personal data, financial records, and government secrets. In turn, governments and corporations used these technologies for widespread pervasive surveillance, compromising global communications and breaching privacy at every level. Corporate espionage quickly becomes rife, stifling innovation due to stolen intellectual property. Quantum-enabled financial fraud pushes markets to the brink of collapse, triggering a breakdown of trust in digital systems. This technology paralysis resulted in severe economic turmoil and financial collapse as everyday transactions and functions became impossible.
Advanced technologies, specifically deepfake, facilitated information manipulation, undermined political processes, and election integrity. The proliferation of fakes and conspiracy theories eroded trust in democratic institutions, weakening governance down to its core. The failure of governance measures prompted a surge in cyber warfare and economic espionage, with ASEAN nations and corporations engaging in systematic hacking for economic advantages. Increased cyberattacks on critical infrastructure heighten tensions, impacting regional stability. In response, ASEAN nations diverted budgets to security at the expense of social welfare and public services, thus worsening the region’s suffering and exacerbating the freefall to Spiralling out of Control.
The irreversible domino effect of these three triggers (combined with other lesser but crucial triggers) ultimately paralysed the people, industry, and governments, causing multiple crises to unfold and ripple through the region, leading to the collapse of key ecosystems.
The collapse of natural ecosystems, due to excessive stress on the planet’s balance, had ripple effects on social and economic systems, jeopardising human life. Table 3.4.1 explains the components of the ecosystems’ collapse.
ECOSYSTEM COLLAPSE 1: Marine systems in spin
• Marine ecosystems (oceans, seas, and coastal areas) are vital components of Earth’s intricate web of life.
• Human activities driven by a desire for wealth and economic development have pushed these ecosystems towards critical thresholds.
• Industrialisation, pollution of rivers and oceans, and overfishing have brought marine ecosystems to the brink of collapse.
ECOSYSTEM COLLAPSE 2: Terrestrial systems in devastation
• The onslaught of industrialisation, deforestation, urbanisation, and unsustainable agriculture develops into a cascade of pressures on terrestrial ecosystems.
• High-density urban areas contribute to traffic gridlock and greenhouse gas emissions.
• Tropical rainforests face collapse due to unchecked human activity.
• Dire implications for weather patterns, water cycle, disease regulation, and global health.
ECOSYSTEM COLLAPSE 3: Changes in the atmospheric ecosystem
• High industrial activity, transport, and fossil fuel dependence strain the atmosphere.
• Air pollutants erode atmospheric ecosystems rapidly and greenhouse gases exceed critical thresholds.
• Impacts are felt regionally and globally with changes in air quality triggering extreme weather events.
• Deteriorating air quality worsens respiratory illnesses and cardiovascular conditions, especially among vulnerable groups.
Due to the interconnected nature of the ecosystems, the breakdown of one system cascades to affect the resilience and well-being of others. The repercussions of collapsing natural ecosystems thus extend beyond the environment, influencing human health, economic stability, and social dynamics due to their interdependence. Table 3.4.2 details the impact of natural ecosystem collapse on socioeconomic systems and the reciprocal reinforcement of stressors. ECOSYSTEM COLLAPSE 4: Upending of the human life-health ecosystems
• The collapse of natural ecosystems triggers a ripple effect impacting various aspects of human life.
• Atmospheric ecosystem collapse degrades air quality and increases respiratory diseases.
• Terrestrial stress, especially deforestation and soil degradation, affects agricultural productivity.
• Overfishing leading to fish population depletion, jeopardises food security and worsens health issues.
• Declining biodiversity and increased human intrusion facilitate the spread of infectious diseases, including zoonotic transmission.
• Disparities in healthcare access deepen fault lines, disproportionately affecting marginalised populations with higher illness and mortality rates.
• Reckless extraction of natural resources driven by short-term commercial goals leads to ecosystem destruction and undermines long-term sustainability.
• Natural ecosystem collapse disrupts supply chains, impacting industries reliant on raw materials from terrestrial and marine ecosystems.
• Economic instability ensues as businesses grapple with resource shortages and increased costs, resulting in scarcity of goods.
• Vulnerable communities face high prices during financial insecurity, exacerbating the impact.
• The collapse of one ecosystem can trigger a domino effect, intensifying economic challenges for less resilient AMS and potentially leading to financial collapse.
COLLAPSE 6: Social ecosystems
• Scarce natural resources trigger conflicts over land, water, and essential commodities, straining social ecosystems.
• Economic challenges fuel rural-urban migration, pressuring urban areas and social services.
• Social unrest prompts migration on a broader scale, creating high numbers of climate refugees.
• Migration burdens receiving communities, sparking social and cultural tensions.
• Weaknesses in unity, inclusivity, and sustainability surface, testing social resilience and well-being.
• Crossing planetary boundaries profoundly impacts social ecosystems, including human relationships, institutions, and cultural systems.
• These impacts manifest in various ways, affecting the behaviour and interactions of individuals and communities.
Epilogue: Planet 2.0 – The Elite’s Escape Strategy
By 2050, the efforts of Ecosystem Players from 30 years ago to create a heaven for the extremely wealthy have succeeded. The global elite successfully established extensive space colonies, enabling a swift retreat to alternative planetary habitats within the solar system in the event of Earth’s potential collapse. The cost, however, was humanity itself; with less than one per cent of the entire world’s population able to afford this elitist escape, the fate of the human race lay in the hands of individuals who ultimately value their lives above 9.7 billion others.
Through foresight and forethought, the Collective Prosperity scenario illuminates the potential achievements, harmonious coexistence, and shared prosperity that could define the ASEAN region in the mid-century. In this Collective Prosperity narrative, ASEAN is an interconnected ecosystem that thrives on sustainable practices, environmental stewardship, and equitable economic growth. Drawing on the collective strengths of member states, the region has become a beacon of collaboration with a robust economy, where technological advancements, innovation, and inclusive policies propel the region to unprecedented heights. Economic prosperity is shared equitably among member states, ensuring that the benefits of progress reach every corner of society. Industries thrive sustainably, adhering to eco-friendly practices that preserve the region’s natural wealth for future generations. Tolerance, understanding, and mutual respect form the pillars of societal harmony. Cultural diversity is celebrated, contributing to a rich tapestry of traditions and beliefs that enhance the collective identity of the ASEAN community.
In this scenario, ASEAN has become a global leader in environmental conservation. Member states collaborate to address climate change, protect biodiversity, and implement sustainable practices. Green technologies flourish, and the region stands as a model for the world in balancing economic growth with environmental responsibility. This scenario underscores the power of regional collaboration, envisioning a future where ASEAN nations work hand in hand to address common challenges. Joint initiatives in education, healthcare, and disaster response foster resilience and strengthen the bonds among member states. Shared resources and knowledge create a collective synergy that propels ASEAN towards a brighter future.
This is the Collective Prosperity scenario, driven by an ecosystem of positive change for an ideal ASEAN in 2035 and beyond.
Consumers are the key force driving the transition to more sustainable, planetary-friendly businesses in the Collective Prosperity scenario. The scenario envisions a world where people actively choose products and services that prioritise environmental and social responsibility, and consumers have a profound impact on shaping market dynamics and influencing businesses to adopt sustainable practices.
Markets play a significant role in the transition to planetary-friendly businesses and the broader sustainability movement. The changes in the marketplace signal a change in consumer behaviour and preferences towards planet-friendly products and services, which places pressure on businesses to move toward socially responsible practices. As more consumers prioritise sustainability, businesses adapt to meet these demands.
In this scenario, consumers are well-informed and prioritise sustainability, ethics, and transparency in their purchasing decisions, leading to a significant surge in demand for eco-friendly products and services. This change is fuelled by comprehensive sustainability education programmes integrated into school curricula and public awareness campaigns. Consumers actively seek brands with ethical and environmental standards, relying on reputable sustainability labels and certifications. Social media and online communities play a crucial role in information sharing, idea exchange, and holding companies accountable. Consumers wield power through boycotts and ‘buy-cotts’, prompting companies to reassess their behaviours and corporate responsibilities.
While consumers are the driving force of change, addressing short-term financial incentives, externalised costs, and unsustainable consumption patterns requires the involvement of governments, civil society, and international organisations. These entities play a crucial role in shaping market incentives and regulations to align with planetary-friendly goals. The B-G consumer-driven shift is driven by and reinforced by various forces of change, which can originate from market-led, government-led, or firm-led factors, each explained in Table 3.5.1 below.
Achieving the Collective Prosperity scenario hinged on robust collaboration among member states. For this to take place, all member states had to have a stake in a given issue so they could get an equitable share in the rewards and benefits for their role in tackling the issue. To enable this, the problems must be transboundary and tackle issues that resonate with all members. By then, ASEAN had fostered alliances around key issues through various platforms:
Crisis-driven Alliances:
Nations united during international crises, such as the response to COVID-19, forming temporary alliances to address urgent challenges.
Environmental and Climate Alliances:
Collaborative efforts focused on conservation, climate adaptation, and sustainable resource management, facilitated by entities like the ASEAN Centre for Biodiversity.
Infrastructure and Development Alliances:
• Investor Influence: Ethical investing is on the rise, prompting businesses to enhance sustainability to attract investor funds.
• Market Cues: Sustainability is viewed as a sign of effective business management, attracting talent, partners, and customers who share similar values.
• Competitive Pressure: Rising adoption of sustainability practices induces market competition, compelling others to follow suit to stay competitive.
• Global Cooperation: International trade promotes the exchange of sustainable practices and technologies, fostering global collaboration to address sustainability challenges collectively.
• Market Incentives: Governments employ financial incentives, like carbon pricing and clean energy subsidies, shaping markets to promote sustainable practices.
• Sustainability Certification and Trade: Recognised sustainability certifications guide consumers toward ethical products, prompting businesses to align with these standards.
• Innovation Boost: Government incentives drive innovation in green technologies, providing new avenues for sustainable businesses beyond consumer demand.
• Transparent Markets: Regulatory standards mandate environmental and social performance transparency, empowering stakeholders to make informed decisions and hold businesses accountable.
• Strategic Edge: Sustainability forms the foundation for gaining a competitive edge. Adopting sustainable practices attracts customers, cuts costs via resource efficiency, and mitigates regulatory and reputational risks.
• Reputational Boost: Companies dedicated to sustainability enhance brand equity, fostering customer loyalty and trust. Customers are inclined to support and advocate for brands with strong environmental and social responsibility.
• Resilient Growth: Sustainable businesses display greater resilience to environmental and social risks, ensuring long-term value creation and establishing green supply chains for the benefit of shareholders and stakeholders.
Member states collaborated on projects enhancing connectivity and fostering economic growth, utilising mechanisms like the ASEAN Infrastructure Fund (AIF).
Educational and Cultural Alliances:
ASEAN promoted collaborations in education and culture through student exchanges, academic research, and cultural programmes, facilitated by platforms such as the ASEAN University Network.
Health-based Alliances:
Nations aligned to address public health concerns, exemplified by initiatives like the ASEAN Plus Three framework for health cooperation.
Security-based Alliances:
Collaborative efforts tackled transnational threats through counter-terrorism and law enforcement cooperation. 6

In the Collective Prosperity scenario, AMS are united beyond borders, transcending differences to create a vibrant, innovative region that prioritises environmental preservation and shared well-being. Geopolitical tensions are set aside as member states collaboratively commit to regional prosperity, addressing planetary health challenges through tangible actions rather than symbolic gestures. Recognising the interconnectedness of their economies, AMS leverage their comparative strengths for collective regional advantage and global benefit. Success requires not only a focus on national economic growth but also active contributions to the development of less affluent member states, narrowing wealth gaps, and promoting equitable resource distribution for shared and inclusive prosperity.
This is the scenario in which ASEAN comes to be recognised worldwide as a global powerhouse, achieved through the successful establishment of three separate but equally fundamental powerhouses: ASEAN as an economic powerhouse, ASEAN as a sustainability powerhouse, and ASEAN as a social powerhouse.
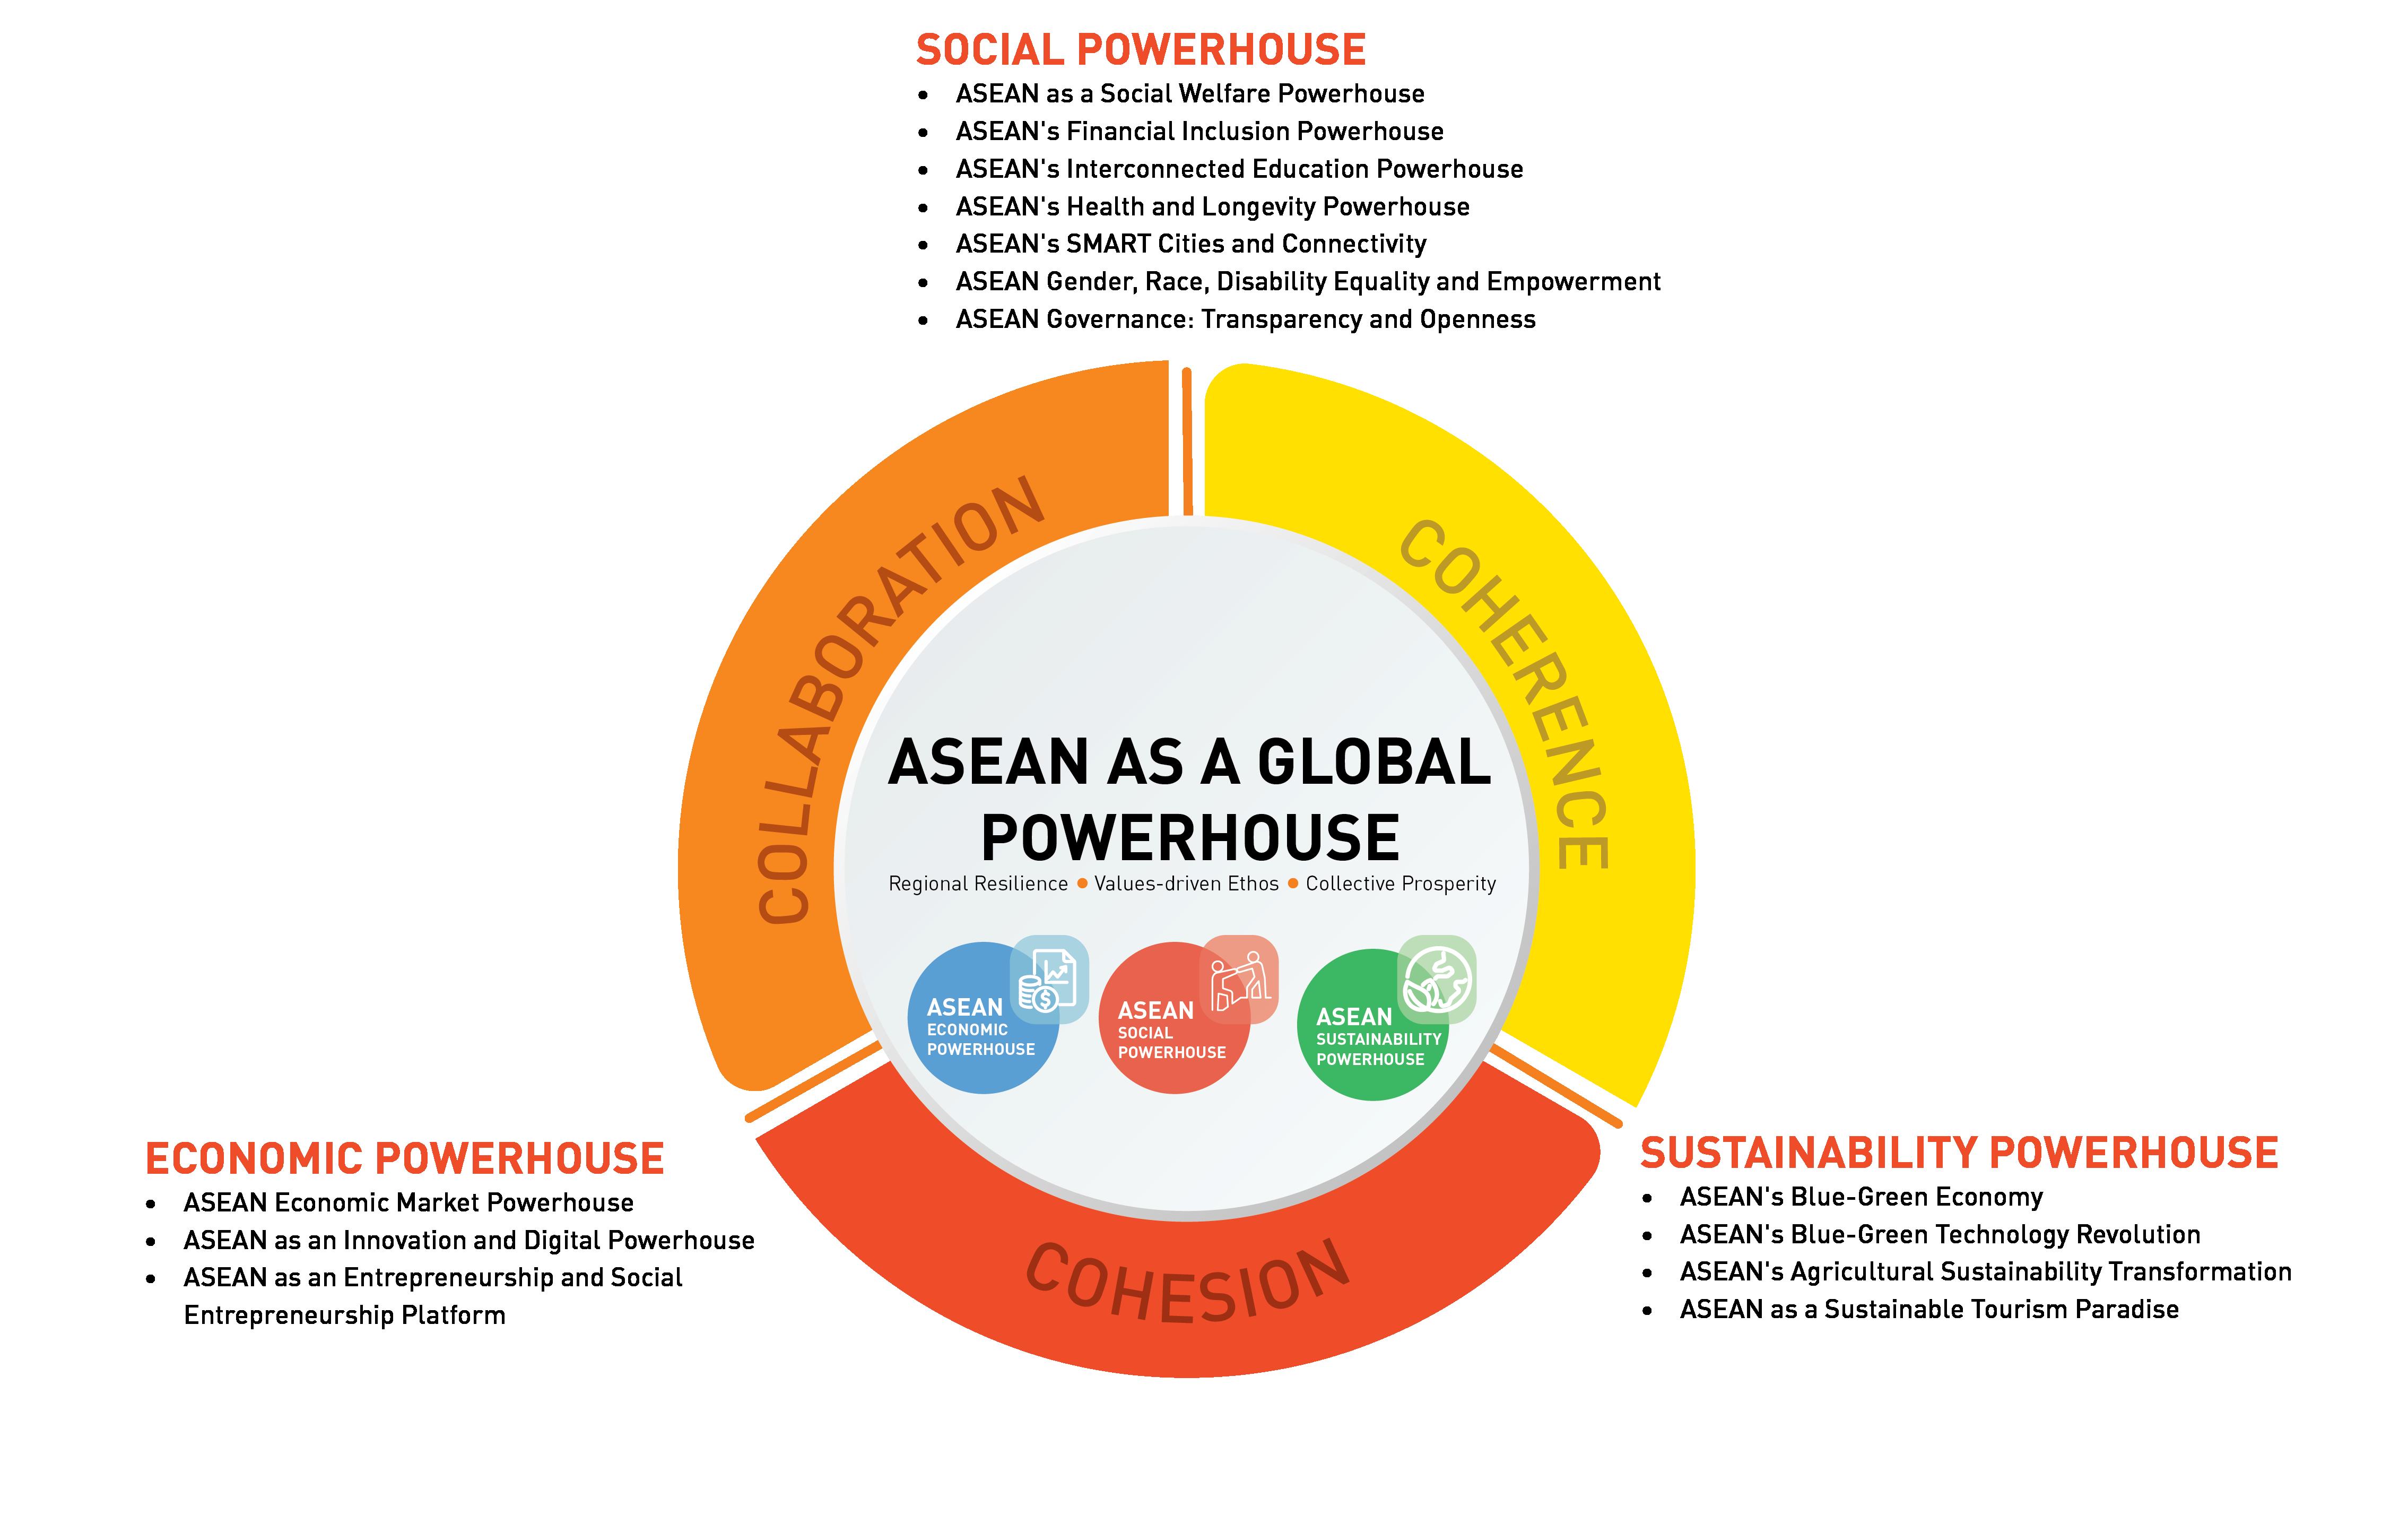
The ASEAN economic powerhouse is a shining example of how to build sustainable prosperity. Quite in contrast to conventional economics models based on a competitive premise that often involved dominion and exploitation of nature, the economic powerhouse is built upon a platform of long-run outlook over short-term wins, planetary protection rather than exploitation, inclusive opportunity and equitable distribution of wealth rather than individual wealth and power. This success is built by optimising the regional ecosystem whereby the components are carefully aligned and orchestrated to deliver sustainable regional prosperity.
The ASEAN economic powerhouse thrives on regional openness, collaboration, and fair trade. Overcoming protectionist tendencies, ASEAN member states recognised the interconnected benefits of systematically linked economies. Trade agreements ensure equitable economic gains, fostering an environment where regional collective prosperity prevails over individual national interests.
Key Pathway Steps Taken:
1 2
ASEAN emerged as a leading global economic powerhouse through a united and integrated economic community.
A unified ASEAN market made it the preferred destination for global investors, fostering economic growth and regional stability.
3
Comprehensive infrastructure development enhanced connectivity, while technological innovation boosted productivity and competitiveness.
4
Socioeconomic equality and environmentally sustainable practices were the guide to the region’s approach to prosperity and development.
In ASEAN’s technological renaissance, innovation propelled the ASEAN economic miracle, extending beyond digitalisation to crucial priority areas. The member states had collaboratively identified R&D priorities, pooling investments and expertise regionally. Digital innovation is utilised to develop innovation process efficiencies, and there is a strong emphasis on developing advances in areas such as AI, renewable energy, food security, health technologies, and sustainable infrastructure. Integrated digital solutions enhanced efficiency, allowing precise impact measurement and monitoring. Innovation and technology served as pivotal drivers for positive economic change, shaping a dynamic and adaptive landscape.
Key Pathway Steps Taken:
ASEAN evolved into a global innovation hub with thriving tech and knowledge-based industries.
1 5 2
Significant investments in education and research yielded a highly-skilled, creative workforce.
4
ASEAN became a global centre for digital innovation, nurturing a flourishing digital economy.
Investments in digital infrastructure, cybersecurity, and data privacy create an ideal environment for tech startups and multinational corporations.
Regional innovation ecosystems fostered startups, driving cutting-edge solutions in AI, biotechnology, and green energy.
6 3
Digital literacy and skills development programmes ensure that all citizens can participate in and benefit from the digital economy.
ASEAN has implemented diverse strategies to nurture small and medium-sized enterprises (SMEs), recognising them as catalysts for innovation and job creation. Social enterprises have emerged within this framework, by proving themselves to be dynamic in addressing societal challenges and promoting sustainability. Unlike profit-centric models, they prioritise value delivery across economic, social, and environmental dimensions. Enterprises, both large and small, drive transformative change by focusing on nature conservation, community development, and tackling regional social challenges.
Key Pathway Steps Taken:
ASEAN became an entrepreneurship and social entrepreneurship hub, emphasising social impact alongside financial success.
SMEs and startups cultivated robust dynamic capabilities.
1 3 5 2
Enterprises, in collaboration with social enterprises, actively addressed social and environmental issues, fostering job creation and inclusive growth.
4
Collaborative networks and supportive ecosystems facilitated the scalability of entrepreneurs and social entrepreneurs, reaching underserved communities.
ASEAN became a region where business and the best interests of the people are intertwined, fostering a more equitable and sustainable society.
AMS came together and united to advance the shift towards renewable energy, nature conservation, and vibrant circular economies. By integrating STI with economic sectors, they made significant progress in pioneering solutions for planetary and environmental challenges. Simultaneously, there was a notable shift in individual, corporate, and governmental behaviour, emphasising resource recycling, replenishment, and responsible consumption. The ASEAN region had given incentives to industries to embrace eco-friendly practices, ensuring that innovation is not divorced from ethical considerations, but is fuelled by a collective responsibility to safeguard the planet.
Market dynamics played a pivotal role in steering the region towards sustainability. Driven by informed consumers, businesses faced the consequences of being non-planet-friendly while being rewarded for prioritising ethical and eco-conscious practices. The ASEAN market emerged as a catalyst for positive change, aligning economic pursuits with the overarching goals of sustainable and inclusive development.
Under this paradigm, the Blue and Green economy assumed centre stage. The green economy encompasses sectors like renewable energy, energy-efficient technologies, and eco-friendly manufacturing processes, while the blue economy is geared towards conserving and sustainably utilising ocean resources such as fisheries, aquaculture, and marine tourism. Both economies adopted a long-term perspective, fostering a regional ecosystem that harmonised economic viability with planetary health, social justice, and equity.
Key Pathway Steps Taken:
1
ASEAN nations committed to a sustainable development model prioritising environmental protection and social equity.
ASEAN harnessed its abundant coastal and marine resources, becoming a global leader in the blue economy.
The region became a global leader in renewable energy production and conservation, achieving carbon neutrality.
5
Sustainable fishing, aquaculture, and coastal tourism practices resulted in thriving coastal communities and marine ecosystem conservation.
8
A harmonious relationship with the oceans fostered the scenarios of economic prosperity while preserving marine biodiversity and the well-being of coastal populations.
Consumers actively supported the green-blue shift, favouring environmentally conscious products and services.
3
6 9 2 4 7
Sustainable agriculture and responsible resource management ensured food security and biodiversity preservation.
Green shipping and sustainable maritime transportation contributed to economic growth and environmental stewardship.
Consumers kept track of companies and boycotted those with poor environmental track records.
ASEAN effectively deployed technological innovation to drive sustainable economic development and address environmental challenges. Investments in R&D resulted in cutting-edge solutions for planetary health. The region actively monitors and manages planetary health by utilising advanced technologies like remote sensing, AI, and data analytics.
Green technology investments in renewable energy, energy-efficient infrastructure, and circular economies paid off, increasing planetary sustainability. Simultaneously, Blue technology investments in marine conservation, reduction of ocean pollution, and sustainable fisheries management reversed ecological tipping points while fostering economic growth. Digital tools such as smart grids and monitoring systems enhanced the efficiency and effectiveness of blue and green technologies. ASEAN essentially built and harnessed robust STIE ecosystems as powerful tools for planetary stewardship.
Key Pathway Steps Taken:
1 2
ASEAN emerged as a leader in innovating and applying bluegreen technologies for planetary health protection.
4
Green technology exports surged and ASEAN nations collaborated to address climate change and environmental challenges.
The region adopted clean energy sources, environmentally friendly transportation, and sustainable urban planning, alongside novel carbon capture solutions to minimise its carbon footprint.
3
Blue technology innovations ensured pollution-free rivers and oceans, supporting vibrant aquatic ecosystems.
Sustainable agriculture practices such as agroforestry, permaculture and organic farming became the norm, through which the region managed to attain strong improvements in soil health, biodiversity, and water availability. The sector was transformed from low productivity and planet-harming to high productivity and ecologically friendly. Precision farming technologies, including sensor-based irrigation and data-driven crop management have become the cornerstone of the shift towards sustainable agricultural practices. There is now a strong emphasis on agroecological approaches that focus on and optimise the long-term health of agricultural ecosystems.
Key Pathway Steps Taken:
1 3 2
ASEAN implemented sustainable agricultural practices and technologies, ensuring food security and environmental preservation.
Investments in agricultural research and development led to increased productivity and improved crop resilience in the face of climate change.
Smallholder farmers and rural communities benefitted from access to modern farming techniques and fair-trade practices.
Sustainable tourism has become a key characteristic of tourist destinations within ASEAN in Collective Prosperity. Responsible eco-friendly tourism that preserves cultural traditions drives the development of new approaches. To facilitate this, protected areas (PA) are monitored and managed in a manner designed to ensure that tourism enhances rather than degrades local ecosystems. Tourism promotion is strongly focused on promoting responsible tourist behaviour, encouraging visitors to appreciate and respect the environments and cultures they encounter. For instance, environmentally friendly accommodation, low-impact transportation options, and community-based initiatives are prioritised. The success of the initiatives was such that they became a strong catalyst for environmental conservation and community development.
Key Pathway Steps Taken:
1 2
Sustainable tourism practices, eco-friendly accommodation, and responsible travel became the standard practice in ASEAN.
Natural scenic wonders, cultural heritage sites, and pristine environments are preserved for future generations.
3
Communities benefitted from tourism revenues, and visitors would engage in responsible travel, promoting environmental conservation and cultural exchange.
Unity, harmony, and social cohesion are the cornerstone values in Collective Prosperity. The region values diversity and embraces a culture of mutual learning. Guided by principles of equal opportunity, inclusivity, and well-being, AMS have effectively implemented policies prioritising social welfare, ensuring access to opportunities, and equitably distributing the benefits of economic growth.
In this Collective Prosperity scenario, education and healthcare are recognised as fundamental rights for all, irrespective of origin or background. Nurturing a skilled and healthy workforce was crucial for sustained economic development, but education went beyond imparting skills and was equally focused on preserving cultural diversity and heritage, fostering empathy, tolerance, and a sense of shared humanity.
Under this scenario, ASEAN society places significant importance on business responsibility and conduct. Businesses are encouraged to voluntarily embrace socially responsible practices, supported by regulatory mandates outlining responsible and ethical conduct codes. Governance standards mandate transparency and integrity as non-negotiable principles.
Social welfare and protection of the people, especially the vulnerable members and indigenous peoples of the ASEAN community became a high priority. Robust welfare programmes were devised to provide a safety net for all citizens, covering essential needs such as housing, food security, health and emergency and disaster support. These efforts have fostered a strong sense of belonging and identity, strengthening social cohesion among ASEAN populations.
Key Pathway Steps Taken:
1
AMS prioritised social welfare, achieving universal access to healthcare, education, and social services.
3 2
Robust social safety nets protect citizens from economic hardships, ensuring a high quality of life for all.
Stronger regional cooperation on humanitarian aid and disaster response led to swift and effective assistance during crises.
ASEAN countries had noted the importance of having a financial system that was both inclusive and accessible, regardless of location or socioeconomic status. Digital technologies helped develop innovative banking services specifically geared to reach all members of society. Additionally, innovative financial solutions, such as microfinance and community banking, allowed individuals to participate actively in the economy. This inclusivity is supplemented by financial literacy programmes to ensure that all members of society have the knowledge and tools to work towards financial security.
Key Pathway Steps Taken:
1 2 3
Financial inclusion initiatives across ASEAN ensured that every citizen has access to affordable and reliable financial services.
4
The region’s financial systems are stable and resilient, promoting economic growth and social harmony.
Digital banking, mobile payment systems, and innovative fintech solutions expanded financial access, particularly in remote and underserved areas.
Economic empowerment and entrepreneurship flourished, reducing poverty and inequality.
Education is fundamental to driving the success of ASEAN’s Collective Prosperity scenario. Quality education was provided to all irrespective of socioeconomic background. The curriculum was diverse and able to cater to the emerging needs of industry and society and brought into play a wide range of perspectives and experiences. Critical thinking, empathy, and cultural understanding have been developed as the key skills to have to future-proof ASEAN. To achieve this, educational infrastructure was strengthened, and resources and digital technologies were leveraged to provide learning opportunities to all and to futureproof ASEAN against future global challenges.
Key Pathway Steps Taken:
1 3 2
ASEAN implemented a comprehensive, interconnected education system that facilitates knowledge exchange and cultural understanding among member states.
Cross-border educational and research partnerships and student exchanges promoted a diverse and globally competitive workforce.
Investments in education technology and digital learning platforms ensured equal access to quality education for all ASEAN citizens.
Universal healthcare has allowed all citizens to have access to quality medical services. The widespread promotion of the importance of healthy lifestyles has led to positive changes in health behaviours. This has allowed preventive medicine to become the primary mode of healthcare, whilst simultaneously supported by advances in curative medicine.
Key Pathway Steps Taken:
1 2 3
A strong focus on healthcare, preventive medicine, and healthy lifestyles has led to longer life expectancies and overall well-being for ASEAN citizens.
Universal healthcare systems provide affordable and highquality medical care, reducing the financial burden on individuals and families.
R&D in medical sciences led to breakthroughs in disease prevention and treatment.
Smart cities have started to grow within the many urban localities of ASEAN. Emergent thinking on green design and the use of new technologies have allowed cities to be seamlessly connected, safe and sustainable at the same time. Urban areas that once were inhabitable have been transformed into highly livable communities. By incorporating green spaces and user-friendly design elements, smart cities foster a strong sense of community and social unity among residents. As a result, these innovative metropolises have become dynamic centres of cultural and personal growth, providing citizens with opportunities to reach their full potential in comfortable and protected settings.
Key Pathway Steps Taken:
1 2 3
ASEAN achieved unparalleled connectivity, uniting the region through extensive transportation networks, digital infrastructure, and smart cities.
4
ASEAN citizens enjoy ease of travel and cross-border access to education, healthcare, and job opportunities, creating a Collective Prosperity scenario of seamless connectivity and shared prosperity.
Cross-border trade, tourism, and cultural exchange flourished, bolstering regional economic growth.
Technological advancements in transportation, communication, and e-commerce reduced disparities in rural and urban development.
ASEAN has made a strong effort to put in place policies that ensure equal opportunities in education, health, employment, and public life. Diversity and inclusion initiatives have managed to dismantle a range of inequalities and promote fair representation of all demographic groups.
Key Pathway Steps Taken:
1
AMS prioritised gender, race and disability equality and empowerment, ensuring equal opportunities and rights for all citizens.
2
Policies and programmes promoting women, indigenous and disabled persons’ participation in the workforce, leadership roles, and decision-making processes were devised and implemented.
3
Gender, race and disability-based discrimination and violence were eradicated, fostering an ASEAN society where every individual can reach their full potential.
Governance in this Collective Prosperity is characterised by transparency, accountability, and citizen participation. The governance structures and processes are set up to be open and accessible to all citizens. In this way, they have helped to gradually eliminate deep-seated corruption, allowing for public resources to be allocated efficiently and in ways that benefit the entire region. Decision-making processes used emerging technologies to involve diverse voices in policy formation. Moreover, with the regional environment emphasising empowerment and active citizenship, the needs and concerns of the people featured high on the list of priorities. Civic engagement and behaviour have become the norm, and citizens play an active role in shaping the development and direction of their communities.
Key Pathway Steps Taken:
1 2
Advances in technology led to the establishment of Regulatory Technology (RegTech) environments, which have allowed greater transparency and participation.
4
Decision makers have more reliable information and feedback from citizens, which allows them to make informed decisions to improve societal well-being.
Communities feel a strong stake in society and have become proactive citizens.
3
Transparent processes allowed for rapid feedback and reduced inefficiency, as well as effectively reduce the risk of corruption.
Conclusion
These Collective Prosperity possibilities within ASEAN rely on strong regional cooperation, investment in human capital, environmental stewardship, and the pursuit of sustainable and inclusive growth. Achieving these goals has required a collective commitment to the welfare and prosperity of all ASEAN citizens, as well as active regional collaboration and leadership in this scenario.
However, the journey towards the Collective Prosperity scenario is not without its challenges. Understanding the complexities of the present reality is crucial in charting a course towards this ideal version of ASEAN. Hence, insight into ASEAN’s current state of play will help navigate the intricate terrain of possibilities that make up the four scenarios discussed in this chapter. The next chapter will explore ASEAN’s existing dynamics and examine the intricate layers of ASEAN’s present state that pave the way to the envisioned scenarios.
In the pursuit of ASEAN’s vision for Collective Prosperity, a collective and holistic strategy is essential to propel the entire ASEAN community towards shared success. The previous chapter detailed the four scenarios awaiting ASEAN over the next 28 years. However, to completely understand the gravity behind each scenario, a nuanced understanding of the current socio-economic landscapes of ASEAN member states is paramount. This chapter presents an ecosystem analysis of the AMS using eight interconnected enablers, collectively known as the 8i framework (see Figure 4.1.1).
These enablers encompass institutional stewardship,, reflecting the quality of governance and stewardship; interactions, emphasising collaboration among key stakeholders; integrity, addressing governance structures at various levels; infrastructure, comprising both natural and man-made elements; info-structure, encompassing the realm of the Internet of Things (IoT) and advanced technologies; intellectual capital, indicative of the state of talent resources; incentives, spanning fiscal and nonfiscal types; and internationalisation, focusing on the establishment of global networks and partnerships. A meticulous assessment of these 8i ecosystem enablers helps characterise the current state of play of the ecosystems that prevail in the AMS. This understanding defines the starting point from which the future emerges and culminates into any of the four scenarios of ASEAN.
Quality of institutions of governance (federal, state, and local council), including regulatory framework and standards bodies that ensures transparency and accountability, industry associations, community organisations, institutions of learning, and research institutes.
Level and quality of cooperation, collaboration, and knowledge sharing among all stakeholders in the ecosystem.
Governance systems that manage resources of the ecosystem efficiently and raise the return on value for all stakeholders in the country.
Participation in the formulation and adherence to international laws, treaties, and engagements that ensure sustainable management and security of the resources in the ecosystem. These include the depth and breadth of engagement with global knowledge networks, institutions of governance, and supply chains.
Fiscal and non-fiscal incentives to encourage the adoption of new technology, innovation, and systems to enhance the competitiveness of the ecosystem.
Skills and knowledge of talent available in the industry – both general, specialised knowledge, technical, entrepreneurial, and leadership skills.
Physical (roads, ports, logistic supply chain, smart building, and other public facilities) and natural infrastructure (environment –lakes, rivers, and natural habitat, etc.) that are technology and knowledge intensive.
Digital infrastructure, such as ICT connectivity, and the use of advanced digital technology and big data that enable seamless integration of multiple digital and data analytic systems in the ecosystem.
The process of establishing the current state of play of ASEAN ecosystems involved evaluating each AMS individually. This entailed a detailed scrutiny of the 8i elements for each member state by reviewing their actions, programmes, and policies to date. Following this, each AMS’s ecosystems were compared to discern any patterns and commonalities. Even though each country has unique features in their respective landscape, three distinct groups emerged, each with shared patterns of structure, behaviour, and activities that characterised their ecosystems. The three identified groups are Pace-Setter, Maturing, and Emerging, with each one depicting a different stage of ecosystem development (Figure 4.2.1).
The Pace-Setter group is unique in that it is constituted by only one country: Singapore. Singapore embodies a robust economy, formidable national integrity system, advanced infrastructure and infostructure ecosystem, and highly skilled workforce. It is further distinguished by substantial investments in R&D that propels it into the league of global leaders, characterised by innovation-driven, knowledge-based economic prowess.
The Maturing group comprises Malaysia, Brunei, Thailand, Indonesia, the Philippines, and Vietnam. The nation states in this group are advancing rapidly yet are faced with a variety of ecosystem challenges. Members of this group also seem to be besieged by a range of social and political challenges, such as inequality, political uncertainty, corruption, and inconsistent law enforcement. Despite this, the group possesses relative strengths in infrastructure and infostructure, including modern transportation networks and 4G/5G mobile networks, coupled with a relatively well-functioning R&D ecosystem.
The Emerging group is comprised of Cambodia, Laos, Myanmar, and Timor-Leste. The shared patterns of this group suggest its members are at the nascent stage of STIE ecosystem development. The group is marked by the low gross national income (GNI) per capita, weaknesses in its human capital, and high levels of vulnerability to forces of change within the region. These countries face challenges ranging from a fragile national integrity system and weak infra- and infostructure to a shortage of skilled workforce and limited engagement in global supply chains.
• Strong institutional governance system with efficient policy implementation
• World-class public research institutes and R&D-driven higher education institutions, with sophisticated linkages to industry players to promote technology and knowledge transfer
• Face varying degrees of challenges in quality public services and efficient policy implementation
• The key institutions are generally less involved in R&D and knowledge transfer activities
• More vulnerable institutional governance systems with lower government effectiveness
• Public research and higher education institutions struggle with their R&D performance
• Robust collaborative ecosystem that involves close interaction and cooperation among government agencies, research institutes, universities, and industry players
• Limited and fragmented collaborations between government bodies, industry players, research institutions, and universities
• Lack of well-established public-private partnerships to foster knowledge-sharing culture
• Strong national integrity system that advocates high accountability, transparency, regulatory quality, and the rule of law
• Regulatory environment conducive to business operations, as demonstrated by its high ranking on the Ease of Doing Business Index
• Face varying degrees of challenges in improving their national integrity systems
• The absence of a strong legal framework and impartial judicial bodies has led to low rankings of these countries on the Ease of Doing Business Index
• Power dynamics and human rights violation remains a concern, reflecting a degree of political uncertainty in these countries
• Developed transportation, power and water supply, healthcare infrastructure, and sustainable infrastructure
• Still face challenges in upgrading their transportation, energy, water, and social infrastructure, especially in remote areas
• Suffer from a severe lack of investment in basic infrastructure, resulting in poorly maintained roads, limited water supply, and sanitation
Figure 4.3.1 The 8i Ecosystem Analysis of the Whole-of-ASEAN Sunway IGSC, 2023
• Actively building regional and international cooperation
• High involvement in the global value chains
• Its robust R&D ecosystem enables it to participate actively in high value-added activities in the Global Value Chains (GVCs)
• Comparatively less integrated into the GVCs
• Often involved in the services and manufacturing sector, which produces intermediate goods and final products for export to other countries
• The least involved in the GVCs across the ASEAN region
• Specialise in low-skilled and labour-intensive industries and export low-value-added products
• Offer a comprehensive range of incentives to promote R&D, expedite green growth, attract FDIs, and foster social welfare
Pace-Setter Maturing
Emerging
• Similar to the pace-setter, maturing ASEAN countries also offer various incentives to promote R&D, transition to green economy, and attract FDIs
• Although a wide range of incentives is offered to attract FDI, the tax incentive systems lack transparency
• Lack of incentives to promote R&D activities and technology adoption
• Possesses a highly skilled and industry-ready workforce supported by strong education systems and workforce training programmes
• Have a moderate level of talent competitiveness.
• Struggle with low STEM enrolment rates and skills gaps
• Portray lower literacy rates and talent competitiveness levels due to poverty, limited investments, and lack of access to education facilities
• Low STEM and TVET enrolment rate
• Persistent skills mismatch in the labour market
• Leading hub for the digital economy with widespread internet access and extensive 5G network coverage
• Despite the active rollout of the 5G network, they still struggle with limited high-speed internet, poor connectivity, and lack of access to advanced digital infrastructure, especially in rural areas
• Limited and unevenly distributed digital infrastructure, which restricts their involvement in the digital economy
NB: The ecosystem analysis for each of the three identified groups: Pace-Setter, Maturing, and Emerging are in Appendix 12.
• The Pace-Setter, distinguished among ASEAN countries, boasts the region’s most robust institutional governance, marked by exemplary government effectiveness and political stability (World Bank, 2021). With world-class research and higher education institutions collaborating seamlessly with industries, the Pace-Setter leads in cutting-edge R&D projects (A*STAR, 2020; ATREC, 2023; Compound Semiconductor, 2021; Pharmaceutical Technology, 2022). Industry players’ involvement in innovative partnerships further fosters knowledge-sharing between different sectors and propels innovation, contributing to the nation’s technological leadership, and economic advancement (National Research Foundation, 2021).
• While maturing ASEAN countries have shown progress, challenges persist in their institutional governance (World Bank, 2021). Issues include bureaucratic skills gaps, overlapping government responsibilities, and suboptimal policy implementation (OECD/ ADB, 2019). Additionally, R&D engagement remains modest among public research institutes, higher education institutions, and industry players (ASEAN-Japan Centre, 2019a; Asian Development Bank, 2020; Ministry of Economic Affairs, 2018).
• Emerging ASEAN countries face more pronounced vulnerabilities in their institutional governance, characterised by lower government effectiveness scores (averaging below 40 out of 100), fragmented government agencies, and political uncertainty (World Bank, 2021). Weak institutional leadership and STI policies contribute to underperforming public research and higher education institutions (MISTI, 2023; United Nations ESCAP/ DRI, 2020).
• For sustainable economic development in ASEAN countries, effective collaboration among government bodies, industry players, academia, and research institutions is paramount. The Pace-Setter stands as a model with its well-established collaborative ecosystem, featuring seamless cooperation among government agencies, industry, research institutes, and universities (National Research Foundation, 2021). Beyond local partnerships, the Pace-Setter actively pursues global collaborations, attracting substantial FDI and positions itself as a regional hub for business and innovation (Economic Development Board Singapore, 2022a).
• Maturing and emerging ASEAN countries encounter substantial challenges in their collaborative ecosystems, marked by limited human capital investment, resource constraints, governance issues, and bureaucratic hurdles (International Monetary Fund, 2021; WIPO, 2022). While some collaboration exist in maturing countries, they tend to be fragmented, leading to duplicated efforts and inconsistent policy implementation (Economic Research Institute for ASEAN and East Asia [ERIA], 2018; OECD, 2022).
• Notably, emerging ASEAN countries lack well-established public-private partnerships, emphasising the need for robust collaboration and knowledge-sharing culture between the sectors (Asian Development Bank, 2016; Morrell, 2020). Strengthening collaboration can enhance FDI attraction and bolster economic competitiveness of these AMS.
• The Pace-Setter boasts a robust national integrity system marked by high accountability, transparency, and adherence to the rule of law (World Bank, 2021). Ranking high globally on the Corruption Perceptions Index reflects the Pace-Setter’s minimal corruption and high level of transparency in governance (Transparency International, 2022), making it favourable for FDI and to business operations (World Bank, 2019, 2021).
• Maturing ASEAN countries face challenges in their national integrity systems, evidenced by lower scores for control of corruption, regulatory quality, and the rule of law (World Bank, 2021). Inadequate policy implementation further impedes economic growth in these countries (Indonesia Investment, 2016; World Bank, 2021). The regulatory environments in both maturing and emerging ASEAN countries are perceived as unfavourable for business operations, reflected in their low Ease of Doing Business Index rankings (World Bank, 2019).
• Emerging ASEAN countries face even greater hurdles in fortifying their national integrity systems. Limited capacities to enforce laws, implement policies, and uphold transparency and accountability contribute to prevalent issues like corruption, abuse of power, and human rights violations, heightening political uncertainty (Transparency International, 2022; World Bank, 2021).
• The Pace-Setter leads as a benchmark in infrastructure development, prioritising the enhancement of state-of-the-art infrastructure to propel economic growth and competitiveness. Evident in its exceptional score in the Infrastructure Quality Index, the Pace-Setter boasts top-notch transportation systems, reliable power and water supply, and robust healthcare infrastructure (International Trade Administration, 2022; World Economic Forum, 2019).
• Maturing ASEAN countries grapple with substantial challenges in upgrading transportation, energy, water, and social infrastructure (World Economic Forum, 2019). While road connectivity plans are underway, several of these countries face deficiencies in social infrastructures. These include inadequate access in rural areas, insufficient hospital beds, limited medical supplies, and deficient medical waste infrastructure (Mahendradhata et al., 2021; Vietnam Plus, 2022). Education facilities in rural areas often lack classrooms and suffer from dilapidated conditions, outdated lab equipment, and restricted electricity access (Ombay, 2023). In addition, water and wastewater management struggles persist, impeding access to clean water and proper sanitation (Prevost et al. 2020).
• Emerging ASEAN countries exhibit minimal progress in infrastructure development due to limited investment, resulting in substantial gaps in basic infrastructure provision, including roads, water supply, and sanitation (World Economic Forum, 2019). Critical road infrastructure is poorly maintained and weather-vulnerable, hindering regional connectivity and transportation (Nordic Development Fund, n.d.; Poindexter, 2017; Spiess, 2017).
• The Pace-Setter, as a leading digital economy hub, has made substantial investments and achieved remarkable milestones in infostructure development. Notable successes include affordable mobile tariffs, widespread internet access, and extensive 4G network coverage (Lanvin & Monteiro, 2022). The Pace-Setter is actively developing its infostructure ecosystem through national programmes such as Research Innovation Enterprise plan, which promotes research and innovation in key areas like digitalisation and advanced technologies (National Research Foundation, 2021). Additionally, the Singaporean government has strategically initiated the Smart Nation initiative, anchored in three pillars: Digital Society (e.g., Healthhub for healthcare access), Digital Economy (e.g., 10 Gbps broadband), and Digital Government (e.g., secure commercial cloud) (Smart Nation and Digital Government Office, 2023).
• Maturing ASEAN countries has significantly improved in terms of infostructure in recent years, with scores ranging from 54 to 84 out of 100 on the ICT Infrastructure Index (Lanvin & Monteiro, 2022). Despite the active rollout of 5G networks and substantial investment in cloud infrastructure, challenges persist due to the high installation costs of relevant digital infrastructure in these countries (Oottamakorn et al., 2019; Romero, 2021). Furthermore, there are still disparities and obstacles in accessing advanced digital infrastructure, primarily in remote areas of these countries (Dao et al., 2022).
• Emerging ASEAN countries experience severely limited and unevenly distributed infostructure, marked by basic internet and digital infrastructure challenges, low bandwidth, and high ICT service costs (Lanvin & Monteiro, 2022). Scarce resource allocation further hampers the development of fibre optic and 5G infrastructure, impacting digital education transformation (Corner, 2022; USAID, 2022). Consequently, the poor quality and accessibility of infostructure impede the active participation of these countries in digital economies.
• The Pace-Setter actively cultivates intellectual capital through initiatives such as Research, Innovation, and Enterprise 2025 Plan (RIE), building a strong knowledge base for transformative innovations and enhancing the innovation capabilities of local enterprises in the country (National Research Foundation, 2021). Robust education systems and workforce programmes ensure a highly educated and industryready workforce, contributing to Singapore’s second position in the Global Talent Competitiveness Index (Lanvin & Monteiro, 2022). Moreover, collaboration between Singapore’s world-class universities and industry partners further enhances talent competitiveness in the country (Economic Development Board Singapore, 2022b).
• Maturing ASEAN countries exhibit moderate talent competitiveness with a welleducated workforce with some level of expertise, but they still face challenges in attracting and retaining highly skilled workers (Lanvin & Monteiro, 2022). Despite efforts to boost tertiary education enrolment (World Bank, 2023), significant skills gap and youth unemployment issue persist due to inadequate TVET systems (Ibrahim, 2023; Moonpa et al., 2019; Wibowo et al., 2022) and low STEM enrolment rates (Manila Times, 2022; New Straits Times, 2021; OECD, 2018).
• Emerging ASEAN countries experience lower literacy rates and talent competitiveness hindered by obstacles like poverty and limited investments (Lanvin & Monteiro, 2022). Low tertiary education enrolment (World Bank, 2023) and STEM participation (Kao & Shimizu, 2020), coupled with insufficient support for TVET programmes, result in persistent skills mismatches and a shortage of high-skilled workers (ASEAN Secretariat, 2022; Kao & Shimizu, 2020). To address this, increased investments in intellectual capital development, particularly in STEM and TVET programmes, are crucial for global competitiveness.
• The Pace-Setter employs a comprehensive range of fiscal and non-fiscal incentives to drive innovation, economic growth, and social welfare. Notable measures include a 250% tax deduction for qualifying capital expenditure to boost R&D and technological innovation (Inland Revenue Authority of Singapore, 2022). Industry-focused initiatives like the Development and Expansion Incentive, Pioneer Certificate Incentive, and Global Trader Program offer corporate tax exemptions of 5% or 10%, encouraging foreign investors to establish a presence, engage in knowledge transfer, and enhance PaceSetter’s role as an international trading hub (ACCA, 2022; Economic Development Board Singapore, 2019). In addition, personal incentives like the Caregivers Training Grant and Home Caregiving Grant are available to support caregivers and residents with persistent disabilities (Ministry of Health Singapore, 2023).
• Maturing ASEAN countries are actively implementing various incentive programmes to develop their STIE ecosystems. Initiatives such as tax exemptions for electric vehicles and research funds to boost R&D activities are being implemented (Business Today, 2023; MOSTI, 2022). Besides that, lower corporate income tax, tax holidays, and customs duties exemption are also available to attract foreign investors and foster economic growth (Malaysian Investment Development Authority, 2019; Teo & Tai, 2021).
• Emerging ASEAN countries’ tax incentive systems have often been criticised for the lack of transparency and convoluted procedures, despite offering incentives like tax holidays and reduced taxes. (OECD, 2017; Oo et al., 2015). While some improvements are seen, particularly in green investments (Innovation for Sustainable Development Network, 2019), the absence of incentives for R&D and technology adoption hampers innovation and competencies on the global stage (International Monetary Fund, 2018).
• Positioned as a strategic business hub for multinational corporations, the Pace-Setter attributes this status to its robust institutional governance, advanced infrastructure, a skilled workforce, and a favourable business environment (Economic Development Board Singapore, 2023). Due to constraints on land and resources, the Pace-Setter focuses predominantly on the forward linkages of global value chains (GVCs). The nation’s robust R&D ecosystem further positions it in high-value-added economic activities within global value chains, including the production and export of sophisticated manufacturing components and high-tech products (ASEAN-Japan Centre, 2018).
• Maturing ASEAN countries exhibit varying levels of integration into GVCs. These countries display diverse specialisations within GVCs, with some emphasising backward linkages, and others, forward linkages. Involvement spans the services (e.g., IT and business process outsourcing) and manufacturing sectors, producing intermediate and final products (e.g., automobiles, electronic products, agricultural products, garments, textiles, etc.) for export (ASEAN-Japan Centre, 2019a). Most of the maturing ASEAN countries have experienced increased FDI and GDP growth due to their participation in GVCs (ASEAN-Japan Centre, 2019). However, some countries still face challenges in their internationalisaion strategies due to the lack of skilled workers, weak infrastructures, and limited economic diversification (ERIA, 2018; ASEAN-Japan Centre, 2017, 2019b, 2020).
• Emerging ASEAN countries exhibit the least involvement in GVCs within the region, primarily due to a lack of economic diversification, limited FDI, shortage of skilled labour, weak institutions, and fragmented domestic supply chains (ASEAN-Japan Centre, 2019a, 2021; IMF, n.d.). Predominantly specialising in low-skilled, labourintensive industries, they export low-value-added products (e.g., agricultural products, coffee, garments, textiles, etc.), yielding diminished returns on value for the countries (ASEAN-Japan Centre, 2019a, 2019c, 2021).
The detailed STIE ecosystem analysis of ASEAN highlights that even though individual countries have unique contexts, they share commonalities in the pattern of development. The three groups (Pace-Setter, Maturing, and Emerging) capture the heterogeneity of resources, skills, and structures that come together to define the STIE stage of ecosystem development. The 8i ecosystem analysis highlights that each group’s starting points in the journey to the future are different. Based on this, how each group experiences and travels the emerging pathways of the four scenarios will be different. Even within each group, the pathways each country takes will be defined by the specificities of their context. Given that each and every AMS will not travel exactly the same pathway to the future, it opens up the questions as to how ASEAN will arrive at the critical juncture collectively.
Will ASEAN be able to reconcile the different stages of STIE ecosystem development of the three groups by coming together to optimise economic development and prosperity for the region, or will the future development trajectories be based on the existing pathway of the Misplaced Confidence scenario, in which there is surface level collaboration but lacking depth and long-term cooperation? How ASEAN resolves the differences within itself as an entity and how well it comes together around a common vision backed by requisite investment and activities will define the nature of the scenario and the direction of the trajectory that will be realised. The level of cooperation, cohesion, and coherence will be fundamental in shaping the strength and impact of the STIE ecosystems on individual AMS and ASEAN as a whole.
The comprehensive analysis of ASEAN’s current ecosystem’s state of play provides us with valuable insights into the intricacies that shape its dynamics. This understanding forms the foundation for exploring the diverse trajectories that the ASEAN STIE ecosystem may take in the next decades, paving the way for a nuanced exploration of the dynamic evolution of future scenarios. Understanding of the present and the driving forces allows us to envision and strategise for an optimal and adaptive evolution of ASEAN’s STIE ecosystem. As we transition to Chapter 5, our focus will shift towards elucidating the paradigm shifts imperative for fostering a more prosperous ASEAN region. The chapters that follow articulate the transformative measures necessary to propel the STIE ecosystem towards innovation, sustainability, and shared prosperity, underscoring the pivotal role of strategic shifts in steering ASEAN towards a dynamic and thriving future.
The previous chapter presented the state of play of the ASEAN STIE ecosystem, highlighting a range of strengths and weaknesses in the AMS ecosystems. Understanding the current state of play of the ASEAN STIE ecosystems is important as it highlights the implications of how potential futures may evolve. Within the four-scenario setting, the current state of play is depicted as a circle at the intersection of the axes (see Figure 5.1.1).
Growth & Prosperity (+ve)
Decline & Despression (-ve)
Current State of Play
Collaboration and Sharing
Over time, the current state of play will evolve into different scenario trajectories. Figure 5.1.2 shows a simplified version of this evolution. The size of the circle grows as increasing investment and effort are put into the scenario. To paraphrase, the higher the investment over time, the higher the sunk costs. This means that actions, activities, and investments become increasingly embedded within a particular scenario over time. As the circle grows, it becomes progressively difficult to reverse and change course due to vested interests and the increasing momentum of activities.
The key takeaway here is that all of the scenarios are not static but evolve over time, and the trajectories taken unfold through complex interactions of multiple factors. From the foresight exercise, five dynamics were identified, and these key scenario dynamics over time will be explored in this chapter.

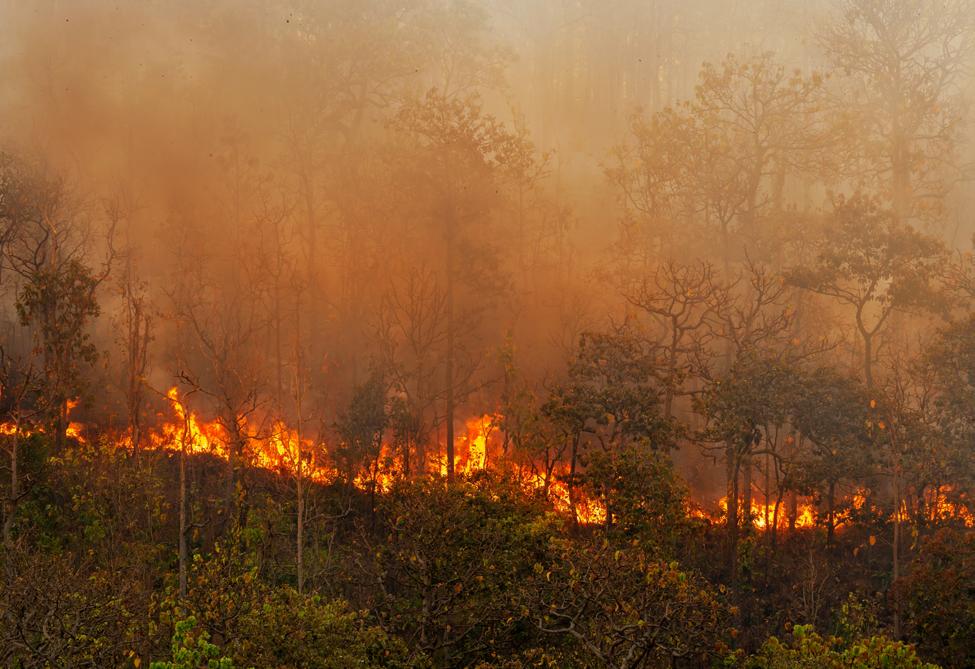

Growth & Prosperity (+ve)
SPIRALLING OUT OF CONTROL
Decline & Despression (-ve) Robustness (well-functioning) of
5.1.3 The Misplaced Confidence to Spiralling Out of Control Dynamic
Collaboration and Sharing
MISPLACED CONFIDENCE
Coherence, Cooperation and Cohesion (+ve) (Collective-Inclusive Prosperity)
The first dynamic is where the current or present set of actions and activities are continued over time, leading to the Misplaced Confidence scenario. Here, the level of collaboration and cooperation is maintained more or less at the current level, but because of the lack of funding as a consequence of needing to address a range of socio-economic challenges within the region, a gradual weakening in the STIE ecosystem starts to transpire. As the economic challenges within this scenario worsen, it becomes increasingly difficult for AMS to keep pace with the changes taking place in the global economy. The primary reflex of the AMS under this scenario is to attend to short-term, immediate needs, and exploit natural resources even faster. Over time, the exploitation of nature for profit causes planetary health erosion, and driving a transition towards the Spiralling Out of Control scenario.
Growth & Prosperity (+ve)
The second dynamic is one in which the Have and HaveNot trajectory is the primary shift from the current state of play. Under this dynamic, the AMS enlist the help of other parties who have the skills and competencies to develop and strengthen their ecosystems. These parties are most likely powerful and influential agents (Ecosystem Playmakers or EPs) possessing the scientific and technical prowess, knowledge, and power to influence markets. This allows the AMS to reap short-term benefits in partnership with these agents. However, gradually and almost unnoticeably, the EPs dominate the domestic market at the expense of the host AMS, since the balance of returns is stacked in favour of the EPs. The EPs crowd out host AMS players and exploit resources for their self-interests without considering the impact on planetary health. This uncontrolled exploitation, facilitated by technology, leads to the accelerated encroachment and crossing of critical thresholds and contributes to the unfolding of the Spiralling Out of Control scenario, as illustrated in Figure 5.1.4.
Conflict and Division (-ve) (Individualistic-Exclusive Prosperity)
SPIRALLING OUT OF CONTROL
Decline & Despression (-ve)
Collaboration and Sharing
3
This dynamic is essentially a combination of dynamics 1 and 2. In the third dynamic, the primary momentum leads to the development of the Misplaced Confidence scenario. As the AMS encounter the challenges within the scenario, they look outward to others who have the means and expertise to help overcome and mitigate the problems. As noted earlier, these “others” are EPs who can help strengthen and mobilise the STIE ecosystem to tackle the problems that AMS face. However, as EPs come into play, they initiate strong self-focused actions and narratives which ultimately erode the power and control of AMS to determine their self-destiny. Over time, the AMS resources are depleted, and when these resources are completely exhausted, the EPs simply move on to other resource-rich locations, leaving the host AMS barren and hollowed out. In this dynamic, it is only a matter of time before the Spiralling Out of Control scenario begins to unfold (see Figure 5.1.5).
SPIRALLING OUT OF CONTROL
AND HAVE-NOT
Growth & Prosperity (+ve)
(well-functioning) of STIE ecosystem
Collaboration and Sharing
MISPLACED CONFIDENCE
Decline & Despression (-ve)
5.1.5 The Misplaced Confidence, Have and Have-Not, to Spiralling Out of Control Dynamics
This dynamic explores the possibility that the move from the current state to the Have and Have-Not scenario can eventually avoid the drop to the Spiralling Out of Control scenario as a consequence of excessive exploitation and over-focus on shortterm profits (see Figure 5.1.6). Under this trajectory, EPs shift away from their inherent reflex to furthering their self-interest, but instead, they begin to collaborate and equitably share the gains with the host AMS and the region. In this process, they help strengthen local supply chains’ vibrancy. This dynamic requires a major shift in the attitude and mindset of the EPs. It also requires significant investments to undo the damage done by the excessive exploitation of regional resources. While this dynamic is possible, the possibility of it taking place is low.
Growth & Prosperity (+ve)
HAVE AND HAVE-NOT
COLLECTIVE PROSPERITY Conflict and Division (-ve) (Individualistic-Exclusive Prosperity)
Collaboration and Sharing
Decline & Despression (-ve)
5.1.6 The Have and Have-Not to Collective Prosperity Dynamic
This dynamic explores the possibility of the Misplaced Confidence scenario being able to face the challenges in a manner that allows it to transition towards a Collective Prosperity scenario. For this dynamic to occur, the evolution from the current state of play to the Misplaced Confidence scenario involves significant collaboration and sharing within and across AMS. By being able to come together as a collective region, AMS are able to share the financial burden of tackling pressing challenges. The challenges of the Misplaced Confidence scenario are collectively and efficiently mitigated by investments to strengthen the well-functioning of the STIE ecosystem. Combining economies of scale, cumulative knowledge, and expertise opens up opportunities to tackle the region’s pressing and longterm challenges. Gradually, competencies, skills, and resources, both financial and non-financial, develop to enable the shift towards Collective Prosperity (see Figure 5.1.7). The Collective Prosperity scenario entails regional economies addressing challenges that impact their societies by strengthening their STIE ecosystems, thereby building competitiveness in strategic areas of opportunity.
As the above dynamic pathways highlighted, two endpoints by 2050 essentially exist: Spiralling Out of Control or Collective Prosperity. Over time, the Misplaced Confidence and Have and Have-Not scenario eventuate into either Spiralling out of Control or Collective Prosperity. This is captured in Figures 5.1.8a and 5.1.8b.
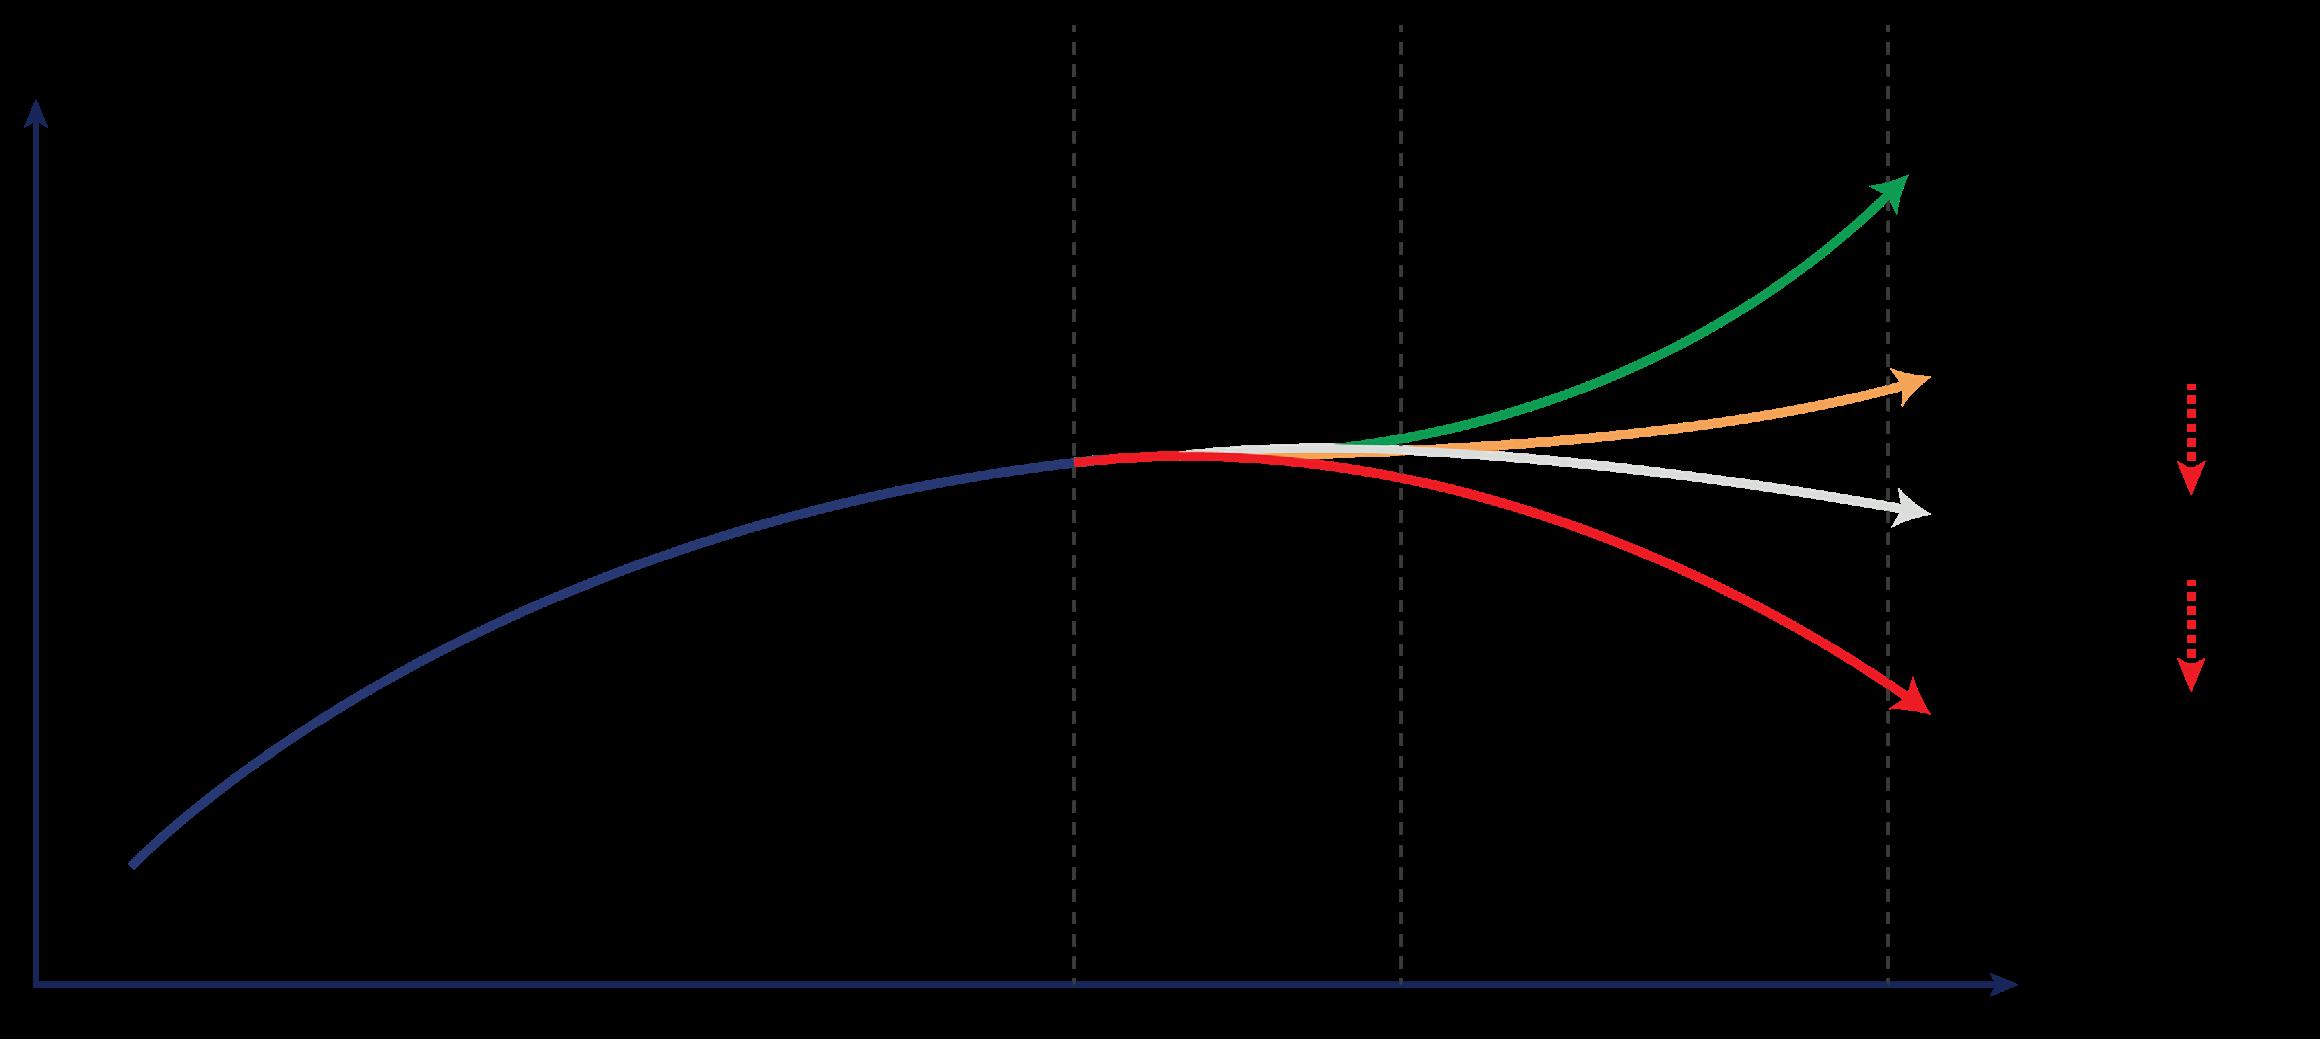
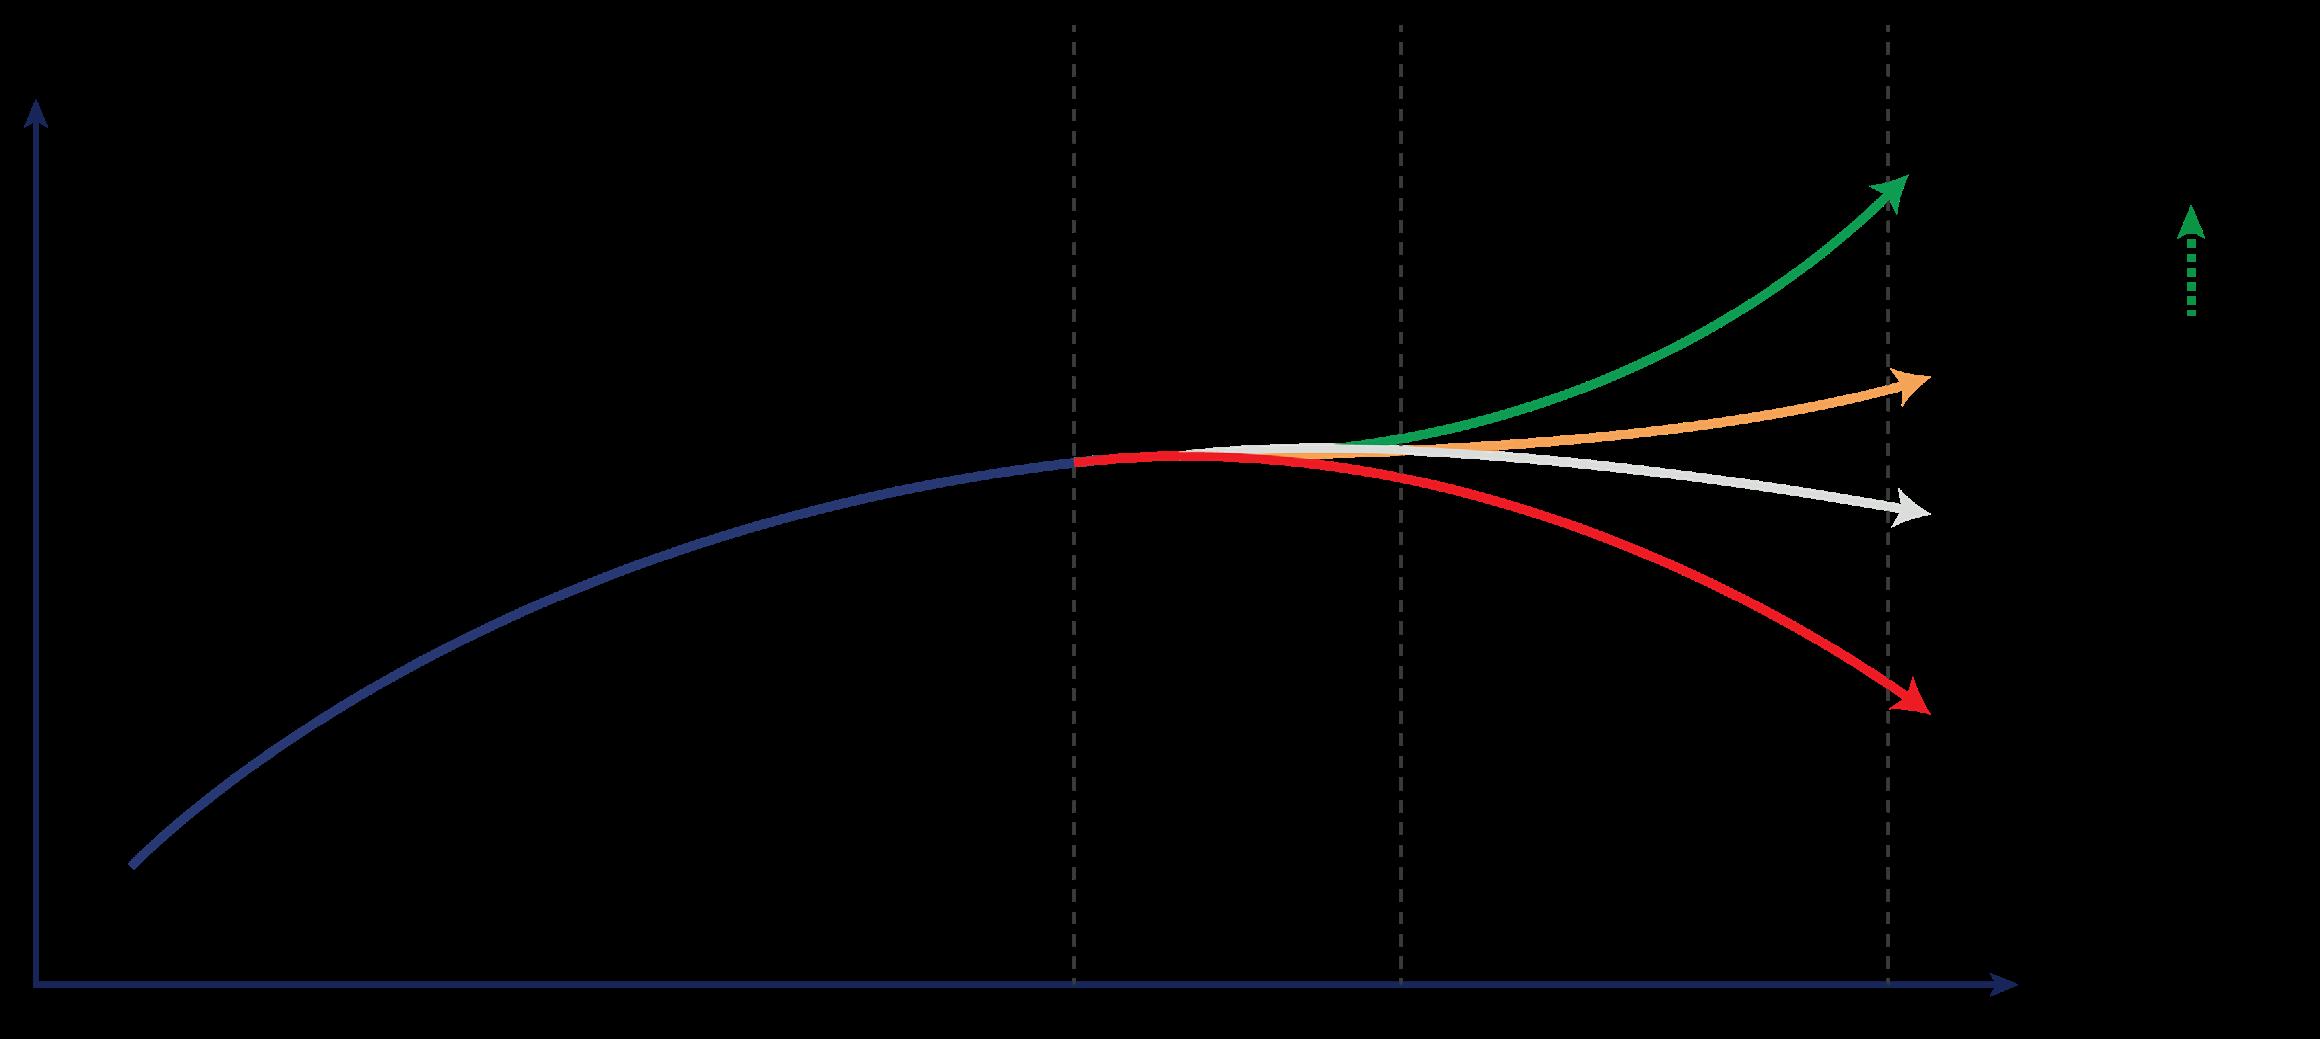
This leads us to question the probability of the outlined dynamics and associated scenarios becoming a reality. Among the four scenarios, the Collective Prosperity stands out as the aspirational vision, wherein ASEAN not only fulfills but potentially surpasses its SDGs and Net Zero commitments by 2050. Expectedly, this is the most challenging scenario to achieve.
While the full Spiralling Out of Control scenario appears to be a distant reality, it is quite likely to occur if unity within ASEAN begins to erode. Misplaced Confidence and Have and Have-Not scenarios emerge as the most plausible outcomes. However, these scenarios, while likely, are far from desirable as they significantly fall short of the aspirational objectives of reaching net zero carbon and biodiversity goals. The likelihood of the scenarios materialising is captured in Figure 5.1.9.
The scenario likelihoods underscore the challenge of achieving the most desirable Collective Prosperity scenario outcome. This raises the question of whether a shift from the Misplaced Confidence to Collective Prosperity scenario is possible. In considering this, one must ask whether there is a choice, given that the alternative is a transition to Spiralling Out of Control, where critical planetary thresholds are surpassed, and the planet undergoes extreme stress. Ultimately, under Spiralling Out of Control, the planet’s and humanity’s very existence is at stake. In essence, there is no alternative, finding a way to make the transition is imperative.
HAVE AND HAVE-NOT
Least
Transitioning to the Collective Prosperity scenario is difficult, yet it is possible if the right types of policies, programmes, and actions are put in place. These initiatives require immediate actions as the evolution of the scenario trajectories suggests that by 2035, it will become deeply embedded, making it extremely difficult, if not impossible, to shift from one trajectory to another (see Figure 5.2.1). The window of opportunity exists, but it is closing rapidly. In this approximately decade-long period, AMS must make concerted efforts to shift to the Collective Prosperity trajectory. Without sufficient investment and effort during this time frame, it will be too late to overcome the embedded entrenchment of the Misplaced Confidence scenario or any other alternate trajectory due to sunk costs, vested interests, and the momentum of past investments. The period between now and 2035 allows for flexibility between the different trajectories, but beyond this point, switching the course becomes almost impossible.
The transition to the Collective Prosperity trajectory requires four major paradigm shifts. These paradigm shifts are captured and categorised in the form of 4Ps: Prosperity, People, Planetary Health, and Partnership. Each of these shifts is presented in the following sections.
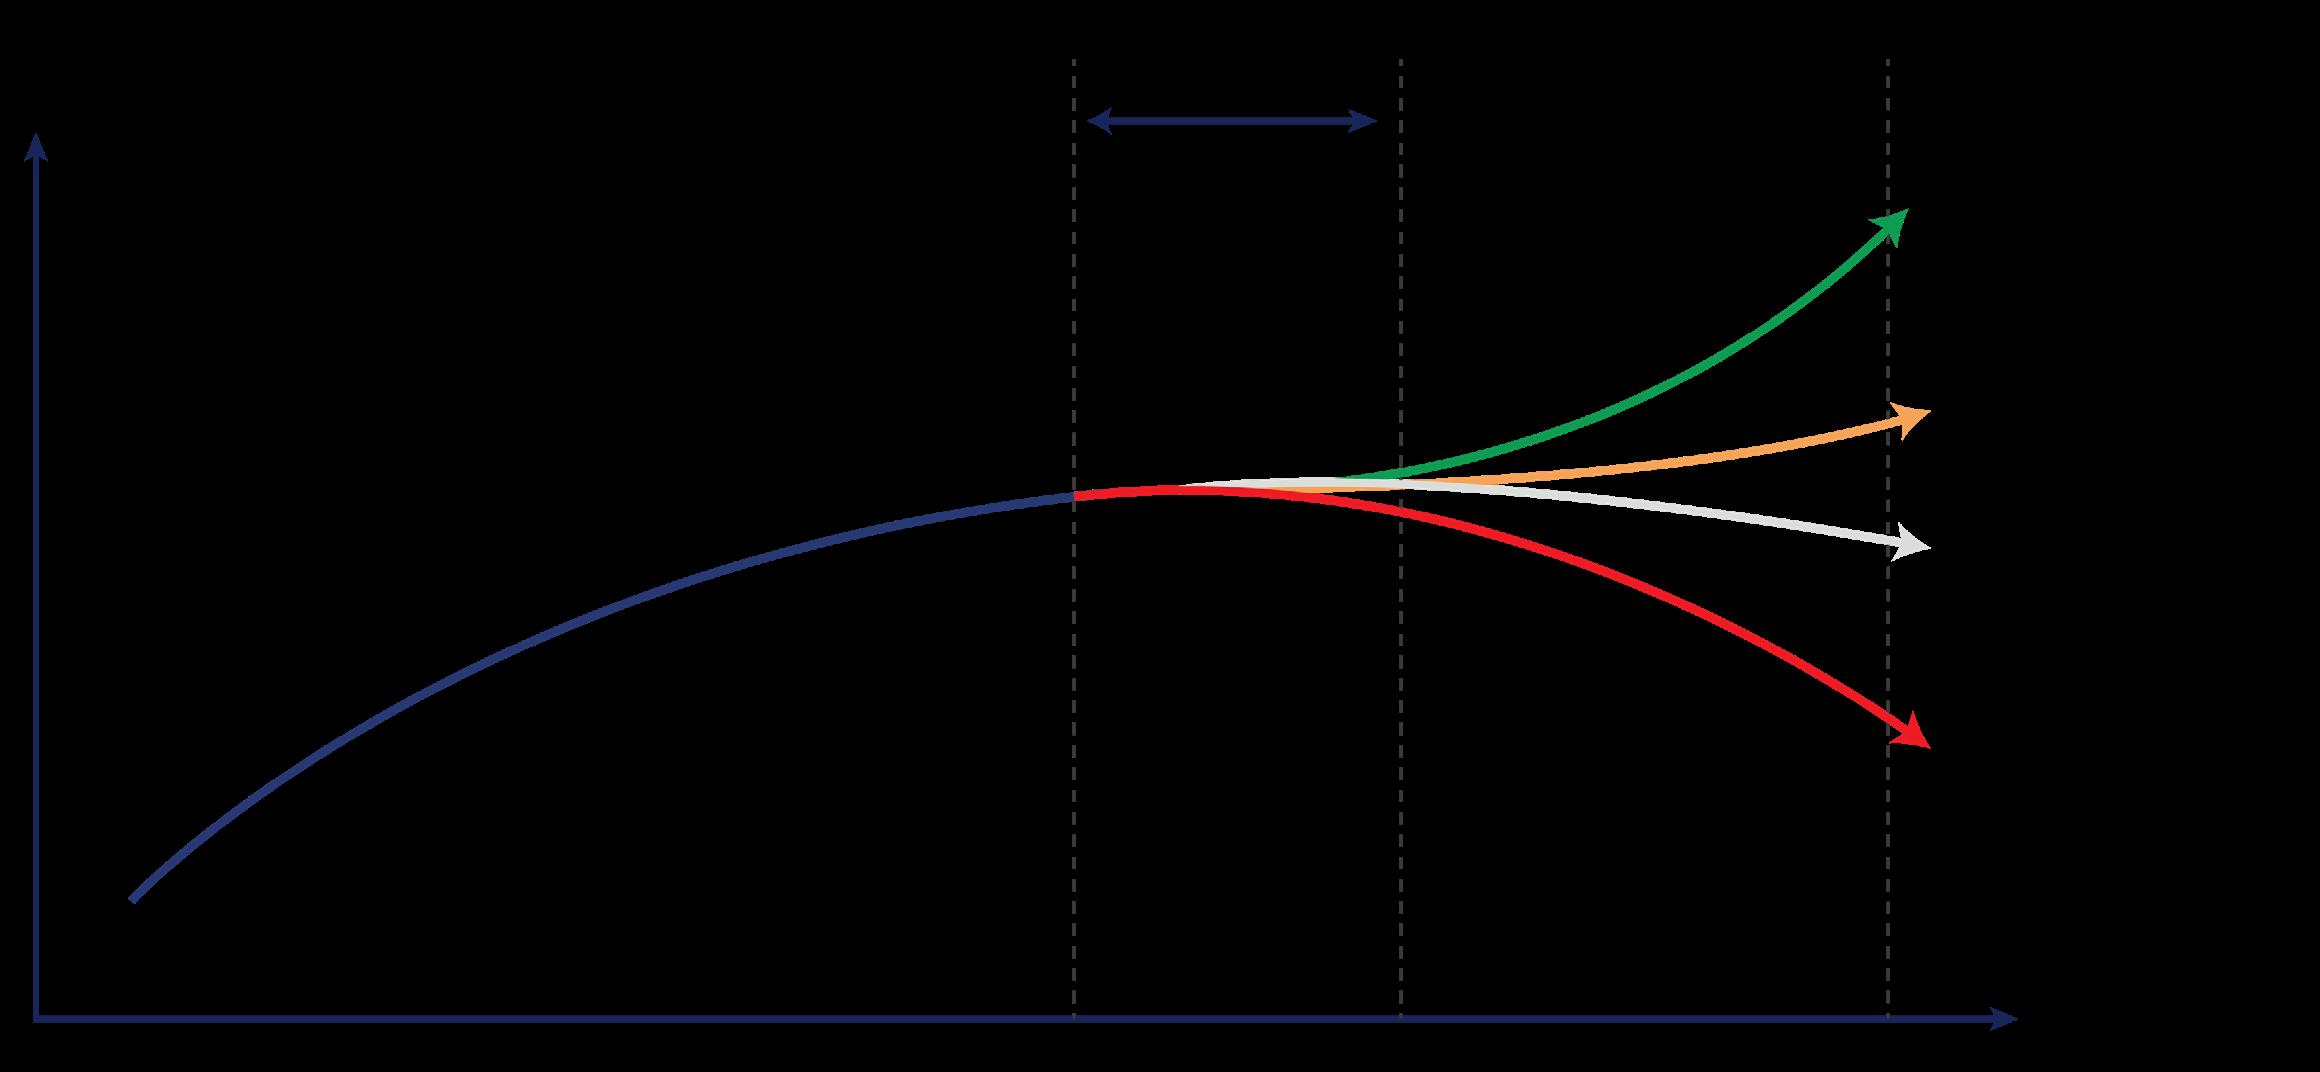
FOUR KEY PARADIGM SHIFTS
PROSPERITY
Profit-Driven (ROI)
Competitive Advantage
Exploitative Investment
Industry 4.0 (National)
Static (Imitative) SMEs
Values-Driven (ROV)
Collaborative Advantage (Re) Configurational Investment
Regionally Integrated Industry 5.0
Innovative and Entrepreneurially Dynamic SMEs
Proactive Exploitation
Energy (Fossil Fuels)
Food System (Global Supply Chain, Synthetic)
Freshwater (Wastage and Pollution)
Controlling
Health (Curative)
Education (Functional Focus)
Governance (Opaque)
Passive Citizenship
Proactive Protection
Energy (Renewables)
Food System (Local Supply Chain, Organic)
Freshwater (Protection and Purification)
Empowering
Health (Preventive)
Education (Solution Focus)
Governance (Transparent)
Active Citizenship
National
Optimise Functions
National Thinking Tasks (Output) Focus
Regional
Optimise Systems
Regional Thinking Outcomes (Impact) Focus
Figure 5.2.2 Four Key Paradigm Shifts
The first paradigm shift that needs to take place to successfully embark on and travel the course of the Collective Prosperity trajectory involves changing the nature of how we evaluate initiatives, programmes, and activities. The dominant mode of conventional assessment is the profit metric or Return on Investment (ROI). This outlook is short-termed and narrowly attributes everything to the amount of money that can be made from any initiative or investment. Indeed, this metric of assessment drives the exploitation and destruction of natural resources since it operates in a moral vacuum, with money and money-making placed above all else. A paradigm shift from profit-driven ROI assessment to valuesdriven assessment is required for the Collective Prosperity scenario to take root. Return on Values (ROV) is a values-driven assessment in which it is recognised that value can be provided intrinsically beyond extrinsic value derived through the functional use of a product or service. Value is not purely measured in monetary terms but through the intrinsic nature of the existence of an object, and the purpose of value creation is not only for shareholders but for all stakeholders of society, including animate and inanimate stakeholders such as nature and the planet itself.
The shift from a profit-driven to a values-driven paradigm also requires several accompanying transitions to take place to facilitate the move to the Collective Prosperity trajectory. The first component is to move away from the competitive advantage premise to the collaborative advantage perspective. Appreciating collaborative advantage is necessary to instil the need for sharing and working together to build long-term success and sustainability. Next is to move away from investments that exploit nature towards investments that are (re) configurational in that they refresh and reinvigorate nature and natural resources, and inclusively build societal well-being. Third, the paradigm shift in economic perspective also necessitates moving away from the naive and nationally siloed application of advanced technologies, such as Industry 4.0, to the regionally integrated use of advanced technologies. Fourth, given the dependence of the AMS on SMEs, it is critical to change the profile of businesses from imitative, low-value-added SMEs to innovative and entrepreneurially dynamic SMEs. A successful shift to a values-driven economic paradigm can enable the Collective Prosperity trajectory.
The second paradigm shift involves a change in our approach to the planet and our attitude towards nature. The primary shift requires moving away from the current approach, which to date has been one in which there is proactive exploitation of nature and its resources based on the belief that humans hold a position of dominion over Earth. This approach approves the exploitation of nature. Successfully traversing a Collective Prosperity trajectory requires moving to the Proactive Protection paradigm, in which human beings are stewards of the planet, and their role is to protect and nourish nature and always maintain a balance in the use of resources through acknowledgement of moral responsibilities beyond self-aggrandizement. This paradigm shift involves several accompanying transitions, the main ones being a shift away from fossil fuels to renewable energy, a move away from global supply chains to local supply chains, especially for foods, and the protection of water sources from being polluted by household waste and industrial pollutants.
It is important to note that all aspects of the paradigm shifts are driven by changes in behaviour (people’s attitudes and actions) and improvements in the functioning of the STIE ecosystems.
All paradigm shifts depend on empowering citizens to drive positive change. For this to occur, there is a need to change how people are treated. There is a heavy emphasis on managing and controlling the ASEAN population, based on the belief that they do not know what is best for them. Such notions stem from the assumption that the population lacks education and knowledge, leading to the belief that only a select elite knows what is best for them. However, a Collective Prosperity trajectory needs citizens to be empowered. The population has to receive an education that transforms them into solution-creators endowed with high-level problem-solving skills, rather than functional cogs in mechanical roles. They have to be active rather than passive members of society. Citizens without a voice tend to decline into a state of dependency on others, such as the state, for their livelihoods and destinies. The people of the region need to develop individual-level dynamic capabilities (absorptive, adaptive and innovative) to ensure that they are able to deal with volatility and shifts in the emerging environment.
The fourth paradigm shift that is vital to enable the transition to Collective Prosperity involves moving away from a mindset that focuses solely on maximising gains for the nation-state to one that looks toward optimising benefits for the whole ASEAN region. Enabling this requires a number of adjustments, primarily a shift in attitude and approach from a nationalistic to a more regional outlook. To support sharing and working at a higher regional level, it is necessary to move away from only optimising national-level functions and agendas, which ultimately create silos, and move to an approach that evaluates the regional ecosystem to optimise for effectiveness by creating spillover impact to all ASEAN economies. This process must also be accompanied by a shift that focuses on outcomes rather than outputs. This helps optimise the ecosystem regionally since evaluation is now based on long-term impact and values-based assessments rather than short-term taskbased metrics.
Next, we need to consider the feasibility of the Collective Prosperity trajectory beyond the concept of implementing paradigm shifts. This question often arises based on the misconception that the term Collective Prosperity implies an ideal state that cannot be achieved. Firstly, it is essential to emphasise that the Collective Prosperity scenario developed here is concrete, with specified goals such as net zero and planetary protection ambitions. Indeed, the Collective Prosperity goals are not mere measures but necessities for ensuring the planet’s long-term survival and human civilisation. The affirmative answer to embarking on and sustaining a Collective Prosperity trajectory is based on the considerable amount of science and technology and best practices that have already been developed or are currently in development in many countries and regions across the globe. While much progress in the STIE ecosystems is needed in the future, possessing the foresight and willpower to execute and implement existing solutions and best practices is crucial while seeking further innovations and scalable solutions through investment in STIE ecosystems.
To illustrate the viability of the Collective Prosperity scenario, several initiatives and programmes that are already in place are highlighted below, which demonstrate progress and the possibility of moving towards the Collective Prosperity scenario.
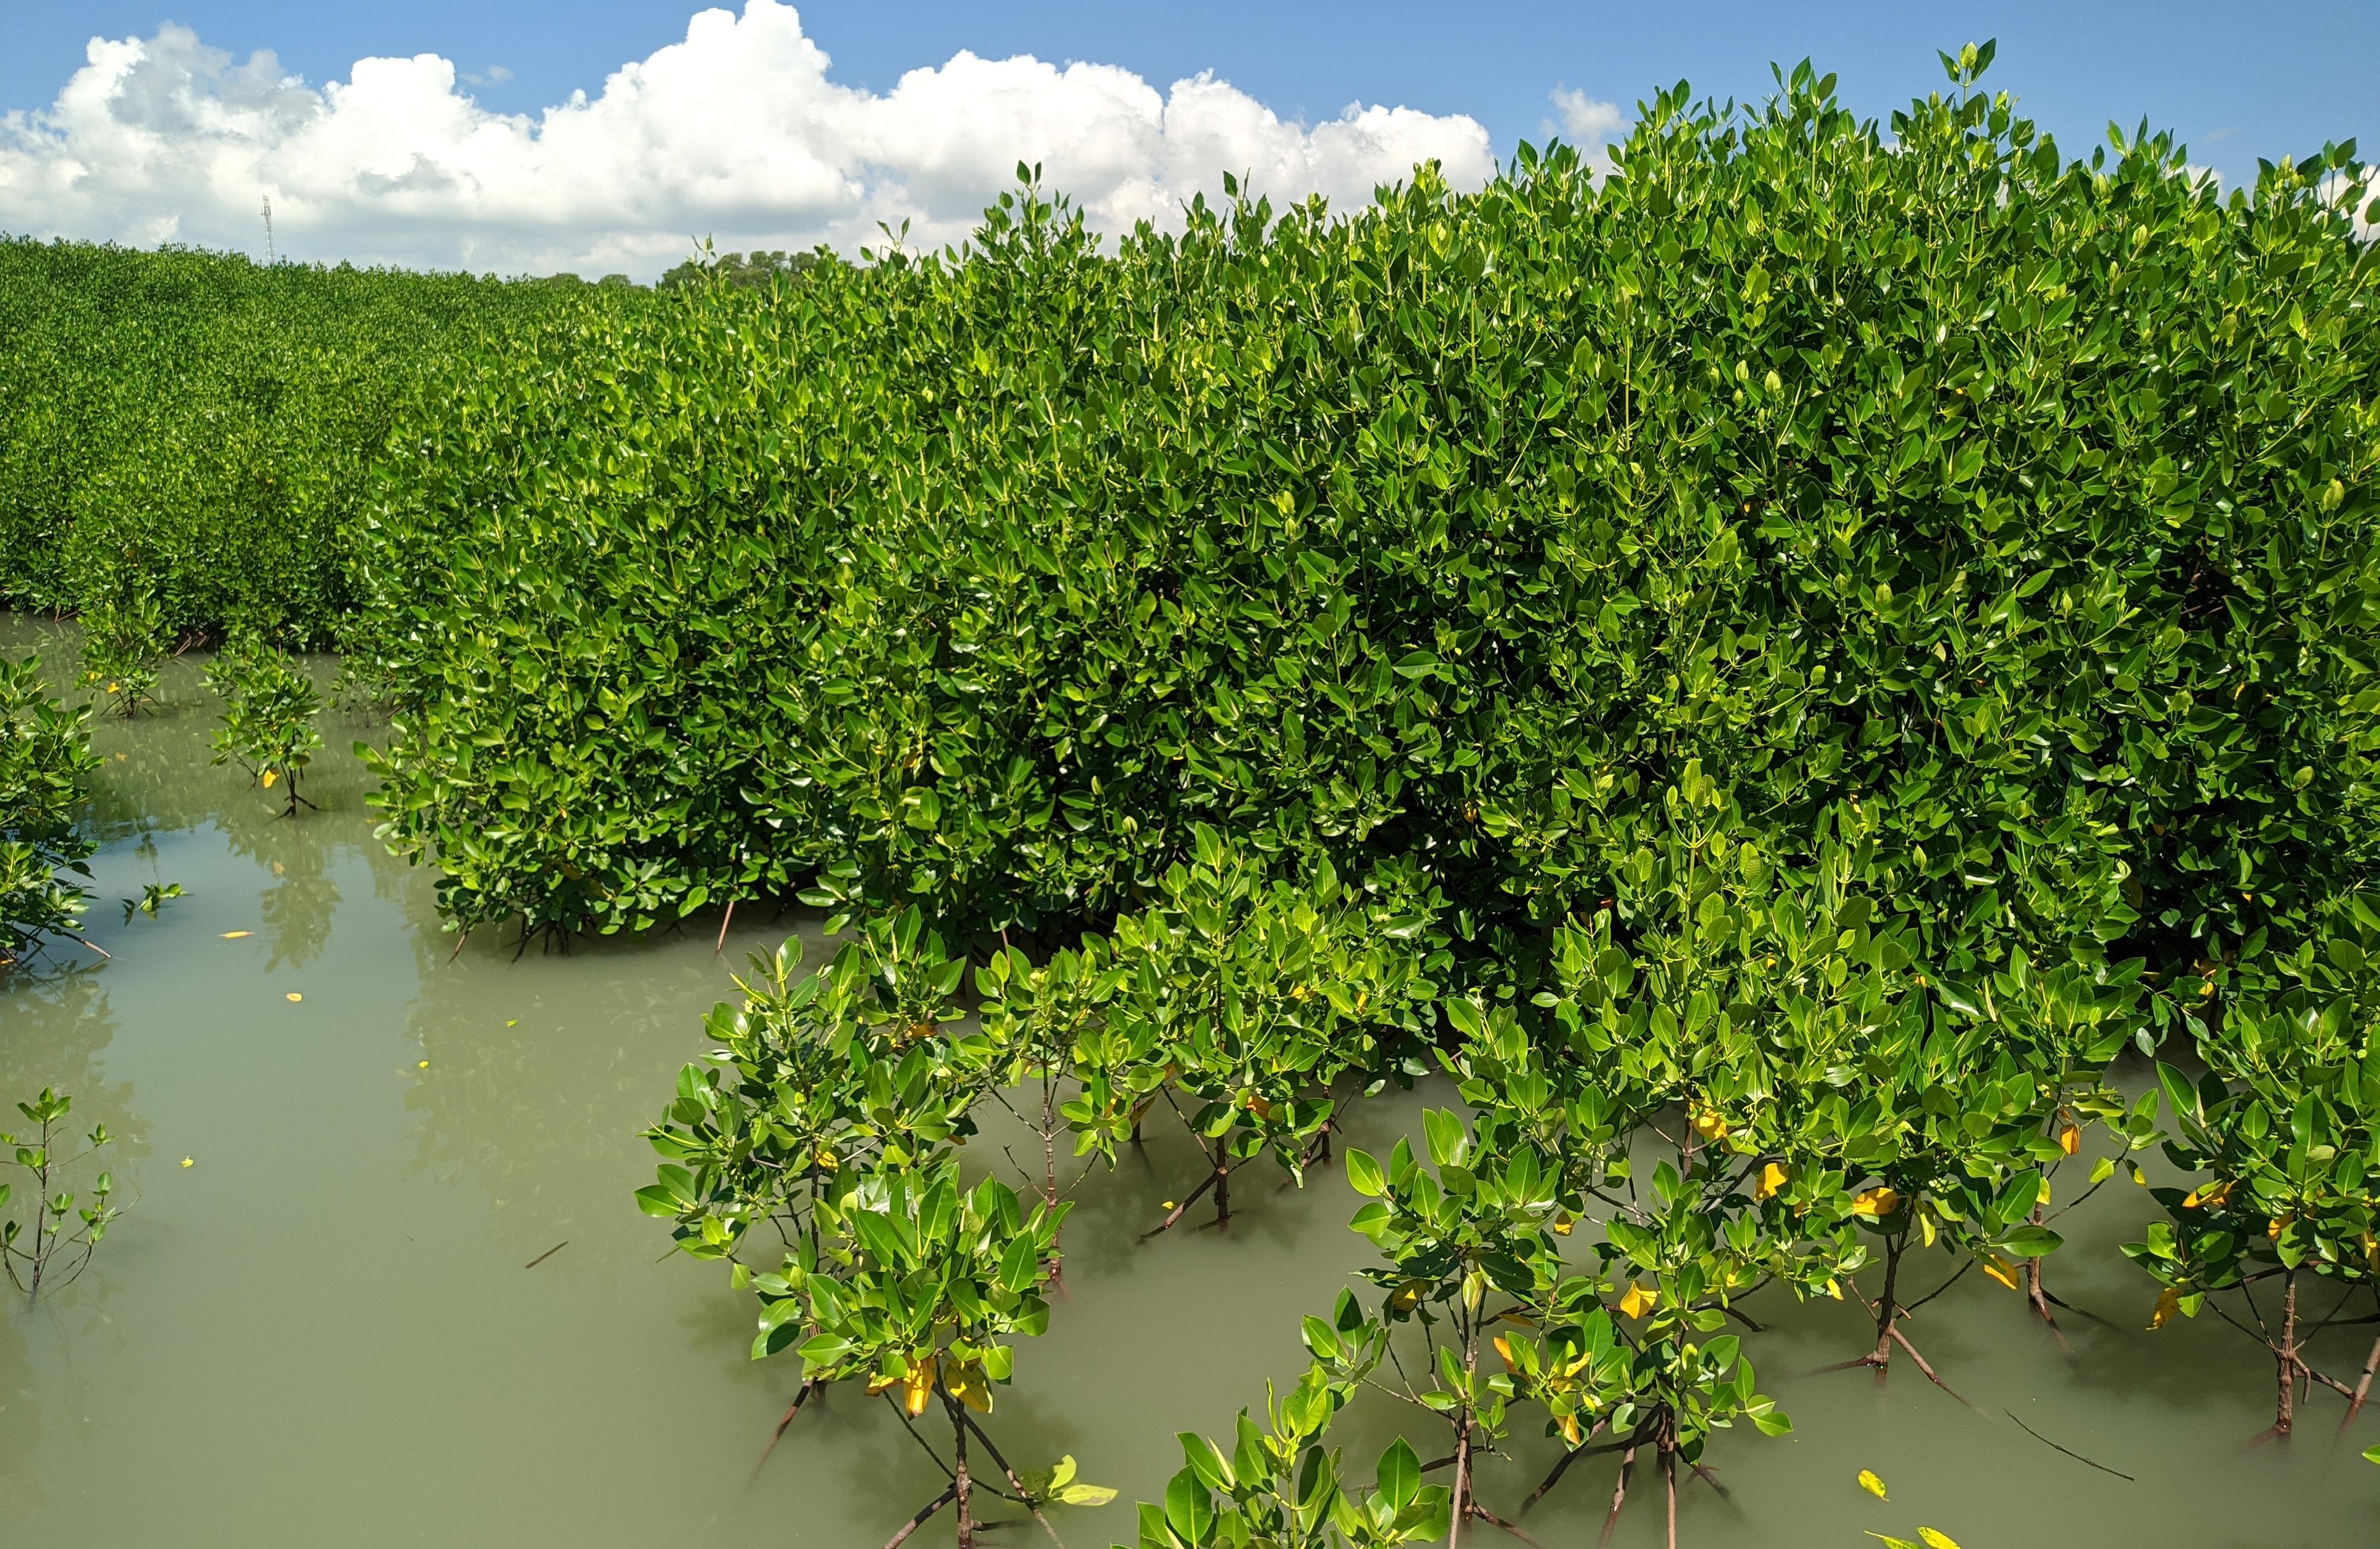
Over 40% of the world’s mangrove forests thrive in ASEAN, serving as crucial natural barriers against powerful winds and waves. These ecosystems, storing ten times more carbon than terrestrial environments, are vital for mitigating siltation and erosion, directly benefitting coastal communities. However, reports reveal a loss of around 33% of mangrove forests in the region, attributed to climate change, aquaculture, agriculture, erosion, siltation, and coastal development. Recognising this critical state, several ASEAN nations have launched ambitious restoration projects. Notably, the Pasarbanggi mangroves in Indonesia, restored over 30 years, boast higher carbon sequestration than other restored areas in the country. Successful mangrove restoration in the Philippines depends on community engagement and legal recognition of local rights, fostering sustainable practices. The Coastal Environment Program (CEP) in Bicol, established in 1990, focuses on protecting natural forests and restoring depleted mangroves. According to the CEP 2019 assessment, mangroves show better conditions due to robust regeneration and effective management.
For more details on Carbon Conservation through the Restoration of Mangrove Swamps, see Appendix 1.
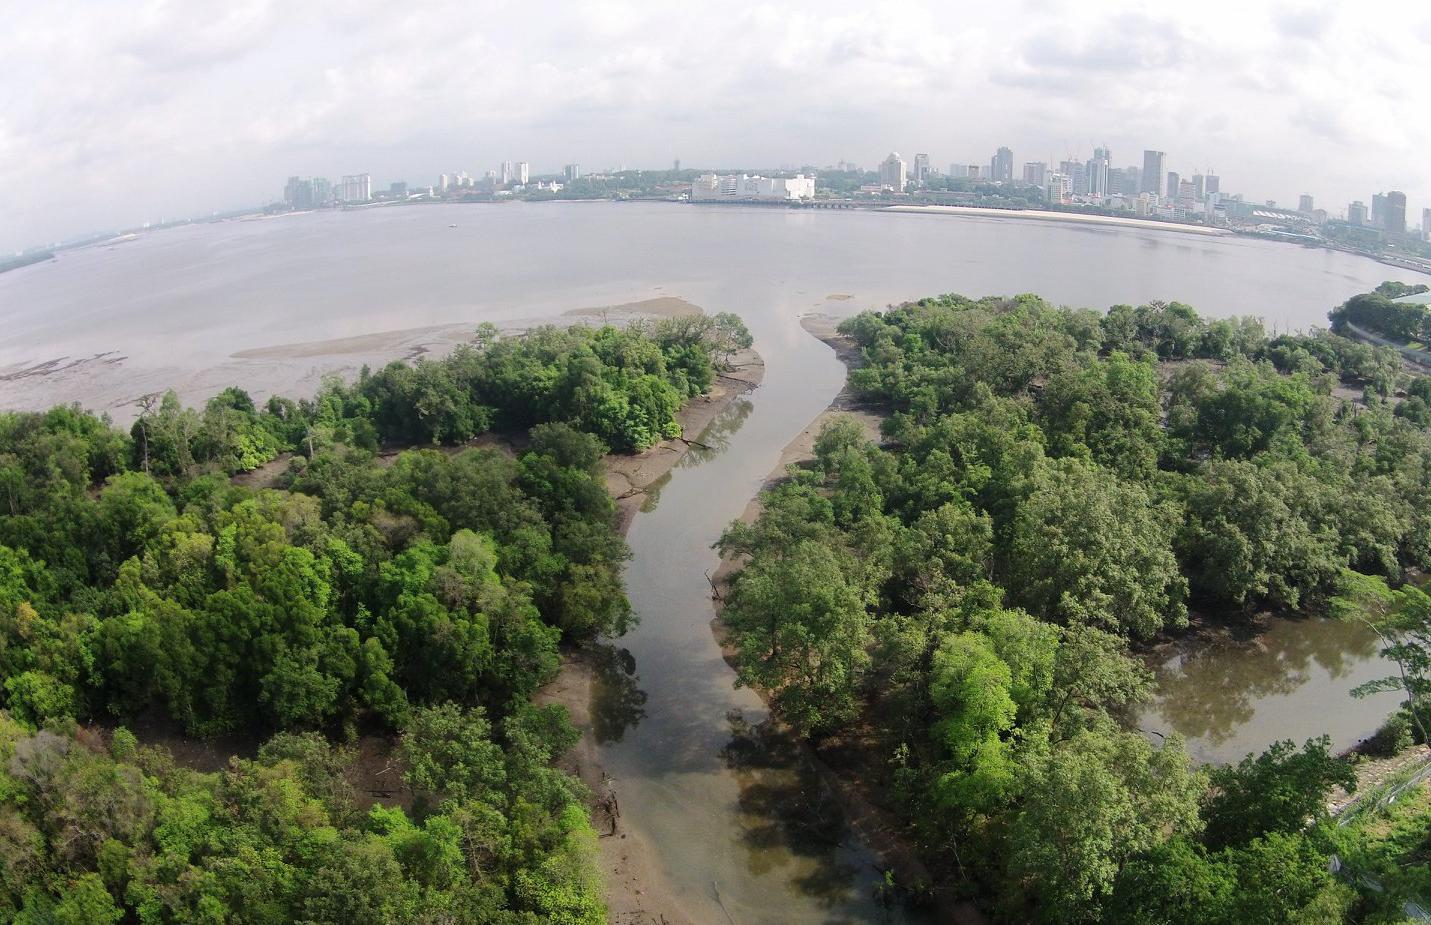
Trees play a vital role in combating climate change, enhancing air quality, and countering urban heat islands by producing oxygen through photosynthesis and serving as crucial habitats. Innovative technologies like satellite monitoring and drones aid in their tracking and preservation. In the face of limited land resources, Singapore initiated the One Million Trees Movement led by the National Parks Board (NParks). In just three years, the initiative has planted over 540,000 trees, targeting completion by 2027, ahead of the 2030 goal. This strategic initiatives involving the community, businesses, and schools, fosters biodiversity, transforming Singapore into a City in Nature. Addressing the urban heat island effect, the movement integrates nature into the urban landscape.
For more details on Singapore’s One Million Trees Movement, please see Appendix 2.
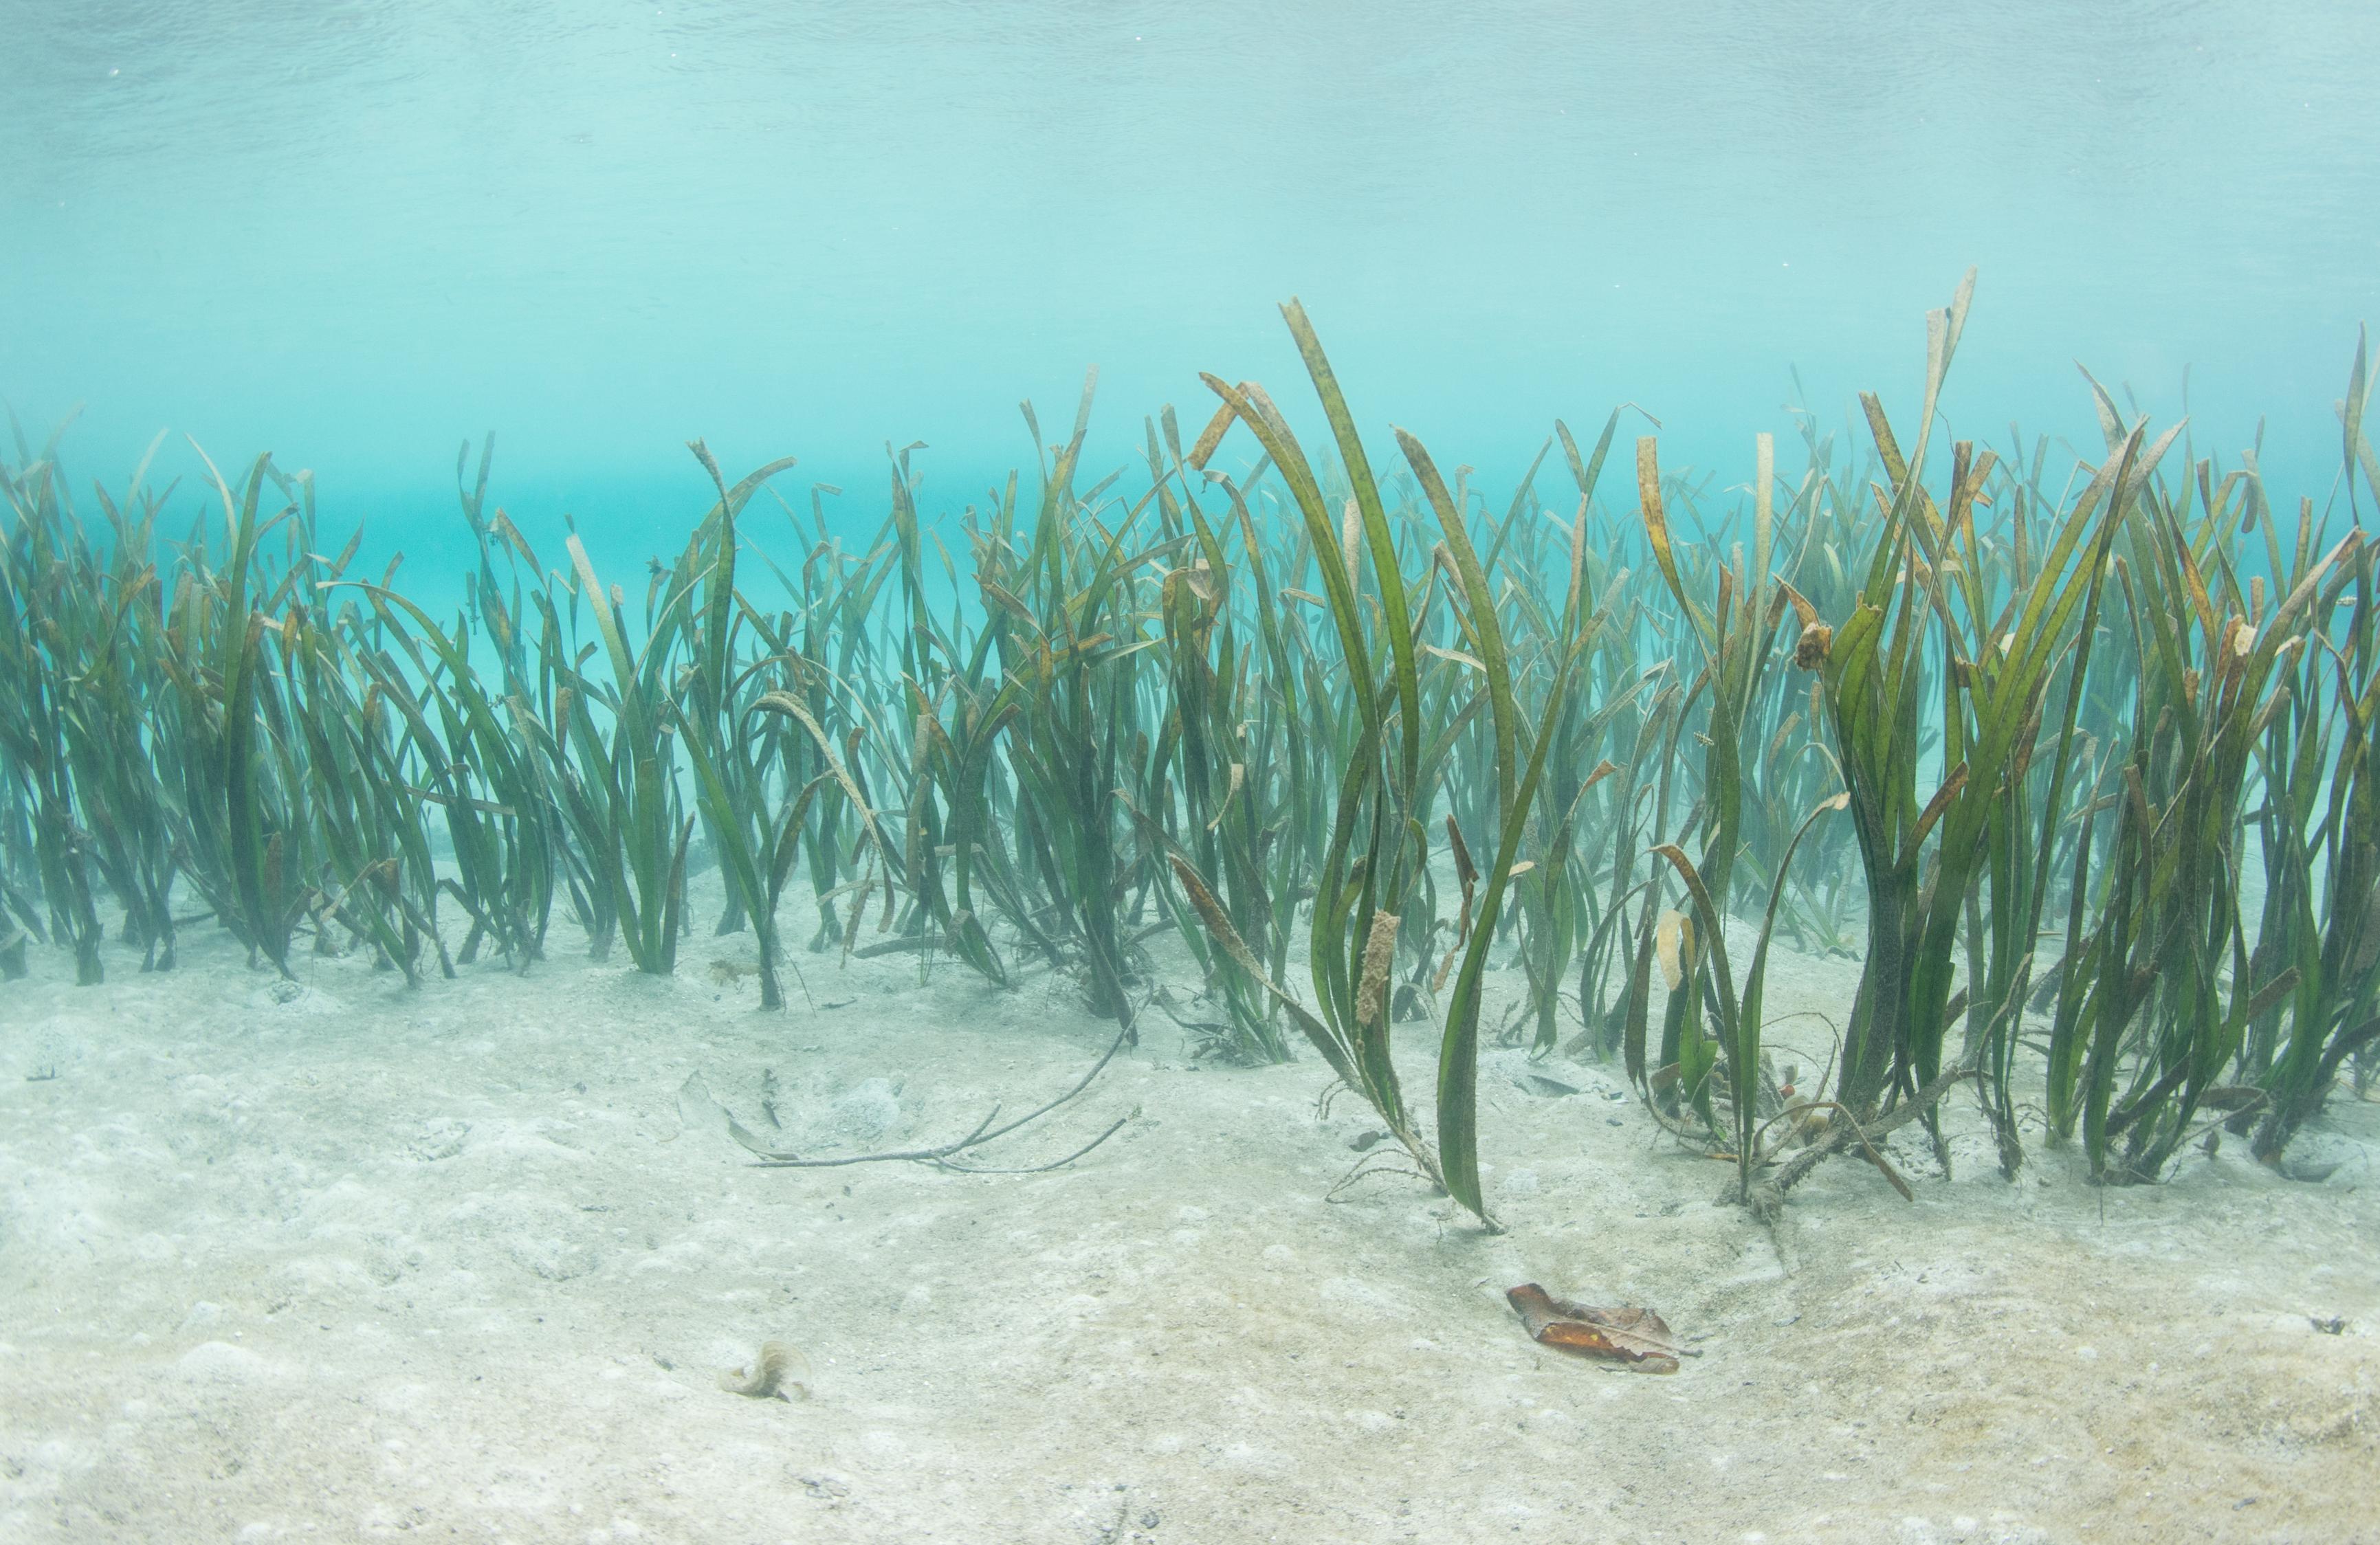
Seagrass, often underestimated, plays a pivotal role in coastal ecosystems, with over 60 species performing vital functions like carbon sequestration, supporting marine life, and improving water quality. Yet, seagrass faces severe threats, prompting conservation measures such as transplanting and seeding. In Indonesia’s Raja Ampat, initiatives led by Linani Arifin and Almira Nadia Kusuma involve local teenagers in restoring seagrass meadows, mangroves, and coral reefs. International projects like Chesapeake Bay and Port Phillip Bay have effectively rejuvenated seagrass, benefitting water quality and fisheries. The significance of safeguarding and restoring seagrass cannot be overstated, as it is not only vital for ocean health but also essential for the overall well-being of our planet in the fight against climate change and ecosystem preservation.
Refer to Appendix 3 for more details and examples of progress to date.

Transportation accounts for 30% of annual carbon emissions, urging the sector to find cleaner solutions for net-zero emissions by 2050. One promising solution is through the development of hydrogen-powered vehicles, which emit zero carbon. By replacing kerosene with hydrogen, the energy generation process produces only water vapour and energy, significantly reducing the carbon footprint. Unlike battery electric vehicles, hydrogen-powered vehicles have longer ranges and quicker refuelling times, making them more convenient for long-distance travel. Despite challenges like infrastructure needs and high production costs, progress in developing and commercialising hydrogen-powered vehicles is evident. Land, sea, and air vehicles worldwide showcase the transformative potential, exemplified by Toyota’s Mirai, a hydrogen fuel cell electric vehicle. Overcoming challenges that hinder the mass adoption of hydrogen-powered vehicles is vital to accelerate the shift toward a low-carbon transport system.
For more details on Hydrogen-Power initiatives, please see Appendix 4.

As a result of rapid urbanisation, air pollution has become a severe environmental issue faced by many cities. To address this issue, researchers are actively exploring innovative techniques to remove pollutants from the air using sustainable building materials, such as the Breathe Brick and the i.Active BIODYNAMIC cement. The Breathe Brick is a twolayered brick that filters pollutants with an outer layer and provides insulation with an inner layer. It uses cyclone filtration to remove large pollutant particles and deposit them into a removable hopper. Breathe Bricks is currently in its developmental stage and has not yet been widely commercialised. However, this innovative material has shown the potential to be a game-changer in the construction industry due to its sustainable and eco-friendly properties.
On the other hand, i.Active BIODYNAMIC cement is made from 80% recycled materials and Carrara marble scrapings. Titanium dioxide, a photocatalytic material present in this cement, can decompose air pollutants into salts when exposed to UV light. Additionally, this cement is self-cleaning, durable, an excellent insulator, and has a lower carbon footprint compared to traditional cement.
Refer to Appendix 5 for additional details on these sustainable and advanced building materials that are safeguarding the planet.

Carbon emissions have led to devastating consequences such as wildfires, increased ocean acidity, and global warming. Carbon sequestration, involves capturing and storing CO₂, is a crucial approach to combating climate change caused by carbon emissions. Bioenergy with carbon capture and storage (BECCS) has emerged as an effective solution, as it captures CO₂ during biomass energy production, contributing to a decarbonised economy. In leading the way, countries like Denmark, Sweden, the United States, and Norway have made commendable strides in BECCS technology; examples include Denmark’s Orsted collaboration with Microsoft and Aker Carbon Capture to elevate biomass quality, Norway’s use of BECCS in cement production, the UK’s Drax which captures over a tonne of CO₂ daily through sustainable biomass generation and electricity cogeneration plant technology that allows for a transition from low carbon emission to zero emission.
Refer to Appendix 6 for more details and excellent examples of progress to date.

In the world today, many people see, buy, and use products made of plastic in our daily activities without really giving it a second thought. Due to its versatile nature, global demand for plastics has spiked since its introduction and remains high. Disposing of these plastic products is, however, a huge problem. With global plastic recycling rates at a low of 15%, various initiatives and innovative solutions are urgently needed.
In China, cities have artificial intelligence (AI)-powered garbage bins that can detect waste materials and give cashback rewards. In the United Kingdom, a start-up is working with manufacturing giants like Coca-Cola, waste brokers, and recyclers throughout the country, using data science and machine learning to manage waste, including plastics. In Hong Kong, India and Singapore, AI-driven robots are deployed to combat urban water pollution, and a German company is currently developing a technology to detect, clump and remove microplastics from wastewater and drinking water. These efforts and more are needed to ensure that our use of plastic will not cause further harm to the planet than it already has.
For more details on tackling the plastic waste challenge, please see Appendix 7.

Greenheart Farms Sdn Bhd, a leading ASEAN agricultural company founded in 2009, is renowned for its innovative and sustainable practices. They employ advanced technologies, such as precision farming and natural pest control, to produce top-quality, pesticide-free vegetables. Beyond their farming endeavours, they educate fellow Malaysian farmers on eco-friendly techniques, and have developed technologies to minimise post-harvest losses. Their farms, Blue Valley Farms and Lojing Farms, are notable for adhering to environmentally friendly practices and have earned Global Good Agricultural Practices (GAP) certification, ensuring high-quality produce akin to European and American farms.
Greenheart Farms and its affiliated ventures play a significant role in promoting sustainable and technologically advanced agritech practices throughout the ASEAN region.
Refer to Appendix 8 for more details and examples of progress to date.

The mining industry, vital for supplying raw materials and facilitating the clean energy transition, inflicts severe environmental damage costing up to £4 trillion annually. A solution lies in adopting the circular economy approach, prioritising resource conservation and regeneration through reducing, reusing, and recycling materials. Rio Tinto, a major Australian mining company, serves as a successful case study, implementing circular economy practices in their midstream processing phase. Effectively utilising by-products and waste from metal processing operations, they extract minerals like tellurium, scandium, ALEXTRA, and anhydrite for various applications, including PV solar panels and fuel cells. Embracing such practices can reduce waste and environmental impact as well as enhance efficiency and resource utilisation for mining companies and other sectors alike. This best practice is particularly crucial for ASEAN countries in the strive for a global clean energy transition.
For more details on Rio Tinto’s initiatives to build circularity into its operations, please see Appendix 9.

Laos has a geographically diverse landscape of forest-covered limestone mountains, open woodlands and lowlands that lie along the banks of the Mekong River. Rich in natural monsoon forest areas scattered with bamboo and shrubs, Laos is home to hundreds of species of orchids and palms. It houses nearly 200 species of mammals, reptiles, amphibians and birds. The natural beauty of its landscape provides Laos an opportunity for economic value through nature-based tourism.
The development of nature-based tourism has increased the rural household income and alleviated poverty of some community. In 2021, a project called “Supporting Micro, Small, Medium Enterprises (MSME) in the Lao Tourism Industry Supply Chain to Access Markets for Sustainable Practices Project” (SUSTOUR Laos) was introduced. The pilot project is initiated in Vientiane districts and Luang Prabang province. It is a model for sustainable tourism development that promotes multiple stakeholders and community members to reduce social and environmental impacts of tourism.
For more details on Laos Sustainable Tourism Industry initiatives to build circularity into its operations, please see Appendix 10.

Food security is a major concern for many countries in the ASEAN region due to their unique socio-economic conditions and vulnerability to climate change. Singapore, being one of the most densely populated countries with limited land availability, has found an innovative and sustainable solution to address this challenge through vertical farming techniques. Similarly, Malaysia is also making efforts towards sustainable technological advancements that can secure agricultural supply chains and ensure food safety through Smart Farming Systems. Urban agricultural farms such as Sunway XFarms and CityFarms Malaysia prioritise sustainable practices and smart farming technology to address both food security and the deteriorating state of agricultural lands. By implementing such innovative and sustainable solutions, these countries are ensuring that their citizens have access to safe and healthy food, even in the face of changing environmental conditions.
For more details on food security initiatives in ASEAN, please see Appendix 11.
As highlighted in the previous chapters, emerging challenges are increasingly converging into a polycrisis. Systematic actions are, therefore, needed to tackle them in a manner that transposes the polycrisis into poly-opportunities. Moving forward necessitates an understanding of the implications arising from each of the scenario trajectories. In this concluding chapter, recommendations on the best ways to move forward towards a Collective Prosperity scenario for ASEAN will be presented.
Based on the previous chapters, the learning points from each scenario quadrant are summarised in Figure 6.1.1.

The first key takeaway from the Misplaced Confidence scenario is that being content and self-satisfied with the current programmes of action will not allow ASEAN economies to escape from, gradually, but surely, moving towards the Spiralling Out of Control endpoint. Indeed, complacency is the root of most, if not all, decline in development, economic competitiveness, and quality of life. Following the Misplaced Confidence trajectory will magnify the current gaps in the ecosystem and the challenges the ASEAN economies face. This may lead to several of the economies being unable to recover from the adverse impact of the challenges that impact them – for example, degradation of the environment, health challenges, deterioration of quality of life, and loss of economic competitiveness.
Second, the current course of action will cause resources not utilised optimally due to the ad hoc and inconsistent manner in which initiatives are executed at the national level without diligence to the ASEAN collective. Making a meaningful impact on the global scene requires the whole of ASEAN to act together and be aligned and in sync with each other. In the emerging world of fast-paced change, global competition and gameplay will be enacted via networks and other regional groupings like the EU. ASEAN must likewise do so, or risk being dominated by powerful network blocs. Continuing in the current manner by loosely working together and following others is unlikely to ensure a pathway to success. Playing the waiting game in which others take the first step is a significant shortcoming. What is needed, instead, is for the AMS to come together and proactively secure the trajectory of their collective destiny towards sustainable development.
The key learning that emerges from the Spiralling Out of Control scenario is the need to take immediate action rather than procrastinate and delay. Once critical thresholds, such as the planetary health bound conditions, are contravened, bringing them back into safe zones is highly challenging. In fact, as multiple critical thresholds are exceeded, they are likely to have a domino effect. The window of opportunity to rectify the damage remains open but is closing fast. By 2035, it is highly probable that the ability to flex and change the direction of the trajectory upward towards Collective Prosperity will be all but difficult to achieve.
The most important lesson learned from this scenario is the importance of the STIE ecosystem; whoever has control over the STIE ecosystem will eventually emerge as the winner, and there will be many losers. ASEAN needs to ensure that it and its members are in control of the STI being used within the economic sectors over which they have jurisdiction. If other external players, whether companies or nation states, are able to exert control over the AMS’s STIE, they will also be able to use their influence to extract resources and monopolistic rents, or even take over the ecosystems completely. External influence and control open up the possibility of hollowing out ASEAN by poaching its talent, depleting its natural resources while executing higher value-added activities elsewhere, and leveraging financial benefits while not investing significantly in the host AMS. The problem highlights the need to be vigilant about the nature of FDI, which, as this scenario highlights, tends to be more often exploitative and only rarely nurturing.
The first important lesson from the Collective Prosperity scenario is that it is critical to take a systems approach at the regional level, and not just optimise the ecosystems at a national level. This requires understanding the heterogeneity within ASEAN and recognising that there will often be a need to reconcile competing interests. Additionally, this scenario suggests that even if small steps are taken collectively, they will yield significant progress over time. Eventually, the small steps will show how collaborative advantage can be built and allow larger collaborative initiatives to be started. The second important learning point is that the systems approach will not succeed by relying solely on technical aspects of the ecosystem. The success of the Collective Prosperity scenario is critically dependent on people’s behaviour and attitudes. Without the behavioural component, the technical ecosystem will produce only marginal progress. The third key learning from the Collective Prosperity scenario is that ASEAN will not succeed if it remains a “Tech-taker”. It needs to shift and become a “Tech-maker”. It is essential to break AMS’s dependence on high-value imports, and the only route to do this is by taking control of its STIE ecosystem through the nurturing of indigenous innovation. ASEAN STIE sovereignty is critical for it to have technological and economic leverage globally while ensuring sovereignty of its regional territories and resources.

Making the Collective Prosperity transition and sustaining it requires a systematic effort. By understanding the four scenarios and their inherent dynamics, three fundamentals emerge, and each one is critical for a positive future.
1STIE-enabled Regional Resilience through the nurturance of a robust, well-functioning STIE ecosystem.
2 Behaviour building for collective-inclusive regional prosperity.
3 Systematic Foresight to drive the transformational shift towards Collective Prosperity
1. STIE-ENABLED REGIONAL RESILIENCE THROUGH THE NURTURANCE OF A ROBUST, WELL-FUNCTIONING STIE ECOSYSTEM
A well-functioning STIE ecosystem is dependent on its availability and stability to ensure that all parts of the ecosystem are robust and aligned. Without adequate and sustained funding, the STIE elements weaken over time, resulting in failure to deliver on set goals and objectives.
• Funding from AMS
This requires each of the AMS to set aside funding to be invested in strengthening national and regional STIE ecosystems and funding for STIE ecosystems that work across the region. Essentially, this is a form of direct domestic investment in the region.
• Private Sector Investments
ASEAN needs to take actions that incentivise the private sector to step up and play an active role in the development of robust ASEAN ecosystems. This may be achieved through the development of effective Private-Public Partnerships (P-P-Ps). The right types of incentives need to be designed, managed, and controlled. In particular, it is important to maintain a high level of transparency and integrity in the execution of the P-P-Ps to ensure that all parties play their roles and also ensure there is efficiency with no leakage of funds through veiled practices.
• Funding from Industrialised Nations
Advanced nations have been a major contributor to the current planetary health crisis, in which critical thresholds have been breached or are close to being breached as a consequence of their industrialisation legacy. It is imperative for ASEAN to ask these advanced nations to honour their pledges of support, given their historical record of heavy resource exploitation and pollution.
• Regional Sovereign Fund
Setting up a Regional Sovereign fund for ASEAN through an initial deposit from all member states is highly recommended. A well-managed ASEAN sovereign fund could nurture and strengthen ASEAN ecosystems in perpetuity.
• Foreign Direct Investment (FDI)
ASEAN needs to continue to bring FDI into the region from international firms and sponsors as a means to strengthen regional STIE ecosystems. However, in doing so, ASEAN needs to keep a watchful eye on the nature of FDI, especially to ensure that the terms of the FDI are well-balanced and do not allow external parties to exploit and hollow out AMS’s resources. Long-term Domestic Direct Investment (DDI) should be complemented with attracting high quality FDI into the region to ensure ASEAN is a key player in the global supply chain and is continuously moving up in global innovation value chain.
Once the funding issue has been resolved, it is necessary to check that the STIE ecosystems function effectively for the attainment of specified goals. For this to happen, there must be a strategic alignment of the STIE ecosystem. In other words, investments must be directed to each of the 8i elements of the STIE ecosystem. Each must be highly functioning, connected, and aligned to strategic objectives. It is important to take note that simply investing in and optimising the 8i of the STIE ecosystem can lead to the Misplaced Confidence, Have and Have-Not, or Spiralling Out of Control scenario but precludes the development of the Collective Prosperity scenario (see Figure 6.2.1). For the Collective Prosperity scenario to take root, it necessitates the inclusion of one crucial ingredient: a values-based approach that guides and optimises the ecosystem to have a long-term outlook in which nature is protected and stakeholder interests are fully considered rather than driven by narrow, short-term shareholder interests. To facilitate this, the 8i STIE ecosystem must be melded and driven by a philosophical system that incorporates a values-based approach (see Figure 6.2.2). One such approach is the 8R Nature-centric philosophy, detailed in Figure 6.2.3.
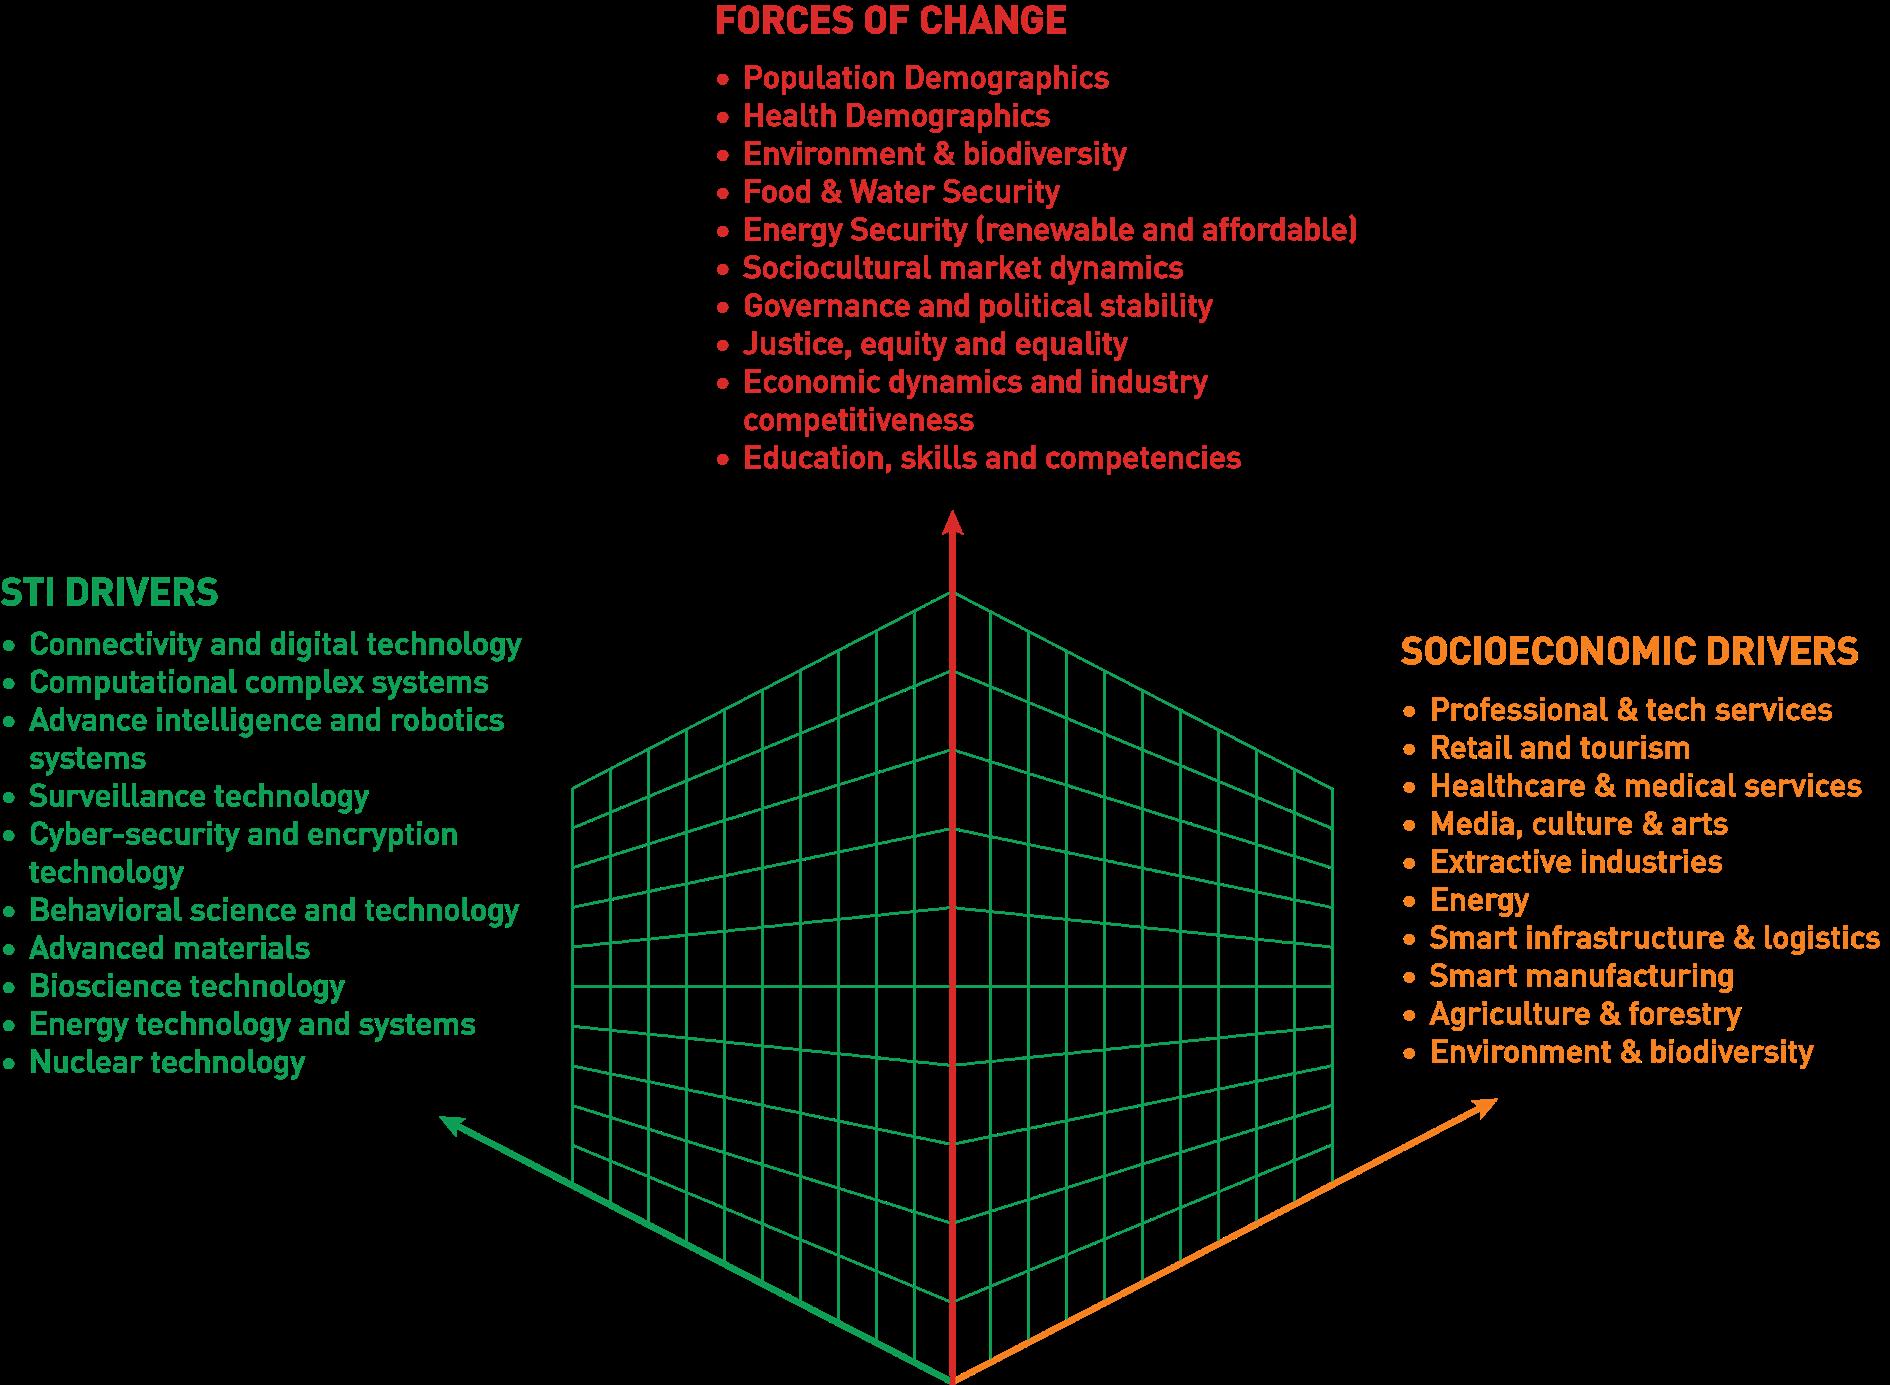
SPIRALLING OUT OF CONTROL HAVE AND HAVE-NOT

COLLECTIVE PROSPERITY
Moving away from ‘man’s dominion' of nature to ‘mankind’s stewardship’ of nature is crucial for sustainable development. Stewardship accords greater respect for nature and its resources to support a more humane, equitable, and just development agenda. The “8Rs” core values (see Figure 6.2.3) should be integrated into all development initiatives to obtain higher value from natural resources within the ecosystem.
for human rights, animal rights, biodiversity, and the health of the planet.
the use of ecosystem resources, with strategies put in place to obtain the best ROV from these resources to benefit society and its future generations.
the impact of human activities and unfettered consumption that adversely affect the quality of the resources in the planetary ecosystem, human life, and societal development.
ecosystem resources effectively and in multiple ways to reduce wastage and enhance responsible consumption (reduce unfettered demand for resources).
The 8R Philosophy involves a mindset shift to develop a more progressive, humane, caring, and environmentally friendly society. The approach helps to:
• break the vicious cycle of poverty and empower vulnerable communities to improve their quality of life by giving them access to necessary resources and life skills;
• address inequalities and inequities that perpetuate and widen knowledge and wealth gaps between the ‘haves’ and ‘have-nots’ by providing access to vital services that can improve the quality of life of all segments of the population;
• invest in infrastructure development, education, industrial development and innovation to enhance the competitiveness of environmentally friendly local industries and create sustainable employment opportunities for all segments of the population;
• ensure the sustainability of communities and cities by adhering to global best practices and standards relating to the environment, planetary health, and climate change;
• develop strong institutional leadership and institutions to ensure good governance, peace, prosperity, security, and justice for all communities and countries; and,
• build strong partnerships and networks to nurture progressive societies and a humane development agenda anchored on sustainable social inclusion, political empowerment, economic prosperity, good environmental management practices, and the preservation of biodiversity and conservation of our natural habitat and the species therein.
M., Ahmed, P. K., & Vaithilingam, S. (2022). Values-Based Development and Competitiveness: A Conceptual Analysis. (No. 2022-001 PB; IGSC Policy Brief). Sunway Institute for Global Strategy and Competitiveness.
unwanted waste to ensure existing resources in the ecosystem are used optimally, creating new value from waste and ensuring current resources are preserved for future generations – promoting “circular economic and development” models.
the value of the resources in the ecosystem by using them effectively and continuously investing in appropriate STIs to create new value to improve the quality of these assets and the quality of life for all stakeholders.
(reconfiguring) the resources in the ecosystem for multiple uses to create multiplier effects and enable economies of scale and scope, in the process, create higher ROV for all stakeholders.
the value of the resources in nature by continuously investing in them, preserving and harnessing their full potential and value for current and future generations.
For ASEAN to be a strong competitive region in which the AMS are able to chart a robust economic development pathway and simultaneously protect the planet and create an inclusive society, each AMS must have internal STIE ecosystems that are strong and national ecosystems that are interlinked and aligned at the regional level. If the ecosystems are merely optimised at the national level, it is impossible for ASEAN to compete with global players who have built strong networks, as seen in the EU (see Figure 6.2.4a). The AMS must foster linkages across ASEAN and align as a region to be able to compete with other regional groupings. ASEAN needs to build a competitive advantage through cooperation and collaboration to prosper in the future as shown in Figures 6.2.4b and 6.2.4c.. A dynamic ASEAN STIE Ecosystem will be able to foster a strong collaboration and partnership with other regional groupings to increase prosperity within ASEAN and across the globe.
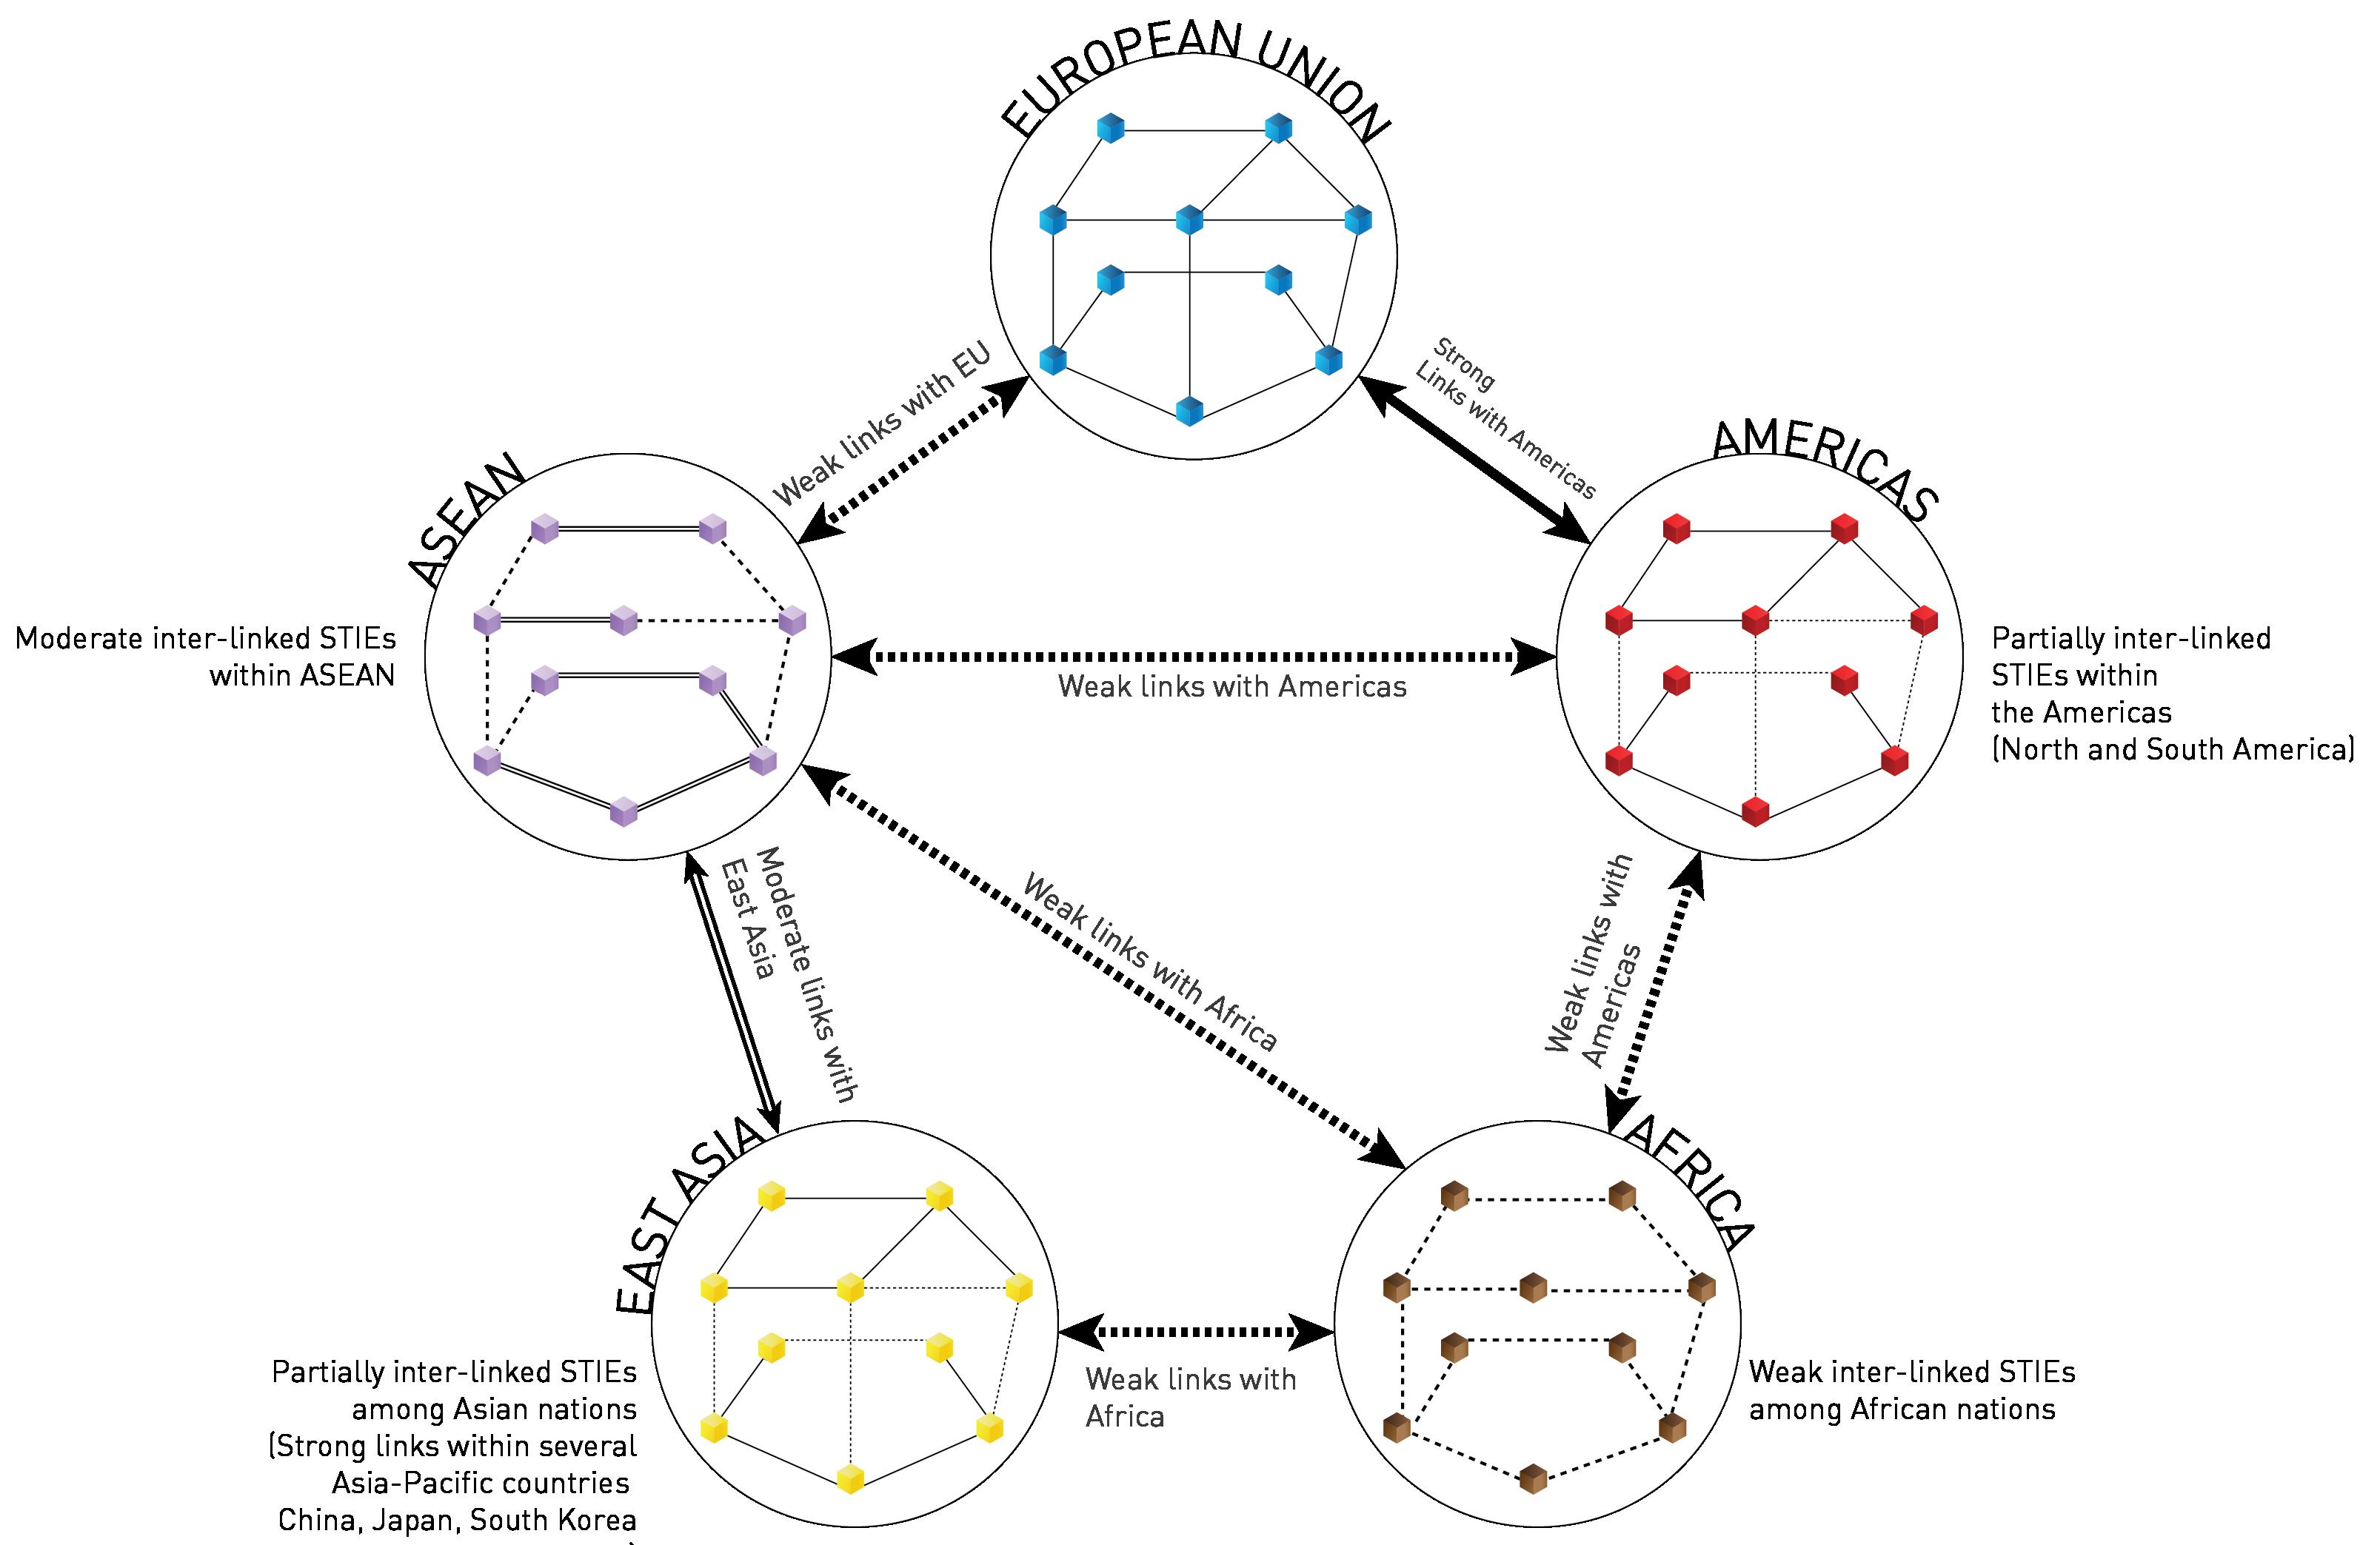
Interlinkages between ASEAN STIEs and their stakeholder must be created and optimised to deliver upon desired goals.
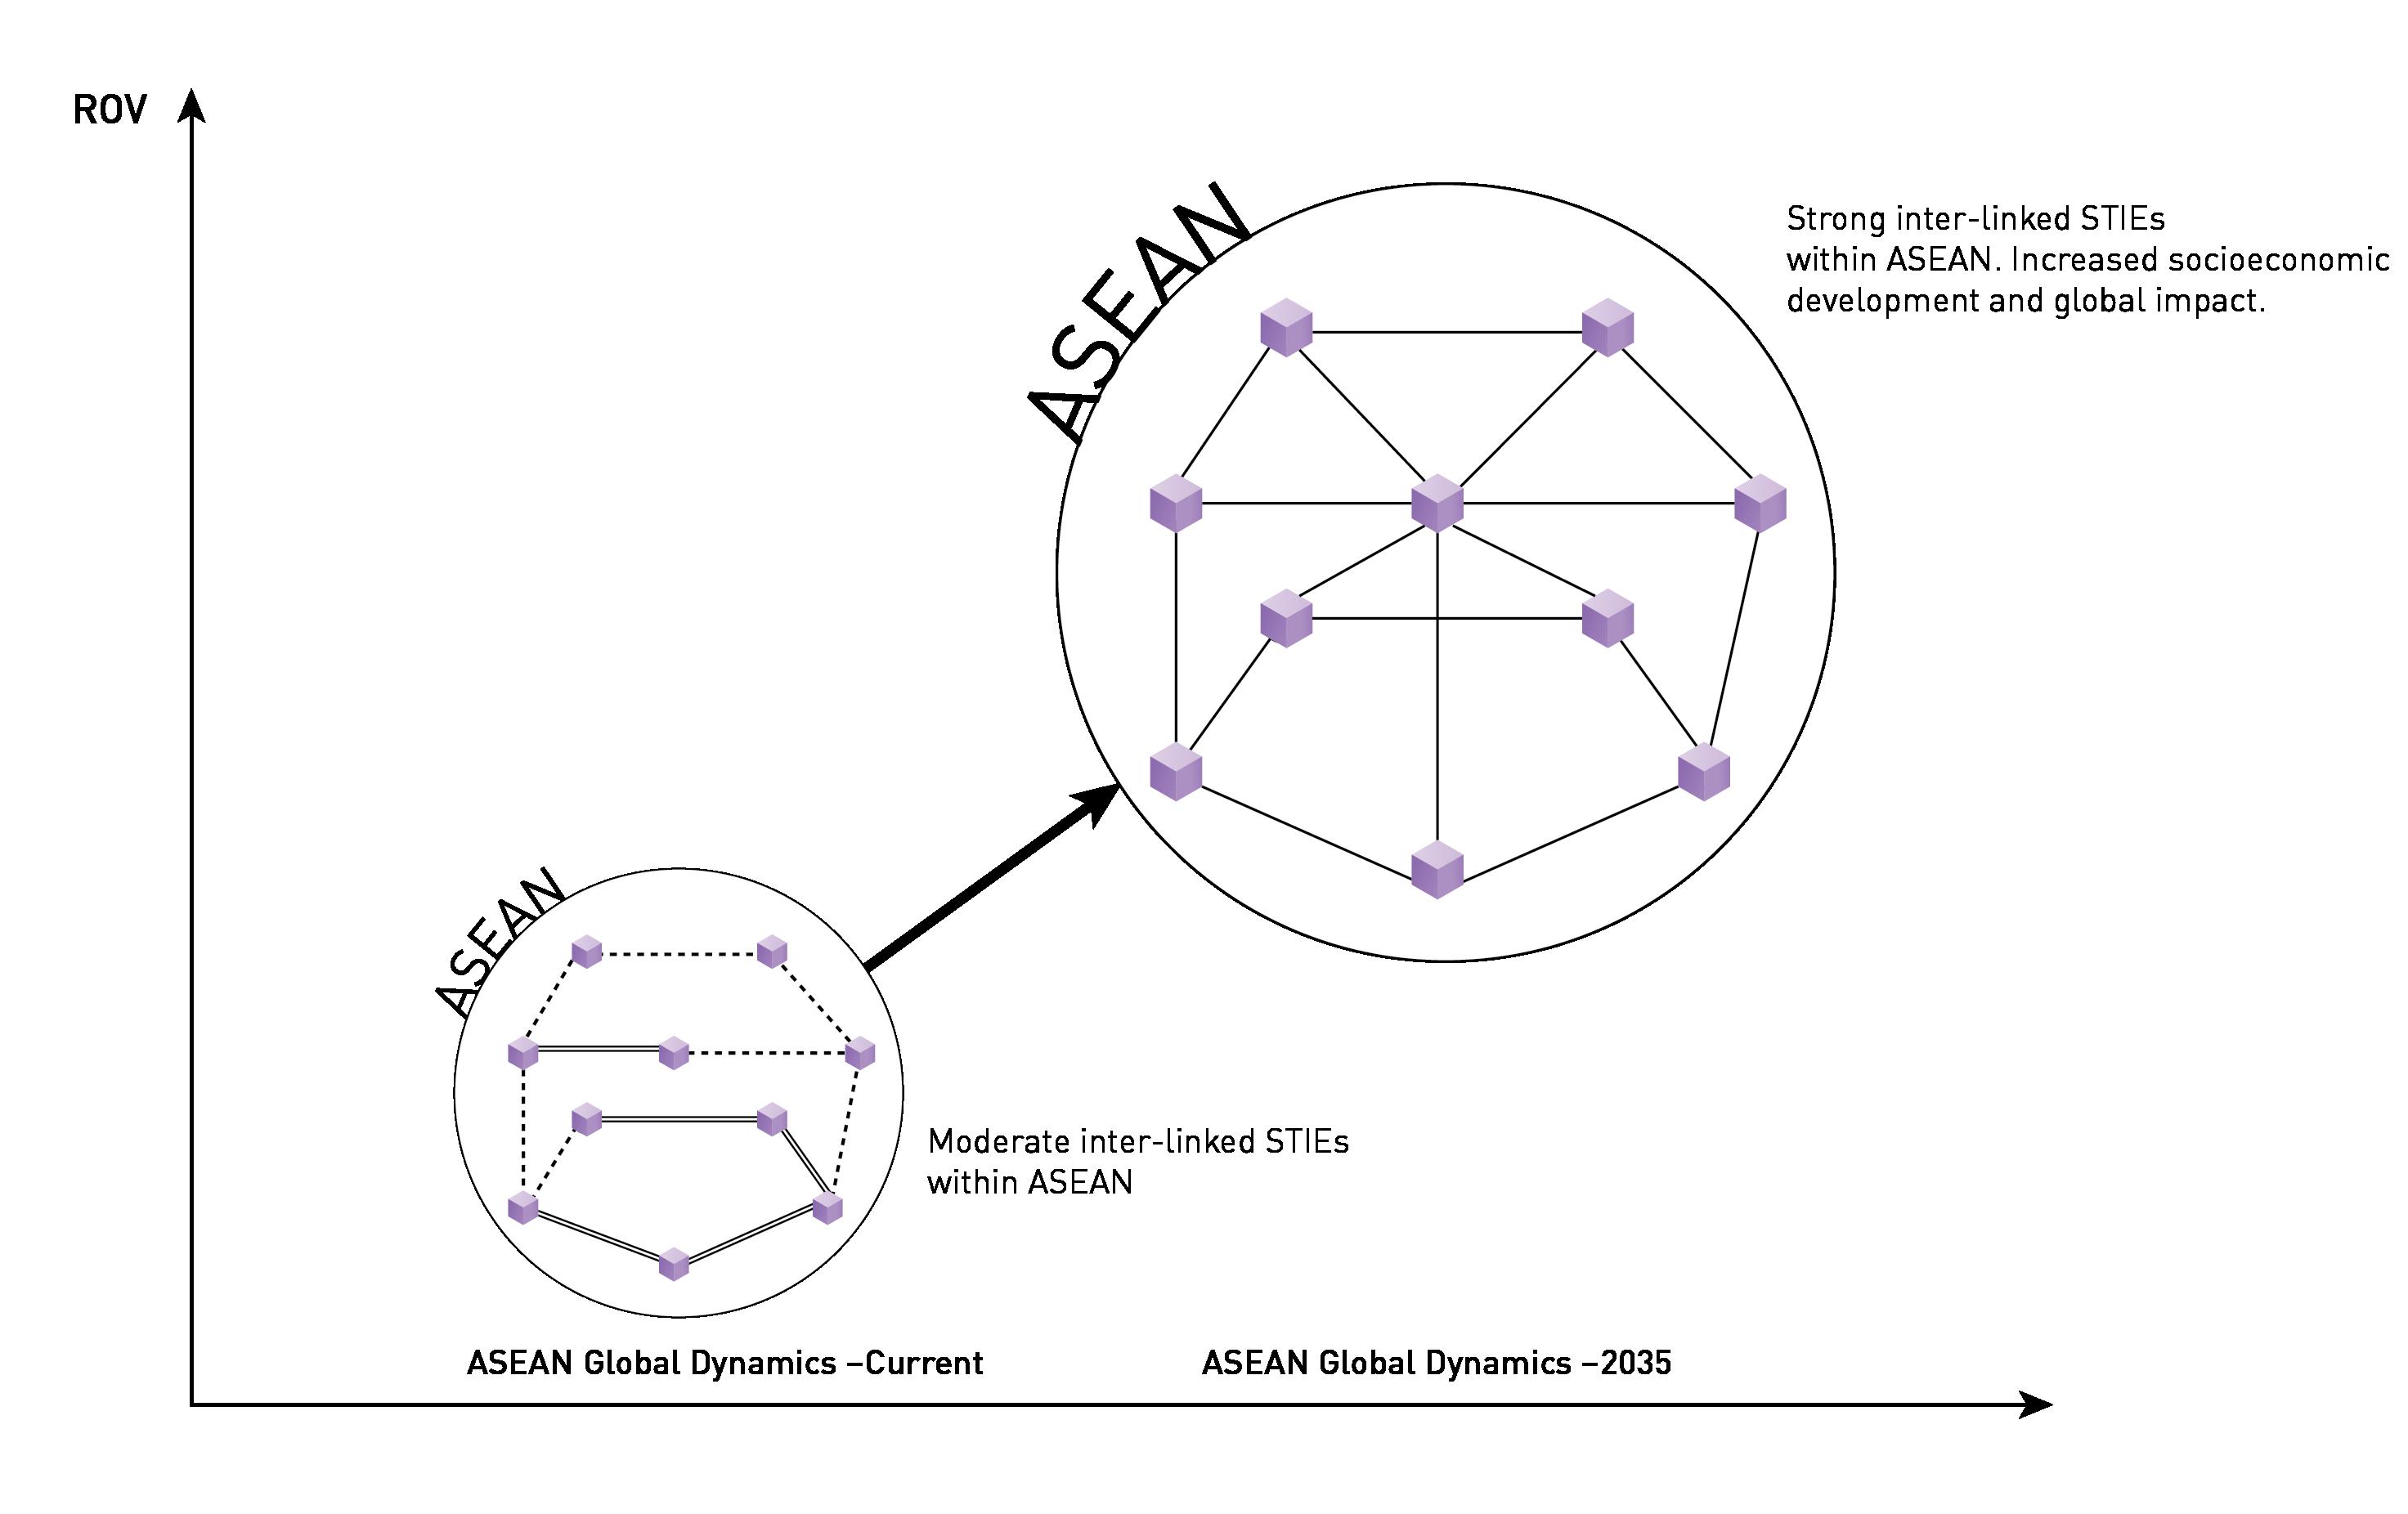
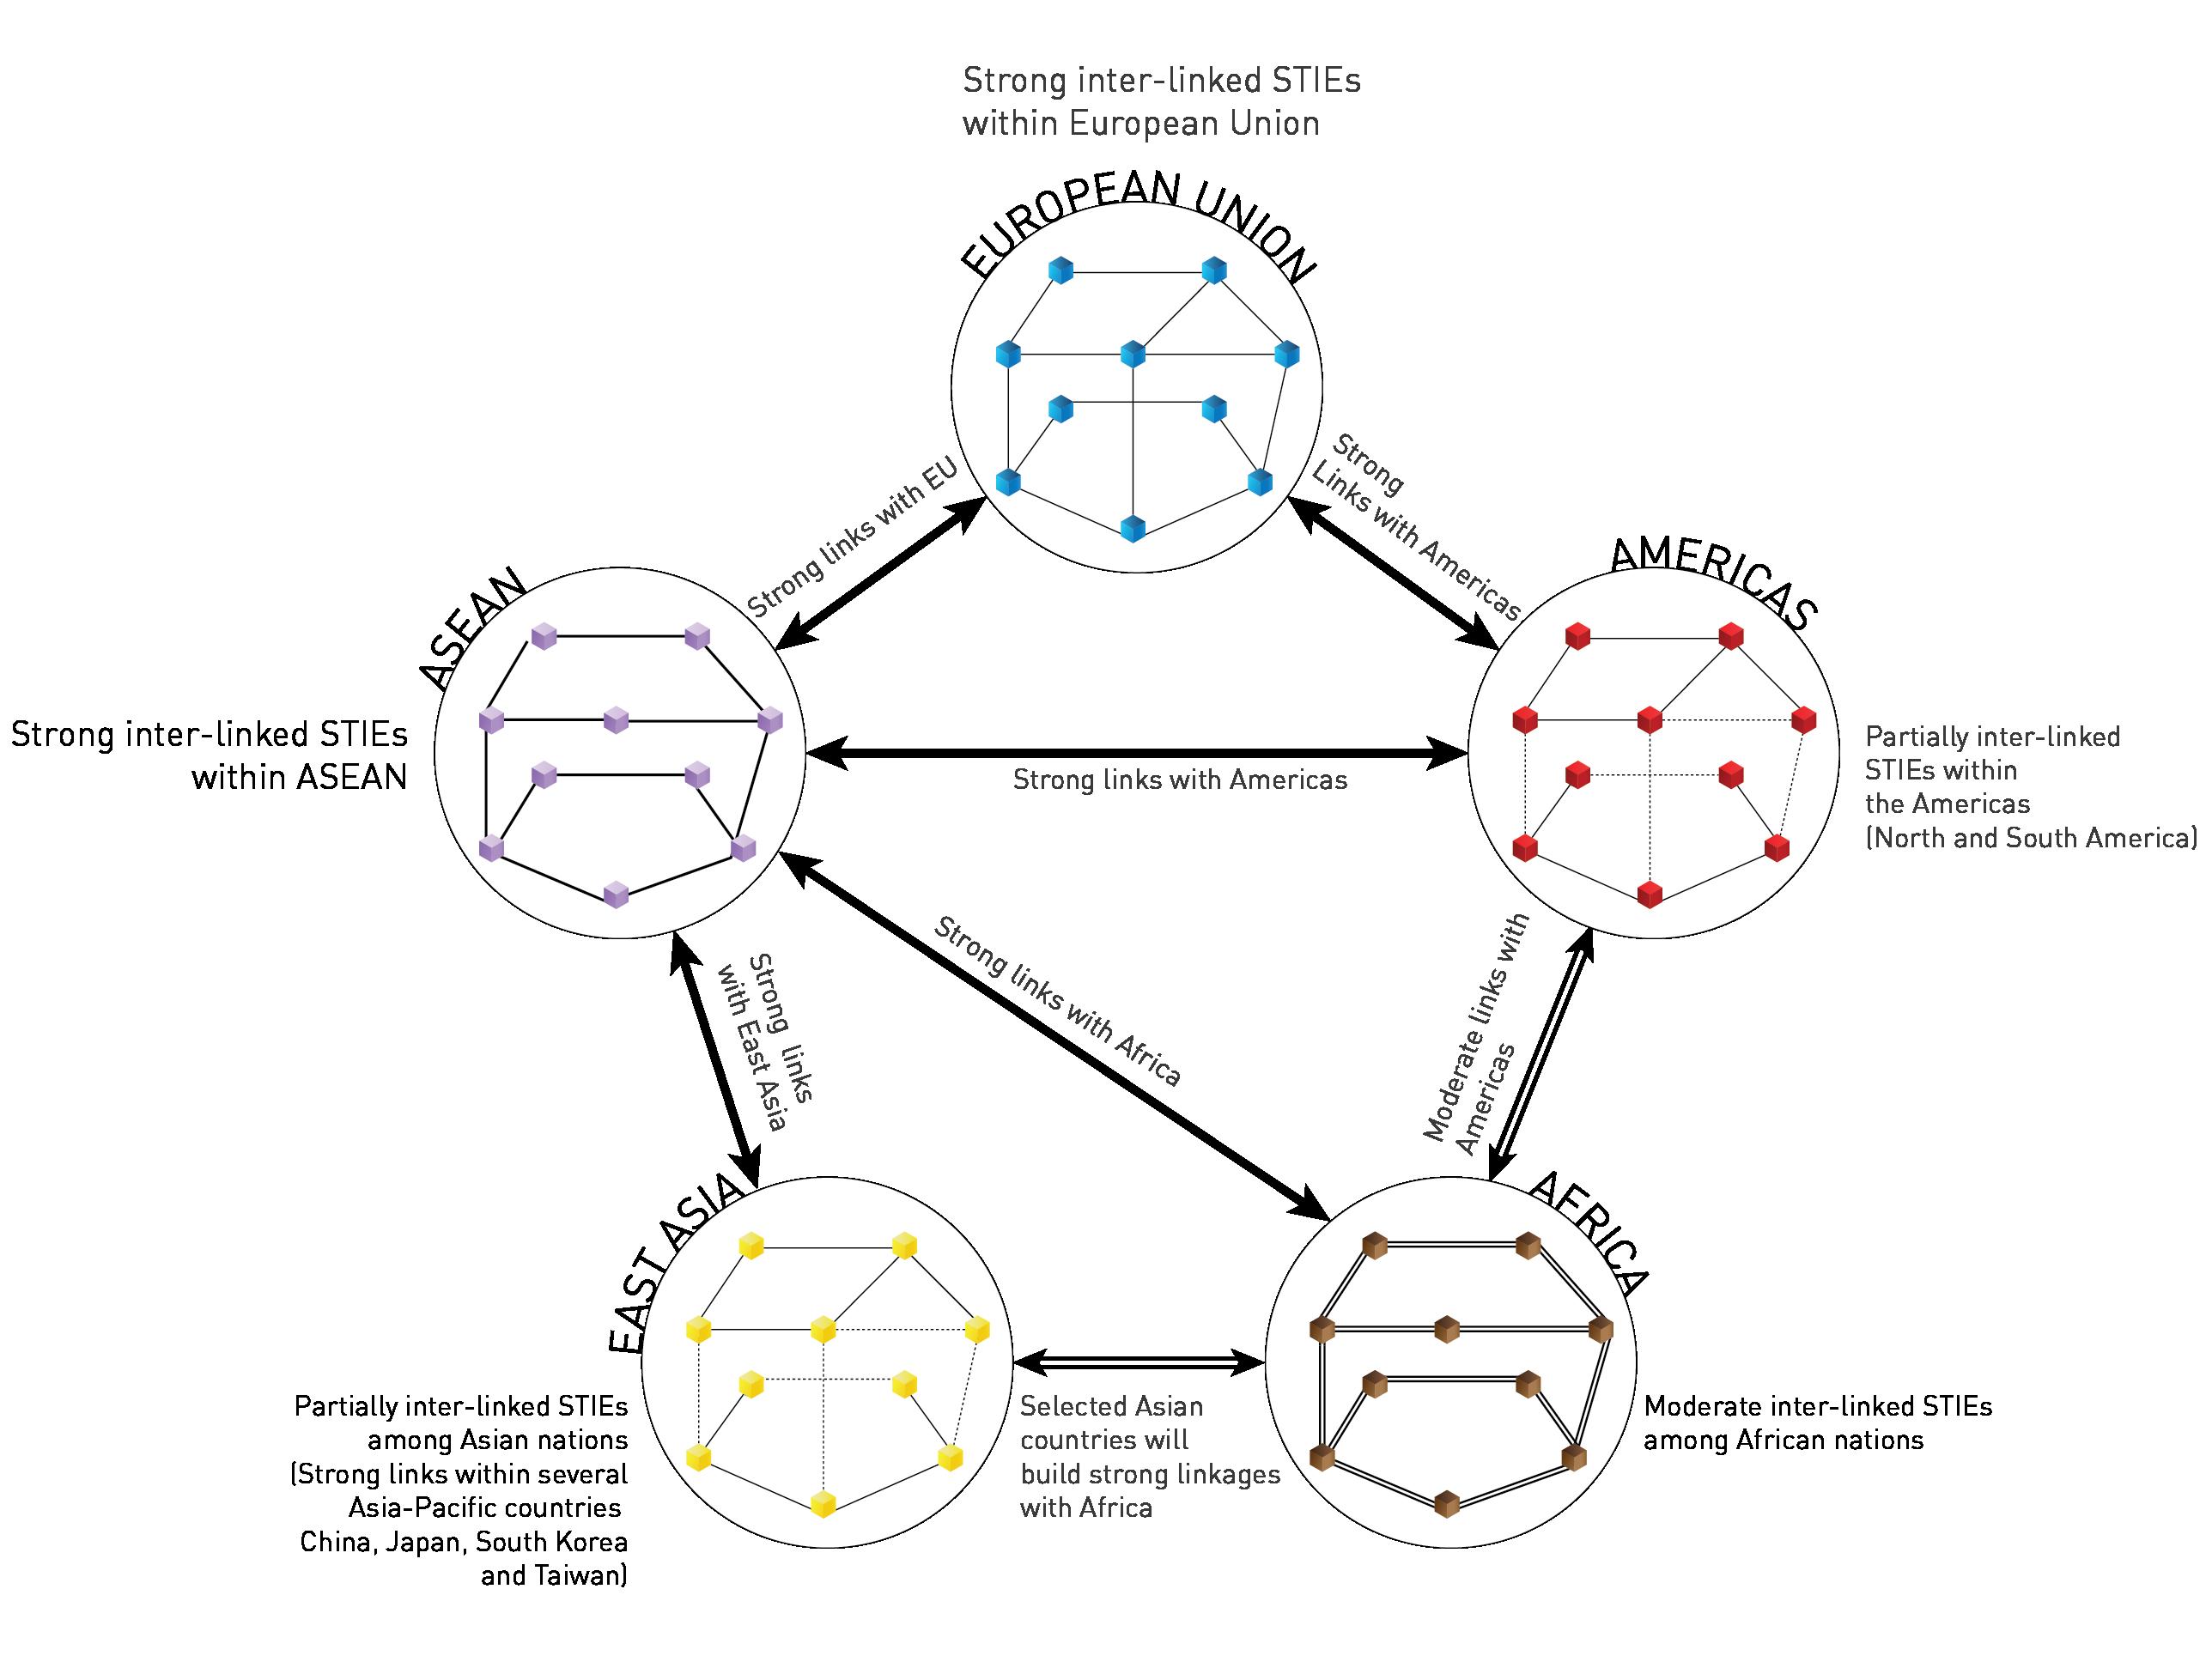
Lastly, all the ecosystem players must be engaged actively , and optimised through strong interlinkages.
The key steps to regional ecosystem resilience are set out below.
1 Identify stakeholders at different stages of ecosystem development.
2 Identify which stakeholder(s) influences/ controls the ecosystem.
3 Determine who (ideally) should influence/ control the ecosystem.
4 Devise how to engage the different stakeholders.
5 Optimise the ecosystem through connection, process control, and alignment.
6 Assess the impact of the ecosystem, by devising and implementing lagging and leading indicators and monitoring them over time.
7 Continuously refine and improve the regional ecosystem.
People’s attitudes, outlooks, and actions are critical in developing and maintaining the Collective Prosperity journey. Making investments in the STIE ecosystem will not results in outcomes without accompanying changes in behaviour. The key to this challenge is the need for the region to adopt a collective and inclusive approach, in which the sharing of knowledge and resources facilitates the process of optimising STIE ecosystems at the regional level. Improving the optimisation and integration of efforts within ASEAN can be facilitated by the 3C key components, which are detailed below.
It is necessary to initiate cooperation and collaboration in which multiple key parties actively resolve the problems the region faces. The issue (or project) must be clearly defined, with the different parties and their roles identified. Furthermore, they need to be empowered with the mandate and given adequate resources to execute the projects.
For sharing to take place between AMSs, there must first be clarity of purpose, which is needed before action can occur. For each party, the benefits of cooperating must be clear to incentivise active engagement, i.e., working together and sharing must make sense to each of the diverse stakeholders across the different AMS.
Cohesion involves the different parties coming together and joining forces to achieve an end goal (collective action). This can only be achieved if each party is actively involved creating and sharing the wealth. If any party is excluded, they are unlikely to invest in the collective regional development agenda.
The next question is: how can these 3Cs be generated within the ASEAN setting? The answer to this lies in the adoption of the following approaches.
Ensuring all AMS engaged requires the chosen problem or initiative to be transboundary in nature. If a problem impacts most of the AMS within the region, and the resolution of the problem brings about benefits for all parties, then it becomes possible to get all AMS on board. For example, adressing haze in the region benefits all AMS. As such, problems or challenges must be specified in a transboundary format, and the benefits for the diverse stakeholders must be identified prior to embarking upon the project.
Adopt a Holistic Systems Approach to Address the Challenges
In supporting the point above, defining the transboundary problem from a holistic lens will likely lead to a more effective resolution and help identify the different types of benefits that may be derived for each of the AMS and the diverse stakeholders. For example, when attempting to address the problems of food security, water security and energy security, it may be tempting to set up the problem within each category since the approach looks to be highly focused. However, this approach misses out on the critical connections between food, energy, and water. It is better to set the problem in the form of a nexus (food-energywater) rather than functionally (1. food, 2. energy, 3. water). The additional gain from the nexus approach is that it facilitates the identification of benefits for a broader range of stakeholders, given its more inclusive and encompassing boundary of the problem and benefits. This approach also enables key stakeholders in the region to capture the benefits from the multiplier effect and network externalities.
Behavioural Approach to the Ecosystem
Fostering an outlook of sharing and working together as a collective rather than individually as nation-states to realise the Collective Prosperity vision of an inclusive, planet-friendly ASEAN requires a change in people’s attitudes and behaviour. Behavioural change is a difficult and slow process, and often requires active engineering. One highly promising approach is to use behavioural economics to build nudges that incentivise action from within the STIE ecosystem. Small nudges are designed and put into the ecosystem environment to provide small positive pushes to elicit the desired action or punish undesirable behaviours. This form of behavioural nudges works well in instances where people and entities can be pushed through the exercise of mandated power to regulate undesirable behaviours. However, since ASEAN as an entity is consensus-based, there is an absence of mandated power to direct and enforce desired actions.
Therefore, in this context, effective nudges require well-designed incentives. To bring about the desired change, it is advisable to structure incentives in a way that withdrawing them strongly influences behaviour. In other words, rather than creating disincentives as punishments, design nudges in such a way that the removal of these incentives acts as a significant reinforcement for positive behaviour.
STAGE 1
Successfully charting the positive trajectory requires understanding future possibilities before they start. Foresight exercises facilitate by exploring possible futures, thinking through the possible pathways to the desired future state, and anticipating potential unexpected events that may disrupt the pathway. Unfortunately, many foresight exercises fail to produce the desired outcomes because they are ad hoc and piecemeal. For ASEAN to benefit from such exercises, foresight must be conducted systematically. A particularly appropriate framework for ASEAN is the Iterative Foresight Cascade model (see Figure 6.2.5).
This three-stage model starts with foresight exercises in which scenarios and alternative pathways are discerned, before moving on to strategic implementation, design and execution, and measurement and control. Stage 2 involves developing out roadmaps and actions based on the learnings arising from Stage 1. Unfortunately, most of the time, roadmaps and action plans are developed without consideration of foresight scenarios. In the absence of Stage 1, Stage 2 action plans tend to have many weak spots due to a poor understanding of future scenario options and associated pathways, and Stage 3 (monitor and control) often tends to be entirely missed out or given little attention. The focus is almost always on Stage 2; a serious mistake since Stage 3 is critical to ensure that initiatives are implemented according to plan.
In addition to the longitudinal stages that emerge over time, the Iterative model highlights a hierarchically nested process in which a downward and upward cascade must be iterated at each stage. For instance, at stage 1, foresight needs to start at the ASEAN regional level, which feeds into national-level foresight for AMS, in turn feeds into industry-level foresight. From the industry foresight, the next step is a cascade upwards to national and ASEAN-level foresight. This downward and upward cycle needs to be iterated at least once, before proceeding to the next stage. The subsequent stages repeat the downward and upward cycles at the ASEAN, national, and sector levels. Each stage has feedback loops involving an assessment and evaluation based on the outcomes being produced. This way, the initiatives can be adjusted to ensure that desired outcomes are forthcoming and investments actually produce tangible outcomes.
Foresighting-Scenarios
STAGE 2
Strategic ImplementationDesign & Execution (roadmaps & action plans, etc.)
For ASEAN to ensure that it can transform itself into a strong, resilient region, it needs to conduct systematic foresighting regularly. This can be done through a simple three-step process, as set out below.
Foresight- at least one iteration of a downwards and upwards Foresight Cascade.
Develop robust action plans/roadmaps and implement them through a process carefully considering insights from the foresight exercises of stage 1.
Ensure the programme(s) derived from action plans and roadmaps of Stage 2 are monitored and controlled to completion. Keep track of its progress.
Store learning and knowledge in a knowledge repository. Make the knowledge repository open and accessible to all.
Several enabling or facilitative elements are needed for the three fundamental actions in the Collective Prosperity transition to work well. The key enabling support components are elaborated below.
A key to the success of the transition to Collective Prosperity is the need for ASEAN to possess a large and significant market size, with which to negotiate better trade terms with other blocs, such as the EU and NAFTA, and secondly, to facilitate ease of movement of products and services. However, the single market does not fully capture the full benefits that can be achieved or are needed for the Collective Prosperity trajectory to materialise. For full benefits to transpire, people’s free and frictionless movement is needed. This will allow talent to move to any location where it is needed. By allowing AMSs to access talent across the region, people mobility allows them to build strong platforms for comparative and competitive advantage. In this way, nurturing and optimising the dynamic capabilities within the regional supply chains. REGIONAL SUPPLY CHAINS
Given the experience of supply chain disruptions following COVID-19 and the Ukraine-Russia war, supply chains have been involved in significant in-shoring. Likewise, ASEAN needs to design and implement regional supply chains, thereby freeing itself from its high dependency on global supply chains. The design of the regional supply chain must be driven by principles of sustainability in which planetary protection and the region’s social well-being are given high priority. For resilient eco-friendly supply chains to emerge, they must possess:
End-to-end Circularity. Circular economy principles must be embedded throughout the supply chain.
End-to-end Integrity (Chain of Custody). The supply chain needs to be transparent and embedded with a governance system that ensures integrity through systematic tracking and monitoring. This can be enabled by emerging tracking technologies.
Optimise the ecosystem at the regional level and continuously nurture and refresh dynamic capabilities within each stage of the value-add chain.
Regional ecosystems can only function if there is common acceptance and adoption of standards, procedures and protocols. Common standards are critical lubricants in facilitating frictionless trade and movement of people and aid the process of governance to take a foothold at the regional level. The adoption of standards at a regional level must also be accompanied by the definition and tracking of metrics of evaluation. Standard yardsticks of assessment are therefore critical in inspiring trust since they provide confidence and assurance in the measurement and assessment system. Trust is a fundamental component of harmonisation.
Enabling the ASEAN system to capitalise on regional competencies and capabilities without duplication or replication of effort and investment necessitates the adoption of a regionally opensource ecosystem architecture. The Open Science approach allows the sharing of STI knowledge and R&D advances across the region and would be driven by regional teams coming together to create advances that could be utilised by the AMSs to develop new revenue streams and economic prosperity for the region. Sharing and collaborative development and commercialisation would allow economies of scale to be reaped, while simultaneously removing duplication in investment and effort. Additionally, the open approach should not be limited to STI. It must be extended to Economy (E) since the E part of STIE is crucial in using scientific advances and turning them into commercial successes that contributes to socio-economic development of the region. This includes a better understanding of behavioural dynamics, which is a foundation for understanding consumers and meeting the needs of diverse communities and segments in the ASEAN region. In other words, sharing best practices in the realm of professional knowledge in the fields of economics, management and even arts is crucial to successfully transforming fundamental knowledge into commercially profitable outcomes.
For ASEAN to function optimally, it needs to appreciate and immerse itself in principles of inclusion at the broad societal level. For the population to prosper and contribute effectively to the development of the region, ASEAN needs people who possess skills and competencies for future sectors that the region will focus on to build competitiveness. This means that the education system must be geared to deliver the regional agenda. The educational system must be designed to provide inclusive access, especially to vulnerable communities that can easily get locked into vicious cycles of poverty. Furthermore, education without access to employment opportunities is another stumbling block. Firstly, jobs must exist for those who have the relevant skills and competencies. Otherwise, the skills become meaningless and, over time, become obsolete since they are not being used and updated. Secondly, employment opportunities must be opened up to all members of the ASEAN community, irrespective of origin, race, religion and gender. Lastly, people are most productive if they are healthy. Health systems within ASEAN need to be able to provide healthcare for all segments of society, and the most financially efficient way to do this would be to move away from curing disease to preventing disease. In this context, intensifying community engagement and public awareness (CEPA) campaigns is critical in promoting healthy lifestyle choices. This is important in addressing the explosion of noncommunicable diseases in the region.
ASEAN’s well-functioning STI depends on its capacity to come together as a region to address global challenges and create value for all stakeholders in the region. The region and its people need to possess a belief system that acts as a “regional glue” to prosper. A key aspect of ASEAN towards a Collective Prosperity future is built upon paradigmatic transitions. For instance, as highlighted earlier, one shift is to move from the economics of ROI to the economics of ROV. This is a major shift moving from short-term solutions to long-term optimisation. The paradigm shift comes into being only if there is an associated sociocultural shift within the region. The region needs to develop and unite around a meaningful identity and shared purpose. This involves defining core values around which ASEAN takes meaning. Socioculturally, ASEAN is well-placed to embody values of caring and empathy, and harmony and unity.
For ASEAN to progress, a systematic approach must be adopted to track its initiatives and progress along the desired trajectory. This can be done by strengthening existing organisational systems and setting up an ASEAN observatory responsible for tracking and monitoring progress. The observatory would define key evaluation metrics, and measure and monitor them over time. This would particularly be the case for transboundary projects that involved multiple parties, such as PPPs participating across ASEAN, allowing for systematic tracking and monitoring of PPP and evidence-based decision-making. The observatory would also be a repository of information that could be openly accessed by all parties so that project successes or failures could be transparently evaluated. This would enable it to become a platform for learning lessons to prepare for the future. The repository would hold primary data but also make available in one place other globally collected data to facilitate analysis and learning and define best practices.
For sustainable development of the Collective Prosperity trajectory, AMS must realise that investing in building a focused set of skills and competencies appropriate for the ecosystems in which they hope to excel is imperative. This requires industry players to understand the future direction of their industry and the skill sets needed in the future. Clearly, with the pace of change currently taking place, ASEAN must invest significantly in workforce upskilling to remain competitive. This is about building dynamic capability within the people of the region. The business sector would have to make a shift towards process excellence through people excellence since retaining intellectual assets would be key in the emerging global competition. Process excellence demands investment to build dynamic capabilities of firms so that they can engage with the high-value end of supply chains. In addition to this, it would be necessary to build dynamic capabilities within regional networks and ecosystems of ASEAN. This embodies purposeful and intentional learning to move through the different industry and regional development stages for global competitiveness and to become the ASEAN Global Powerhouse envisioned in the Collective Prosperity scenario. This suggests that dynamic capabilities at three different levels need to be created and connected: individual, firm, and network (regional bloc) dynamic capabilities. Ultimately, the nurturance, connection and alignment of these three forms of dynamic capabilities are crucial for ASEAN to be resilient and successful in the future.

Conclusion
This chapter concludes the charting of ASEAN’s road to Collective Prosperity however, as clear as this road is, the proverbial ‘bumps’ are more akin to giant boulders that take the form of the oncoming polycrisis. The key messages resonate and reverberate: complacency is the enemy, collective action is paramount, and shaping our regional destiny is non-negotiable on the road to Collective Prosperity. ASEAN must take control of its STIE ecosystem, implement urgent measures to avert irreversible harm to its environment, and transform from “Tech-takers” to true “Tech-makers” for lasting sustainability.
Collective Prosperity is fuelled by STIE-enabled regional resilience and a values-driven ethos, fostering collective prosperity through cooperation, coherence, and cohesion in the face of transboundary challenges. Cooperation emphasises the collaborative efforts among member states, coherence underscores the need for a consistent and harmonised approach in policies and actions, and cohesion highlights the unity, solidarity, and values-based identity binding the region together. The unwavering commitment of the ASEAN member states towards achieving Collective Prosperity will show the world that ASEAN is not just a regional force to be reckoned with, but is a shining example of collective progress, peace, and prosperity for all.
1:
Blue Carbon Conservation through Restoration of Mangrove Swamps Indonesia
More than 40% of the world’s mangrove forests are located in the ASEAN region. These ecosystems act as natural barriers against strong winds and waves, store ten times more carbon than terrestrial environments, and play a vital role in reducing siltation and erosion, directly benefitting coastal communities. Additionally, mangroves offer cultural and aesthetic services, contributing to tourism, education, and the preservation of cultural knowledge in the region. However, these important ecosystems are under significant threat. Reports indicate that around 33% of mangrove forests in the region have been lost mainly due to deforestation driven by climate change, aquaculture, agriculture, erosion, siltation, and coastal development (Japan-ASEAN Cooperation, 2023; Liza Goldberg et al., 2020). Therefore, urgent actions are needed to preserve and restore mangrove swamps.
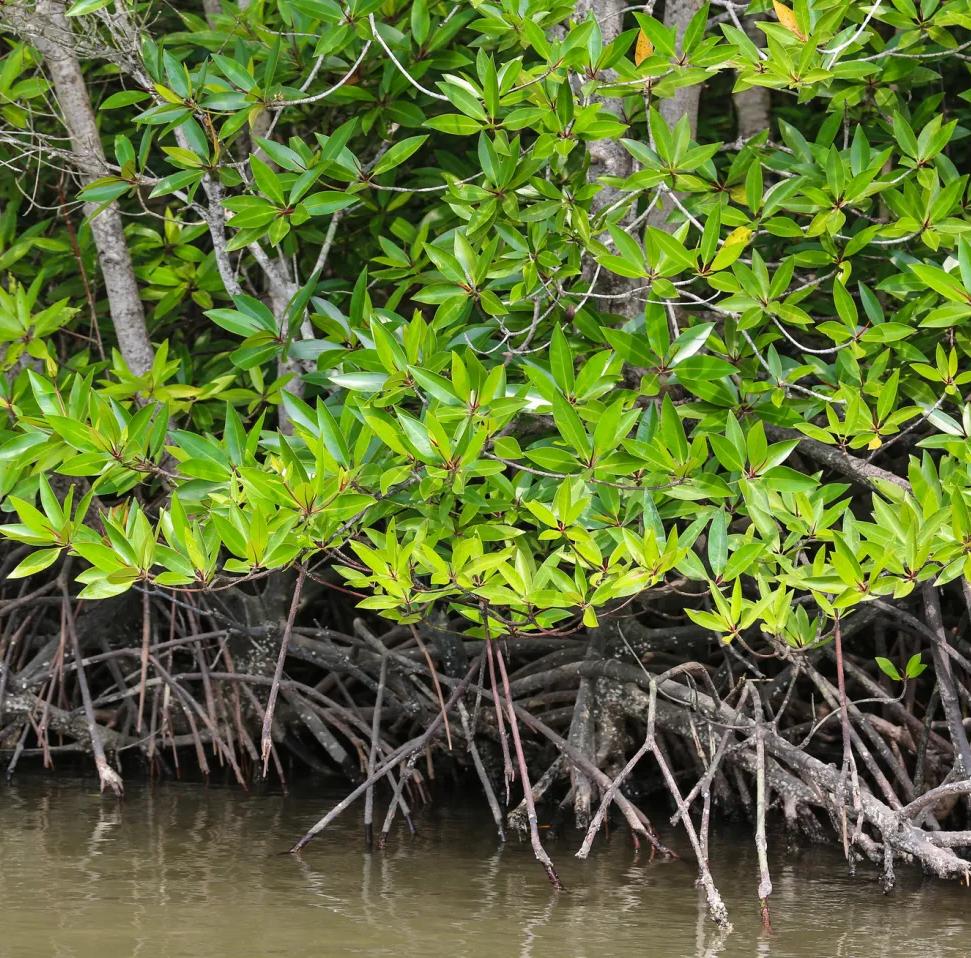
Recognising the critical state of mangroves, several ASEAN nations have initiated ambitious restoration projects.
In 2021, Indonesia launched one of the world’s largest mangrove restoration projects, with a target of restoring 150,000 hectares annually across nine provinces by 2024 (Platts & Leong, 2022). Practices involved in mangrove restoration in Demak and Pasarbanggi, districts on Java Island are detailed below:
1. Demak is where shrimp-rearing ponds have been built that can co-habit with mangroves and enhance their long-term sustainability. As a result, the number of shrimps raised have tripled and, in the process, improved the level of resilience to climate change (Nations, 2022).
2. Restored mangroves in Pasarbanggi is the result of more than 30 years of restoration, and they currently have higher carbon sequestration than other restored mangroves in Indonesia. Restoring the mangrove ecosystem may be a more effective way to increase carbon stores and diversity of trees than conservation of mangrove swamps (Soeprobowati et al. 2024) (See Appendix 1.1.1).
The Philippines
The active involvement of local communities is crucial for successful mangrove restoration in the Philippines. Legalising local communities’ rights to manage the mangrove and use its resources has proven instrumental in fostering sustainable practices and fostering a sense of ownership (Camacho et al., 2020). The Coastal Environment Program (CEP) was established in 1990 by the Department of Environment and Natural Resources and the Local Government in the Bicol region, with the goal of training the community on ways to protect natural forests and restore depleted mangroves.
The CEP’s 2019 assessment of the mangrove ecosystem highlights its favourable condition, attributing it to high regeneration capacity and effective management (Diaz, 2023). Additionally, to enhance the resilience of coastal barangays against hazards, a collaborative effort involving the Department of Environment and Natural Resources, the Bataan community, and SM Prime Holdings implemented a nature-based disaster risk reduction strategy. In Bataan, 100 mangroves were planted as part of this initiative (Department of Environment and Natural Resources, 2023). As a property developer with a focus on sustainable infrastructures, SM Prime Holdings, through its corporate social responsibility initiatives, provided the necessary funds for mangrove planting events across municipalities, including Balanga City.
References
1. Camacho, L. D., Gevaña, D. T., Sabino, L. L., Ruzol, C. D., Garcia, J. E., Camacho, A. C. D., … Takeuchi, K. (2020). Sustainable mangrove rehabilitation: Lessons and insights from community-based management in the Philippines and Myanmar. APN Science Bulletin, 10(1), 18–25. doi:10.30852/sb.2020.983
2. Department of Environment and Natural Resources. (2023). MANGROVES PLANTED IN SM-ADOPTED SITE IN BATAAN. Retrieved from https://r3.denr.gov.ph/index.php/news-events/photo-releases/1471-mangrovesplanted-in-sm-adopted-site-in-bataan
3. Diaz, P. (2023). Philippine town rescues mangrove forest decimated by logging , blast fishing. Retrieved from https://www.eco-business.com/news/philippine-town-rescues-mangrove-forest-decimated-by-loggingblast-fishing/
4. Japan-ASEAN Cooperation. (2023). Mangrove Ecosystem Management in ASEAN Region. Retrieved from https://jaif.asean.org/project-brief/mangrove-ecosystem-management-in-asean-region/#:~:text
5. Liza Goldberg, Lagomasino, D., Thomas, N., & Fatoyinbo, T. (2020). Global Change Biology - 2020 - Goldberg - Global declines in human-driven mangrove loss. Global Change Biology.
6. Nations, U. (2022). UN Recognizes Indonesian Effort to Restore Mangrove Forests with Special Award. Retrieved from https://indonesia.un.org/en/212655-un-recognizes-indonesian-effort-restore-mangroveforests-special-award
7. Soeprobowati, T. R., Sularto, R. B., Hadiyanto, H., Puryono, S., Rahim, A., Jumari, J., & Gell, P. (2024). The carbon stock potential of the restored mangrove ecosystem of Pasarbanggi, Rembang, Central Java. Marine Environmental Research, 193(5), 106257. doi:10.1016/j.marenvres.2023.106257
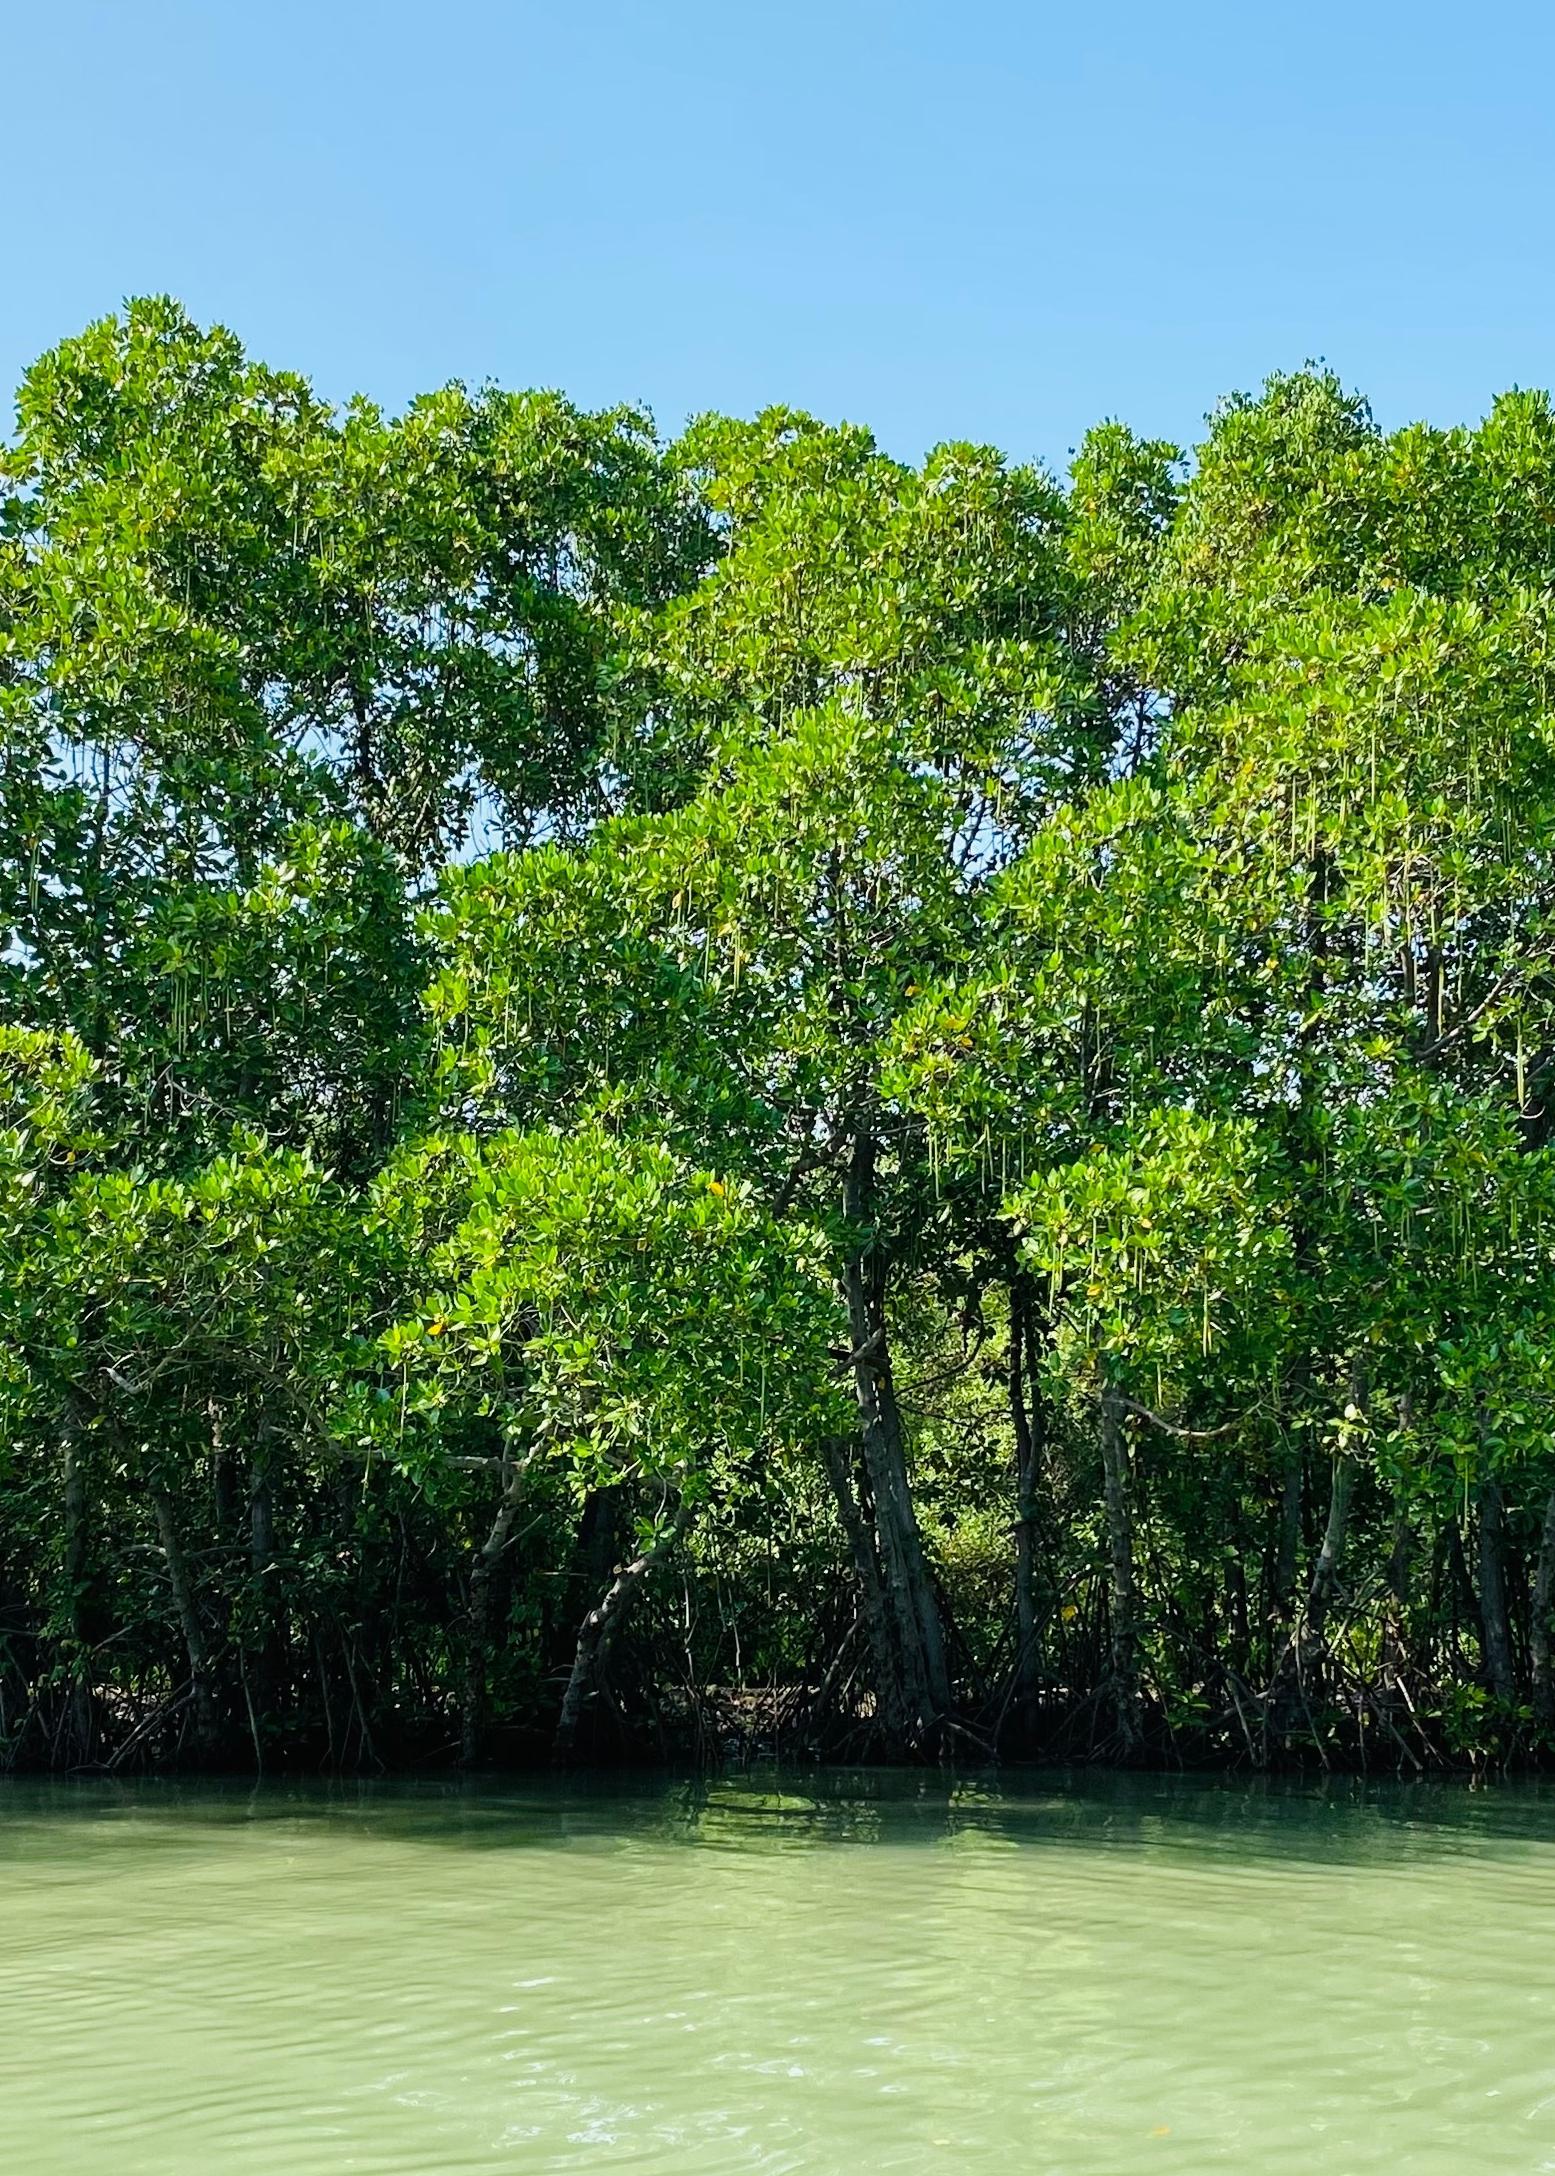
Appendix 2:
Trees are living bio-machines, employing sophisticated biological and physical processes to quietly power our planet’s health. Trees engage in multiple essential functions. Through the miraculous process of photosynthesis, they harness sunlight, carbon dioxide, and water to create oxygen, the very air we breathe (Food and Agriculture Organization of the United Nations, 2020). A mature tree can produce enough oxygen for 10 people annually, acting as tiny personal air purifiers that dot our landscapes (World Wildlife Fund, 2023). Additionally, trees serve as natural climate control specialists. Their extensive root systems hold soil together, preventing erosion and regulating water flow (Griscom et al., 2017). Their leaves transpire moisture, cooling the air and contributing to cloud formation. In urban areas, they combat the “heat island effect”, lowering temperatures by providing shade and promoting air circulation (Food and Agriculture Organization of the United Nations, 2020). Furthermore, trees are biodiversity hubs, offering vital habitat for countless species.
In today’s tech-driven world, innovative methods are being employed to preserve these environmental treasures. Advanced satellite technology is used to monitor deforestation in real-time (Achard et al., 2010). Drones equipped with high-resolution cameras are deployed to survey and map forests, providing crucial data for assessing tree health, tracking illegal logging activities, and guiding conservation efforts (Benning & Rohland, 2013). Drones can also be used to plant seeds in remote areas, inaccessible by traditional means. Additionally, scientists are developing techniques for cultivating trees better suited to specific environments, including research on seed selection, optimal planting methods, and genetic engineering to create trees resistant to disease and climate change.
The importance of planting and protecting trees cannot be overstated. Every tree holds the potential to clean our air, combat climate change, and safeguard biodiversity. We all share the responsibility to contribute to this vital effort (Griscom et al., 2017). This includes planting trees in our communities and backyards, supporting organisations dedicated to tree planting and conservation, making informed choices about the products we buy by choosing sustainable and ethically sourced wood, and raising awareness about the importance of trees and encouraging others to take action.
Singapore as a small city-state, grappling with limited land resources, has faced a continuous struggle between urban expansion and environmental conservation. Over the last century, the increasing in population and rapid urbanisation led to further tree removal for land reclamation and the construction of reservoirs to ensure water security. However, in April 2020, Singapore is globally recognised for its innovation and urban development called the One Million Trees Movement led by Singapore’s National Parks Board (NParks), signalling
a determined leap toward sustainability. This forward-looking endeavour underscores the city-state’s dedication to enriching green spaces, nurturing biodiversity, and addressing pressing environmental concerns (National Parks Board, 2020). Within only three years, the initiative had introduced and planted over 540,000 trees. NParks estimates completion by 2027, three years ahead of the targeted 2030 timeline (Turrel, 2020).
The One Million Trees Movement, as outlined by Lee and Tan (2021), seeks to strategically plant a variety of tree species in parks, streets, and public spaces, embodying a comprehensive vision for Singapore’s transformation into a City in Nature. Notably, the initiative has made progress along streetscapes on Jurong Island and within various Singapore nature reserves, gardens, and parks, including Sungei Buloh Wetland Reserve, Jurong Lake Gardens, Pulau Ubin, Pasir Ris Park, and Telok Blangah Hill Park. Additionally, businesses and corporations can actively participate in this endeavour through the Plant-A-Tree programme, facilitated by the Garden City Fund, a charitable organisation established by NParks as part of the Singapore Green Plan (2021). Other than that, Singapore government aims to use urban greening to counter the “heat island” effect caused by pavement and tall buildings, which absorb and emit solar radiation, elevating temperatures in Singapore’s urban core. Studies reveal temperature disparities up to 7°C (12.6°F) between the city centre and less developed areas (SG101, 2023). The One Million Trees Movement in Singapore represents a concerted effort to integrate nature seamlessly into the urban landscape. In celebration of the 50th World Environment Day, the ASEAN Centre for Biodiversity (ACB) recognised the One Million Trees Movement in Singapore as one of the outstanding winners of the first-ever ASEAN Green Initiative (AGI) for its remarkable greening and reforestation programme (ACB, 2023).
Beyond its environmental impact, it symbolises a city’s dedication to creating a sustainable, resilient, and liveable environment for its people.
Age Well Every Day, 2022. Retrieved from https://agewelleveryday. org/2022/02/23/we-contributed-tothe-one-million-trees-movement/
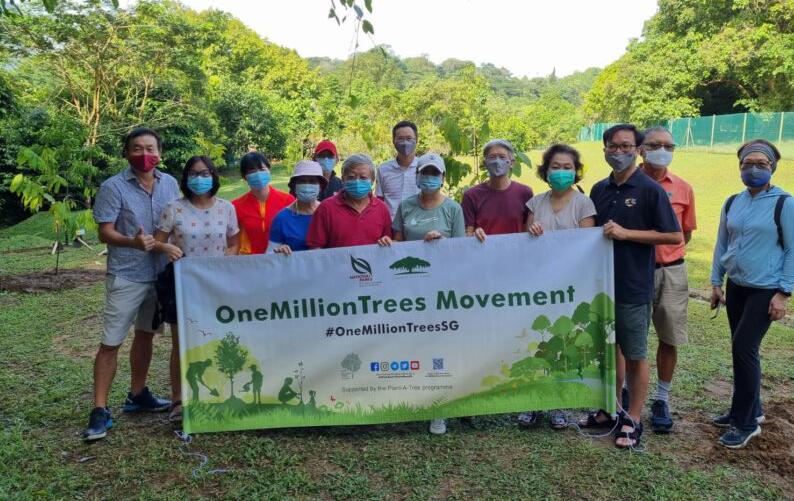
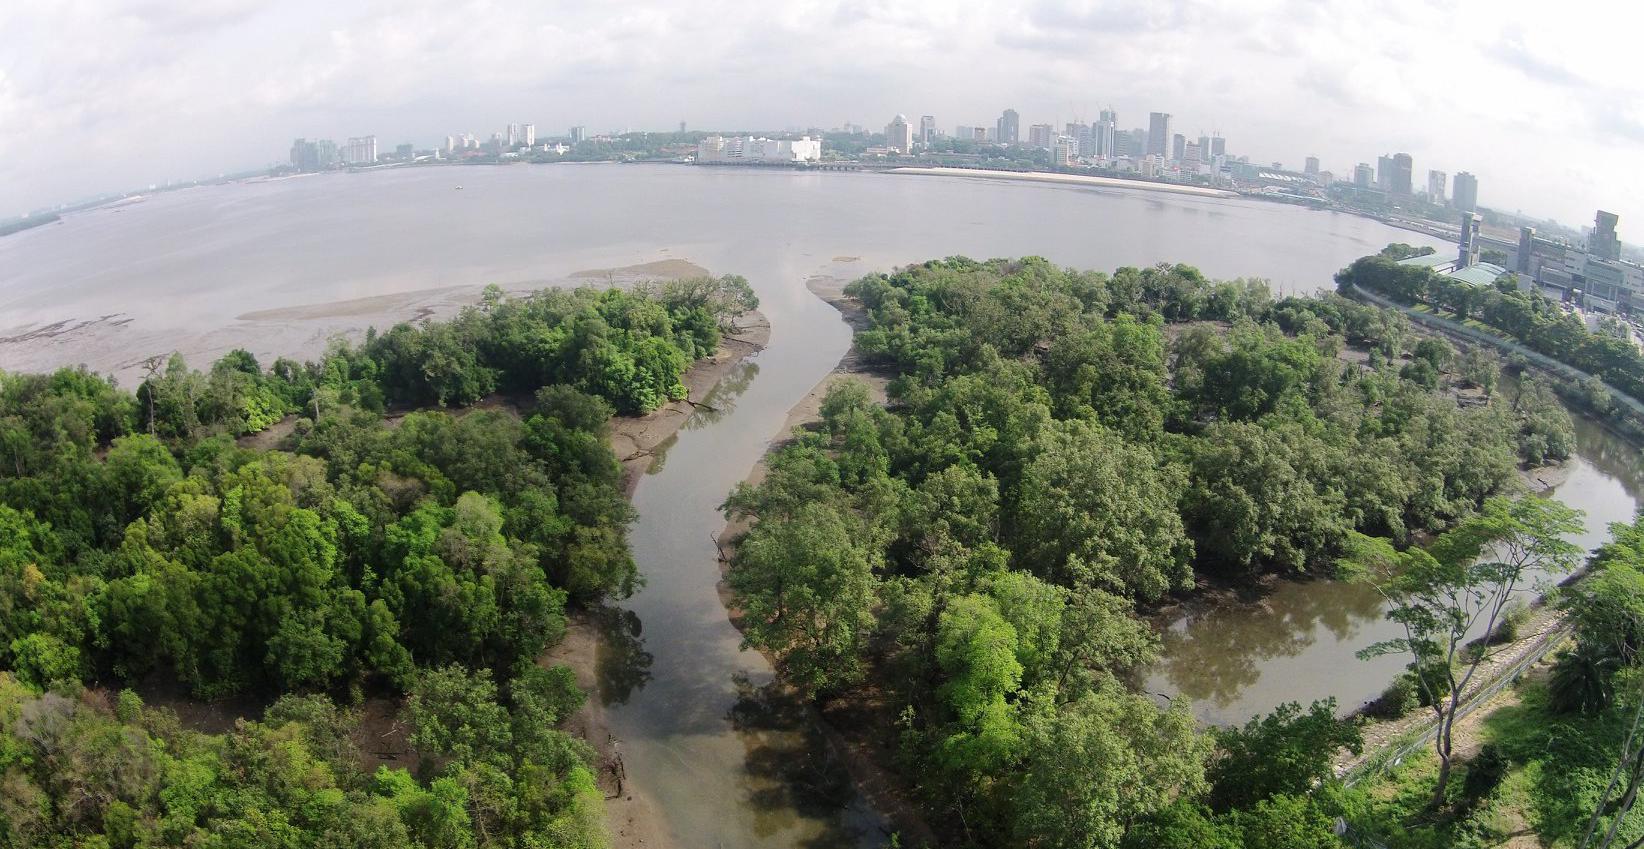
and Put a Park 10 Minutes From Every Citizen (goodnews-
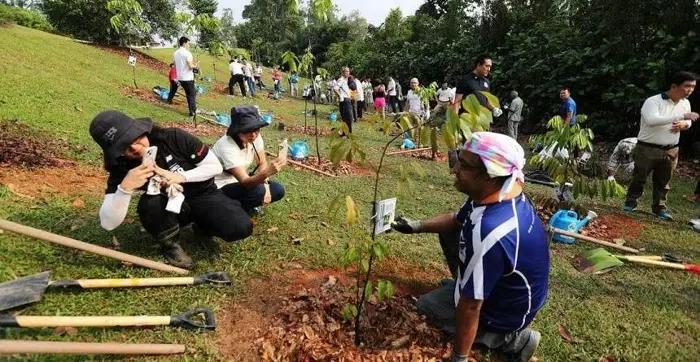
Since the initiation of the OneMillion Trees Movement in April 2020, approximately 540,000 trees have been planted throughout Singapore.
Singapore to hit target of planting one million trees in 2027, three years ahead of schedule | The Star
References
1. National Parks Board. (2020). One Million Trees Movement Progress Report [Brochure/PDF].
2. Singapore Ministry of Sustainability and the Environment. (2021). Singapore Green Plan 2030. Retrieved from https://www.greenplan.gov.sg/
3. Lee, S., & Tan, K. (2021). Urban Biodiversity Conservation: Case Study of Singapore’s One Million Trees Movement. Journal of Urban Ecology.
4. The Straits Times. (2023, April). “Singapore’s Ambitious One Million Trees Movement Reaches Halfway Mark.” Retrieved from Singapore to hit target of planting one million more trees in 2027, three years ahead of schedule | The Straits Times
5. WWF Singapore. (2020). Greening Our Cities: Role of Community Engagement in Singapore’s One Million Trees Movement [Report].
6. Singapore Embarks on a Million Tree Planting Spree to Protect its Future, Mongabay. (Turrel, 2020) Retrieved from: https://news.mongabay.com/2020/10/singapore-embarks-on-a-million-tree-planting-spree-toprotect-its-future/
7. Achard, D., Beuchot, V., Detrés, J., Soulié-Motte, J., Stephenson, J., & Mayaux, P. (2010). Monitoring deforestation and forest degradation in tropical forests using Earth observation systems. Philosophical Transactions of the Royal Society of London. Series A, Mathematical and Physical Sciences, 368(1909), 35713584.
8. Benning, T. L., & Rohland, E. (2013). Tree genomics, diversity, and next-generation sequencing: Moving beyond model organisms. Current Biology, 23(24), R1080-R1086.
9. Food and Agriculture Organization of the United Nations. (2020, November 19). Forests and climate change.
10. Griscom, N. E., Alagna, P., Balk, P., Boyd, E., Brown, N., Brown, C., ... Worthington, R. J. (2017). Natural climate solutions for the Paris Agreement. Proceedings of the National Academy of Sciences, 114(44), 1164511650. https://www.pnas.org/doi/full/10.1073/pnas.1710465114
11. World Wildlife Fund. (n.d.). Importance of forests. https://wwf.panda.org/discover/our_focus/forests_ practice/importance_forests/
12. SG101. (2023, September) The OneMillionTrees Movement. Retrieved from The OneMillionTrees Movement #TIL (sg101.gov.sg)
Appendix 3:
Seagrass, often overlooked as ordinary underwater flora, plays a crucial role as a silent hero in our oceans. Seagrass meadows, spanning over 600,000 square kilometres globally, face threats from climate change, pollution, coastal development, and invasive species (IUCN, 2020). Globally, there are over 60 species of seagrass that significantly contribute to the health and stability of coastal ecosystems. However, this underwater paradise faces growing threats from human activity and environmental degradation. Restoration efforts are crucial to counter these challenges, benefiting coastal ecosystems and communities. Initiatives involve reintroducing lost seagrass species, compensating habitat loss due to development, and mitigating storm-related mortality caused by extreme weather events (Seagrass Watch, 2021).
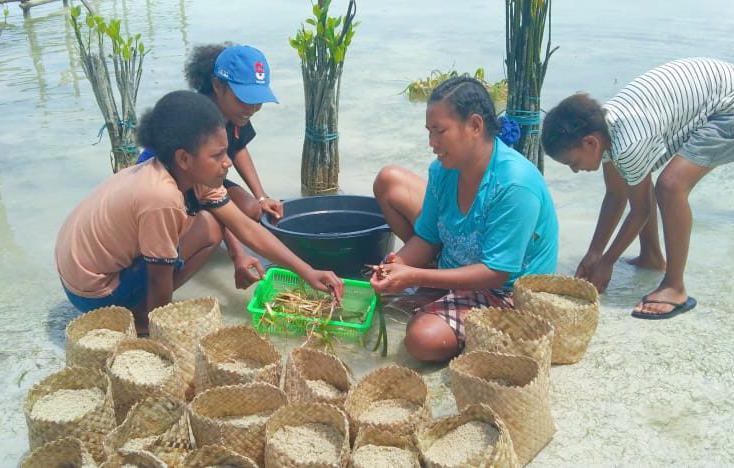
In the ASEAN context, Indonesia emerges as a crucial hub for seagrass conservation, once boasting one of the world’s largest concentrations of seagrass. However, since 2017, the country has experienced a significant decline in seagrass cover, prompting various local and national conservation efforts. Notably, Raja Ampat in Indonesia, renowned for its vibrant marine life, has initiated a noteworthy seagrass restoration project. Commencing in March 2021, local initiatives spearheaded by Linani Arifin and Almira Nadia Kusuma from the Bogor Institute of Agriculture (IPB) have proactively taken steps to restore seagrass meadows. Supported by the Indonesia Climate Change Trust Fund (ICCTF) and the World Bank, these initiatives engage local teenagers in transplanting seagrass seedlings, replanting mangroves, and restoring corals. Linani, instrumental in recruiting 19 girls and 2 boys from the local community, emphasises the importance of marine conservation education to inspire future careers. The group, conducting weekly seagrass seedling planting during low tide and bi-weekly growth measurements regardless of the tide, has successfully covered 1,250 square meters (13,450 square feet) with seagrass near the beach (Tan, 2020).
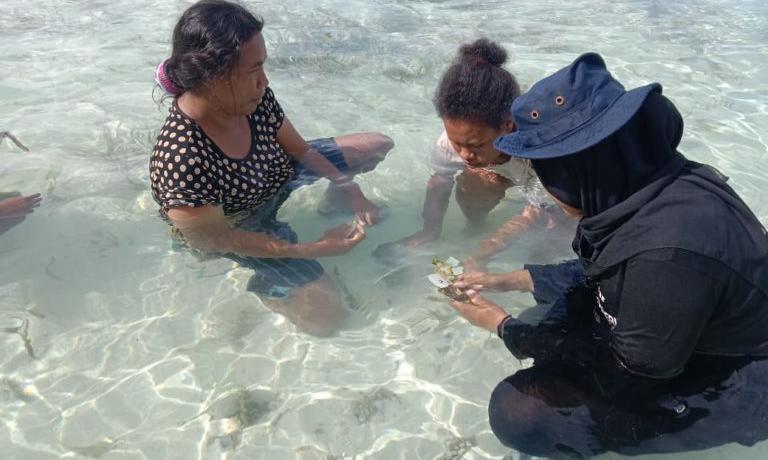
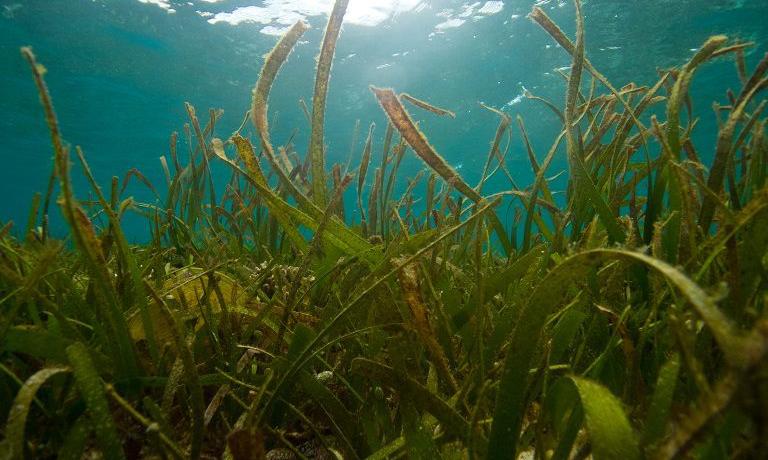
Baskets crafted from woven pandan palm fronds to plant the seagrass seedlings, aiming to reduce expenses and minimise marine waste.
A seagrass restoration project to preserve the past may also protect the future,
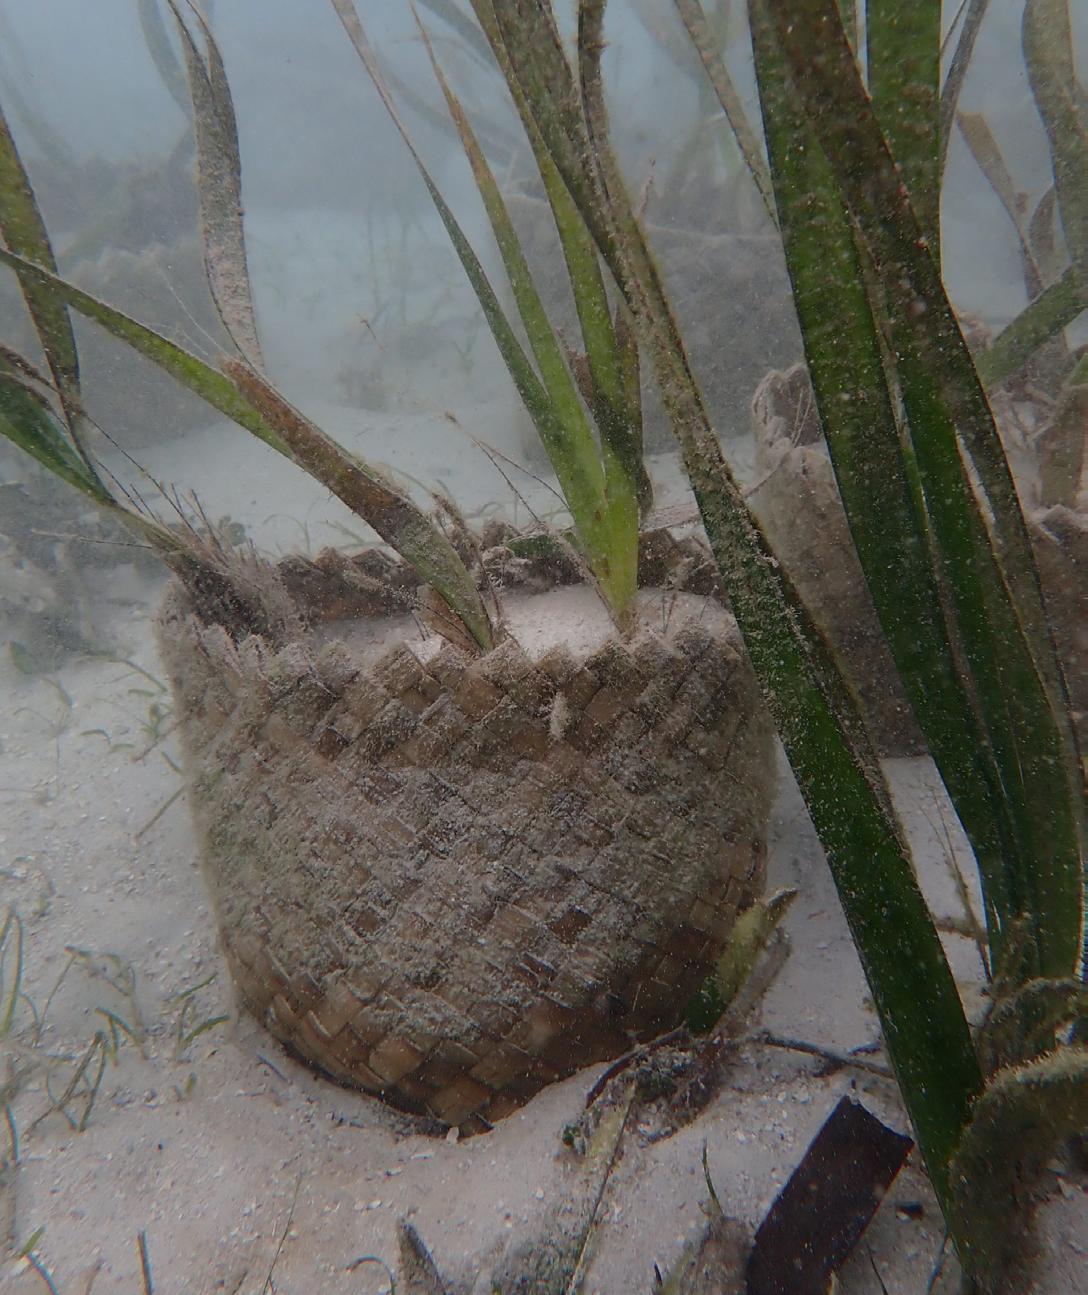
References
1. Waycott, M., Duarte, C. M., Carruthers, T. J., Orth, R. J., Dennison, W. C., Olyarnik, S., ... & Kendrick, G. A. (2009). Accelerating loss of seagrasses across the globe threatens coastal ecosystems. Proceedings of the National Academy of Sciences, 106(30), 12377-12381
2. Unsworth, R. K., Cullen, L. C., & Unsworth, P. J. (2018). Global threats to seagrass meadows. Journal of Experimental Marine Biology and Ecology, 500, 10-19.
3. Polidoro, B. A., Carpenter, K. E., Collins, L., Duke, N. C., Ellison, A. M., Ellison, J. C., ... & Gaines, S. D. (2010). The loss of seagrasses from tropical ecosystems: Rates, causes, and consequences. Frontiers in Ecology and the Environment, 8(5), 245-253.
4. Arifin, L. (2020). Seagrass Restoration Project in West Yensawai Village, Raja Ampat. Unpublished manuscript.
5. Kusuma, A. N. (2020). The role of communities in seagrass restoration in Raja Ampat. Unpublished manuscript.
6. Conservation International. (2021). Blue Carbon Initiative. Retrieved from https://www.conservation.org/ projects/our-blue-carbon-program
7. Kementerian Kelautan dan Perikanan RI. (2021). Inisiatif Karbon Biru. Retrieved from http://perpustakaan. menlhk.go.id/pustaka/images/docs/JAKARTA_POST_12___JULI_2014_KELAUTAN.pdf
8. Tan, Y. M., Dalby, O., Kendrick, G. A., Statton, J., Sinclair, E. A., Fraser, M. W., … Sherman, C. D. (2020). Seagrass restoration is possible: Insights and lessons from Australia and New Zealand. Frontiers in Marine Science, 7. doi:10.3389/fmars.2020.00617
9. Orth, R. L., Dennison, W. C., Duarte, P., Fourqurean, J. W., Heck Jr., K. L., Jobst, K. A., ... & Zieman, J. C. (2020). A global seagrass valuation. Annual Review of Marine Science, 12(1), 163-194.
10. Duarte, P., Dennison, W. C., Martínez-Osuna, E., Montroy, Y., Orfila, A., Plaisted, J. P., ... & Waycott, M. (2011). Mediterranean Seagrass meadows and climate change impacts on carbon stocks and fluxes: a role for seagrass conservation? Proceedings of the Royal Society B: Biological Sciences, 278(1712), 3106-3113.
11. Duarte, P., & Krause-Jensen, D. (2006). Will the early seagrass decline be amplified in the 21st century? Chemosphere, 63(6), 826-836.
12. Chesapeake Bay Program (2022, October 5). Chesapeake Bay Program.
13. Melbourne Water (2023, October 5). Port Phillip Bay: Seagrass Restoration.
In recent years, there has been a growing awareness of the need to reduce carbon emissions and transition towards a more sustainable future. The transportation sector is one of the biggest contributors to carbon emissions, responsible for almost 30% of carbon emissions every year. As a result, players in this sector have been actively identifying cleaner and greener solutions to reduce carbon emissions and achieve net zero carbon by 2050, such as through the development of hydrogen-powered vehicles (U.S. Department of Energy, 2022).
Hydrogen is a clean and renewable energy source that can be used to power a range of transportation vehicles, including passenger vehicles, trucks, trains, and aircraft (Nnabuife et al., 2023; U.S. Department of Energy, 2022). One of the primary benefits of hydrogen power is its clean energy profile. By replacing kerosene with hydrogen, the only by-products from direct combustion are water vapour and energy, which significantly reduces the carbon footprint of the energy generation process (see Appendix 4.1.1).
Despite the benefits of hydrogen power, transitioning to a hydrogen economy presents numerous challenges that must be addressed to ensure a successful shift away from traditional fossil fuel-based energy sources. One of the key challenges is the need for substantial investment in infrastructure to support the production, transportation, and storage of low-density hydrogen. The lack of such essential infrastructures is a significant barrier to the adoption of hydrogen-powered vehicles (García, 2023; Hydrogen Newsletter, 2023; Tashie-Lewis & Nnabuife, 2021). Another challenge is, while there are various methods for producing hydrogen, including electrolysis and steam methane reforming, many of these processes are currently more expensive than traditional fossil fuel-based energy sources (García, 2023; Sharma et al., 2021). However, despite these challenges, significant progress has been made towards developing and commercialising hydrogen-powered vehicles to achieve net zero carbon emissions by 2050. The following table provides an overview of the various initiatives undertaken in the transportation sector to develop hydrogen-powered vehicles.
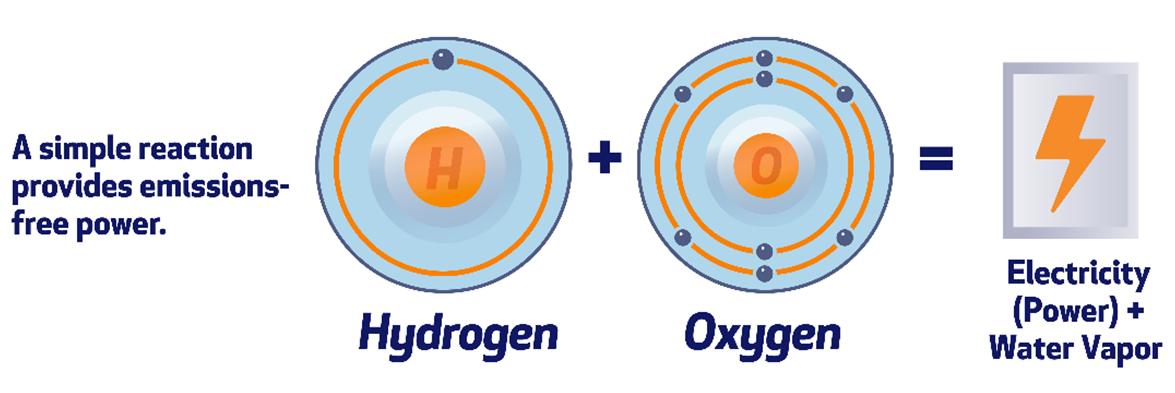
• Launched in 2014, Toyota Mirai is the world’s first mass-produced hydrogen fuel cell car (Kubota, 2014).
• Toyota claims that the Mirai can be refuelled in just five minutes, which is three to four times faster than the fastest charging stations available for battery electric vehicles (EVs) (Hunting, 2023).

• The South Korean government plans to deploy 2,000 hydrogen fuel cell commuter buses on the roads by the end of 2026 (Collins, 2023).
• To support this initiative, the South Korean Ministry of Environment has announced its decision to extend financial assistance to Hyundai, the principal supplier of hydrogen buses in the country, and SK E&S, the company responsible for supplying the necessary liquid hydrogen fuel (Collins, 2023). Appendix 4:
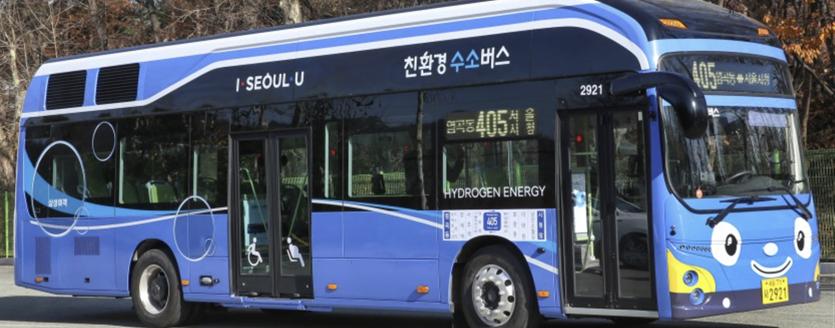
• Nikola, the pioneer in hydrogen-truck technology, commenced the serial production of its revolutionary hydrogen fuel cell electric truck in July 2023. The first batch of these cutting-edge vehicles is scheduled for delivery to customers in September 2023. As of 2023, 18 customers have already placed orders for over 200 of these sustainable vehicles (Jennifer, 2023a).
• Given the importance of the hydrogen refuelling ecosystem to accelerate the adoption of hydrogen-powered vehicles, Nikola has also teamed up with Voltera to develop hydrogen refuelling stations across Southern California in America (Jennifer, 2023a, 2023b).

• In March 2023, the world’s first hydrogen fuel cell passenger and car ferry, the MF Hydra, embarked on its maiden journey in Norway (Holtze, 2023).
• The vessel is equipped with an 80 cubic meter hydrogen storage tank, enabling it to significantly reduce its carbon emissions by up to 95% annually (Tamim, 2023).

• In 2018, the world’s first hydrogen fuel cell train (Coradia iLint™) entered into commercial service in Germany (Houser, 2018). 14 Coradia iLint trains are expected to be in operation by 2022 (Railway Technology, 2020).
• The trains are capable of covering a distance of 621 miles (1,000 kilometres) on just one tank of hydrogen. Moreover, the trains can attain a maximum speed of 140 kilometres per hour (Kuta, 2022).
• Replacing diesel-powered trains with hydrogenpowered ones can prevent the release of over 4,000 tonnes of carbon dioxide into the atmosphere each year (Kuta, 2022).

• Airbus introduced the ZEROe concept in 2020 with the goal of commercialising its hydrogen-powered aircraft by 2035 (Airbus, 2024a).
• In November 2023, Airbus accomplished a remarkable milestone by completing their first fully hydrogenpowered flight, with the Arcus-J glider. This marked the initial round of in-flight tests conducted by Airbus using a hydrogen combustion engine (Dokso, 2023).
• It is estimated that using hydrogen as the primary energy source can potentially reduce carbon emissions by up to 50% in the aviation sector (Airbus, 2024b).

1. Airbus. (2024a). ZEROe - Towards the world’s first hydrogen-powered commercial aircraft. https://www.airbus.com/en/innovation/low-carbon-aviation/ hydrogen/zeroe
2. Airbus. (2024b). Hydrogen - An important decarbonisation pathway. https://www.airbus.com/en/innovation/low-carbon-aviation/ hydrogen#:~:text=Hydrogen%20propulsion%3A%20Hydrogen%20can%20be,chain%20powered%20entirely%20by%20hydrogen
3. CHFCA. (2016). Fuel cells – The sustainable power source. https://www.chfca.ca/fuel-cells-hydrogen/about-fuel-cells/
4. Collins, L. (2023). South Korean capital city signs deal for 1,300 new hydrogen buses by 2026, says Hyundai. https://www.hydrogeninsight.com/transport/ south-korean-capital-city-signs-deal-for-1-300-new-hydrogen-buses-by-2026-says-hyundai/2-1-1463347
5. Dokso, A. (2023). Airbus’s Blue Condor advances hydrogen-powered contrail research. Energy News. https://energynews.biz/airbuss-blue-condoradvances-hydrogen-powered-contrail-research/
6. García, J.A.R. (2023). Unveiling the disadvantages of hydrogen fuel: A comprehensive analysis. https://www.linkedin.com/pulse/unveiling-disadvantageshydrogen-fuel-comprehensive-rold%C3%A1n-garc%C3%ADa/
7. Holtze, B. (2023). World’s first liquid-powered hydrogen ship, MF Hydra, is powered by Ballard’s fuel cells. https://blog.ballard.com/marine/worlds-firstliquid-powered-hydrogen-ship-mf-hydra-is-powered-by-ballards-fuel-cells#:~:text=World’s%20first%20liquid%2Dpowered%20hydrogen,powered%20 by%20Ballard’s%20fuel%20cells&text=Norway’s%20goal%20to%20require%20all,shift%20in%20the%20marine%20industry.
8. Hunting. (2023). Review: 2023 Toyota Mirai proves hydrogen is the fuel of the future — and always will be. https://www.insidehook.com/autos/review2023-toyota-mirai-hydrogen-fuel-future#:~:text=The%20Mirai’s%20true%20advantage%20over,are%20capable%20of%20dishing%20out.
9. Hydrogen Newsletter. (2023). What are the major drawbacks of hydrogen fuel, and how can they be mitigated? https://www.hydrogennewsletter.com/ what-are-the-major-drawbacks-of-hydrogen-fuel-and-how-to-mitigate-those/
10. Jennifer, L. (2023a). Roadway revolution: Nikola accelerates hydrogen truck production. https://carboncredits.com/nikola-accelerates-hydrogen-fuelcell-truck-production-fhyd/
11. Jennifer, L. (2023b). Truck companies are shifting to hydrogen fuel for long-haul trips. https://carboncredits.com/truck-companies-are-shifting-tohydrogen-fuel-for-long-haul-trips/
12. Kubota, Y. (2014). Toyota’s fuel-cell car Mirai goes on sale. https://web.archive.org/web/20180526232252/https://blogs.wsj.com/japanrealtime/2014/12/15/ toyotas-fuel-cell-powered-mirai-hits-showrooms/?guid=BL-JRTB-18738&dsk=y
13. Kuta, S. (2022). Hydrogen-Powered Passenger Trains Are Now Running in Germany. https://www.smithsonianmag.com/smart-news/hydrogen-poweredpassenger-trains-are-now-running-in-germany-180980706/
14. Nnabuife, S. G., Oko, E., Kuang, B., Bello, A., Onwualu, A. P., Oyagha, S., & Whidborne, J. (2023). The prospects of hydrogen in achieving net zero emissions by 2050: A critical review. Sustainable Chemistry for Climate Action, 100024.
15. Railway Technology. (2020). Coradia iLint Regional Train. https://www.railway-technology.com/projects/coradia-ilint-regional-train/?cf-view
16. Rains, T. (2022). Airbus has chosen its A380 superjumbo jet to test a hydrogen-powered engine it hopes will fuel future zero-emission aircraft. https:// www.businessinsider.com/see-a380-demonstrator-jet-that-will-test-hydrogen-powered-engines-2022-2
17. Sharma, S., Agarwal, S., & Jain, A. (2021). Significance of hydrogen as economic and environmentally friendly fuel. Energies, 14(21), 7389.
18. Sigler, D. (2020). ZEROe on the rise at Airbus. Sustainable Skies. https://sustainableskies.org/zeroe-h2-rise-airbus/
19. Sustainable Bus. (2023). Hyundai is set to supply 1,300 fuel cell buses to Seoul. https://www.sustainable-bus.com/fuel-cell-bus/hyundai-is-set-tosupply-1300-fuel-cell-buses-to-seoul/
20. Tashie-Lewis, B. C., & Nnabuife, S. G. (2021). Hydrogen production, distribution, storage and power conversion in a hydrogen economy-a technology review. Chemical Engineering Journal Advances, 8, 100172.
21. Tamim, B. (2023). ‘MF Hydra’: World’s first liquid hydrogen-powered ferry gets operational. https://interestingengineering.com/transportation/mf-hydraworlds-first-liquid-hydrogen-powered-ferry
22. U.S. Department of Energy. (2022). Hydrogen’s role in transportation. https://www.energy.gov/eere/vehicles/articles/hydrogens-roletransportation#:~:text=Hydrogen%20can%20store%20and%20deliver,buses%2C%20planes%2C%20and%20ships.
23. Ustáriz, S.R. (2021). Clean energy: advantages and disadvantages of hydrogen cars. BBVA. https://www.bbva.ch/en/news/clean-energy-advantages-anddisadvantages-of-hydrogen-cars/
Appendix 5: Pioneering Advanced Building Materials for Sustainable Urban Living
Air pollution has become a major concern in many cities across the world due to rapid urbanisation (Health Effects Institute, 2022). Inhaling polluted air can lead to various respiratory diseases, cardiovascular diseases, and even death (World Health Organization, 2022). To tackle this problem, researchers are actively exploring innovative techniques to remove air pollutants by using sustainable and advanced building materials (Gray, 2016; Stott, 2015). Two such building materials that have gained attention are the Breathe Brick and i.Active BIODYNAMIC cement, which can help reduce air pollution. The following sections provide a more detailed explanation of these sustainable building materials.
Breathe Brick is a pollution-absorbing brick developed by Carmen Trudell in 2015 (Stott, 2015). Breathe bricks are a novel approach to air filtration technology that has been designed to integrate seamlessly into a building’s regular ventilation system. The system consists of two main components: concrete bricks, which provide structural reinforcement, and couplers made from recycled plastic, which act as an inlet for directing outside air into the bricks for cyclone filtration (see Appendix 5.1.1) (Humphries, 2015; Stott, 2015).
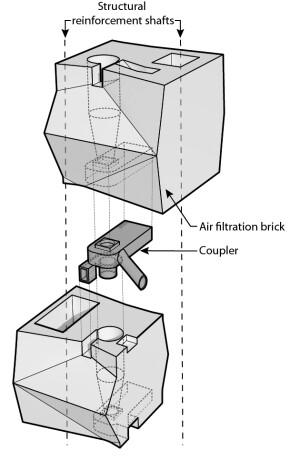
As shown in Appendix 5.1.2 and 5.1.3, these bricks are made up of two layers, with a specialised outer layer that can filter the pollutants and a standard inner layer providing insulation. The functionality of the Breathe Brick is centred around cyclone filtration, similar to the concept of a vacuum cleaner, which can effectively remove large pollutant particles from the air and deposit them into a removable hopper located at the bottom of the wall (Stott, 2015). Frequent cleaning of the hopper is unnecessary as its compartment is large enough to hold pollutants equivalent to the size of two adjacent bricks (Rethinking the Future, n.d.). The system is found to effectively filter 30% of fine particles (diameter < 2.5 microns), such as haze, and 100% of coarse particles (diameter > 10 microns), such as dust (Stott, 2015). Furthermore, due to the simple mechanism and materials, producing Breathe Bricks requires less energy and cost, making them a cost-effective solution to reduce air pollution levels in developing countries (Stott, 2015). Although Breathe Bricks has not been widely commercialised, it is a promising green building material that has the potential to revolutionise the construction industry in the future.


Invented by Italcementi in 2015, i.Active BIODYNAMIC cement is made from 80% recycled materials and scrapings of the Carrara marble, making it an eco-friendly option for construction projects. One of the unique features of this cement is the presence of a photocatalytic material, titanium dioxide, which can decompose pollutants in the air when exposed to UV light. To elaborate further, when exposed to UV light, the titanium dioxide absorbs the light energy and triggers a reaction that releases free radicals. These free radicals react with the pollutants in the air, such as nitrogen oxides, sulphur, and other volatile organic compounds, and break them down into inert salts. When it rains, the salts are washed away from the walls, making i.Active BIODYNAMIC cement a self-cleaning material that requires minimal maintenance (Gray, 2016).
Apart from its self-cleaning properties, i.Active BIODYNAMIC cement also offers several other advantages. For instance, it has excellent durability, high compressive and flexural strength, and good resistance to harsh weather conditions. It is also an excellent insulator, which helps to reduce energy consumption in buildings. Moreover, because it is made from recycled materials, it has a lower carbon footprint as compared to traditional cement (Surfaces International, 2015). Palazzo Italia in Milan, Italy, is a prime example of a building constructed using Biodynamic cement for the entire outdoor surface and some parts of the interior (Gray, 2016). Similarly, Japan, the US, and the Netherlands have implemented photocatalytic technology in their cement road pavements to capture and decompose volatile pollutants emitted by vehicles (Envirotech, 2015).

To summarise, the Breathe Brick operates by utilising cyclone filtration to capture pollutants, while i.Active BIODYNAMIC cement uses a photocatalytic reaction to break down pollutants into non-toxic salts. These eco-friendly building materials clearly show great potential in reducing air pollution and promoting healthy living environments. With further R&D these technologies could be scaled up to make a significant impact on air quality and public health.
References
1. Envirotech. (2015). Breathing space for innovative building material. https://envirotecmagazine. com/2015/07/30/breathing-space-for-innovative-building-material/
2. Gray, R. (2016). The building that ‘sucks up’ SMOG: Cement absorbs pollution from the air and turns it into harmless salt that washes off in the rain. Mail Online. https://www.dailymail.co.uk/sciencetech/ article-3440356/The-buildings-suck-SMOG-Cement-absorbs-pollution-air-turns-harmless-salt-washesrain.html
3. Health Effects Institute. (2022). Air quality and health in cities – A state of global air report 2022. https://www. stateofglobalair.org/resources/health-in-cities
4. Humphries, C. (2015). Citation: Breathe Brick. Architect Magazine. https://www.architectmagazine. com/awards/r-d-awards/citation-breathe-brick_o#:~:text=Inspired%20by%20vacuum%20cleaners%20 that,filtration%20and%20structural%20fa%C3%A7ade%20system.
5. Italcementi. (2020). Expo 2015: Palazzo Italia nel 2020. https://www.heidelbergmaterials.it/it/expo2015palazzo-italia-oggi
6. Stott, R. (2015). This Innovative Brick Sucks Pollution from the Air Like a Vacuum Cleaner. Arch Daily. https:// www.archdaily.com/771767/this-innovative-brick-sucks-pollution-from-the-air-like-a-vacuum-cleaner
7. Surfaces International. (2015). Italcementi launches biodynamic cement for cleaner air. https:// surfacesinternational.com/news/italcementi-launches-biodynamic-cement-cleaner-air
8. World Health Organization [WHO]. (2022). Ambient (outdoor) air pollution. https://www.who.int/news-room/ fact-sheets/detail/ambient-(outdoor)-air-quality-and-health
Carbon sequestration involves a process of capturing and storing carbon dioxide CO2 from the atmosphere and preventing its release into the atmosphere, with the goal of mitigating climate change (U.S. Geological Survey, 2022). It is important because CO2 emissions have led to wildfires, increased ocean acidity, and contributed to global warming. There are various natural and artificial methods of carbon sequestration, and they can be broadly categorised into Biological Carbon Sequestration (Forest and Vegetation and Soil Carbon Sequestration), Geological Carbon Sequestration (Carbon Capture and Storage (CSS)), Ocean Carbon Sequestration (Ocean Storage) and Mineralisation.
• Biological Carbon Sequestration refers to the natural or human-assisted processes by which living organisms (plants, trees, soil and marine organisms) uptake and store CO2 from the atmosphere.
• Ocean Carbon Sequestration refers to when atmospheric CO2 comes into touch with the ocean’s surface, some of it dissolves right into the sea. This is a physical process that is a part of the atmosphere and ocean’s normal gas exchange.
• Mineralisation method involves capturing carbon from industrial processes and processing the captured CO2 with minerals to form stable carbonates.
• Geological Carbon Sequestration is a method in CCS that involves capturing CO2 emissions from industrial sources or power plants and then storing them deep underground in geological formations.
Bioenergy with Carbon Capture and Storage (BECCS) is carbon-negative and produces electricity in addition to capturing emissions. Capturing and storing carbon with bioenergy produces low-carbon energy sources, contributing to a decarbonised economy (Veloso, 2023). Carbon removal via BECCS reach somewhat less than 50 Mt CO2 per year by 2030. European countries like Denmark, Sweden, the United Kingdom and Norway have made notable progress in advancing BECCS technology (Clery & Rackley, 2023). Appendix 6.1.1 presents Orsted Collaboration with Microsoft and Aker Carbon Capture.
Orsted, Denmark
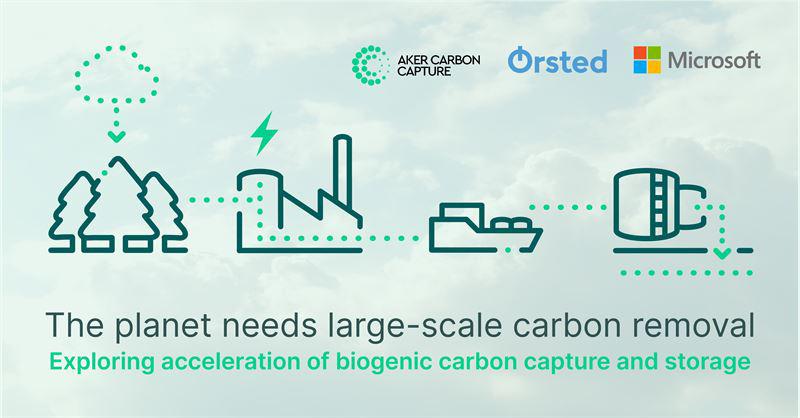
Orsted Collaboration with Microsoft and AkerCarbon Capture
• Orsted is a renewable energy company that is primarily focused on the development, construction, and operation of offshore wind farms.
• Orsted has developed heat and power plants that produce biomass energy where CCS is important. Hence, the development of the negative–emission technology (BECCS).
• Orsted has partnered with Microsoft to enhance digital skills, advanced analytics, and AI, and collaborating with Aker Carbon Capture for various technological components (including five Just Catch units, liquefaction systems, on/offloading facilities, and temporary CO2 storage) aims to elevate the efficiency and standards of biomass units and reduce carbon emission (Appendix 6.1.2 presents a description of technological components).
The technological component provided by Aker Carbon Capture
Technology
Just Catch Unit
Liquefaction System
Description
Capturing carbon and delivering in its pure form, CO2. Its delivering capacity is 40,000, 100,000, and 400,000 tonnes of CO₂ per year.
Compressing CO2 to its desired liquefaction pressure
Orsted is upgrading its power plant to reduce 70% of CO2 emissions by 2030 from levels of emissions in the 1990s.
Heidelberg Cement Norcem Plant, Norway
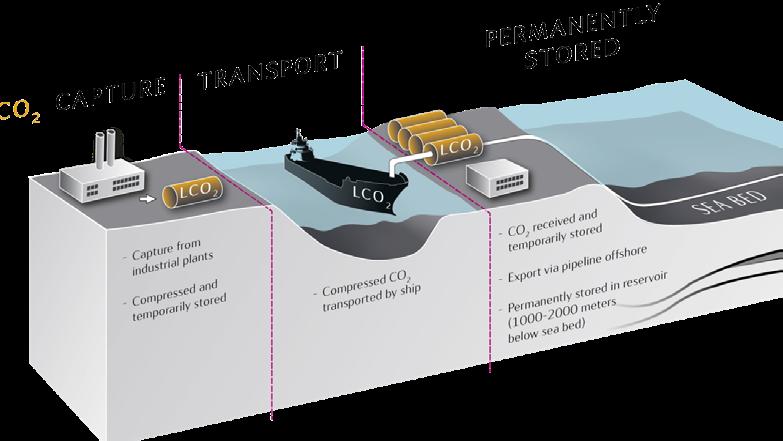
Heidelberg Cement Norcem Plant BECCS process
Heidelberg Materials
• Heidelberg Cement Norcem plant is a cement production plant that stores CO2 permanently in the reservoir (Heidelberg Cement, 2022).
• The CO2 is absorbed by the Brevik Cement Plant using a solution of water and organic amine solvents.
• The cement plant’s exhaust fumes are collected, cooled to 30°C, and then combined with an amine solution. After that, the amine solution is heated to 120°C to separate the carbon and amine molecules. Next, CO2 gas is ready to be liquefied so that it can be transported and stored on the ocean floor (Refer to Appendix 6.1.4 for the process of CO2 extraction and storage).
• Potential to capture 400,000 tonnes of CO2 per year and transport for permanent storage.
Drax Power Station Plant, The United Kingdom

Power Station Plant BECCS process
Drax Group
• Drax generates sustainable biomass to decarbonise Europe (Capture, 2021).
• CO2 emissions from the energy production of biomass are absorbed. Following that, the CO2 is securely kept offshore in geological storage beneath the ocean.
• The gases that are often emitted into the atmosphere during the process of generating electricity are known as flue gases. Chemicals will be eliminated from the gas in this pre-treatment step before the CO2 is extracted. An amine solvent is used to initiate a chemical reaction inside the absorber column in order to collect the CO2 from the flue gas. After that, the CO2 is extracted from the solvent by heating the solvent again in the reboiler. In order to reuse it, the solvent is collected (Refer to Appendix 6.1.5 for the process of CO2 extraction and storage).
Exergi, Sweden
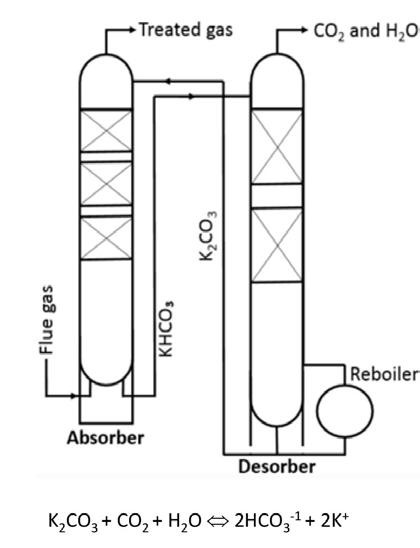
Stockholm Exergi Power Station Plant
BECCS process
Stockholm Exergi
• One of the pioneers globally in facilitating the transition from lower CO2 emissions to zero emissions is Stockholm Exergi (SE).
• Hot Potassium Carbonate technology is used as BECCS in which the flue gas with CO2 meets a solvent with water and potassium carbonate (Stockholm, 2020).
• When exposed to pressure, potassium carbonate undergoes a reaction with CO2 and water (H2O), resulting in the formation of potassium bicarbonate. By reducing the pressure on potassium bicarbonate, the reaction reverses, liberating CO2 and H2O. This cyclic process enables continuous operation, allowing for the separation and capture of CO2 (Refer to Appendix 6.1.6 for the Carbon capture process).
• SE estimates that a potential 800,000 tonnes of CO2 per year. might be captured at its heat and electricity cogeneration plant, where BECCS has been tested (Capture, 2021).
References
1. https://www.drax.com/carbon-capture/7-places-on-the-path-to-negative-emissions-through-beccs/
2. Clery, D., & Rackley, S. (2023). Bioenergy with carbon capture and storage. In Negative Emissions Technologies for Climate Change Mitigation (pp. 249–273). doi:10.1016/b978-0-12-819663-2.00017-4
3. Heidelberg Cement. (2022). Groundbreaking Technologies: CCS/S - Carbon Capture, Utilisation and Storage. Retrieved from https://www.heidelbergmaterials.com/en/carbon-capture-and-storage-ccs#
4. Platts, M. J., & Leong, Y. Y. (2022, February 22). Insight - Re-carbonising South-East Asia ’ s blue carbon ecosystems Get 30 % off with our ads free Premium Plan. The Star. Retrieved from https://www.thestar. com.my/business/business-news/2022/02/22/insight---re-carbonising-south-east-asias-blue-carbonecosystems
5. Stockholm, B. (2020). How it works How it works. Retrieved from https://beccs.se/cdr/how-it-works/#:
6. U.S. Geological Survey. (2022). What is carbon sequestration? U.S. Geological Survey, 1–5. Retrieved from https://www.usgs.gov/faqs/what-carbon-sequestration
7. Veloso, C. (2023). The Top 10 Carbon Capture Technologies Explained. Retrieved from https://blog.verde.ag/ en/top-10-carbon-capture-tech/
Plastic products have become ubiquitous in our daily lives due to their versatile nature, leading to a surge in global demand since their introduction. However, this heightened market demand has presented a significant challenge: the proper disposal of plastic products once they reach the end of their functional life. Other than reducing single-use plastic usage, the global average plastic recycling rate remains low at 15% (Ragossnig & Agamuthu, 2021). Advanced and emerging economies are making various attempts to overcome the plastic challenge. In 2018, about 80 Mt of plastic waste were mismanagedsome were burned openly and dumped in substandard landfills and open dumping grounds. Around five to ten Mt of waste ended up in the ocean (McKinsey, 2022).
In China, 10,000 AI- powered garbage sorting bins were distributed in 33 cities towards creating zero-waste cities. The Xiaohuanggou (translated as Little Yellow Dog) machine automatically identifies waste items through images, average size and density of items. Users can also track the recycled items’ movement from the bins to the next processing location. Any individual who registers as an app user will receive 0.25 yuan credited to their Xiaohuanggou account for each item. The user can cash out at a minimum of 10 yuan. Similar platform usage is spreading across the country, with companies such as Alipay also introducing garbage sorting bins in 14 more cities in the Yangtze River Delta region, targeting over 30,000 communities (People’s Daily Online, 2019).
While it is widely known that the waste management industry is not data-driven, it can potentially create a lucrative business. Topolytics, an Edinburgh-based startup, developed data analytics platforms to aggregate data on industrial and commercial waste using data science and machine learning. Its data platform WasteMap® generates insights like the type and quantity of materials, as well as the origin of the waste and tracks its movement from Appendix 7:
processing to disposal. Topolytics works with waste producers, processors and government companies to unlock the value of data in the waste ecosystem and how it can serve the circular economy. The company has helped companies such as Coca-Cola European Partners, DS Smith and BrewDog to analyse data on products, materials, production and process waste. The platform generates insights on types and amount of materials and the journey of the materials through the supply chain to improve materials recovery. Topolytics also works with UK waste brokers, recyclers and processors to optimise tracking and analysis of materials' movements.
Researchers in Hong Kong and Singapore have developed an AI-driven robot to tackle plastic waste in waterways. Clearbot Neo is a robot that uses machine vision to recognise and collect waste in rivers, streams and waterways. The autonomous robot, powered by a solar battery, can collect up to 200 kilograms of floating waste and 15 litres of oil per day. Data gathered from Clearbot is channelled to an online dashboard that supports the users to analyse, monitor, track operations and make informed decisions. Clearbot service was also deployed in the Varanasi regions of India and Hong Kong to clean up marinas and urban waterways.
Microplastic contamination can cause health concerns when plastic is directly ingested through the food and water we consume. German company, Wasser 3.0, innovated silica that clumps plastic from drinking water. Using the principle of agglomeration-fixation, the clumped microplastic aggregates and coarse-pored separation units are used to remove the agglomerates. Detection of microplastics in wastewater is also done using specially developed fluorescent markers for data analysis.
References
1. People’s Daily Online (2019). Available at: http://en.people.cn/n3/2019/0226/c98649-9549956.html , Accessed on 9/1/2024
2. McKinsey (2022). Available at: https://www.mckinsey.com/industries/chemicals/our-insights/addressingthe-challenges-of-plastic-waste-circularity-and-leakage , Accessed on 9/1/2023
3. Ragossnig AM, Agamuthu P. Plastic waste: Challenges and opportunities. Waste Management & Research. 2021;39(5):629-630. doi:10.1177/0734242X211013428
4. https://www.clearbot.org/, Accessed on 9/1/2024
5. https://www.linkedin.com/pulse/10-innovative-technologies-combating-plastic-/?utm_source=share&utm_ medium=member_android&utm_campaign=share_via , Accessed on 9/1/2024
6. https://wasserdreinull.de/en/technology/microplastic-removal/
7. Plastics Europe, https://plasticseurope.org/changingplasticsforgood/the-plastics-transition/ , Accessed on 10/1/2024
Agricultural technology (AgTech), also known as agritech, has revolutionised the agriculture industry by incorporating cutting-edge technologies such as precision farming, data analytics, and automation. This transformation aims to reshaping the landscape of food production, ensuring food security, and addressing environmental concerns. Labourintensive tasks are replaced by tireless robotic assistants, planting seeds with pixel-perfect precision and allowing farmers to focus on strategic planning (Aravind & Shaha, 2020). In laboratories, gene-editing tools like CRISPR-Cas9 are rewriting the codes of life, creating crops resistant to diseases and droughts that once threatened harvests (Černý & Křížová, 2017). However, this revolution is not without its thorns where bridging the digital divide and ensuring equitable access for smallholder farmers is crucial (World Bank, 2020). Ethical considerations surround gene editing, demanding careful navigation to balance progress with responsible scientific practices (Ishii, 2014). Agritech can build resilience to climate change by crafting climate-resistant crops and cultivating adaptive practices, safeguarding food security in the face of a changing planet (Accenture, 2023).
In the heart of Malaysia’s Cameron Highlands, Greenheart Farms Sdn Bhd has emerged as a leading force in the ASEAN agricultural landscape. Established in 2009, this pioneering company has made a profound impact by revolutionising the production of high-quality, pesticide-free vegetables while championing sustainability and innovation. Greenheart Farms has become an international player by collaborating with European countries and leveraging advanced technologies to optimise crop yields. Their distinctive approach extends beyond vegetable sales, as they actively educate Malaysian farmers on eco-friendly farming methods. These techniques are adapted to diverse land types, serving key markets in Asia, the Middle East, Japan, and Australia. The company has introduced various innovative technologies, covering the processing, storage, and transportation of horticultural products. This not only reduces post-harvest losses but also enables farmers to increase income and market their products more effectively.
Their farm, Blue Valley Farm, aligns with eco-friendly practices, emphasising natural pest control for the production of healthier and safer crops. Another venture, Lojing Farms, represents a cutting-edge, eco-friendly expansion in the Lojing Highlands, covering 18 hectares of advanced farming facilities. It proudly holds the distinction of being the first biologically controlled farm in Southeast Asia to achieve the esteemed Global Good Agricultural Practices (GAP) certification, ensuring high-quality produce comparable to European and American farms.
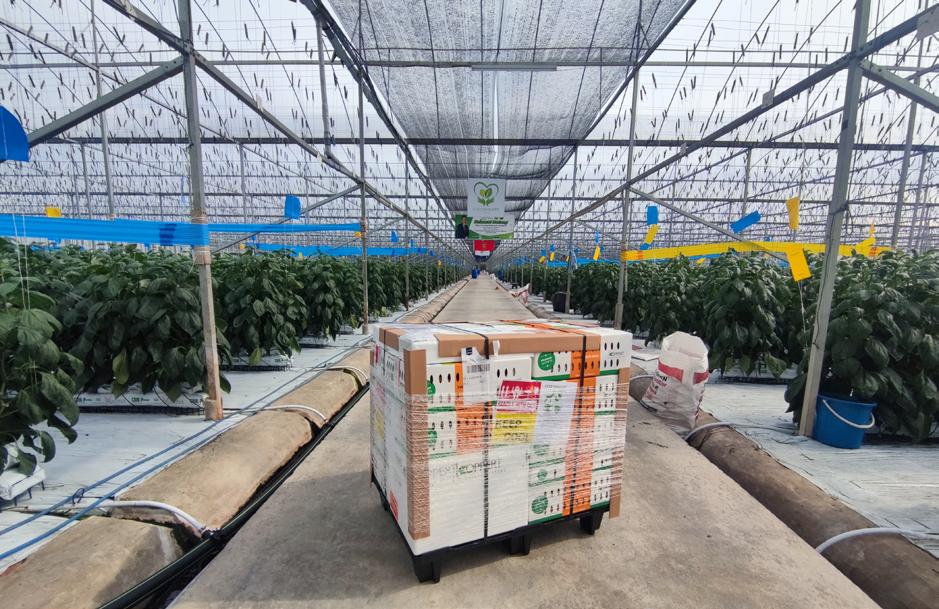
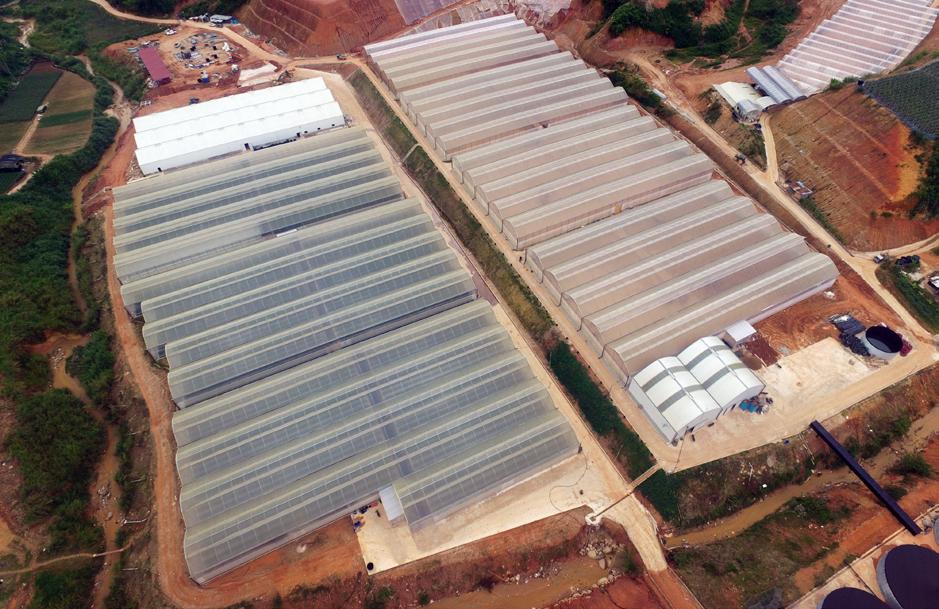
References
1. GreenHeart Farms (2023). Retrieved from https://greenheart.my/farms/index.php/our-farms
2. Bowen. M (2021). Lindsay Australia delivers on time with continuous data protection from Veeam. Retrieved from https://www.intelligentcio.com/apac/2021/12/16/lindsay-australia-delivers-on-time-with-continuousdata-protection-from-veeam/
3. Lindsay Australia Delivers on Time with Continuous Data Protection from Veeam (2021). Retrieved from Lindsay Australia Delivers on Time with Continuous Data Protection from Veeam
4. Artificial Intelligence for Agriculture Innovation (2021). Community Paper, World Economic Forum.
5. World Bank. (2020). A Revolution in the Making: The Use of Science and Technology for Food Production.
6. AgFunder. (2023). AgTech Trends 2023: The State of Agriculture Technology. https://agfunder.com/research/ agfunder-global-agrifoodtech-investment-report-2023/
7. The Global Risks Report 2023. World Economic Forum: https://www.weforum.org/publications/global-risksreport-2023/
8. Accenture. (2023, January). Global Cybersecurity Outlook 2023. https://initiatives.weforum.org/global-cyberoutlook/home: https://initiatives.weforum.org/global-cyber-outlook/home
9. Aravind, R., & Shaha, S. K. (2020). Robots in the Field: A Critical Survey of Agricultural Robotics. Autonomous Robots, 44(6), 1463-1507. https://link.springer.com/chapter/10.1007/978-3-319-32552-1_56: https://link. springer.com/chapter/10.1007/978-3-319-32552-1_56
10. Edgington, S. A., Smith, E. G., & He, X. (2017). Precision Agriculture: A Review of Current Status and Future Potential. MDPI Agriculture, 8(6), 69
The critical mineral mining industry plays an essential role in providing raw materials necessary for different sectors, such as manufacturing, construction, and transportation (Igogo et al., 2021). Moreover, the production of clean energy technologies, such as solar panels, wind turbines, electric vehicles, and batteries, rely heavily on a variety of critical minerals extracted through mining activities, such as copper, lithium, nickel, cobalt, and other rare earth elements (Suzuki, 2023). As the world shifts towards renewable energy sources, the demand for critical minerals in the energy sector is expected to increase six-fold by 2040 (Suzuki, 2023). Despite its major contribution to the world’s clean energy transition, mining activities worldwide have caused severe environmental degradation. These damages are mainly attributed to the emission of greenhouse gases, particulate matter, and acidification, which are often the result of the leakage of mining tailings (Zagoruichyk, 2022). Additionally, these activities can also lead to deforestation, resulting in habitat degradation and the loss of biodiversity (Witchalls, 2022). Clearly, the negative impacts of mining on the environment pose significant challenges for sustainable development and climate change mitigation efforts. As such, there is an urgent need for the mining industry to adopt more environmentally responsible practices to minimise its impact on the environment. One effective way to do so is by incorporating circular economy practices into the business model, which emphasises the principles of restoration and regeneration. This approach involves reducing, reusing, and recycling materials, ultimately optimising resource yields and preserving natural capital (Ellen MacArthur Foundation, 2015).
The circular economy model in the mineral mining industry can be visualised in Appendix 9.1.1, which illustrates the entire process, from mineral exploration to recycling. This model emphasises creating a closed-loop system where mineral resources are conserved, waste is minimised, and the environmental impact of mining is reduced (ERA-MIN, 2020).
Rio Tinto, one of the world’s largest mining companies headquartered in Australia, is a successful example of the circular economy model in the mining industry. Rio Tinto produces various industrial minerals such as aluminium, borates, copper, iron ore, selenium, diamonds, and others, which play important roles in promoting the transition towards clean energy (Rio Tinto, 2024). In addition, the company has actively incorporated climate strategies into its business model and has made significant efforts to build circular economy practices in its operations. Rio Tinto’s circular practice is particularly evident in the midstream processing phase, where minerals are converted into refined products (see the circled area in Appendix 9.1.1).
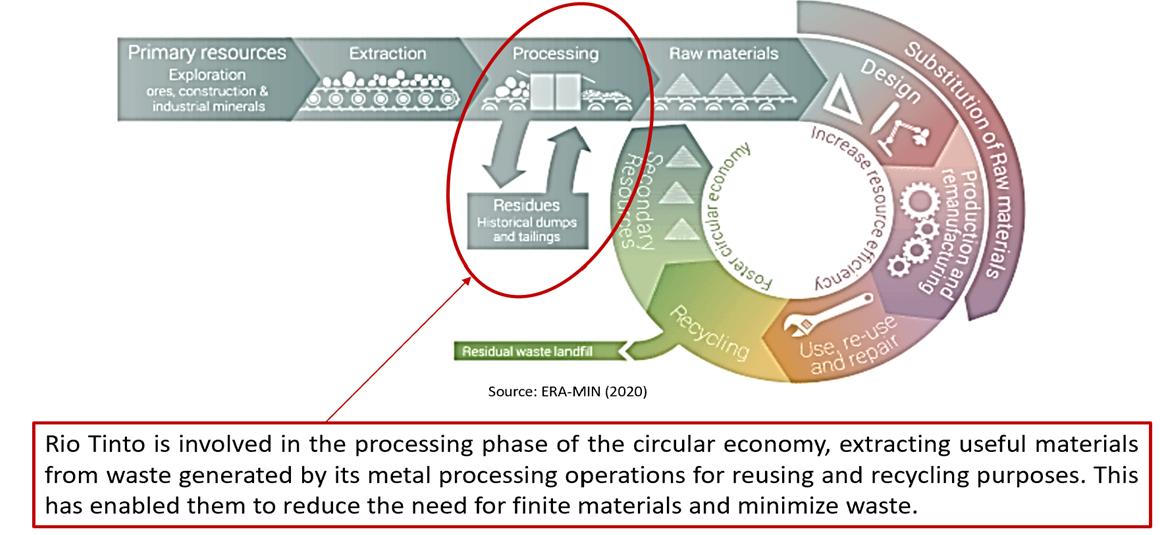
Rio Tinto has been effectively utilising the by-products and waste generated from its metal processing operations, which can help reduce the need to extract more finite materials and minimise the overall amount of waste produced. By recycling and reusing by-products and waste, Rio Tinto is able to reduce its environmental footprint and create value from materials that would otherwise be discarded. Appendix 9.1.2 presents some useful minerals/materials that Rio Tinto has successfully extracted from its waste/by-products (Rio Tinto, 2021):
Tellurium

• Rio Tinto has spent 2.9 million USD to build a plant at its Kennecott mine near Salt Lake City, Utah, to recover tellurium as a by-product of copper smelting.
• It serves as an essential component of cadmium telluride, a semiconductor used to manufacture thin-film PV solar panels, thereby accelerating the transition to renewable energy.
Scandium

• Scandium oxide is a by-product that is extracted during the production of titanium dioxide products.
• It has been widely utilised in the production of advanced technologies in the aerospace, defence, and clean energy sectors.
• Within less than two years of R&D, Rio Tinto has been able to supply Scandium to approximately one-fifth of the global market.
Alextra

• Alextra is a new cement product jointly developed by Rio Tinto and Lafarge Canada. It is made from spent pot lining, a by-product or waste material generated during the aluminium electrolysis process.
• Around 80% of the pot lining waste from Rio Tinto’s Quebec-based aluminium operations is recycled into new products.
• By using Alextra as an alternative to raw materials such as alumina and silica, Lafarge Canada is expected to produce 1 Mt of cement per year (Cement Products News, 2021).
Anhydrite

• In Canada, Rio Tinto has been extracting 85,000 tonnes of anhydrite annually as a by-product of its aluminium production process.
• In the agricultural sector, anhydrite can be utilised to produce more effective and affordable fertiliser to grow blueberries.
• In the construction industry, anhydrite can be used to replace gypsum, a non-renewable resource, in producing cement and niche flooring materials (Rio Tinto, 2020).
Through its circular economy initiatives, Rio Tinto has not only reduced its environmental impact but has also created new business opportunities and improved its economic performance (Rio Tinto, 2021). This exemplary circular economy model serves as a learning best practice for mining companies operating in ASEAN countries, which are among the key players in extracting and supplying critical minerals necessary for the global clean energy transition (ASEAN Secretariat, 2020). For example, Indonesia has established itself as the world’s largest producer of nickel, with an annual production of approximately 1 Mt. Nickel is a critical component in the manufacture of batteries used in electric vehicles, which play a vital role in the clean energy revolution (Ayman, 2023). In addition, the Philippines, with an estimated production of 360,000 metric tonnes of nickel in 2022, is the world’s secondlargest nickel producer after Indonesia, contributing to 11% of the total global production (Cruz, 2023). The ASEAN countries’ strategic position as key players in the global supply chain of critical minerals highlights the need for sustainable mining practices that promote circular economy initiatives and reduce environmental impacts while enhancing economic performance. The adoption of such practices would ensure the long-term availability of critical minerals and promote the efficient use of resources, leading to a sustainable future for the ASEAN countries.
1. ASEAN Secretariat. (2020). ASEAN Minerals Cooperation. Retrieved from https://asean.org/our-communities/ economic-community/asean-minerals-cooperation/
2. Ayman, F. M. (2023). Unleashing Nickel’s Potential: Indonesia’s Journey to Global Prominence. https://www. aseanbriefing.com/news/unleashing-nickels-potential-indonesias-journey-to-global-prominence/
3. Cement Products News. (2021). Lafarge Canada to partner on circular economy project. Retrieved from https://cementproducts.com/2020/11/04/lafarge-canada-to-partner-on-circular-economy-project/
4. Cruz, E.G.D. (2023). Philippines – Mining by the numbers, 2023. S&P Global. Retrieved from https://www. spglobal.com/marketintelligence/en/news-insights/research/philippines-mining-by-the-numbers-2023
5. Ellen MacArthur Foundation. (2015). Delivering the circular economy: A toolkit for policymakers. Retrieved from https://www.ellenmacarthurfoundation.org/a-toolkit-for-policymakers
6. ERA-MIN. (2020). Raw materials for the sustainable development and the circular economy. Retrieved from https://www.era-min.eu/
7. Gedam, V. V., Raut, R. D., de Sousa Jabbour, A. B. L., & Agrawal, N. (2021). Moving the circular economy forward in the mining industry: Challenges to closed-loop in an emerging economy. Resources Policy, 74, 102279.
8. Igogo, T., Awuah-Offei, K., Newman, A., Lowder, T., & Engel-Cox, J. (2021). Integrating renewable energy into mining operations: Opportunities, challenges, and enabling approaches. Applied Energy, 300, 117375.
9. Rio Tinto. (2020). Even superfoods need their minerals: Using aluminium waste to grow better blueberries. Retrieved from https://www.riotinto.com/en/news/stories/blueberries-love-aluminium
10. Rio Tinto. (2021). Nose to tail mining: Making the most of what we take from the ground. Retrieved from https://www.riotinto.com/en/news/stories/nose-to-tail-mining
11. Rio Tinto. (2024). About. https://www.riotinto.com/en/about
12. Stanford Advanced Materials. (2023). An overview of scandium rare earth element. Retrieved from https:// www.stanfordmaterials.com/blog/an-overview-of-scandium.html
13. Suzuki, Y. (2023). Managing mineral demand for the clean energy transition: A national and international issue. Yale Environment Review. Retrieved from https://environment-review.yale.edu/managing-mineraldemand-clean-energy-transition-national-and-international-issue#:~:text=As%20the%20world%20 shifts%20towards,%2C%20wind%20turbines%2C%20and%20batteries.
14. Witchalls, S. (2022). The environmental problems caused by mining. Earth.org. Retrieved from https://earth. org/environmental-problems-caused-by-mining/
15. Zagoruichyk, A. (2022). Greenhouse gas emissions from global mining and resource extraction result in up to £2.5tn ($3tn) in damages worldwide every year, according to a new study. Carbon Brief. Retrieved from https://www.carbonbrief.org/emissions-from-mining-cause-up-to-2-5tn-in-environmental-damages-eachyear/
Lao PDR has a geographically diverse landscape of forest-covered limestone mountains, open woodland and lowlands that lie along the banks of the Mekong River. With typical tropical monsoon wet and dry climate, the country offers cool months of December through February and dry season between November and April. Rich in natural monsoon forest areas scattered with bamboo and shrubs, Laos is home to hundreds of species of orchids and palms. It houses nearly 200 species of mammals, reptiles, amphibians and birds. With over 840,000 people of multi-ethnic groups living in over 1,200 villages situated within the boundaries of 23 national reserves, the community is heavily dependent on natural resources to sustain their livelihoods. Laos has relied on the richness of its natural resources to sustain its agricultural economy since the late 20th century. The country’s natural beauty also presents an opportunity for economic value through nature-based tourism.
According to the World Bank, there is a projected growth in Laos’s nature-based tourism, increasing from 4.3% of the 2019 GDP to the global average of approximately 10% of GDP. This development is expected to have a positive trickle-down effect on job opportunities, with a forecasted 10% growth over the next decade. The natural wealth of Laos serves as a comparative advantage that has notably elevated household income, particularly in rural areas. For instance, in a village near Dong Hau Sao National Protected Area, poverty decreased from 39% to 26% due to a nature-based tourism business in Laos partnering with the local community (World Bank, 2020).
Introduced in 2021, the project “Supporting Micro, Small, Medium Enterprises (MSME) in the Lao Tourism Industry Supply Chain to Access Markets for Sustainable Practices Project” (SUSTOUR Laos) involves more than 600 tourism micro and small-medium enterprises and suppliers, 40 local communities active in tourism activities and 20 major international travel agents and targets around 500,000 domestic and international tourists. The project was piloted in Vientiane capital, 11 districts in Vientiane and Luang Prabang province. The project collaborates with Plan International, the Department of Trade Promotion (MOIC), the Lao National Chamber of Commerce and Industry (LNCCI) and the European Centre for Ecological and Agricultural Tourism (ECEAT) as key implementing partners (switch-asia.eu, n.d.). The project is a model for sustainable tourism development that promotes community members’ and MSMEs’ collaboration to reduce the social and environmental impacts of tourism.
MSMEs are taught to adopt environmentally friendly practices in their business processes and apply socially responsible ways of interacting with local communities. Tour operators, travel agents and accommodation premises that comply and actively adopt Sustainable Consumption and Production (SCP) practices will receive recognition through the Travelife certification standards which is internationally recognised as the leading sustainability certification system in the tourism industry (switch-asia.eu, n.d.).
As of June 2023, the SUSTOUR Laos project has involved more than 400 MSMEs in the tourism industry, benefitting over 6,000 employees and provided training and capacity building to 193 MSMEs. Six hotels in the country have been awarded the Travelife certification and the project has rolled out Lasting Laos certification programme, a local sustainability certification for MSMEs in the food and beverage, handicraft, transportation and cultural excursions sectors (Laos News Agency, 2023). To date, the SUSTOUR Laos project remains focused on supporting local MSMEs to adopt SCP practices and positioning Laos as a sustainable tourism destination.
References
1. World Bank (2020). Developing Nature-Based Tourism as a Strategic Sector for Green Growth in Lao PDR. Retrieved from https://www.worldbank.org/en/country/lao/publication/developing-nature-based-tourismas-a-strategic-sector-for-green-growth-in-lao-pdr
2. Laos News Agency (2023). Retrieved from https://kpl.gov.la/En/detail.aspx?id=74010
3. Switch Asia.EU (n.d.). Lasting Laos SUSTOUR Laos Project. Retrieved from https://www.switch-asia.eu/site/ assets/files/3928/lastinglaos_information_package_english.pdf
4. https://www.switch-asia.eu/project/sustour-laos/
5. https://single-market-economy.ec.europa.eu/sectors/tourism/eu-funding-and-businesses/fundedprojects/sustainable/transnational-products_en
6. https://www.swisscontact.org/en/projects/wisata
Food security is a critical issue in the ASEAN region, given the diverse socioeconomic conditions and the region’s susceptibility to climate change. The evolving food consumption patterns in ASEAN countries, influenced by urbanisation, rising disposable income, population growth, and changing dietary habits, present challenges for food production and distribution systems unprepared for these shifts.
In Singapore, one of the most densely populated countries with limited land availability in the world, the issue of food security is of great concern. However, the country has successfully addressed this issue through innovative and sustainable solutions by looking into urban farming like Sky Greens’ vertical farms (Musa & Basir, 2021). In Lim Chu Kang (North region of Singapore), Sky Greens’ vertical farm employs the A-Go-Gro vertical farming system, which utilises hydraulic water-driven systems to rotate crops and ensure consistent levels of light, drainage, and nutrients for the plants (Sky Greens, 2014). This farming method not only maximises the use of limited space but also reduces water usage by up to 95% and eliminates the need for pesticides, thereby contributing to food security while preserving the environment (Harris, 2023). Sky Greens has produced fresh green vegetables, which are guaranteed to be available in a steady supply because they are grown in regulated conditions. As the vertical farming buildings are housed in covered outside greenhouses, the vegetables are cultivated in a regulated atmosphere shielded from pests, weather, and flooding. Sky Greens helps address food security by producing five to ten times more leafy vegetables per unit area of agricultural land than other conventional farms (Greens, 2020).
Moving to Malaysia, recent efforts focus on technological advancements to secure agricultural supply chains while addressing the challenge of food safety through smart farming. An approach known as “smart farming” aims to give the agricultural sector the infrastructure it requires to utilise modern technology. Sunway XFarms and CityFarms Malaysia, urban agricultural farming, prioritise sustainable practices with soil-less smart farming technology, which addresses food security and the deteriorating state of agricultural lands (Sunway City, 2022). An example of soil-less farming is hydroponics, where plants are cultivated in water rather than soil. The benefits of hydroponic farming are that it requires few resources (container/jar and water), saves space, uses fewer chemicals, and makes it easier to identify the issues of plant growth (Cheah, 2022). Hydroponic methods produce a higher yield with no wastage from unfavourable weather conditions. Another method of soil–less farming is aeroponics, which is an advanced form of hydroponics. In aeroponics, the plants hang in the air, and its main source of nutrient delivery is oxygen. Another initiative by Terragro (based in Selangor) developed an Aeroponic Tower farm which saves up to 75% - 95% of space and 95% of water usage while producing more than 30% of crop yield as compared to soil farming (Terragro, 2023). In addition to solving agriculture problems, hydroponics and aeroponics improve food security by ensuring that people always have access to reasonably priced, nutrient-dense food.

www.sunway.city
In the Philippines, the government’s National Greening Program (NGP) is a comprehensive initiative addressing poverty reduction, environmental preservation, and enhanced food security. NGP's strategy is employed by integration of all government, public organisation, and private sector environmental initiatives, offering incentives to organisations to produce seedlings, prepare and plant site, and maximise innovation in science and technology (Department of Environment and Natural Resources, 2016). Implementation of the NGP has demonstrated positive outcomes which include biodiversity maintenance, increased fruit production, and support for animals producing dairy products (Oliveros, 2022). Through the NGP, 205,897 hectares of plantations were successfully maintained and protected, 37.2 million seedlings were planted on 47,299 hectares of forestland, and 144 drones and 143 Ipad mini were acquired for inspection work.
Additionally, the Farmer Entrepreneurship Programme (FEP) by the Jollibee Group Foundation (JGF) bridges the gap between small-scale farmers and the food supply chain by providing training to help them develop the technical skills necessary to become farmer entrepreneurs. Following the training, the programme also supports food security by enabling JGF to buy FEP-produced white onions, spring onions, green bell peppers, ginger, and calamansi (Jollibee Group Foundation, 2021; Rappler, 2023).
This case study exemplifies the varied strategies employed by some ASEAN nations, which involve a combination of government-led initiatives and private-sector innovations aimed at ensuring food security in the region. These initiatives encompass a spectrum of approaches, from diminishing import dependencies to embracing technological advancements, all working together to achieve the overarching goal of food security in this dynamic and evolving region.

1. Cheah, K. (2022). Hydroponic Farming in Malaysia: Everything You Should Know. Sunway XFarms. Retrieved from https://sunwayxfarms.com/stories/blog/hydroponic-farming-malaysia/
2. CityFarm Malaysia. (2023). CityFarm Press Release. CityFarm Future of Farming. Retrieved from https:// cityfarm.my/blogs/cityfarm-press-release?page=2-
3. DENR. (2020). Annual Report ENHANCED NATIONAL GREENING PROGRAM, (Region 6), 65–75.
4. Department of Environment and Natural Resources. (2016). Areas for NGP development.
5. Greens, S. (2020). Sky Green Go-Go Technology. Retrieved from https://www.skygreens.com/vertical-farming/
6. Hazlin, H. (2023, March 21). Malaysia turns to smart farming to boost food security. The Straits Times. Retrieved from https://www.straitstimes.com/asia/se-asia/malaysia-turns-to-smart-farming-to-boostfood-security
7. Jollibee Group Foundation. (2021). Share this article : Retrieved from https://jollibeegroup.com/news/ jollibee-group-foundations-farmer-entrepreneurship-program-enabling-growth-sharing-joy/
8. Musa, S. F. P. D., & Basir, K. H. (2021). Smart farming: towards a sustainable agri-food system. British Food Journal, 123(9), 3085–3099. doi:10.1108/BFJ-03-2021-0325
9. Oliveros, E. D. (2022). Evaluation of the Implementation of the (Vol. 10). Retrieved from www. globalscientificjournal.com
10. Rappler.com. (2023). How Jollibee is helping farmers recover from pandemic. Retrieved from https://www. rappler.com/brandrap/goodrap/jollibee-farmers-road-to-recovery/
11. Sunway City. (2022). Changing the Agriculture Game with Sunway City Kuala Lumpur. Retrieved from https:// www.sunway.city/kualalumpur/changing-the-agriculture-game-with-sunway-city-kuala-lumpur/
12. Terragro. (2023). Aeroponic Crops. Retrieved from https://terragro.asia/aeroponics/ References
• Top rank among ASEAN countries for its government effectiveness and is highly regarded for its public service delivery and bureaucracy quality.
• Owns top-notch public research institutions and higher education institutions that foster innovation and R&D through collaborations.
• Its industry players are strongly driven by R&D and innovative partnerships, contributing to a well-established STI ecosystem.
• Strong and efficient collaborative ecosystem involving government bodies, industry players, academia, and research institutions.
• The Research, Innovation and Enterprise (RIE) 2025 plan fosters collaboration between key stakeholders to develop the country’s STI ecosystem.
• E.g., the Floating solar photovoltaic system at Tengah Reservoir is a collaborative effort involving public and private players.
• Actively pursues regional and international partnerships to establish its presence in the global market.
• Strong national integrity system backed by effective law enforcement mechanisms.
• The 5th least corrupt country globally in the 2022 Corruption Perceptions Index (Transparency International, 2022).
• Effective and impartial legal frameworks have created a friendly business environment (World Bank, 2021).
• No restrictions on foreign ownership of companies, making it one of the easiest places to do business in the world (World Bank, 2019).
• Earned a high score (95.4/100) for infrastructure quality, with top-notch transportation systems and reliable power and water supplies (World Economic Forum, 2019).
• Actively promote sustainable infrastructure development (green buildings in the healthcare and education sectors).
• Possess one of the world’s largest floating solar farms to reduce carbon footprints.
• Owns top-notch healthcare infrastructure, with top pharmaceutical and biotechnology companies setting up manufacturing hubs.
• Well known as a regional and global hub for trade and investment.
• Signed numerous FTAs with other countries, such as the RCEP (the world’s largest FTA).
• Has the highest level of participation in the global value chains among ASEAN countries.
• Specialises in forward linkages, contributing to around 42% of Singapore’s GDP.
• Strong R&D ecosystem and a highly skilled workforce have attracted MNCs to set up their R&D centers in Singapore.
• R&D incentives: 250% tax deduction for qualifying R&D capital expenditure to encourage R&D activities and technology adoption by companies.
• FDI incentives: Global Trader Program offers tax exemptions to global trading companies (5% or 10% tax exemption on their eligible trading income).
• Green incentives: Green Mark Incentive Schemes (GMIS) to encourage the adoption of green building technologies and sustainable building design by developers.
• Personal incentives: Caregivers Training Grant and Home Caregiving Grant provide subsidies to caregivers and persons with disabilities.
• Possesses a highly educated and skilled workforce.
• 72% of its workforce had completed tertiary education (Lanvin & Monteiro, 2022).
• Its education system aligns well with industry demand, scoring 92.13 out of 100 (Lanvin & Monteiro, 2022).
• Possesses world-class higher education institutions (HEIs), including NUS and NTU.
• HEIs often collaborate with tech companies to cultivate skilled professionals.
• HEIs also work closely with industry players to develop industry-ready talent, ensuring low levels of skills mismatch in the country.
• Scores 99.37 out of 100 on the ICT Infrastructure Index (affordable mobile tariffs and widespread internet access) (Lanvin & Monteiro, 2022).
• Among the first in the world to achieve comprehensive 5G network coverage across the nation by 2025.
• Currently developing a new national digital blueprint focusing on 6G network development.
• The Smart Nation initiative, based on Digital Society, Digital Economy, and Digital Government pillars, aims to leverage technology to improve citizens’ lives, businesses, and government.
• Except for Brunei, other maturing ASEAN countries have lower levels of government effectiveness.
• Government agencies often face challenges in effectively implementing sound policies.
• In general, research institutes, higher education institutions, and industry players still have lots of room for improvement in terms of R&D as well as technology and knowledge-sharing activities.
• Low levels of innovation capabilities, compounded with inefficient policy implementation, have resulted in the absence of strong STI ecosystems in these countries.
• Collaborations between government bodies, industry players, research institutions, and universities remain fragmented and superficial.
• A lack of coordination between government agencies has caused inconsistent policy implementation.
• The lack of collaboration has resulted in limited knowledge sharing between sectors.
• Consequently, in many instances, these countries have to rely on foreign knowledge and technology to develop their innovation capabilities.
• Except for Brunei, other maturing ASEAN countries have low rankings in the Corruption Perceptions Index (Transparency International, 2021).
• Lack of strong legal and regulatory systems and impartial judiciary (World Bank, 2021).
• Most of these countries have received low rankings on the Ease of Doing Business Index due to (World Bank, 2019):
• Restrictions on foreign ownership of companies.
• Complicated laws for foreign investors.
• Maturing ASEAN countries need further improvement in their infrastructure quality (World Economic Forum, 2019).
• Several countries have implemented plans to upgrade their road connectivity.
• However, healthcare facilities and education infrastructure in rural areas remain concerns, with limited hospital beds and a shortage of classrooms.
• Inadequate water and wastewater management infrastructure also poses a significant challenge, with a lack of access to clean water and proper sanitation facilities.
• Participation in the RCEP and ASEAN Economic Community (AEC) has provided opportunities for cross-border investment, talent exchange, and harmonisation of standards.
• Diverse specialisations in global value chains (some in backward linkages and others in forward linkages).
• Participation in the global value chains is often accompanied by an increase in economic growth and FDI levels.
• However, internationalisation remains challenging in some of these maturing countries due to low STI development, a lack of skilled workers, and limited economic diversification.
• Introduced various incentives to promote their STIE ecosystems:
• Offer tax exemptions for electric vehicles (EVs) to reduce reliance on petroleum-based fuel.
• Promote local R&D initiatives through research funds and tax incentives.
• Attract foreign direct investments through lower corporate income tax, tax holidays, and exemptions from customs duties.
• Aiming to promote the transition to a green economy, foster innovation, and attract foreign investments.
• Have rankings ranging from 34th to 82nd out of 134 countries on the Global Talent Competitiveness Index (GTCI) (Lanvin & Monteiro, 2022).
• Made significant investments in education, leading to a rise in tertiary education enrollment.
• However, STEM enrollment is relatively low in some countries.
• There is also a need to improve technical vocational education and training (TVET) systems to address skills mismatch.
• Introduced various initiatives to enhance their infostructure (e.g., Brunei’s Go Digital ASEAN initiative, and Malaysia’s 12th Malaysian Plan).
• Invested heavily in cloud infrastructure and actively rolled out 5G networks to promote the expansion of the digital economy.
• However, challenges still exist in the accessibility and quality of digital infrastructure, especially in rural areas, where internet connectivity is limited.
• Scored relatively low in their government effectiveness, with scores ranging between 8 to 36 out of 100 (World Bank, 2021).
• Public research institutes, higher education institutions, and industry players are not likely to engage in R&D and knowledge-sharing activities due to limited funding, weak infrastructure, and a shortage of skilled workforce.
• As a result, the STI ecosystems in these countries are still at the nascent stage.
• Lack of coordination and collaboration between government agencies.
• For example, the FDI policies in Laos are inconsistent due to disjointed efforts among multiple ministries, creating confusion for foreign investors and discouraging FDI in the country.
• Low levels of R&D collaboration between universities and industry players.
• Inter-industry linkages and public-private partnerships in these countries remain limited and fragmented.
• High levels of political uncertainty in Cambodia, Laos, and Myanmar.
• Except for Timor-Leste, these countries have low rankings on the Corruption Perceptions Index and the Control of Corruption Index (World Bank, 2021).
• Lack of independent judiciary results in inadequate protection of property and human rights.
• Complicated business regulatory frameworks hinder the countries’ abilities to attract inward FDI, as reflected in their low rankings in the Ease of Doing Business index (World Bank, 2019).
• Poor quality infrastructure due to the lack of financial resources and investment, particularly in basic infrastructure like roads, water supply, and sanitation.
• Rural populations have limited access to proper road infrastructure, which limits economic opportunities and access to essential services.
• Access to safe drinking water and sanitation remains a major issue.
• Healthcare and education facilities are also in need of improvement, with challenges such as shortages of medical supplies and poorly equipped schools.
• The least involved in the GVCs due to a lack of economic diversification, limited FDI, and a shortage of skilled labor.
• Focus primarily on low-skilled and labor-intensive industries (e.g., textiles, raw metals, timber, agricultural products, crude petroleum, etc.).
• Low-value-added products make it challenging for them to move up the GVCs.
• There is a need to diversify their economies and orient towards more advanced industries that generate higher value-added products.
• Offer various tax incentives to both local and foreign investors to drive economic growth.
• Provide green incentives that are essential in combating climate change (e.g., incentives for green projects).
• There is a lack of incentives to promote clean energy investments in Timor-Leste.
• Limited incentives to promote R&D initiatives and technology adoption.
• Tax incentive systems have often been criticized for convoluted procedures and a lack of transparency.
• Low rankings on the Global Talent Competitiveness Index, indicating (Lanvin & Monteiro, 2022):
• Low vocational enrolment and training
• Inadequate knowledge transfer
• A shortage of high-skilled workers
• Limited innovation capacity
• Face challenges in attracting students to pursue STEM education.
• Insufficient government-led initiatives and public-private partnerships to promote TVET programmes.
• Skill mismatches remain one of the major issues in these countries.
• Lower scores on the ICT Infrastructure Index, signifying limited internet coverage, low bandwidth capacity, and high costs for ICT services (Lanvin & Monteiro, 2022).
• Unevenly distributed digital infrastructure, with many areas lacking access to basic ICT connectivity.
• Face challenges in developing 5G infrastructure and fiber optic networks.
• Weak infostructure and ICT connectivity have negatively affected online learning and the digital transformation of education.
1. A*STAR. (2020). Racer Technology’s smart factories make the Singapore SME shine. Retrieved from https://www.astar.edu.sg/News/a-star-innovate/innovates/innovate/sme-digital-transformation-racer-technology
2. Academy of Sciences Malaysia (ASM), 2021. 10-10 Malaysian Science, Technology, Innovation & Economy (MySTIE) Framework. Retrieved from https://www.akademisains.gov.my/10-10-mystie/
3. ACCA. (2022). Selected tax incentives in Singapore. https://www.accaglobal.com/ my/en/student/exam-supportresources/professional-exams-study-resources/ p6/technical-articles/selected-tax-incentives-in-singapore-. html
4. Acharya, A., 2001. Constructing a Security Community in Southeast Asia: ASEAN and the Problem of Regional Order. London: Routledge. Retrieved from https://www.taylorfrancis.com/books/mono/10.4324/9781315796673/ constructing-security-community-southeast-asia-amitav-acharya
5. Acharya, A., 2009. Constructing a Security Community in Southeast Asia: ASEAN and the Problem of Regional Order. 2nd ed. London: Routledge. Retrieved from https://www.taylorfrancis.com/books/mono/10.4324/9780203939239/ constructing-security-community-southeast-asia-amitav-acharya
6. Advanced Technology Research Centre [ATREC]. (2023). Collaboration. Retrieved from https://atrec.org/ collaboration/
7. Agora Energiewende, 2024. Electricity Market Designs in Southeast Asia: Harnessing Opportunities for Renewable Energy Growth. Berlin: Agora Energiewende. Retrieved from https://www.agora-energiewende.org/fileadmin/ Partnerpublikationen/2024/EN-Electricity-Market-Designs-in-Southeast-Asia.pdf
8. Ahmed, P. K., Nair, M. S., Vaithilingam, S. & Teow, H. H. (2024) Holistic Framing of the Future: The 4F Foresight Framework (Working Paper No. IGSC WP 2024-002). Kuala Lumpur: Sunway Institute for Global Strategy and Competitiveness. Retrieved from https://sunwayuniversity.edu.my/sites/default/files/documents/2024-05/7_4f_ working_paper_final.pdf
9. Al Jazeera, 2019. In a Cambodian beach town, China-led building boom flouts rules. Retrieved from https://www. aljazeera.com/economy/2019/7/3/in-a-cambodian-beach-town-china-led-building-boom-flouts-rules
10. Alongi, D.M., 2014. Carbon cycling and storage in mangrove forests. Annual Review of Marine Science, 6, pp.195–219. Retrieved from https://www.annualreviews.org/content/journals/10.1146/annurev-marine-010213-135020
11. Amnesty International, 2017. “If You Are Poor, You Are Killed”: Extrajudicial Executions in the Philippines’ “War on Drugs”. Retrieved from https://www.amnesty.org/en/documents/asa35/5517/2017/en/
12. AMRO (2025). ASEAN+3 Regional Economic Outlook (AREO) Update, July 2025. Retrieved from https://amro-asia. org/press-briefing-asean3-regional-economic-outlook-areo-update-july-2025/
13. Antara News, 2025. Nusantara's government office zone scheduled for June 2025 completion. Retrieved from https://en.antaranews.com/news/352661/nusantaras-government-office-zone-scheduled-for-june-2025completion
14. Anwar Ibrahim, 1998. 'The Making of Anwar Ibrahim's "Humane Economy"'. Trends in Southeast Asia, Issue 18.
15. Arkema, K.K., Bailey, A., Chávez Cerón, V., et al., 2013. Coastal habitats shield people and property from sealevel rise and storms. Nature Climate Change, 3(10), pp.913–918. Retrieved from https://www.nature.com/articles/ nclimate1944
16. ASEAN (2021b). ASEAN Digital Masterplan 2025. Retrieved from https://asean.org/wp-content/uploads/2021/09/ ASEAN-Digital-Masterplan-EDITED.pdf
17. ASEAN (2022) ASEAN Cybersecurity Cooperation Strategy (2021-2025). Jakarta: ASEAN Secretariat. Retrieved from https://asean.org/wp-content/uploads/2022/02/01-ASEAN-Cybersecurity-Cooperation-Paper-2021-2025_ final-23-0122.pdf
18. ASEAN (2022) Digital Transformation: The ASEAN Issue 23/2022. Retrieved from https://asean.org/wp-content/ uploads/2022/11/Issue-23-Digital-Transformation-digital-version.pdf
19. ASEAN (2025) ASEAN Digital Economy Framework Agreement (DEFA) – Strategic Blueprint for Digital Economy Governance. Jakarta: ASEAN Secretariat.
20. ASEAN Briefing (2022) ‘Singapore to Reap Long-Term Benefits Under RCEP’, ASEAN Briefing. Retrieved from https://www.aseanbriefing.com/doing-business-guide/singapore/trade-relationships/singapore-to-reap-longterm-benefits-under-rcep
21. ASEAN Centre for Energy (2020) 6th ASEAN Energy Outlook (AE06). Jakarta: ASEAN Centre for Energy. Retrieved from https://asean.org/wp-content/uploads/2023/04/6th-asean-energy-outlook-2017-2040.pdf
22. ASEAN Centre for Energy (2021) ASEAN Plan of Action for Energy Cooperation (APAEC) 2016 – 2025: Phase II (2021 – 2025). Jakarta: ASEAN Centre for Energy. Retrieved from https://asean.org/book/asean-plan-of-action-forenergy-cooperation-apaec-2016-2025-phase-ii-2021-2025/
23. ASEAN Centre for Energy (2022) 7th ASEAN Energy Outlook (AE07). Manila: ASEAN for Energy. Retrieved from https://asean.org/wp-content/uploads/2023/04/The-7th-ASEAN-Energy-Outlook-2022.pdf
24. ASEAN Centre for Energy (2023) Outlook on ASEAN Energy 2023. Jakarta: ASEAN Centre for Energy. Retrieved from https://asean.org/wp-content/uploads/2023/04/Outlook-on-ASEAN-Energy-2023.pdf
25. ASEAN Centre for Energy (2024) 8th ASEAN Energy Outlook 2023 – 2050 (AEO8). Jakarta: ASEAN Centre for Energy. Retrieved from https://aseanenergy.org/wp-content/uploads/2024/09/8th-ASEAN-Energy-Outlook.pdf
26. ASEAN Centre for Energy, 2024. ASEAN Oil and Gas Updates 2024. Jakarta: ASEAN Centre for Energy. Retrieved from https://aseanenergy.org/wp-content/uploads/2024/12/ASEAN-Oil-and-Gas-Updates-2024.pdf
27. ASEAN Cooperation on Civil Service Matters (ACCSM), 2017. ACCSM Work Plan 2016–2020. Retrieved from https:// asean.org/wp-content/uploads/2021/08/ACCSM-Work-Plan-2016-2020.pdf
28. ASEAN Cooperation on Civil Service Matters (ACCSM), 2025. ACCSM Work Plan 2021–2025. Retrieved from https:// asean.org/wp-content/uploads/2021/08/ACCSM-Work-Plan-2021-2025-and-Related-Documents.pdf
29. ASEAN Magazine (2025) ‘ASEAN’s Proactive Strategy for Ageing Populations’, ASEAN Magazine, Issue 44 (July). Retrieved from https://theaseanmagazine.asean.org/article/aseans-proactive-strategy-for-ageing-populations/
30. ASEAN Regional Forum, 2020. ARF Annual Security Outlook 2020. Retrieved from https://aseanregionalforum. asean.org/wp-content/uploads/2020/10/ARF-Annual-Security-Outlook-21.10.pdf
31. ASEAN Secretariat (2017) Master Plan on ASEAN Connectivity 2025. Jakarta: ASEAN Secretariat. Retrieved from https://asean.org/wp-content/uploads/2018/01/47.-December-2017-MPAC2025-2nd-Reprint-.pdf
32. ASEAN Secretariat (2019). The ASEAN Vaccine Baseline Survey (AVBS) Current Situation and Gap Analysis. Retrieved from https://asean.org/wp-content/uploads/2021/10/Agd-6.3.a.i_AVBS_Final_23082019.pdf
33. ASEAN Secretariat (2021) ASEAN Key Figures 2021. Retrieved from https://asean.org/serial/asean-keyfigures-2021/
34. ASEAN Secretariat (2021). ASEAN Development Outlook: Inclusive and Sustainable Development 2021. Jakarta: ASEAN Secretariat. Retrieved from https://asean.org/wp-content/uploads/2021/07/ASEAN-Development-OutlookADO_FINAL.pdf
35. ASEAN Secretariat (2022) ASEAN Youth Development Index. Retrieved from: https://asean.org/book/asean-youthdevelopment-index/
36. ASEAN Secretariat (2023) ASEAN Statistical Yearbook 2023. Retrieved from: https://asean.org/book/aseanstatistical-yearbook-2023/.
37. ASEAN Secretariat (2024) ASEAN Digital Economy Framework Agreement (DEFA) Report. Retrieved from https:// asean.org/wp-content/uploads/2024/11/DEFA-Report-public-summary-expanded_Final_25112024.pdf
38. ASEAN Secretariat (2024) Enhancing Connectivity and Resilience: ASEAN Annual Report 2024. Jakarta: ASEAN Secretariat. Retrieved from https://asean.org/wp-content/uploads/2024/12/ASEAN-AR-2024_e-pub_web.pdf
39. ASEAN Secretariat (2024) Regional Comprehensive Economic Partnership (RCEP): Integration with Global Economy, ASEAN. Retrieved from https://asean.org/our-communities/economic-community/integration-withglobal-economy/regional-comprehensive-economic-partnership-rcep/
40. ASEAN Secretariat (ASEAN SEC), 2021. Annual Report 2021. Retrieved from https://asean.org/wp-content/ uploads/2022/08/LAYOUT-ANNUAL-REPORT-2021-2022-11-28-spread_compressed.pdf
41. ASEAN Secretariat and UNCTAD (2022) ASEAN Investment Report 2022: Pandemic Recovery and Investment Facilitation. Jakarta: ASEAN Secretariat / Geneva. Retrieved from https://asean.org/wp-content/uploads/2022/10/ AIR2022-Web-Online-Final-211022.pdf
42. ASEAN Secretariat, 2023. ASEAN Investment Report 2023: Enhancing Investment in the Digital Economy. Jakarta: ASEAN Secretariat. Retrieved from https://asean.org/wp-content/uploads/2023/12/AIR-Special-2023.pdf
43. ASEAN Secretariat, 2023. Gender Equality and Women’s Empowerment Infographic. Retrieved from https:// knowascc.asean.org/fact-figure/gender
44. ASEAN Secretariat. (2022). Myanmar Country Report. Retrieved from https:// asean.org/wp-content/ uploads/2022/10/20221006-6.Country-Report_Myanmar. Pdf
45. ASEAN Secretariat. (2022). Urbanisation, People Mobility, and Inclusive Development across Urban-Rural Continuum in ASEAN. Retrieved from https://asean.org/book/urbanisation-people-mobility-and-inclusivedevelopment-across-urban-rural-continuum-in-asean/
46. ASEAN Secretariat, 2024. ASEAN Disaster Risk Communication Framework. Retrieved from https://asean.org/ book/asean-disaster-risk-communication-framework/
47. ASEAN Secretariat. (2024). ASEAN Migration Outlook 2024: Second Edition. Retrieved from https://asean.org/wpcontent/uploads/2024/09/ASEAN-Migration-Outlook-SECOND-edition_Final.pdf
48. ASEAN, 1967. The ASEAN Declaration (Bangkok Declaration). Retrieved from https://agreement.asean.org/media/ download/20140117154159.pdf
49. ASEAN, 2020. ASEAN Economic Community (AEC) Blueprint 2025. Retrieved from https://asean.org/book/aseaneconomic-community-blueprint-2025/
50. ASEAN, 2021. ASEAN Gender Mainstreaming Strategic Framework 2021–2025. Retrieved from https://asean.org/ wp-content/uploads/2022/01/ASEAN-Gender-Mainstreaming-Strategic-Framework-endorsed-by-AMMW.pdf
51. ASEAN, 2023. Digital Economy Framework Agreement (DEFA): ASEAN to leap forward its digital economy and unlock US$2 trillion by 2030. Retrieved from https://asean.org/asean-defa-study-projects-digital-economy-leapto-us2tn-by-2030/
52. ASEAN, 2024. ASEAN Key Figures 2024.Retrieved from https://asean.org/wp-content/uploads/2024/12/ASEANKey-Figures-2024-1.pdf
53. ASEAN, 2024. Population living below the national poverty levels (%). Retrieved from https://asean.org/
54. ASEAN-Japan Centre, 2019a. Global Value Chains in ASEAN: A Regional Perspective. Tokyo: ASEAN-Japan Centre Retrieved from https://www.asean.or.jp/en/wp-content/uploads/ sites/3/GVC_A-Regional-Perspective_Paper-1Revised_2019_full_web.pdf
55. ASEAN-Japan Centre. (2017). Global value chains in ASEAN: The Philippines. Retrieved from https://www.asean. or.jp/ja/wp-content/uploads/sites/2/2017/08/ GVC-in-ASEAN_Paper-8_The-Philippines.pdf 48.
56. ASEAN-Japan Centre. (2018). Global value chains in ASEAN: Brunei Darussalam. Retrieved from https://www. asean.or.jp/ja/wp-content/uploads/sites/2/GVC-inASEAN_paper-2_BruneiDarussalam.pdf 49
57. ASEAN-Japan Centre. (2018). Global value chains in ASEAN: Singapore. Retrieved from https://www.asean.or.jp/ja/ wp-content/uploads/sites/2/Singapore-GVC_ Paper-9.pdf 50.
58. ASEAN-Japan Centre. (2018). Global value chains in ASEAN: Singapore. Retrieved from https://www.asean.or.jp/ja/ wp-content/uploads/sites/2/Singapore-GVC_ Paper-9.pdf 51.
59. ASEAN-Japan Centre. (2019). Global value chains in ASEAN: A regional perspective. Retrieved from https://www. asean.or.jp/en/wp-content/uploads/ sites/3/GVC_A-Regional-Perspective_Paper-1-Revised_2019_full_web.pdf 52.
60. ASEAN-Japan Centre. (2019). Global value chains in ASEAN: Cambodia. Retrieved from https://www.asean.or.jp/ en/centre-wide-info/gvc_database_paper3/
61. ASEAN-Japan Centre. (2019b). Global value chains in ASEAN: Thailand. Retrieved from https://www.asean.or.jp/ja/ wp-content/uploads/sites/2/GVC-in-ASEANpaper-10_Thailand.pdf 55.
62. ASEAN-Japan Centre. (2019c). Global value chains in ASEAN: Cambodia. Retrieved from https://www.asean.or.jp/ en/centre-wide-info/gvc_database_ paper3/
63. ASEAN-Japan Centre. (2021). Global value chains in ASEAN: Lao People’s Democratic Republic. Retrieved from https://www.asean.or.jp/en/centre-wideinfo/gvc_database_paper5/
64. ASEANstats (2023) ASEAN Statistical Yearbook 2023. Jakarta: ASEAN Secretariat. Retrieved from https://www. aseanstats.org/wp-content/uploads/2023/12/ASYB-2023-v1.pdf
65. Asia Maritime Transparency Initiative, 2022. Flooding the Zone: China Coast Guard Patrols in 2022. Retrieved from https://amti.csis.org/flooding-the-zone-china-coast-guard-patrols-in-2022/
66. Asian Dengue Voice & Action (ADVA) (n.d.). Dengue Dashboard. [online]. Retrieved from https://www.adva.asia/ dengue-dashboard/
67. Asian Development Bank (2020). Asia Small and Medium-Sized Enterprise Monitor 2020 Volume 1 – Country and Regional Reviews
68. Asian Development Bank (2020). Key Indicators for Asia and the Pacific 2020. Retrieved from https://www.adb.org/ publications/key-indicators-asia-and-pacific-2020
69. Asian Development Bank (2024) E-Commerce Evolution in Asia and the Pacific. Retrieved from https://www.adb. org/publications/e-commerce-evolution-asia-pacific-opportunities-challenges
70. Asian Development Bank (ADB), 2011. Governance and Capacity Development in Public Sector Management: Lao People's Democratic Republic. Retrieved from https://www.adb.org/sites/default/files/linked-documents/46059001-lao-oth-01.pdf
71. Asian Development Bank (ADB), 2024. An Overview of the Lao People's Democratic Republic Country Partnership Strategy 2024–2028. Retrieved from https://www.adb.org/publications/overview-lao-pdr-cps-2024-2028
72. Asian Development Bank (ADB), 2024. Governance and Public Management in Asia and the Pacific. Retrieved from https://www.adb.org/what-we-do/topics/governance/your-questions-answered
73. Asian Development Bank (ADB), 2024. Public Administration Reform in Southeast Asia: Challenges and Opportunities.
74. Asian Development Bank, 2011. Asia 2050: Realizing the Asian Century. Manila: Asian Development Bank. Retrieved from https://www.adb.org/publications/asia-2050-realizing-asian-century
75. Asian Development Bank, 2013. Asian Development Outlook 2013: Asia's Energy Challenge. Mandaluyong City, Philippines: Asian Development Bank. Retrieved from https://www.adb.org/sites/default/files/publication/30205/ ado2013_1.pdf
76. Asian Development Bank, 2024. Asia-Pacific Climate Report 2024. Retrieved from https://www.adb.org/publications/ asia-pacific-climate-report-2024
77. Asian Development Bank. (2016). Policy priorities for a more responsive technical and vocational education and training system in Cambodia. Retrieved from https://www.adb.org/publications/policy-priorities-more-responsivetvetsystem-cambodia
78. Asian Development Bank. (2020). Innovate Indonesia: Unlocking growth through technological transformation. Retrieved from chrome-extension:// efaidnbmnnnibpcajpcglclefindmkaj/https://www.adb.org/sites/default/files/ publication/575806/innovate-indonesia-unlocking-growth.pdf 71. Asian Scientist Newsroom. (2020). RIE2025: Behind Singapore
79. Association of Southeast Asian Nations (2023) Sixth ASEAN State of the Environment Report (SOER-6). Jakarta: ASEAN Secretariat. Retrieved from https://asean.org/wp-content/uploads/2023/09/Sixth-ASEAN-State-of-theEnvironment-Report-SOER6_20240517_COMPRESSED.pdf
80. Association of Southeast Asian Nations (ASEAN) (2020) ASEAN Key Figures 2020. Jakarta: ASEAN Secretariat. Retrieved from https://asean.org/serial/asean-key-figures-2020/
81. Association of Southeast Asian Nations (ASEAN) (2021) ASEAN Development Outlook: Inclusive & Sustainable Development. Jakarta: ASEAN Secretariat. Retrieved from https://asean.org/wp-content/uploads/2021/07/ASEANDevelopment-Outlook-ADO_FINAL.pdf
82. Association of Southeast Asian Nations (ASEAN) (2024) ASEAN Key Figures 2024. Jakarta: ASEAN Secretariat. Retrieved from https://asean.org/serial/asean-key-figures-2024/
83. Atlantic Council, 2025. Freedom and Prosperity Indexes 2025. Retrieved from https://freedom-and-prosperityindexes.atlanticcouncil.org/scorecards
84. Barbier, E.B., Hacker, S.D., Kennedy, C., et al., 2011. The value of estuarine and coastal ecosystem services. Ecological Monographs, 81(2), 169–193. Retrieved from https://esajournals.onlinelibrary.wiley.com/doi/10.1890/101510.1
85. Barker, D.J.P. & Clark, P.M.C. (1997). Fetal undernutrition and disease in later life. Reviews of Reproduction, 2(2), pp. 105-112. DOI: 10.1530/ror.0.0020105
86. Bellini, E. (2025) ‘Longi, Pertamina plan 1.4 GW solar cell, module factory in Indonesia’, PV-Magazine, 24 June. Retrieved from https://www.pv-magazine.com/2025/06/24/longi-pertamina-begin-work-on-1-4-gw-solar-cellmodule-factory-in-indonesia/
87. BERNAMA (2025). AEC Blueprint makes significant stride with implementation rate at a commendable 97 pct –Tengku Zafrul. Retrieved from https://www.bernama.com/en/news.php?id=2426887
88. Bloom, D.E., Cafiero, E.T., Jané-Llopis, E., Abrahams-Gessel, S., Bloom, L.R., Fathima, S., Feigl, A.B., Gaziano, T., Hamandi, A., Mowafi, M., O’Farrell, D., Ozaltin, E., Pandya, A. and Prettner, K. (2011). The Global Economic Burden of Non-communicable Diseases. Geneva: World Economic Forum. Retrieved from https://www3.weforum.org/ docs/WEF_Harvard_HE_GlobalEconomicBurdenNonCommunicableDiseases_2011.pdf
89. Boston Consulting Group (2024) Annual Sustainability Report 2024. Retrieved from https://media-publications.bcg. com/2024-Annual-Sustainability-Report-May-2025.pdf
90. Boston Consulting Group (BCG) (2024) The Next Chapter: Decoding the Future of FMCG in Southeast Asia. Boston Consulting Group. Retrieved from https://www.bcg.com/publications/2024/southeast-asia-next-chapter-decodingthe-future-of-fmcg
91. Boston Consulting Group (BCG), UOB (2023) ASEAN Consumer Sentiment Study 2023. Retrieved from https://www. bcg.com/publications/2023/asean-consumer-sentiment-study
92. Brauman, K. A., Richter, B. D., Postel, S. L., Lehner, B., Conway, D., & Kassam, A. (2013) ‘Water depletion: An improved metric for incorporating seasonal and dry-year water scarcity, Elementa: Science of the Anthropocene, 1:000083.
93. Brown, T. (2018). Education for every child, quality education and life skills. Retrieved from https://www.unicef.org/ cambodia/education
94. Brunei Shell Petroleum (2021) Energy Transition: Renewable Energy at BSP – 3.3 MWp utility-scale solar PV plant. Retrieved from https://www.bsp.com.bn/main/energy-and-innovation/energy-transition
95. Burke, L., Reytar, K., Spalding, M. and Perry, A., 2011. Reefs at Risk Revisited. World Resources Institute. Retrieved from http://pdf.wri.org/reefs_at_risk_revisited.pdf
96. Business Today. (2019). Malaysia-Singapore collaborates in the field of clinical research. Retrieved from https:// www.businesstoday.com.my/2019/03/01/ malaysia-singapore-collaborates-in-the-field-of-clinical-research/
97. Chua, B.H., 2019. Inequality and the social compact in Singapore: Macro trends versus lived realities. Journal of Southeast Asian Economies, 36(3), pp. 355–379.
98. Cirera, X., Mason, A.D., de Nicola, F., Kuriakose, S., Mare, D.S. & Tran, T.T., 2021. The Innovation Imperative for Developing East Asia. Washington, DC: World Bank. Retrieved from https://www.worldbank.org/en/region/eap/ publication/the-innovation-imperative-for-developing-east-asia
99. Clapp, J. & Moseley, W.G. (2020) ‘This Food Crisis is Different: COVID-19 and the Fragility of the Neoliberal Food Security Order’, Journal of Peasant Studies, 47(7), pp. 1393-1417
100. CNA Insider, 2023. Dissolving Aung San Suu Kyi's NLD party makes junta’s election plans less credible: Analysts. Retrieved from https://www.channelnewsasia.com/asia/myanmar-crisis-junta-dissolve-nld-oppositionanalysts-3384346
101. Compound Semiconductor. (2021). A*STAR and STMicroelectronics begin SiC R&D collaboration. Retrieved from https://compoundsemiconductor.net/article/113866/A*STAR_and_STMicroelectronics_begin_SiC_RandD_ collaboration
102. Cook, C. and Bakker, K., 2012. Water security: Debating an emerging paradigm. Global Environmental Change, 22(1), pp. 1-13. Retrieved from https://doi.org/10.1016/j.gloenvcha.2011.10.011
103. Corner, S. (2022, March 16). The state of 5G in Southeast Asia 2022, country-bycountry guide. Network World Asia. Retrieved from https://www.networkworld. com/article/3651672/the-state-of-5g-in-southeast-asia-2022-countrybycountry-guide.html
104. Council on Foreign Relations. (2023). The State of Democracy in Southeast Asia Is Bad and Getting Worse. Retrieved from https://www.cfr.org/article/state-democracy-southeast-asia-bad-and-getting-worse
105. Cowan, C., 2021. Forest loss in mountains of Southeast Asia accelerates at ‘shocking’ pace. Mongabay, 28 June. Retrieved from https://news.mongabay.com/2021/06/forest-loss-in-mountains-of-southeast-asia-accelerates-atshocking-pace/
106. Dao, N. D., Phan, T. H., & Chau, H. M. T. (2022). Tackling Unequal Access to Digital Education in Viet Nam during the COVID-19, Pandemic, 3, 0–17. Retrieved from http://dx.doi.org/10.56506/omlv4181
107. Das, S. B. and B. Narayanan. 2022. ASEAN Education Cooperation: An Assessment of the Education Divide and Measuring the Potential Impact of Its Elimination. ADBI Working Paper 1300. Tokyo: Asian Development Bank Institute. Retrieved from https://www.adb.org/publications/asean-education-cooperation-anassessment-oftheeducation-divide-and-measuring-the-potential-impact-ofits-elimination
108. Economic Development Board Singapore. (2019). Pioneer Certificate Incentive and Development and Expansion Incentive. www.edb.gov.sg 115. Economic Development Board Singapore. (2022a). Innovation nation. Retrieved from https://www.edb.gov.sg/en/business-insights/insights/innovation-nation. html 116.
109. Economic Development Board Singapore. (2022b). World-class talents. Retrieved from https://www.edb.gov.sg/en/ why-singapore/world-class-talent.html 117.
110. Economic Development Board Singapore. (2023). An economic powerhouse Retrieved from e. https://www.edb.gov. sg/en/why-singapore/an-economicpowerhouse.html 118.
111. Economic Development Board. (2019). Pioneer Certificate Incentive and Development And Expansion Incentive. www.edb.gov.sg 119.
112. Economic Development Board. (2022a). World Class talents. Retrieved from https://www.edb.gov.sg/en/whysingapore/world-class-talent.html 120.
113. Economic Development Board. (2022b). Information Communications & Technology. Retrieved from https://www. edb.gov.sg/en/our-industries/ information-and-communications-technology.html 121.
114. Economic Development Board. (2023a). An economic powerhouse. Retrieved from https://www.edb.gov.sg/en/whysingapore/an-economic-powerhouse. html 122.
115. Economic Development Board. (2023b). Innovation. Retrieved from https://www. edb.gov.sg/en/our-industries/ innovation.html 123
116. Economic Development Board. (2023c). Pharmaceuticals & Biotechnology. Retrieved from https://www.edb.gov.sg/ en/our-industries/pharmaceuticalsand-biotechnology.html 124.
117. Economic Development Board. (2023d). Oil & Gas Equipment and Services | EDB. Retrieved from https://www.edb. gov.sg/en/our-industries/oil-and-gasequipment-and-services.html
118. Economic Research Institute for ASEAN and East Asia [ERIA]. (2018). Innovation policy in ASEAN. Retrieved from https://www.eria.org/publications/innovationpolicy-in-asean/
119. Economic Research Institute for ASEAN and East Asia [ERIA]. (2018). Innovation policy in ASEAN. Retrieved from https://www.eria.org/publications/innovationpolicy-in-asean/
120. Economist Impact (2022) Global Food Security Index 2022: Global Report. Retrieved from https://impact.economist. com/sustainability/project/food-security-index/resources/Economist_Impact_GFSI_2022_Global_Report_ Sep_2022.pdf
121. Ember (2024) ASEAN’s Clean Power Pathways: 2024 Insights. 10 October. Retrieved from https://ember-energy. org/latest-insights/asean-insights-2024/
122. Ember (2024) ASEAN’s demand growth continues to outpace renewable growth, but falling clean energy costs offer a way out. 22 October. Retrieved from https://ember-energy.org/latest-updates/aseans-demand-growthcontinues-to-outpace-renewable-growth-but-falling-clean-energy-costs-offer-a-way-out/
123. Emmers, R., 2011. ASEAN and the institutionalization of regional security. Asian Security, 7(3), pp. 292–310.
124. Emmers, R., ed., 2011. ASEAN and the Institutionalization of East Asia. Routledge.
125. Erda, L., et al., 2019. Climate change and agriculture in South Asia: adaptation options in smallholder production systems. Springer. Retrieved from https://link.springer.com/article/10.1007/s10668-019-00414-4
126. ERIA (2024) ‘ASEAN in the Global Economy: A Half-Century Journey’, ERIA News & Views, 2 December. Retrieved from https://www.eria.org/news-and-views/asean-in-the-global-economy--a-half-century-journey
127. ERIA (2025) Strengthening ASEAN’s Cybersecurity. Jakarta: Economic Research Institute for ASEAN and East Asia. Retrieved from https://www.eria.org/uploads/Strengthening-ASEAN-Cybersecurity.pdf
128. ESCAP (2024) 2024 ESCAP Population Data Insights. Retrieved from https://repository.unescap.org/bitstream/ handle/20.500.12870/7687/ESCAP-2024-Population-data-insight.pdf?sequence=1&isAllowed=y.
129. Estoque, R.C., et al., 2019. ASEAN's battle against climate change and biodiversity loss. The ASEAN Magazine. Retrieved from https://theaseanmagazine.asean.org/article/living-in-harmony-with-nature-aseans-battleagainst-climate-change-and-biodiversity-loss/
130. Estoque, R.C., Ooba, M., Avitabile, V., Hijioka, Y., DasGupta, R., Togawa, T., Murayama, Y., Takahashi, K. and Nakamura, S. (2019). The future of Southeast Asia’s forests. Nature Communications, 10, 1829. doi:10.1038/ s41467-019-09646-4.
131. FAO (2025). FAOSTAT: Food Security indicators (visualization tool). Rome: Food and Agriculture Organization of the United Nations. Retrieved from https://www.fao.org/faostat/en/#data/FS/visualize
132. FAO; IFAD; UNICEF; WFP & WHO (2020). The State of Food Security and Nutrition in the World 2020: Transforming food systems for affordable healthy diets. Rome: FAO.
133. Faulder, J. (2021) ‘How a year without fire became a month of haze in Southeast Asia’. Mekong Region Futures Institute. Retrieved from https://www.mrfi.co/how-a-year-without-fire-became-a-month-of-haze-in-southeastasia/.
134. Food and Agriculture Organization (FAO) (2013) Smallholders and Family Farmers: Factsheet. Rome: FAO. Retrieved from https://openknowledge.fao.org/items/1dd8c6ba-0f86-4e89-a850-5d7e31dea44e
135. Food and Agriculture Organization (FAO) (2018) The State of Food Security and Nutrition in the World 2018: Building climate resilience for food security and nutrition. Rome: FAO. Retrieved from https://openknowledge.fao.org/ handle/20.500.14283/I9553EN
136. Food and Agriculture Organization of the United Nations; OECD; World Bank (2025) Annual freshwater withdrawals, total (2021) [Dataset]. Processed by Our World in Data. Retrieved from https://ourworldindata.org/grapher/annualfreshwater-withdrawals
137. Gedan, K.B., Silliman, B.R. and Bertness, M.D., 2011. Centuries of human-driven change in salt marsh ecosystems. Annual Review of Marine Science, 3, pp.117–141. Retrieved from https://www.annualreviews.org/content/ journals/10.1146/annurev.marine.010908.163930
138. Gentari (2025) ‘AWS signs 80 MW PPA with Gentari in Tamil Nadu, India’, Data Center Dynamics, 5 August. Retrieved from https://www.gentari.com/insight/gentari-and-aws-ink-80mw-wind-energy-deal-to-accelerate-net-zerogoals
139. Gentari (2025) ‘Gentari powers TM’s key operations with solar energy. 8 May. Retrieved from https://www.gentari. com/insight/gentari-powers-tms-key-operations-with-solar-energy
140. Gentari (2025) Renewable energy solutions. Retrieved from https://www.gentari.com/businesses/renewableenergy
141. Global Carbon Atlas, 2023. CO₂ Emission by Country, 2021. Retrieved from https://globalcarbonatlas.org/
142. Google, Temasek & Bain & Company (2024) e-Conomy SEA 2024: Profits on the Rise, Harnessing SEA’s Advantage. Retrieved from https://www.temasek.com.sg/content/dam/temasek-corporate/news-and-views/resources/ reports/e_Conomy_SEA_2024_report.pdf
143. Gupta, S., 2021. Entrepreneurship Education: Promoting Economic Growth and Development. Retrieved from https://www.researchgate.net/publication/379750812_Entrepreneurship_Education_Promoting_Economic_ Growth_Development
144. Guzman, R., 2022. Marine plastic pollution and climate change: regional and national action in Southeast Asia. Heinrich Böll Foundation. Retrieved from https://th.boell.org/en/2022/03/07/marine-plastic-pollution-seasia
145. Heng, R., 2008. The ASEAN Preferential Trading Arrangements: An Analysis of Potential Effects on Intra-ASEAN Trade. Retrieved from https://dokumen.pub/the-asean-preferential-trading-arrangements-pta-an-analysis-ofpotential-effects-of-intra-asean-trade-9789814377539.html
146. Hijioka, Y., Lin, E., Pereira, J.J., Corlett, R.T., Cui, X., Insarov, G.E., Lasco, R., Lindgren, E. & Surjan, A. (2014) ‘Asia’, in Barros, V.R., Field, C.B., Dokken, D.J., Mastrandrea, M.D., Mach, K.J., Bilir, T.E., Chatterjee, M., Ebi, K.L., Estrada, Y.O., Genova, R.C., Girma, B., Kissel, E.S., Levy, A.N., MacCracken, S., Mastrandrea, P.R. & White, L.L. (eds.) Climate Change 2014: Impacts, Adaptation, and Vulnerability. Part B: Regional Aspects. Contribution of Working Group II to the Fifth Assessment Report of the Intergovernmental Panel on Climate Change. Cambridge and New York: Cambridge University Press, pp. 1327-1370.
147. Hijioka, Y., Lin, E., Pereira, J.J., et al., 2014. Climate change 2014: Impacts, adaptation, and vulnerability. Part B: Regional aspects. Contribution of Working Group II to the Fifth Assessment Report of the Intergovernmental Panel on Climate Change. Cambridge University Press. Retrieved from https://www.researchgate.net/ publication/318852183_Climate_Change_2014_Impacts_adaptation_and_vulnerability_Part_B_Regional_ aspects_Contribution_of_Working_Group_II_to_the_Fifth_Assessment_Report_of_the_IPCC
148. Hoekstra, A.Y. & Mekonnen, M.M. (2012) ‘The Water Footprint of Humanity’, Proceedings of the National Academy of Sciences, 109(9), pp. 3232-3237.
149. Human Rights Watch, 2021. World Report 2021: Malaysia. Retrieved from https://www.hrw.org/world-report/2021/ country-chapters/malaysia
150. Human Rights Watch, 2022. World Report 2022: Malaysia. Retrieved from https://www.hrw.org/world-report/2022/ country-chapters/malaysia
151. Human Rights Watch, 2022. World Report 2022: Singapore. Retrieved from https://www.hrw.org/world-report/2022/ country-chapters/singapore
152. Human Rights Watch, 2025. World Report 2025: Myanmar. Retrieved from https://www.hrw.org/world-report/2025/ country-chapters/myanmar
153. Human Rights Watch. (2022). Human Rights Watch Submission to the UN Human Rights Committee in advance of its review of Sri Lanka. Retrieved from https://www.hrw.org/news/2022/06/01/human-rights-watch-submissionun-human-rights-committee-advance-its-review-sri
154. IBM / Ponemon Institute (2023) Cost of a Data Breach Report 2023. IBM Security. Retrieved from https:// d110erj175o600.cloudfront.net/wp-content/uploads/2023/07/25111651/Cost-of-a-Data-Breach-Report-2023.pdf
155. IBM Security (2023) “Record high data breach costs: ASEAN & Malaysia businesses face USD $3.05M impact”, Cybersecurity Asia, 27 July. Retrieved from https://cybersecurityasia.net/record-high-data-breach-costs-aseanmalaysia-businesses-face-usd-3-05m-impact/
156. Ibrahim, J. (2023, January 19). TVET could help reduce unemployment, says MEF. The Star. https://www.thestar. com.my/news/nation/2023/01/19/tvetcould-help-reduce-unemployment-says-mef
157. Indonesia Investment. (2016). Governance in Indonesia. Retrieved from https:// www.indonesia-investments.com/ business/risks/governance/item242
158. Indonesia Investments (2025) ‘Indonesia pushes local power projects to expand electricity access in remote areas’, Jakarta Globe, 23 July. Retrieved from https://jakartaglobe.id/news/indonesia-pushes-local-power-projects-toexpand-electricity-access-in-remote-areas
159. Ingrao, C., Strippoli, R., Lagioia, G., & Huisingh, D. (2023). Water scarcity in agriculture: An overview of causes, impacts and approaches for reducing the risks. Heliyon, 9(8). https://doi.org/10.1016/j.heliyon.2023.e18507
160. Inland Revenue Authority of Singapore. (2022). Research & Development (R&D) tax measures. Retrieved from https://www.iras.gov.sg/taxes/corporateincome-tax/income-deductions-for-companies/business-expenses/ researchdevelopment-(r-d)-tax-measures
161. Innovation for Sustainable Development Network. (2019). Tax breaks for green investments in Cambodia. Retrieved from https://www.inno4sd.net/
162. Institute for Energy Economics and Financial Analysis (IEEFA), 2024. Bridging the Financing Gap to Triple Renewable Energy Capacity. Retrieved from https://ieefa.org/resources/bridging-financing-gap-triple-renewableenergy-capacity
163. International Crisis Group, 2019. 10 Conflicts to Watch in 2019. Retrieved from https://www.crisisgroup.org/ global/10-conflicts-watch-2019
164. International Energy Agency (2023) Southeast Asia Energy Outlook 2023. Paris: IEA
165. International Energy Agency (2024) World Energy Investment 2024. Paris: IEA
166. International Labour Organization (2024) World Social Protection Report 2024: Social Protection at the Crossroads in Pursuit of a Better Future. Geneva: ILO. Retrieved from https://www.ilo.org/sites/default/files/2024-09/ WSPR_2024_EN_WEB_1.pdf
167. International Labour Organization (ILO), 2023. The impact of care responsibilities on women’s labour force participation. Retrieved from https://www.ilo.org/publications/impact-care-responsibilities-women%25s-labourforce-participation
168. International Labour Organization (ILO). (2022). Measuring Labour Migration in ASEAN: Analysis from the ILO’s International Labour Migration Statistics (ILMS) Database. Retrieved from https://ilostat.ilo.org/topics/labourmigration/
169. International Labour Organization Statistics (ILOSTAT) (2025) ILOSTAT Database. Geneva: International Labour Organization. Retrieved from https://rshiny.ilo.org/dataexplorer26/?lang=en&segment=indicator&id=EMP_NIFL_ SEX_AGE_EDU_NB_A
170. International Labour Organization, 2025. Generative AI and Jobs: A Refined Global Index of Occupational Exposure. Geneva: ILO. Retrieved from https://www.ilo.org/publications/generative-ai-and-jobs-refined-global-indexoccupational-exposure
171. International Monetary Fund (IMF). (2018). ASEAN progress towards Sustainable Development Goals and the role of the IMF. Retrieved https://www.imf.org/en/Publications/Policy-Papers/Issues/2018/11/07/pp101118aseanprogress-towards-sdgs
172. International Monetary Fund [IMF]. (2021). Timor-Leste: 2021 article iv consultation-press release; staff report; and statement by the executive director for Timor-Leste. Retrieved from https://www.elibrary.imf.org/configurable/ content/journals$002f002$002f2021$002f152$002farticle-A001-en.xml?t:ac=jo urnals%24002f002%24002f2021% 24002f152%24002farticle-A001-en.xml
173. International Organization for Migration (IOM), 2019. World Migration Report 2020. Retrieved from https:// publications.iom.int/system/files/pdf/wmr_2020.pdf
174. International Telecommunication Union (ITU) (2023) Measuring digital development: Facts and Figures 2023. Geneva: ITU. Retrieved from https://www.itu.int/itu-d/reports/statistics/facts-figures-2023/
175. International Trade Administration. (2022). Singapore healthcare. https://www. trade.gov/country-commercialguides/singapore-healthcare
176. IQAir, 2024. World Air Quality Report 2024. Retrieved from https://www.iqair.com/world-most-polluted-countries
177. IQAir, 2025. 2024 World Air Quality Report. Retrieved from https://www.iqair.com/newsroom/waqr-2024-pr
178. Jackson, J.B.C., Kirby, M.X., Berger, W.H., Bjorndal, K.A., Botsford, L.W., Bourque, B.J., Bradbury, R.H., Cooke, R.G., Erlandson, J.M., Estes, J.A., Tegner, M.J. and Warner, R.R., 2001. Historical overfishing and the recent collapse of coastal ecosystems. Science, 293(5530), pp.629-637. Retrieved from https://pubmed.ncbi.nlm.nih.gov/11474098/
179. Jalli, N., 2020. Lack of internet access in Southeast Asia poses challenges for students to study online amid COVID-19 pandemic. Phys.org. Retrieved from https://phys.org/news/2020-03-lack-internet-access-southeastasia.html
180. Jones, D.M., 2005. Making Process, Not Progress: ASEAN and the Evolving East Asian Regional Order. Asian Security, 1(2), pp. 1–31. DOI:10.1162/isec.2007.32.1.148
181. Jones, T., Ram, M. & Villares-Rodriguez, M. (2019). Diversity, economic development and new migrant entrepreneurs. Work, Employment and Society, 33(2), 345–365 https://doi.org/10.1177/0042098018765382
182. Kahn, M.E., 2022. Why the cost of mitigating climate change can’t be boiled down to one right number, despite some economists’ best attempts. USC Dornsife College of Letters, Arts and Sciences. Retrieved from https://dornsife. usc.edu/news/stories/ever-changing-cost-of-climate-change/
183. Kao, S., & Shimizu, K. (2020). A review on STEM enrollment in higher education of cambodia: Current status, issues, and implications of initiatives. Journal of International Development and Cooperation, 26(1), 123–134. Retrieved from https://www.researchgate.net/publication/339815574
184. Kearney (2024) ‘Solving Southeast Asia’s looming fertility crisis: IVF as a path toward hope’, Kearney. Retrieved from https://www.kearney.com/industry/health/article/solving-southeast-asia-s-looming-fertility-crisis-ivf-as-apath-toward-hope
185. Keskinen, M., Guillaume, J. H. A., Kattelus, M., Porkka, M., Räsänen, T. A. & Varis, O. (2016) ‘The water-energy-food nexus and the transboundary context: Insights from large Asian rivers’, Water, 8(5), article no. 193. doi:10.3390/ w8050193.
186. Keskinen, M., Guillaume, J.H.A., Kattelus, M., Porkka, M., Räsänen, T.A. and Varis, O., 2016. The water-energy-food nexus and the transboundary context: Insights from large Asian rivers. Water, 8(5), p.193. https://doi.org/10.3390/ w8050193
187. Khan, M.F.H., 2003. The Treaty of Amity and Cooperation in Southeast Asia: A Critical Appraisal. Asian Journal of Comparative Politics, 1(1), pp. 45–60.
188. Khan, M.H., 2003. Political Economy of Corruption. In: A. Jain, ed., The Political Economy of Corruption. Routledge, pp. 1–29.
189. Khmer Times (2023) '92 pct of households in Cambodia get access to electricity', Khmer Times. Retrieved from https://www.khmertimeskh.com/501268277/92-pct-of-households-in-cambodia-get-access-to-electricity/
190. Lai, O., 2022. Deforestation in Southeast Asia: Causes and Solutions. Earth.Org. Retrieved from https://earth.org/ deforestation-in-southeast-asia/
191. Lam, V.W.Y., Cheung, W.W.L., Reygondeau, G. and Sumaila, U.R. (2015) ‘Projected change in global fisheries revenues under climate change’, Scientific Reports, 6, p. 32607.
192. Lanvin, B., & Monteiro, F. (2022). The Global Talent Competitiveness Index 2022 - The tectonics of talent: Is the world drifting towards increased talent inequalities? Accenture. Retrieved from https://www.insead.edu/sites/ default/ files/assets/dept/fr/gtci/GTCI-2022-report.pdf
193. Le, Q.B., et al., 2019. Exploring sustainable solutions for the water environment in Southeast Asia. Environmental Science & Policy, 101, pp. 1–12. Retrieved from https://www.sciencedirect.com/science/article/pii/ S096456912500105X
194. Legatum Institute. (2025). The Legatum Prosperity Index 2025. Retrieved from https://docs.prosperity. com/2616/7736/3001/The_Prosperity_Index_Rankings_Table_2023.pdf
195. Lim, M.A., Anabo, I.F., Phan, A.N.Q., Elepaño, M.A. & Kuntamarat, G., Year. The state of higher education in Southeast Asia. Retrieved from https://asean.org/wp-content/uploads/2023/08/The-State-of-Higher-Educationin-Southeast-Asia_11.2022.pdf
196. Lim, M.Y., et al., 2023. 'Health financing challenges in Southeast Asian countries for universal health coverage: a systematic review', Archives of Public Health, 81(148). Retrieved from https://archpublichealth.biomedcentral.com/ articles/10.1186/s13690-023-01159-3
197. Liu, Y., et al., 2024. 'Health system efficiency and equity in ASEAN: an empirical investigation', Resource Allocation in Health, 22(86). Retrieved from https://resource-allocation.biomedcentral.com/articles/10.1186/s12962-02400588-3
198. Mahendradhata, Y., Andayani, N. L. P. E., Hasri, E. T., Arifi, M. D., Siahaan, R. G. M., Solikha, D. A., & Ali, P. B. (2021). The capacity of the Indonesian healthcare system to respond to COVID-19. Frontiers in Public Health, 9. doi:10.3389/ fpubh.2021.649819
199. Malaysian Investment Development Authority. (2019). Research And Development (R&D) Services. Retrieved from https://www.mida.gov.my/wpcontent/uploads/2020/07/20200309090703_BOOKLET-3-RESEARCHANDDEVELOPMENT-RD-SERVICES.pdf
200. Manila Times (2022, January 24). Persuade more learners to take up STEM courses. Retrieved from https://www. pids.gov.ph/details/persuade-morelearners-to-take-up-stem-courses
201. McKinsey & Company (2024) ‘Nine key consumer trends in 2024’, McKinsey & Company. Retrieved from https:// www.mckinsey.com/industries/consumer-packaged-goods/our-insights/state-of-consumer-2024
202. McKinsey Global Institute (2024) The Next Big Arenas of Competition. McKinsey & Company. Retrieved from https:// www.mckinsey.com/~/media/mckinsey/mckinsey%20global%20institute/our%20research/the%20next%20big%20 arenas%20of%20competition/the-next-big-arenas-of-competition_final.pdf
203. Mekong River Commission (2019) ‘Flood and Drought’, Mekong River Commission. Retrieved from https://www. mrcmekong.org/flood-and-drought
204. Menon, J. and Simorangkir, R. (2001). ASEAN and the Asian Financial Crisis: A Study of the Responses of ASEAN Member Countries. Asian Development Bank.
205. Ministry of Economic Affairs. (2018). Mid-term review of the eleventh Malaysia Plan 2016 – 2020: New priorities and emphases. Retrieved from https://ekonomi.gov.my/sites/default/files/2020-08/3.%20Overview.pdf
206. Ministry of Health Singapore. (2023). Caregivers grant & subsidies. Retrieved from https://www.moh.gov.sg/costfinancing/healthcare-schemes-subsidies/ caregiver-grants-subsidies
207. Ministry of Industry, Science, Technology & Innovation [MISTI]. (2023). National Research Agenda. Retrieved from https://www.misti.gov.kh/public/ file/202302191676819231.pdf
208. Ministry of Science, Technology and Innovation [MOSTI]. (2022). Research and Development Grants. Retrieved from https://mastic.mosti.gov.my/sti/incentives/ rnd-grants
209. Moonpa, N., Phalasoon, S., Gulich, J., & Beecker, P. (2019). Approaches and structures of work-related learning in TVET in Thailand. In: TVET@Asia, issue 13, 1-19. Retrieved from https://tvet-online.asia/wp-content/ uploads/2020/03/ Phalasoon-et-al.-BLOCKSATZ-PDF.pdf
210. Morrell, J. (2020). The importance of transparent and accountable public-private partnerships in Burma. Retrieved from https://www.cipe.org/blog/2020/09/03/ the-importance-of-transparent-and-accountable-public-privatepartnershipsin-burma/
211. Nair, M. (2011). Inclusive innovation and sustainable development: leap-frogging strategies to a high income economy. ICT Strategic Review, 2012, 225-257. 286.
212. Nair, M., Ahmed, P. K., & Vaithilingam, S. (2022). Values-Based Development and Competitiveness: A Conceptual Analysis (No. 2022-001 PB; IGSC Policy Brief). Sunway Institute for Global Strategy and Competitiveness.
213. Narayan, S., Beck, M.W., Reguero, B.G., et al., 2016. The effectiveness, costs and coastal protection benefits of natural and nature-based coastal defenses. PLOS ONE, 11(5), e0154735. Retrieved from https://journals.plos.org/ plosone/article?id=10.1371/journal.pone.0154735
214. National Institute on Aging (2021) Social Isolation and Loneliness in Older Adults: Opportunities for the Health Care System. Bethesda, MD: National Institute on Aging. Retrieved from https://www.ncbi.nlm.nih.gov/books/ NBK557972/
215. National Research Foundation Singapore, 2021. Innovation and Enterprise: Strengthening Industry Partnerships
216. National Research Foundation. (2021). RIE 2025 Plan. Retrieved from https:// www.nrf.gov.sg/rie2025-plan
217. New Straits Times. (2021, October 29). Malaysia’s performance in government effectiveness is above regional peers. Retrieved from https://www.nst.com. my/news/nation/2021/10/740937/malaysias-performancegovernmenteffectiveness-above-regional-peers
218. NOAA, 2020. Ocean pollution and marine debris. Retrieved from https://www.noaa.gov/education/resourcecollections/ocean-coasts/ocean-pollution
219. Nordic Development Fund. (n.d.). Climate resilient roads - Cambodia rural roads improvement project: results from climate change adaptation. chromeextension://efaidnbmnnnibpcajpcglclefindmkaj/https://www.ndf.int/media/ project-files/cambodia-rural-roads-improvement-project-results-fromclimate-change-adaptation.pdf
220. OECD & FAO (2017) OECD-FAO Agricultural Outlook 2017-2026. Paris/Rome: OECD/FAO. Retrieved from https:// www.oecd.org/en/publications/2017/07/oecd-fao-agricultural-outlook-2017-2026_g1g7a2da.html
221. OECD & FAO (2024) OECD-FAO Agricultural Outlook 2024-2033. Paris/Rome: OECD/FAO. Retrieved from https:// www.oecd.org/en/publications/2024/07/oecd-fao-agricultural-outlook-2024-2033_e173f332.html
222. OECD (2020) OECD Digital Economy Outlook 2020. Paris: OECD Publishing. Retrieved from https://www.oecd.org/ en/publications/2020/11/oecd-digital-economy-outlook-2020_3f7b7e58.html
223. OECD (2021) Vocational Education and Training in Thailand. Retrieved from https://www.oecd.org/en/publications/ vocational-education-and-training-in-thailand_cc20bf6d-en.html
224. OECD. (2017). OECD Investment Policy Reviews: Lao PDR. OECD Investment Policy Reviews, OECD Publishing, Paris. Retrieved from http://dx.doi. org/10.1787/9789264276055-en
225. OECD. (2018). Thailand has relatively low proportion of students enrolled in STEM courses. Multi-dimensional Review of Thailand (Volume 1). Retrieved from https://www.oecd-ilibrary.org/development/multi-dimensionalreviewof-thailand-volume-1/thailand-has-a-relatively-low-proportion-of-studentsenrolled-in-stemcourses_9789264293311-graph30-en
226. OECD. (2022). Open and connected government review of Thailand. Retrieved from https://www.oecd-ilibrary.org/ governance/open-and-connected-governmentreview-of-thailand_e1593a0c-en
227. OECD (2023) PISA 2022 Results (Volume I). OECD Publishing. Retrieved from https://www.oecd.org/en/publications/ pisa-2022-results-volume-i_53f23881-en.html
228. OECD/ADB. (2019). Government at a glance - Southeast Asia 2019. Retrieved from https://www.adb.org/sites/ default/files/publication/518351/governmentglance-southeast-asia-2019.pdf
229. Ombay, G. (2023, January 30). VP Sara: Lack of school facilities still basic education’s main problem. GMA News. Retrieved from https://www.gmanetwork. com/news/topstories/nation/859083/vp-sara-lack-of-school-facilitiesstillbasic-education-s-main-problem/story/
230. Oo, Z., Joelene, C., Minoletti, P., Phyu, P., Pyar, K., Saw, C., … Smurra, A. (2015). Fiscal management in Myanmar. Retrieved from www.adb.org
231. Oottamakorn, C., Techateerawat, P., & Thetbanthad, P. (2019). Rural and remote broadband development in Thailand: Enabled by last-mile infrastructures and services. International Transaction Journal of Engineering, Management, & Applied Sciences & Technologies, 10A13E. Retrieved from https://tuengr.com/ V10A/10A13E.pdf
232. Our World in Data (n.d.) Dietary compositions by commodity group for Malaysia, Brunei, Vietnam, Thailand, Philippines, Myanmar, Laos, Indonesia and Cambodia. Retrieved from https://ourworldindata.org/grapher/dietarycompositions-by-commodity-group?country=MYS~BRN~VNM~THA~PHL~MMR~LAO~IDN~KHM&overlay=downlo ad-vis
233. Overland, I., Putra, B.A., & Beh, L.S., 2021. ASEAN's climate change mitigation and adaptation measures. Frontiers in Climate. Retrieved from https://www.frontiersin.org/journals/climate/articles/10.3389/fclim.2024.1488560/full
234. Oxford Research Group, 2018. ASEAN, social conflict and intervention in Southeast Asia. Retrieved from https://ora. ox.ac.uk/objects/uuid:c17c8000-e2f2-46c2-a421-5a94a94bea0d
235. Paryono, 2021. Skilled workforce in ASEAN region: Issues, challenges, and opportunities. Retrieved from https:// sea-vet.net/images/seb/e-library/doc_file/1058/paryonoparyono.pdf
236. Pharmaceutical Technology. (2022). RVAC Medicines, A*STAR partner for mRNA manufacturing expertise. Retrieved from https://www.pharmaceutical-technology.com/news/rvac-astar-mrna-manufacturing/
237. Poindexter, D. (2017). Project begins to improve road infrastructure in Laos. Retrieved from https://borgenproject. org/infrastructure-in-laos/
238. Popkin, B. M., Adair, L. S. & Ng, S. W. (2012). Global nutrition transition and the pandemic of obesity in developing countries. Nutrition Reviews, 70(1), pp. 3-21. Retrieved from https://pubmed.ncbi.nlm.nih.gov/22221213/
239. Prevost, C., Thapa, D., & Roberts, M. (2020, February 17). Cities without sewers - solving Indonesia’s wastewater crisis to realise its urbanisation potential. World Bank Blogs. Retrieved from https://blogs.worldbank.org/ eastasiapacific/citieswithout-sewers-solving-indonesias-wastewater-crisis-realize-its-urbanization
240. PwC (2024) Consumers willing to pay 9.7% sustainability premium, even as cost-of-living and inflationary concerns weigh: Voice of the Consumer Survey 2024. PwC. Retrieved from https://www.pwc.com/gx/en/news-room/pressreleases/2024/pwc-2024-voice-of-consumer-survey.html
241. PwC (2024) Voice of the Consumer Survey 2024. Retrieved from https://www.pwc.com/gx/en/issues/c-suiteinsights/voice-of-the-consumer-survey/2024.html
242. PwC Malaysia (2023) The National Energy Transition Roadmap (NETR): Driving Malaysia’s green growth. PwC Malaysia. Retrieved from https://www.pwc.com/my/en/publications/2023/malaysia-national-energy-transitionroadmap-netr-summary.html
243. PwC Singapore, 2017. Understanding infrastructure opportunities in ASEAN: Infrastructure Series Report 1. Retrieved from https://www.pwc.com/sg/en/publications/assets/cpi-mas-1-infrastructure-opporuntities-inasean-201709.pdf
244. Qu, T. (2024) ‘Thailand’s PTTEP plans investment to boost core assets, spur development projects’, Wall Street Journal, 20 December. Retrieved from https://www.wsj.com/business/energy-oil/thailands-pttep-plansinvestment-to-boost-core-assets-spur-development-projects-9af3638a
245. Ranis, G., Stewart, F., & Ramirez, A. (2019). Poverty Reduction in ASEAN Member States. Journal of Economic Development Studies, 10(1), 1–16. Retrieved from https://jeds.thebrpi.org/journals/jeds/Vol_10_No_1_ June_2022/4.pdf
246. Renewable Energy Institute (2023) Renewable Energy: The Top-Priority for Southeast Asia to Fully Abandon Coal. Retrieved from https://www.renewable-ei.org/pdfdownload/activities/REI_SEA2023_EN.pdf
247. Reuters (2025a). China pushing ASEAN to seal trade pact upgrade as US tariffs bite. Retrieved from https://www. reuters.com/world/china/china-pushing-asean-seal-trade-pact-upgrade-us-tariffs-bite-2025-09-08/
248. Reuters (2025b). China, ASEAN complete negotiations on upgraded free trade deal. Retrieved from https://www. reuters.com/markets/emerging/china-asean-complete-negotiations-free-trade-area-30-2025-05-21/
249. Reuters, 2024. Climate change putting Philippines at double risk of typhoons, scientists say. Retrieved from https:// www.reuters.com/world/asia-pacific/climate-change-putting-philippines-double-risk-typhoons-scientistssay-2024-12-12
250. Reuters. (2022). Myanmar's year of turmoil since the military took power in a coup. Retrieved from https://www. reuters.com/world/asia-pacific/myanmars-year-turmoil-since-military-took-power-coup-2022-01-25/
251. Rigg, Jonathan (2006) “Land, farming, livelihoods, and poverty: Rethinking the links in the Rural South” in World Development, Vol. 34, Issue 1, pp. 180-202. This article discusses how population pressures, rural-urban migration, and the changing role of farming impact livelihoods and poverty in Southeast (and more broadly South) Asia.
252. Romero, J. (2021). PH gov’t still ‘very far’ from achieving wider internet access: dev’t study agency. Retrieved from https://news.abs-cbn.com/spotlight/11/11/21/ wider-internet-access-in-ph-still-a-problem-devt-study-agencysays
253. Santos, R., et al., 2018. Runoff and sediment response to deforestation in a large Southeast Asian basin. Science of the Total Environment, 635, pp. 1234–1245. Retrieved from https://www.sciencedirect.com/science/article/pii/ S0022169422000075
254. Shah, S., Abbas, G., Riaz, N., Rehman, A. U., Hanif, M. & Rasool, M. F. (2020). Burden of communicable diseases and cost of illness: Asia Pacific region. Expert Review of Pharmacoeconomics & Outcomes Research. Retrieved from https://pubmed.ncbi.nlm.nih.gov/32530725/
255. SHAPE-SEA / Sida / FCG Sweden (2020) Evaluation of SHAPE-SEA: Strengthening Human Rights and Peace Research and Education in ASEAN/Southeast Asia. Bangkok: SHAPE-SEA / Institute of Human Rights and Peace Studies, Mahidol University, Retrieved from https://cdn.sida.se/publications/files/sida62371en-evaluation-ofshape-sea.pdf
256. Smart Nation and Digital Government Office. (2023). Digital Society. Retrieved from https://www.smartnation.gov. sg/about-smart-nation/digital-society/
257. Sodhi, N.S., Posa, M.R.C., Lee, T.M., et al., 2010. The state and conservation of Southeast Asian biodiversity. Biodiversity and Conservation, 19, pp.317–328.
258. Soucat, A., Kumaranayake, L., & Pablos-Mendez, A. (2018). The role of health financing in meeting the SDGs. International Journal of Health Policy and Management, 7(11), 961-964. DOI: 10.15171/ijhpm.2018.93
259. Spiess, R. (2017). Cambodia facing a dilemma on plan to give roads a facelift. Retrieved from https://www. phnompenhpost.com/business/cambodia-facingdilemma-plan-give-roads-facelift
260. Stewart, F. (2015). Horizontal Inequalities as a Cause of Conflict. World Bank. Retrieved from https://openknowledge. worldbank.org/collections/75b787df-8d88-5030-bf53-827c6c810601
261. Storey, I., 2011. Southeast Asia and the Rise of China: The Search for Security. London and New York: Routledge.
262. Tan, T.H., 2011. The ASEAN Journey: Reflections of ASEAN Leaders and Officials. Jakarta: ERIA.
263. Temasek, 2024. e-Conomy SEA 2024: Profitability push in Southeast Asia's digital economy. Retrieved from https://www.temasek.com.sg/en/news-and-resources/news-room/news/2024/-e-conomy-sea-2024-report-profitability-push-in-southeast-asia-
264. Teo, V., & Tai, N, T. (2021, January 30). Incentives for Foreign Investors in Vietnam. Bloomberg Tax. Retrieved from https://news.bloombergtax.com/dailytax-report-international/incentives-for-foreign-investors-in-vietnam
265. The ASEAN Secretariat (2022) ASEAN Policy Brief on Safe School Reopening, Learning Recovery and Continuity. Retrieved from https://asean.org/wp-content/uploads/2022/04/ASEAN-Policy-Brief-on-Safe-School-Reopening_ FIN.pdf
266. The Commonwealth (2023) Global Youth Development Index Update Report 2023. The Commonwealth Secretariat. Retrieved from https://thecommonwealth.org/publications/global-youth-development-index-update-report-2023/ youth-development-index-glance
267. The Global Economy (2024) 'Health spending per capita by country, around the world', The Global Economy. Retrieved from https://www.theglobaleconomy.com/rankings/health_spending_per_capita
268. The Global Economy (2024) 'Life expectancy in South East Asia', The Global Economy. Retrieved from https://www. theglobaleconomy.com/rankings/life_expectancy/South-East-Asia/
269. The Global Economy, 2024. Female labor force participation in ASEAN. Retrieved from https://www. theglobaleconomy.com/rankings/Female_labor_force_participation/ASEAN
270. Transparency International, 2024. Corruption Perceptions Index 2024. Retrieved from https://www.transparency. org/en/cpi/2024/index/mmr
271. Transparency International. (2022). Corruption Perceptions Index 2022. Retrieved from https://www.transparency. org/en/cpi/2022
272. Trotsenburg, A.V. & Lim, J.H., 2022. Turning the tide on plastic pollution through regional collaboration in Southeast Asia. World Bank Blogs. Retrieved from https://blogs.worldbank.org/en/eastasiapacific/turning-tide-plasticpollution-through-regional-collaboration-southeast-asia
273. UK Met Office (2025) Past and future sea level rise. Retrieved from (https://weather.metoffice.gov.uk/climatechange/organisations-and-reports/past-and-future-sea-level-rise)
274. UNCAC Coalition, 2024. Civil Society Parallel Reports on UNCAC Implementation: Cambodia. Retrieved from https://uncaccoalition.org/
275. UNESCO, 2018. Tracking Progress Towards Inclusive, Safe, Resilient Cities. Retrieved from https://uis.unesco.org/ sites/default/files/documents/sdg11-synthesis-report-2018-en.pdf
276. UNHCR, 2016. Frequently Asked Questions on Climate Change and Disaster Displacement. Retrieved from https:// www.unhcr.org/my/news/stories/frequently-asked-questions-climate-change-and-disaster-displacement
277. UNICEF (2021) Towards Ending Child Marriage: Global Trends and Profiles of Progress. Retrieved from https://data. unicef.org/wp-content/uploads/2021/11/Towards-Ending-Child-Marriage-report-2021.pdf
278. UNICEF, 2021. Global Annual Results Report 2021: Goal Area 2 – Education and Skills. Retrieved from https://www. unicef.org/media/142921/file/Global%20annual%20results%20report%202021%3A%20Goal%20area%202.pdf
279. United Nations Department of Economic and Social Affairs Population Division (2017) Perspectives on Population Ageing in the Asia-Pacific Region. Retrieved from https://asiapacific.unfpa.org/en/publications/perspectivespopulation-ageing-asia-pacific-region
280. United Nations Development Programme (UNDP) (1993) Human Development Report 1993: People’s Participation. New York: Oxford University Press. Retrieved from https://hdr.undp.org/content/human-development-report-1993
281. United Nations Development Programme (UNDP) (2022) Human Development Report 2021-22: Uncertain Times, Unsettled Lives: Shaping Our Future in a Transforming World. New York: United Nations Development Programme. Retrieved from https://hdr.undp.org/content/human-development-report-2021-22
282. United Nations Economic and Social Commission for Asia and the Pacific (UNESCAP), 2023. Trends in social development: the future of work in Asia and the Pacific. Retrieved from https://repository.unescap.org/ items/6a878c06-81b8-47b1-855d-155020373339
283. United Nations ESCAP/DRI. (2020). Co-creating Myanmar’s science, technology and innovation policy: National consultation. Retrieved from https://artnet. unescap.org/sti/events/co-creating-myanmar-sti-policy-nationalconsultation
284. United Nations Foundation (2020) ‘Climate Change and the Future of Food’. Retrieved from https://unfoundation. org/blog/post/climate-change-and-the-future-of-food/
285. United Nations Industrial Development Organization (UNIDO), 2023. Industrial Development Report 2022. Retrieved from https://www.unido.org/idr2022
286. United Nations, 2020. World Youth Report 2020: Youth Social Entrepreneurship and the 2030 Agenda. Retrieved from https://www.un.org/development/desa/youth/wp-content/uploads/sites/21/2020/07/2020-World-YouthReport-FULL-FINAL.pdf
287. United Nations, Department of Economic and Social Affairs, Population Division (2025) World Population Prospects 2024. New York: United Nations. Retrieved from https://population.un.org/wpp/
288. USAID. (2022). Timor-Leste: Powering information communication technology. chrome-extension:// efaidnbmnnnibpcajpcglclefindmkaj/https://pdf.usaid.gov/ pdf_docs/PA00ZSXB.pdf
289. Victora, C.G., Adair, L., Fall, C., Hallal, P.C., Martorell, R., Richter, L. & Sachdev, H.S.; for the Maternal and Child Undernutrition Study Group (2008). Maternal and child undernutrition: consequences for adult health and human capital. The Lancet, 371(9609), pp. 340-357.
290. Vietnam Plus. (2022, October 13). Degraded infrastructure, lack of investment affects health services in HCM City. Retrieved from https://en.vietnamplus.vn/ degraded-infrastructure-lack-of-investment-affects-health-servicesin-hcmcity/240010.vnp
291. Vörösmarty, C.J., McIntyre, P.B., Gessner, M.O., Dudgeon, D., Davies, P.M., Reidy Liermann, C.A., et al., 2010. Global threats to human water security and river biodiversity. Nature, 467(7315), pp.555–561. Retrieved from https://www. nature.com/articles/nature09440
292. Wibowo, R. A., Myau-Lyau, N., Christy, N. N. A., & Albert. (2022). The challenges for indonesia to integrate dual vocational education and training system. Journal of Technical Education and Training, 14(2 Special Issue), 79–90. doi:10.30880/ jtet.2022.14.02.008
293. WIPO. (2022). GII 2022 at a glance. Retrieved from https://www.wipo.int/edocs/ pubdocs/en/wipo-pub-2000-2022section1-en-gii-2022-at-a-glance-globalinnovation-index-2022-15th-edition.pdf
294. Wood Mackenzie (2024) Asia LCOE: Solar PV costs fall 23% in 2023, with utility – scale PV emerging as cheapest power source in most markets. 29 February. Retrieved from https://www.woodmac.com/press-releases/asia-lcoe/
295. World Bank (2020). Learning Poverty: Children’s Education in Crisis. Retrieved from https://datatopics.worldbank. org/sdgatlas/archive/2020/goal-4-quality-education/
296. World Bank (2021) 2021 Year in Review: The Inequality Pandemic. Retrieved from https://www.worldbank.org/en/ news/feature/2021/12/20/year-2021-in-review-the-inequality-pandemic
297. World Bank (2021) 'Education Overview'. Retrieved from https://www.worldbank.org/en/topic/education/overview
298. World Bank (2022) Rural Thailand faces the largest poverty challenges with high income inequality. Retrieved from https://www.worldbank.org/en/news/press-release/2022/10/21/rural-thailand-faces-the-largest-povertychallenges-with-high-income-inequality
299. World Bank (2023) Access to electricity (% of population) – Cambodia. Retrieved from https://data.worldbank.org/ indicator/EG.ELC.ACCS.ZS?locations=KH
300. World Bank (2023) Access to electricity (% of population). Retrieved from https://data.worldbank.org/indicator/ EG.ELC.ACCS.ZS
301. World Bank (2023) Access to electricity (& of population) – Indonesia. Retrieved from https://data.worldbank.org/ indicator/EG.ELC.ACCS.ZS?locations=ID
302. World Bank (2023). Small and Medium Enterprises (SMEs) Finance. Retrieved from https://www.worldbank.org/ en/topic/smefinance
303. World Bank (2024) Trade Facilitation, Logistics & Connectivity. Retrieved from https://www.worldbank.org/en/topic/ trade-facilitation-and-logistics
304. World Bank (2024). Nutrition Overview. World Bank. Retrieved from https://www.worldbank.org/en/topic/nutrition
305. World Bank (2025) World Development Indicators [online database]. Retrieved from https://databank.worldbank. org/source/world-development-indicators
306. World Bank (2025) World Development Indicators: Fertility rate, total (births per woman) (SP.DYN.TFRT.IN). Washington, DC: World Bank. Retrieved from https://data.worldbank.org/indicator/SP.DYN.TFRT.IN
307. World Bank (2025) World Development Indicators: Life expectancy at birth, total (years) (SP.DYN.LE00.IN). Washington, DC: World Bank. Retrieved from https://data.worldbank.org/indicator/SP.DYN.LE00.IN
308. World Bank (2025) World Development Indicators: Life expectancy at birth, total (years) (SP.DYN.LE00.IN). Washington, DC: World Bank. Retrieved from: https://data.worldbank.org/indicator/SP.DYN.LE00.IN
309. World Bank (2025) World Development Indicators: Out-of-pocket expenditure (% of current health expenditure) (SH.XPD.OOPC.CH.ZS). Washington, DC: World Bank. Retrieved from https://data.worldbank.org/indicator/SH.XPD. OOPC.CH.ZS
310. World Bank (2025) World Development Indicators: Population, total (ASEAN countries, 2024). World Bank Databank. Retrieved from https://data.worldbank.org/indicator/SP.POP.TOTL
311. World Bank (2025). Immunization, DPT (% of children ages 12-23 months). World Development Indicators. Retrieved from https://data.worldbank.org/indicator/SH.IMM.IDPT
312. World Bank (2025). Incidence of tuberculosis (per 100,000 people). World Development Indicators. Retrieved from https://data.worldbank.org/indicator/SH.TBS.INCD
313. World Bank (2025). Prevalence of undernourishment (% of population). World Development Indicators. Retrieved from https://databank.worldbank.org/source/world-development-indicators/Series/SN.ITK.DEFC.ZS#
314. World Bank, 2019. Enhancing Government Effectiveness and Transparency: The Fight Against Corruption. Retrieved from https://www.worldbank.org/en/topic/governance/publication/enhancing-government-effectiveness-andtransparency-the-fight-against-corruption
315. World Bank, 2019. World Development Report 2019: The Changing Nature of Work. Retrieved from https://www. worldbank.org/en/publication/wdr2019
316. World Bank, 2021. The Digital Economy in Southeast Asia: Strengthening the Foundations for Future Growth. Retrieved from https://documents1.worldbank.org/curated/en/328941558708267736/pdf/The-Digital-Economy-inSoutheast-Asia-Strengthening-the-Foundations-for-Future-Growth.pdf
317. World Bank, 2022. Philippines Climate Change Knowledge Portal. Retrieved from https://climateknowledgeportal. worldbank.org/sites/default/files/2021-08/15852-WB_Philippines%20Country%20Profile-WEB.pdf
318. World Bank, 2022. Women, Business and the Law 2022. Retrieved from https://wbl.worldbank.org/content/dam/ sites/wbl/documents/2021/02/WBL2022%20Chapter%201.pdf
319. World Bank, 2023. Global Economic Prospects. Retrieved from https://openknowledge.worldbank.org/server/api/ core/bitstreams/0e685254-776a-40cf-b0ac-f329dd182e9b/content
320. World Bank, 2023. Labor force, total. Retrieved from https://data.worldbank.org/indicator/SL.TLF.TOTL.IN
321. World Bank, 2023. Lao PDR Country Climate and Development Report. Washington, D.C.: World Bank. Retrieved from
322. World Bank, 2024. Political Stability and Absence of Violence/Terrorism: Estimate (PV.EST). Retrieved from https:// data.worldbank.org/indicator/PV.EST
323. World Bank, 2024. The Cost of Inaction: Quantifying the Impact of Climate Change on Health in Low- and MiddleIncome Countries. Retrieved from https://openknowledge.worldbank.org/entities/publication/be56eef5-60bc4a14-b403-698d43ebef19
324. World Bank, 2025. Government Effectiveness: Percentile Rank (GE.PER.RNK). Retrieved from https://data. worldbank.org/indicator/GE.PER.RNK
325. World Bank, 2025. Voice and Accountability: Percentile Rank. Retrieved from https://data.worldbank.org/indicator/ VA.PER.RNK
326. World Bank, 2025. World Development Indicators. Retrieved from https://data.worldbank.org/indicator/EN.POP. SLUM.UR.ZS
327. World Bank. (2019). Ease of doing business rank. Retrieved from https://data. worldbank.org/indicator/IC.BUS. EASE.XQ?most_recent_year_desc=false
328. World Bank. (2019). The World Bank in Singapore. Retrieved from https:// www.worldbank.org/en/country/ singapore/overview#:~:text=In%20the%20 decades%20after%20independence,in%20the%20first%2025%20years.
329. World Bank. (2021). World Bank country and lending groups. Retrieved from https://datahelpdesk.worldbank.org/ knowledgebase/articles/906519-worldbank-country-and-lending-groups
330. World Bank. (2021). World Development Indicators: Malaysia. Retrieved from https://databank.worldbank.org/ source/world-development-indicators
331. World Bank. (2021). World Development Indicators: Singapore. Retrieved from https://databank.worldbank.org/ source/world-development-indicators
332. World Bank. (2021). World Development Indicators: Singapore. Retrieved from https://databank.worldbank.org/ source/world-development-indicators
333. World Bank. (2023). School enrollment, tertiary (% gross). Retrieved from https:// data.worldbank.org/indicator/ SE.TER.ENRR
334. World Bank. (2023). School enrollment, tertiary (% gross). Retrieved from https:// data.worldbank.org/indicator/ SE.TER.ENRR
335. World Economic Forum (2020) 8 ways ASEAN consumer habits will change by 2030 – shaped by COVID-19, tech and more. Retrieved from https://www.weforum.org/stories/2020/06/8-ways-asean-consumer-habits-will-change-by2030-shaped-by-covid19-tech-and-more/
336. World Economic Forum (2020) Future of Consumption in Fast-Growth Consumer Markets: ASEAN. Insight Report by the World Economic Forum’s Platform on Shaping the Future of Consumption, in collaboration with Bain & Company, June. Retrieved from https://www.weforum.org/publications/future-of-consumption-in-fast-growthconsumer-markets-asean/
337. World Economic Forum (2021) ‘Early healthcare investment is our best chance at healthy ageing’, World Economic Forum, 9 April. Retrieved from https://www.weforum.org/stories/2021/04/early-healthcare-investment-bestchance-at-healthy-ageing/
338. World Economic Forum (2021) ‘How will new technologies benefit ageing and longevity?’, World Economic Forum, 1 March [online]. Retrieved from https://www.weforum.org/stories/2021/03/what-is-the-biggest-benefittechnology-ageing-longevity-global-future-council-tech-for-good/
339. World Economic Forum (WEF) (2020) The Global Risks Report 2020, 15th edition. Geneva: World Economic Forum. Retrieved from https://www.weforum.org/publications/the-global-risks-report-2020/
340. World Economic Forum and Asian Development Bank (2017) Without regional collaboration, South-East Asia will struggle in the Fourth Industrial Revolution, 14 November. Retrieved from https://www.weforum.org/press/2017/11/ without-regional-collaboration-south-east-asia-will-struggle-in-the-fourth-industrial-revolution/
341. World Economic Forum, 2023. Climate loss and damage cost $16 million per hour. Retrieved from https://www. weforum.org/stories/2023/10/climate-loss-and-damage-cost-16-million-per-hour/
342. World Economic Forum. (2019). Top 100: Ranking of countries according their quality of infrastructure in 2019. Retrieved from https://www.statista.com/ statistics/264753/ranking-of-countries-according-to-the-generalquality-ofinfrastructure/
343. World Food Programme (2021). ASEAN Regional Analysis Report on Food Security and Nutrition 2021. Rome: World Food Programme. Retrieved from https://reliefweb.int/report/world/asean-regional-analysis-report-foodsecurity-and-nutrition-2021
344. World Food Programme (2025). WFP in Asia and the Pacific: 2024 Year in Review. World Food Programme. Retrieved from https://reliefweb.int/report/world/2024-year-review-wfp-asia-and-pacific-june-2025
345. World Health Organization (2021) 'Tracking Universal Health Coverage: 2021 Global monitoring report'. Retrieved from https://www.who.int/news-room/fact-sheets/detail/universal-health-coverage-(uhc)
346. World Health Organization (2022). WHO South-East Asia Region to accelerate progress for NCD prevention and control. Retrieved from https://www.who.int/southeastasia/news/detail/07-09-2022-who-south-east-asia-regionto-accelerate-progress-for-ncd-prevention-and-control
347. World Health Organization (2023) 'Universal health coverage in the South-East Asia Region' Retrieved from https:// www.who.int/southeastasia/health-topics/universal-health-coverage
348. World Health Organization (WHO) (2019). Global tuberculosis report 2019: Executive summary. Geneva. Retrieved from https://www.who.int/publications/i/item/global-tuberculosis-report-2019
349. World Health Organization (WHO), 2024. Air pollution. Retrieved from https://www.who.int/health-topics/airpollution#tab=tab_1
350. World Health Organization (WHO). (2024). World malaria report 2024: Addressing inequity in the global malaria response. Geneva. Retrieved from https://www.who.int/teams/global-malaria-programme/reports/worldmalaria-report-2024
351. World Population Review (2022) PISA Scores by Country. Retrieved from https://worldpopulationreview.com/ country-rankings/pisa-scores-by-country
352. Zero Carbon Analytics (2023) A Driving Force: Asia’s Energy Transition. October. Retrieved from: https://zerocarbonanalytics.org/wp-content/uploads/2023/11/Report_-Asia-leads-global-race-in-renewables.pdf
