Housing Needs Update for 2025

Page 1


30% AMI Families Left Behind Despite Growth in Affordable Units

New housing needs data shows, despite increasing inventory above 30% AMI affordability, a substantial shortfall remains for households at 30% AMI and below

A recent update to the Arlington County Housing Needs Analysis shows that Arlington renters at or below 30% of Area Median Income (AMI) are experiencing severe housing cost burdens, with threequarters paying more (often much more) than half of their income for housing. The study, produced by George Mason University’s Center for Regional Analysis (CRA) as part of Arlington’s periodic updates to the Affordable Housing Master Plan (AHMP), shows the county’s current affordability profile as well as a projection of housing needs to the year 2040. The findings in the report provide essential insights for ACF’s Shared Prosperity work on deep affordability housing that’s within reach for renters at or below 30% AMI.

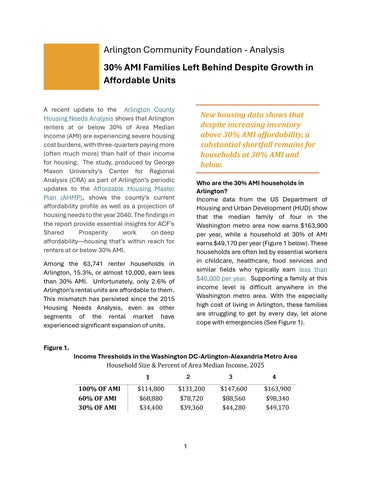
Among the 63,741 renter households in Arlington, 15.3%, or almost 10,000, earn less than 30% AMI. Unfortunately, only 2.6% of Arlington’s rental units are affordable to them. This mismatch has persisted since the 2015 Housing Needs Analysis, even as other segments of the rental market have experienced significant expansion of units

Who are the 30% AMI households in Arlington?

Income data from the US Department of Housing and Urban Development (HUD) show that the median family of four in the Washington metro area now earns $163,900 per year, while a household at 30% of AMI earns $49,170 per year. These households are often led by essential workers in childcare, healthcare, food services and similar fields who typically earn less than $40,000 per year. Supporting a family at this income level is difficult anywhere in the Washington metro area. With the especially high cost of living in Arlington, these families are struggling to get by every day, let alone cope with emergencies.

Income Thresholds in the Washington DC-Arlington-Alexandria Metro Area HouseholdSize&PercentofArea

What does cost burden mean for low-income Arlington renters?

The new data show that 7,272 households, or 74.5% of renters under 30% AMI in Arlington are “severely cost burdened” – meaning they pay more than half of their income for housing. Even if 30% AMI households are renting a committed affordable unit (CAF), which is publicly financed and set aside at an affordable rent or a market rate unit, they are likely to experience severe cost burden.

For instance, a four-person household at the top of the 30% AMI band making $49,170 per year would be paying 54% of their income to rent a two-bedroom CAF committed at 60% AMI affordability, the most common affordability level available. This leaves $1,884 per month for all other expenses – food, childcare, medical needs, transportation. If that same household were lucky enough to find a CAF unit with rent set at a 30% AMI affordability level, they would be paying half as much for housing costs, leaving more funds for other essential expenses

Most extremely low-income households fall well below the 30% AMI threshold, so the burden is much worse. For reference, a worker earning minimum wage working full time at 40 hours per week earns $25,813 annually and $2,151 per month, which means that even 100% of their income isn’t enough for a two-bedroom 60% AMI CAF unit that exceeds $2,200 per month. In contrast, Arlington households with over 60% AMI rarely experience severe housing cost burden, as shown in the graph below.

Severely Cost Burdened Renters

Number and Percent by AMI

Number Severely Cost Burdened

Percent Severely Cost Burdened

What progress has Arlington made in creating more affordable housing?

Arlington has made great strides in recent years with investments in its overall stock of CAF units, which increased by 44% between 2019 and 2025, reaching a total of almost 12,000 units. For example, as of 2025, three quarters of all CAF units have rents set to be affordable between 50% and 80% AMI. However, only 164 CAFs have rents affordable for the almost 10,000 renter households at the 30% AMI level.

The Housing Needs Analysis estimates a total of 1,680 units with rents reported as affordable to households below 30% AMI. These units are made affordable using a number of tools – they include

the 164 CAFS (units publicly financed and set aside at affordable rent), as well as units where the renter receives subsidies through programs such as project-based Section 8, Housing Choice Vouchers, Housing Grants, or Permanent Supportive Housing. The total may also include those renting from friends or family at below market rates.

Supply-Demand Mismatch

Rental Units vs. Renters by AMI

2023 Arlington County

Above 80% AMI

60-80% AMI

30-60% AMI

<30% AMI

Rental Units

Renter Households

There is a severe shortage of units affordable below 60% AMI relative to the number of households at that level. Extremely low-income households are particularly underserved, with only 1,680 total units affordable to the almost 10,000 renter households in Arlington at 30% AMI or below. Of this 1,680 units, only 164 CAFs with below 30% AMI rents are generally available for extremely low-income households.

The graphic above shows the number of units affordable at each income band relative to the number of renter households in that income band, as shown in the Housing Needs Analysis By stacking the data, we can visualize the cumulative number of units and households at each level.

At the upper end of the income scale, 80% AMI households can reasonably afford any unit with 80% AMI rent or less. However, households at or below the 60% AMI level face a substantial shortage of units affordable to them. And almost all of this shortfall is due to the underlying shortfall for households at 30% AMI and below.

How has the market changed from 2018 to 2023?

Comparing the new data to previous Housing Needs Analysis data1 shows that between 2018 and 2023, the share of rental units, both CAFS and non CAFs, in the 60-80% AMI band has increased by 4,652 units – from 23% to 27% of rental units. In fact, the data show large increases in the number

1 Comparing these two datasets directly is complex due to the differences in measurement from year to year. See the Data and Methodology section for more information.

of affordable units at all income levels above 30% up to 100% of AMI. The smallest increase in units was the addition of 95 affordable to 30% AMI and below households.

Without more extensive analysis, we cannot say for sure what has caused these large shifts in units across affordability categories. However, there are several factors that likely contributed, including:

• The AMI for the Washington DC-Arlington-Alexandria Metropolitan Area increased significantly in recent years. Because the analysis benchmarks rents to AMI, a large increase in AMI can make units appear more affordable to lower-income households.

• New market rate rental development, which typically produces units with rents affordable to the 80% AMI and above households.

• CAF production relies on the Federal Low-Income Housing Tax Credit (LIHTC) program which has traditionally been guided by a policy of setting rents primarily at or near 60% AMI. Since 2019, the County has added 2,577 CAFs at the 50-60% AMI level.

Conclusion

The updated Housing Needs Analysis data show that the demand for deeply affordable rental housing in Arlington is increasing faster than the supply of units affordable below 30% AMI. The number of renters below 30% AMI increased by 21% to nearly 10,000 households, while the rental housing supply affordable to them increased by only 6%, or fewer than 100 units.

The fact that there is even this modest level of increase in deeply affordable housing reflects the intentional shift in Arlington’s housing policy to increase funding for “bricks and mortar” units at 30% AMI. These shifts are responsive to multi-year advocacy from the Arlington Community

Rental Unit Affordability by AMI

from 2018 to 2023

Foundation and our community partners. It is clear that public support and government action can make a difference for affordable housing in Arlington. Based on these gains, we should increase the pace of producing affordable units for those who need it most by adopting a county-wide policy that all properties funded through the County’s Affordable Housing Investment Fund include at least 10% of units that are affordable to 30% AMI households.

Housing grants and subsidies will always be needed to fill critical gaps. But we can’t rely on rental subsidies and grants alone. ACF’s analyses demonstrate that over time, it’s more cost-effective to build permanently affordable units at the right rent levels than to keep paying subsidies year after year.

Arlington needs a balanced approach one that meets immediate needs through subsidies and builds lasting committed affordable housing stock for our very lowest-income neighbors. ACF is urging the county to who are the most burdened by the lack of deeply affordable rental housing.

Appendix: Data and Methodology

The CRA report looked at the US Census Bureau’s American Community Survey (ACS) data collected between 2019 and 2023, known as the “ACS 5-year estimates.” Over time, ACS has changed the way it reports data, making it difficult to compare the previous Housing Needs Analysis to the current analysis. The data shown in the previous report were from the ACS 3-year estimates for the years covering 2015 through 2018 (referred to as 2018 for simplicity), whereas the new data is from the 5-year estimates for years covering 2019 through 2023 (referred to as 2023)

Furthermore, because ACS data is based on a survey, the total numbers reported for any income, rent level, age or other category are an estimate of the total rather than an exact count. Like any survey, the ACS has sampling error that increases as the sample size decreases for smaller geographies and sub-populations The ACS is also based on survey respondents’ answers rather than third party-verified information. It is typical, therefore, that these numbers will not line up precisely with any local data source that is based on detailed tracking of actual units, such as the data collected by Arlington County in the CAF inventory

The ACS-based estimated number of units affordable at the 30% AMI level as shown in the Housing Needs Analysis, which totals 1,680 units, represents a combination of several categories. These include the 164 CAF units tracked by Arlington County, plus any units where the survey respondent reported paying a low rent because of receiving some other rental subsidy such as Project-based Section 8, Housing Choice Vouchers, Housing Grants, or Permanent Supportive Housing. It may also include renters living in unsubsidized units with rents that are not generally available on the market, such as those renting housing from friends or family, or long-term renters in units where any new renter would pay a higher rent for a new lease.

Finally, much of the data included in the 2019-2023 5-year estimates covered a particularly challenging period during the COVID-19 pandemic. As such, it is difficult to know whether changes

we see in the data represent a permanent shift or a reflection of the unusual circumstances of that time.

Turn static files into dynamic content formats.

Create a flipbook
Issuu converts static files into: digital portfolios, online yearbooks, online catalogs, digital photo albums and more. Sign up and create your flipbook.