Transit-Oriented Development & Impact on Modern Infra structure & Cities Harsh Jain1, Dr. Yogesh Geskar2, * 1Amity School of
Architecture & Planning, Amity University, Rajasthan
*Author to whom correspondence should be addressed: E-mail: harsh.hj.hj026@gmail.com (Received month date, year; Revised month date, year; accepted month date, year).
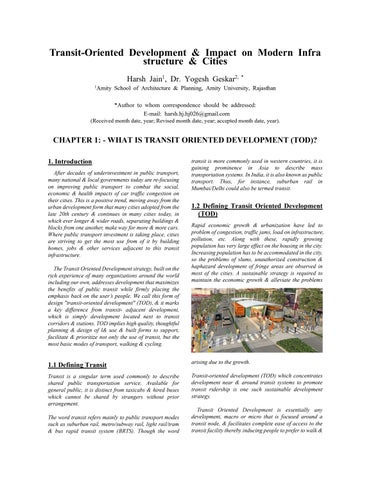
CHAPTER 1: - WHAT IS TRANSIT ORIENTED DEVELOPMENT (TOD)? 1. Introduction After decades of underinvestment in public transport, many national & local governments today are re-focusing on improving public transport to combat the social, economic & health impacts of car traffic congestion on their cities. This is a positive trend, moving away from the urban development form that many cities adopted from the late 20th century & continues in many cities today, in which ever longer & wider roads, separating buildings & blocks from one another, make way for more & more cars. Where public transport investment is taking place, cities are striving to get the most use from of it by building homes, jobs & other services adjacent to this transit infrastructure. The Transit Oriented Development strategy, built on the rich experience of many organizations around the world including our own, addresses development that maximizes the benefits of public transit while firmly placing the emphasis back on the user’s people. We call this form of design "transit-oriented development" (TOD), & it marks a key difference from transit- adjacent development, which is simply development located next to transit corridors & stations. TOD implies high quality, thoughtful planning & design of l& use & built forms to support, facilitate & prioritize not only the use of transit, but the most basic modes of transport, walking & cycling.
transit is more commonly used in western countries, it is gaining prominence in Asia to describe mass transportation systems. In India, it is also known as public transport. Thus, for instance, suburban rail in Mumbai/Delhi could also be termed transit.
1.2 Defining Transit Oriented Development (TOD) Rapid economic growth & urbanization have led to problem of congestion, traffic jams, load on infrastructure, pollution, etc. Along with these, rapidly growing population has very large effect on the housing in the city. Increasing population has to be accommodated in the city, so the problems of slums, unauthorized construction & haphazard development of fringe areas are observed in most of the cities. A sustainable strategy is required to maintain the economic growth & alleviate the problems
1.1 Defining Transit
arising due to the growth.
Transit is a singular term used commonly to describe shared public transportation service. Available for general public, it is distinct from taxicabs & hired buses which cannot be shared by strangers without prior arrangement.
Transit-oriented development (TOD) which concentrates development near & around transit systems to promote transit ridership is one such sustainable development strategy.
The word transit refers mainly to public transport modes such as suburban rail, metro/subway rail, light rail/tram & bus rapid transit system (BRTS). Though the word
Transit Oriented Development is essentially any development, macro or micro that is focused around a transit node, & facilitates complete ease of access to the transit facility thereby inducing people to prefer to walk &