112 minute read
London: I.B. Tauris, 2000), 88-89, 101

Consequences of the Nosema infection in Honeybees and the Physiological Aspects of Caste Determination
Amy Chen is a fourth-year Animal Physiology student. Abstract: Nosema apis and Nosema ceranae are primary stressors of honeybees that induce the Nosema infection. Honeybees that contract it have decreased levels of ATP and a reduction in digestive enzymes. Their midgut cells also fail, and this results in them becoming energetically stressed. Moreover, Nosema-infected honeybees have increased juvenile hormone titer, decreased vitellogenin expression, degenerated hypopharyngeal glands, and decreased royal jelly protein secretions, leading to severe implications in honeybee caste determination. Adaptations of Nosema-tolerant honeybees include the ability to maintain energy stores, acquiring a mechanism that mediates an anti-apoptotic gene, and the upregulation of genes in the Toll signaling pathway. The understanding of such concepts can enable queen bee breeding programs to prevent honeybee populations from declining as a result of the Nosema infection.
Introduction
Honeybees (Apis millifera) are crucial pollinators of the ecosystem as they have the highest floral visitation frequency (Hung et al., 2018). To initiate new plant generations, many crops depend on them for pollen transfer. Honeybees are eusocial insects that have a highly organized reproductive caste system. A hive consists of a single queen, and countless female workers and male drones. Since female workers are sterile, only queen honeybees possess the ability to produce fertilized eggs when inseminated by male drones (Wharton et al., 2007). Thus, without a queen honeybee, reproduction will cease and along with it, the colony’s existence. Worker bees are also very important as their role is to secrete royal jelly (RJ) and feed it to newly hatched (i.e., eclosed) larvae (Buttstedt et al., 2018). RJ is a secretion that consists of several components such as fatty acids and proteins. The primary protein is called “major royal jelly protein 1” (MRJP1) and it is synthesized by the hypopharyngeal gland of worker bees (Buttstedt et al., 2018). MRJP1 in its monomeric form is
called “royalactin” and royalactin has been reported as the key factor that dictates caste determination (i.e., the development of a queen or worker bee) by impinging on the epidermal growth factor receptor (Egfr) signaling pathway (Formesyn et al., 2014; Kamakura, 2011). One stressor that honeybees have faced for over a century are microsporidian fungi called “Nosema parasites”. Although there are numerous Nosema species, honeybees appear to only be infected by Nosema ceranae (N. ceranae) and Nosema apis (N. apis) (Borges et al., 2020). When honeybees ingest their spores, they contract the Nosema infection, and the spores will begin to proliferate extensively in their midgut. Since Nosema parasites rely on their host for energy, this infection alters the metabolic pathways of honeybees and steals their ATP, thereby energetically stressing them (Holt et al., 2013; Mayack & Naug, 2009; Roberts, 1968). In addition to inducing energetic stress, the Nosema infection causes hormonal consequences such as increasing juvenile hormone (JH) titer in honeybees (Ares et al., 2012; Goblirsch et al., 2013). JH refers to a class of hormones involved in several roles such as nutritional status (Holt et al., 2013) and stress resistance (Ares et al., 2012). JH is also associated with the hypopharyngeal gland and high levels of JH lead to the degeneration of the gland (Liu, 1989; Rutz et al., 1976). This in turn decreases the synthesis of RJ proteins, such as MRJP1 (Deseyn & Billen, 2005; Hu et al., 2019), which interrupts queen caste determination (i.e., the development of a queen bee). Another consequence of the Nosema infection is that by increasing JH titer, vitellogenin (Vg) levels will decrease through a negative feedback loop. Vg is a yolk-forming protein that has antioxidant properties, and high levels of it promote honeybee longevity (Corona et al., 2007; Seehuus et al., 2005). Therefore, not only does the Nosema infection disrupt honeybees at the level of their colony (i.e., caste determination) but also at the level of individual bees (i.e., energy and longevity reduction). This paper aims to recapitulate existing studies that explore the consequences of the Nosema infection in honeybees and emphasizes the role and physiological mechanism of RJ in caste determination. This paper will also review several adaptations that Nosema-tolerant honeybees have developed against N. apis and N. ceranae.
The Nosema Infection Induces Energetic Stress in Honeybees
When honeybees contract the Nosema infection, they are energetically stressed as Nosema parasites induce changes in their metabolic pathways (Holt et al., 2013; Mayack & Naug, 2009; Roberts, 1968). For example, Nosema pathogens may associate with the mitochondria in the gut cells of honeybees and steal their ATP via ATP transporters (Holt et al., 2013). Moreover, Higes et al. (2007) and Liu (1984), as quoted by Mayack & Naug (2009), have observed that Nosema parasites consume carbohydrates, like trehalose, from the gut epithelial cells of honeybees. This drop in nutrient levels will increase the need for feeding in these bees. However, since Nosema parasites also reduce digestive enzyme secretions (Mayack & Naug, 2009) and cause midgut cells to fail (Roberts, 1968), the absorption of nutrients is vastly reduced, so honeybees are unable to consume enough food to compensate for the energy loss. In consequence of this energetic stress, Nosema-infected honeybees incur low fitness, and their ability to survive is reduced (p < .0001; Mayack & Naug, 2009). This has reproductive implications because if a queen bee is infected, she will not have sufficient energy to reproduce.
Adaptations for Tolerating the Nosema Infection
Since Nosema parasites have been a threat to honeybees for over a century, some lineages of honeybees have undergone adaptations to better tolerate the Nosema infection (Huang et al., 2012; Kurze et al., 2015; Kurze et al., 2016). Kurze et al. (2016) obtained bees that were sensitive to the Nosema infection and bees that were tolerant to the infection. Nosema-tolerant honeybees had significantly higher trehalose concentrations compared to the Nosema-sensitive bees (p < .05). Thus, the authors concluded that honeybees can adapt to the energetic stress induced by the Nosema infection by preserving certain energy stores (Figure 1 in the Appendix). In a separate study, Kurze et al. (2015) stated that for the Nosema infection to be successful, these parasites must inhibit apoptosis in the honeybee epithelial cells, a natural defense mechanism that occurs during infections. Therefore, when Kurze et al. (2015) examined why some honeybees were better able to tolerate the Nosema infection, they focused on genes that are involved in apoptosis. Nosema-tolerant
honeybees had a significantly lower expression of the iap-2 gene compared to Nosema-sensitive honeybees (p < .001). Since iap-2 is an anti-apoptotic gene, the authors speculated that Nosema-tolerant honeybees must have adapted a mechanism that downregulates its expression. (Figure 2 in the Appendix). A third adaptation was studied by Huang et al. (2012). The authors found that Nosema infected honeybees that have upregulated genes in the Toll pathway successfully tolerated the infection (p < .05), suggesting that the upregulated genes may enhance the immune response of honeybees and thus subdue the virulence of the infection.
The Physiology Behind Royal Jelly and Caste Determination
Honeybee colonies consist of two types of female castes: fertile queen bees and sterile worker bees (Wharton et al., 2007). What dictates which caste a larva belongs to (i.e., caste determination) depends not on its DNA but rather its diet (Buttstedt et al., 2018; Drapeau et al., 2006; Kamakura, 2011). For a queen to develop, the larva must be fed large amounts of RJ after the first three days of eclosion. In the absence of RJ, the larva will fail to develop into a queen and instead develop into a worker (Drapeau et al., 2006). RJ is associated with body growth and ovary development and its main protein component, royalactin, has a major role in caste determination. The association between RJ and queen caste determination involves a very complex pathway. RJ first manipulates the epigenomic and hormonal response system of the larva before impinging on DNA modifications (e.g., methylation, histone modification) and gene regulation (Maleszka, 2018). Such processes will ultimately lead to queen tissue and organ differentiation (Figure 5 in the Appendix). According to Kamakura (2011), the main physiological pathway behind queen caste determination is the epidermal growth factor receptor (Egfr) signaling pathway, and it involves royalactin impinging on several components. This includes activating phosphorylation enzymes p70 S6 kinase (S6K) and upregulating mitogen-activating protein kinase (MAPK). S6K is involved in increasing cell size, so when S6K is activated, it behaves as a morphogenic factor that increases the body size of queens.
When royalactin activates MAPK, MAPK shortens the rate of developmental processes and increases ovary size. To validate that royalactin is the ligand responsible for queen-caste determination and not another component of RJ, Kamakura (2011) fed honeybee larvae either RJ or royalactin. Both royalactin-fed and royal jelly-fed bees had comparable results. Both samples developed into queens and had a significant decrease in developmental time (p < .01), a significant increase in ovary size (p < .01), and a significantly heavier weight at eclosion (p < .01) when compared to controls (Figure 3 in the Appendix). To confirm that the Egfr signaling pathway was involved, Kamakura (2011) performed a loss of function experiment where he suppressed Egfr in honeybees using RNAi. In the absence of Egfr expression, bees were unable to develop into queens, and there was an increase in developmental time and decrease in ovary size and weight at adult eclosion. See Figure 4 in the Appendix. One thing to consider is that while researchers are supportive of the involvement of Egfr signaling in honeybee caste determination (Formesyn et al., 2013; Maleszka, 2018), there is debate on whether RJ/royalactin is the sole ligand that underlies caste determination (Buttstedt et al., 2016; Maleszka, 2018). For example, Buttstedt et al. (2016) failed to replicate the findings of Kamakura (2011) and challenged the notion that royalactin independently dictates caste determination. Moreover, Maleszka (2018) argues that from an evolutionary perspective, it is illogical for caste determination to rely on just one protein when the fertility of queen bees is such a vital component for the persistence of honeybee colonies. These criticisms suggest that more research is needed before a reliable theory on honeybee caste determination can be universally accepted. However, regardless of whether royalactin is the sole ligand or not, it is evident that it has a crucial role in queen caste determination. Thus, it is important for honeybees to either avoid or adapt to the Nosema infection, so the hypopharyngeal gland remains intact to continue secreting RJ for the formation of new fertile queen bees.
The Relationship Between Juvenile Hormone, Vitellogenin, and Honeybee Longevity
Increased levels of JH titer result in a decrease in Vg expression
as JH and Vg interact in a negative feedback loop (Corona et al., 2007; Seehuus et al., 2005; Wang et al., 2012). Wang et al. (2012) observed that when the Vg gene was inhibited in honeybees, their JH titer was significantly higher than the control (p < .05). Having high Vg expression is important as its antioxidant properties promote honeybee longevity (Corona et al., 2007, Seehuus et al., 2005). In a study by Seehuus et al. (2005), honeybees that were injected with Vg had higher survivorship when exposed to oxidative stress compared to the control (p < .0001). Corona et al. (2007) conducted a similar experiment where they compared the survivorship of queen bees with worker bees when exposed to oxidative stress (i.e., paraquat). Since queen bees naturally have higher Vg levels than worker bees, this allowed the queen bees to have higher survivorship (p < .0001). See Figure 6 in the Appendix. A higher Vg level found in queens may be an adaptation to increase the survivorship of honeybee populations because queen bees are the sole reproducers in a colony.
Conclusion
Nosema ceranae and Nosema apis are significant stressors of honeybees. Once honeybees ingest their spores, their ATP is stolen, their midgut cells begin to fail, and they become energetically stressed. The Nosema infection significantly increases juvenile hormone titer in honeybees which leads to the degeneration of their hypopharyngeal gland and a reduction in royal jelly protein secretions. As a result, caste determination is disrupted because the epidermal growth factor receptor signaling pathway requires royalactin to ensue. Furthermore, the longevity of Nosema-infected honeybees is significantly reduced as high juvenile hormone titer decreases vitellogenin. In order to move forward in this field, the physiology behind caste determination must be further investigated. As of now, it is uncertain what processes are involved in caste determination, and there are ongoing debates on whether royalactin is the key driver behind the development of a queen. When a better understanding of caste determination is established, researchers can incorporate such data with the known adaptations of Nosema-tolerant honeybees (e.g., upregulation of Toll genes, lower expression of iap-2) to breed new queens. These queens
can be used to start new colonies or be integrated into existing queenless ones with the goal of re-populating honeybees. By introducing more of these vital pollinators in the ecosystem, the numerous crops that depend on them for fertilization will thrive, and new plant generations will be initiated.
References
Ares, A., Nozal, M., Bernal, J., Martín-Hernández, R., M.Higes, & Bernal, J. (2012). Liquid chromatography coupled to ion trap-tandem mass spectrometry to evaluate juvenile hormone III levels in bee hemolymph from Nosema spp. infected colonies. Journal of Chromatography B, 899, 146-153. https:// doi.org/10.1016/j.jchromb.2012.05.016 Borges, D., Guzman-Novoa, E., & Goodwin, P. H. (2020). Control of the microsporidian parasite Nosema ceranae in honey bees (Apis mellifera) using nutraceutical and immuno-stimulatory compounds. PLoS ONE, 15(1), e0227484. https://doi.org/10.1371/journal.pone.0227484 Buttstedt, A., Ihling, C. H., Pietzsch, M., & Moritz, R. F. (2016). Royalactin is not a royal making of a Queen. Nature, 537(7621), E10-E12. https://doi. org/10.1038/nature19349 Buttstedt, A., Mureşan, C. I., Lilie, H., Hause, G., Ihling, C. H., Schulze, S., Pietzsch, M., & Moritz, R. F. (2018). How honeybees defy gravity with royal jelly to raise queens. Current Biology, 28(7), 1095-1100.e3. https:// doi.org/10.1016/j.cub.2018.02.022 Corona, M., Velarde, R. A., Remolina, S., Moran-Lauter, A., Wang, Y., Hughes, K. A., & Robinson, G. E. (2007). Vitellogenin, juvenile hormone, insulin signaling, and queen honey bee longevity. Proceedings of the National Academy of Sciences, 104(17), 7128-7133. https://doi.org/10.1073/ pnas.0701909104 Deseyn, J., & Billen, J. (2005). Age-dependent morphology and ultrastructure of the hypopharyngeal gland of apis mellifera workers (Hymenoptera, Apidae). Apidologie, 36(1), 49-57. https://doi.org/10.1051/apido:2004068 Drapeau, M. D., Albert, S., Kucharski, R., Prusko, C., & Maleszka, R. (2006). Evolution of the yellow/Major royal jelly protein family and the emergence of social behavior in honey bees. Genome Research, 16(11), 1385-1394. https://doi.org/10.1101/gr.5012006 Formesyn, E. M., Cardoen, D., Ernst, U. R., Danneels, E. L., Van Vaerenbergh, M., De Koker, D., Verleyen, P., Wenseleers, T., Schoofs, L., & De Graaf, D. C. (2014). Reproduction of honeybee workers is regulated by epidermal growth factor receptor signaling. General and Comparative Endocrinology, 197, 1-4. https://doi.org/10.1016/j.ygcen.2013.12.001 Goblirsch, M., Huang, Z. Y., & Spivak, M. (2013). Physiological and behavioral changes in honey bees (Apis mellifera) induced by Nosema ceranae
infection. PLoS ONE, 8(3), e58165. https://doi.org/10.1371/journal. pone.0058165 Holt, H. L., Aronstein, K. A., & Grozinger, C. M. (2013). Chronic parasitization by Nosema microsporidia causes global expression changes in core nutritional, metabolic and behavioral pathways in honey bee workers (Apis mellifera). BMC Genomics, 14(1), 799. https://doi.org/10.1186/14712164-14-799 Hu, H., Bezabih, G., Feng, M., Wei, Q., Zhang, X., Wu, F., Meng, L., Fang, Y., Han, B., Ma, C., & Li, J. (2019). In-depth Proteome of the Hypopharyngeal glands of honeybee workers reveals highly activated protein and energy metabolism in priming the secretion of royal jelly. Molecular & Cellular Proteomics, 18(4), 606-621. https://doi.org/10.1074/mcp.ra118.001257 Huang, Q., Kryger, P., Le Conte, Y., & Moritz, R. F. (2012). Survival and immune response of drones of a Nosemosis tolerant honey bee strain towards N. ceranae infections. Journal of Invertebrate Pathology, 109(3), 297-302. https://doi.org/10.1016/j.jip.2012.01.004 Hung K-LJ, Kingston JM, Albrecht M, Holway DA, Kohn JR. 2018 The worldwide importance of honey bees as pollinators in natural habitats. Proc. R. Soc. 285: 20172140. http://dx.doi.org/10.1098/rspb.2017.2140 Kamakura, M. (2011). Royalactin induces Queen differentiation in honeybees. Nature, 473(7348), 478-483. https://doi.org/10.1038/nature10093 Kurze, C., Le Conte, Y., Dussaubat, C., Erler, S., Kryger, P., Lewkowski, O., Müller, T., Widder, M., & Moritz, R. F. (2015). Nosema tolerant honeybees (Apis mellifera) escape parasitic manipulation of Apoptosis. PLoS ONE, 10(10), e0140174. https://doi.org/10.1371/journal.pone.0140174 Kurze, C., Mayack, C., Hirche, F., Stangl, G. I., Le Conte, Y., Kryger, P., & Moritz, R. F. (2016). Nosema spp. infections cause no energetic stress in tolerant honeybees. Parasitology Research, 115(6), 2381-2388. https://doi. org/10.1007/s00436-016-4988-3 Liu, T. (1989). Juvenile hormone III induced ultrastructural changes in the hypopharyngeal glands of honeybee apis mellifera L. (Hymenoptera : Apidae) without and with infection by Nosema apis zander (Microsporidae : Nosematidae). International Journal of Insect Morphology and Embryology, 18(2-3), 73-83. https://doi.org/10.1016/00207322(89)90017-2 Maleszka, R. (2018). Beyond Royalactin and a master inducer explanation of phenotypic plasticity in honey bees. Communications Biology, 1(1). https://doi.org/10.1038/s42003-017-0004-4 Mayack, C., & Naug, D. (2009). Energetic stress in the honeybee apis mellifera from Nosema ceranae infection. Journal of Invertebrate Pathology, 100(3), 185-188. https://doi.org/10.1016/j.jip.2008.12.001 Paris, L., El Alaoui, H., Delbac, F., & Diogon, M. (2018). Effects of the gut parasite Nosema ceranae on honey bee physiology and behavior. Current Opinion in Insect Science, 26, 149-154. https://doi.org/10.1016/j.cois.2018.02.017 Roberts, M. (1968). Fatty acids in honey bees (Apis mellifera) infected with the
protozoan Nosema apis. Journal of Invertebrate Pathology, 11(2), 234236. https://doi.org/10.1016/0022-2011(68)90154-7 Rutz, W., Gerig, L., Wille, H., & Lüscher, M. (1976). The function of juvenile hormone in adult worker honeybees, apis mellifera. Journal of Insect Physiology, 22(11), 1485-1491. https://doi.org/10.1016/00221910(76)90214-6 Seehuus, S., Norberg, K., Gimsa, U., Krekling, T., & Amdam, G. V. (2006). Reproductive protein protects functionally sterile honey bee workers from oxidative stress. Proceedings of the National Academy of Sciences, 103(4), 962-967. https://doi.org/10.1073/pnas.0502681103 Wang, Y., Brent, C. S., Fennern, E., & Amdam, G. V. (2012). Gustatory perception and fat body energy metabolism are jointly affected by Vitellogenin and juvenile hormone in honey bees. PLoS Genetics, 8(6), e1002779. https:// doi.org/10.1371/journal.pgen.1002779 Wharton, K. E., Dyer, F. C., Huang, Z. Y., & Getty, T. (2007). The honeybee Queen influences the regulation of colony drone production. Behavioral Ecology, 18(6), 1092-1099. https://doi.org/10.1093/beheco/arm086
Appendix
Figure 1. Comparison of Nosema-tolerant and Nosema-sensitive bees in trehalose concentration. Note. Control and infected Nosema-tolerant bees (n = 63, right) had a higher trehalose concentration compared to Nosema-sensitive bees (n = 75, left). Asterisks represent a significance of p < .05. Error bars represent standard deviation from the mean (Kurze et al., 2016; Figure 1c).
Figure 2. Comparison between Nosema-tolerant bees and Nosemasensitive bees in iap-2 gene expression. Note. Nosema-tolerant bees (TN, n = 63, solid squares) had a significantly lower expression of the iap-2 gene compared to Nosemasensitive honeybees (SN, n = 3, solid circles). TC and TN are controls.
Asterisks represent a significance of p < .001. Error bars represent standard deviation from the mean (Kurze et al., 2016; Figure 2).
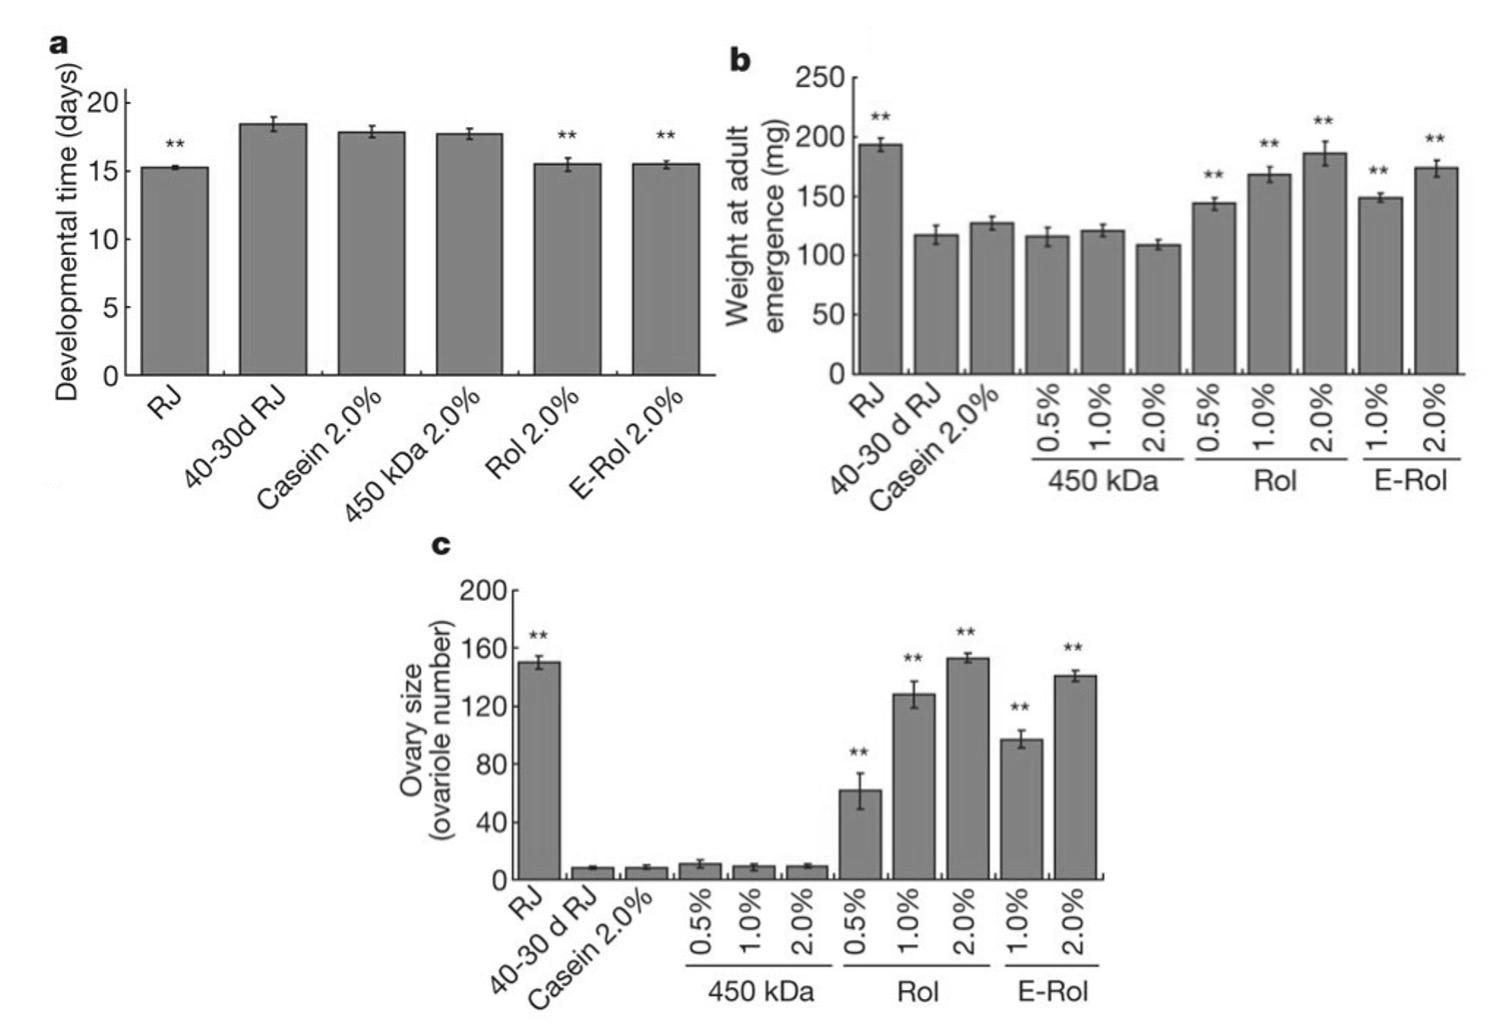
Figure 3. Comparison between royalactin-fed and royal-jelly fed bees in developmental time, weight at adult eclosion, and ovary size. Note. Royalactin-fed bees (Rol, n = 10-28) and royal-jelly fed bees (RJ, n = 10-28) had comparable results. (A) Rol and RJ had a significant decrease in developmental time when compared to the control (450-kDa and casein) bees. (B) Rol and RJ had a significantly heavier weight at eclosion when compared to the control (450-kDa and casein) bees. (C) Rol and RJ had a significant increase in ovary size compared to the control (450-kDa and casein) bees. Asterisks represent a significance of p < .01. Error bars represent standard deviation from the mean (Kamakura et al., 2011; Figure 1).
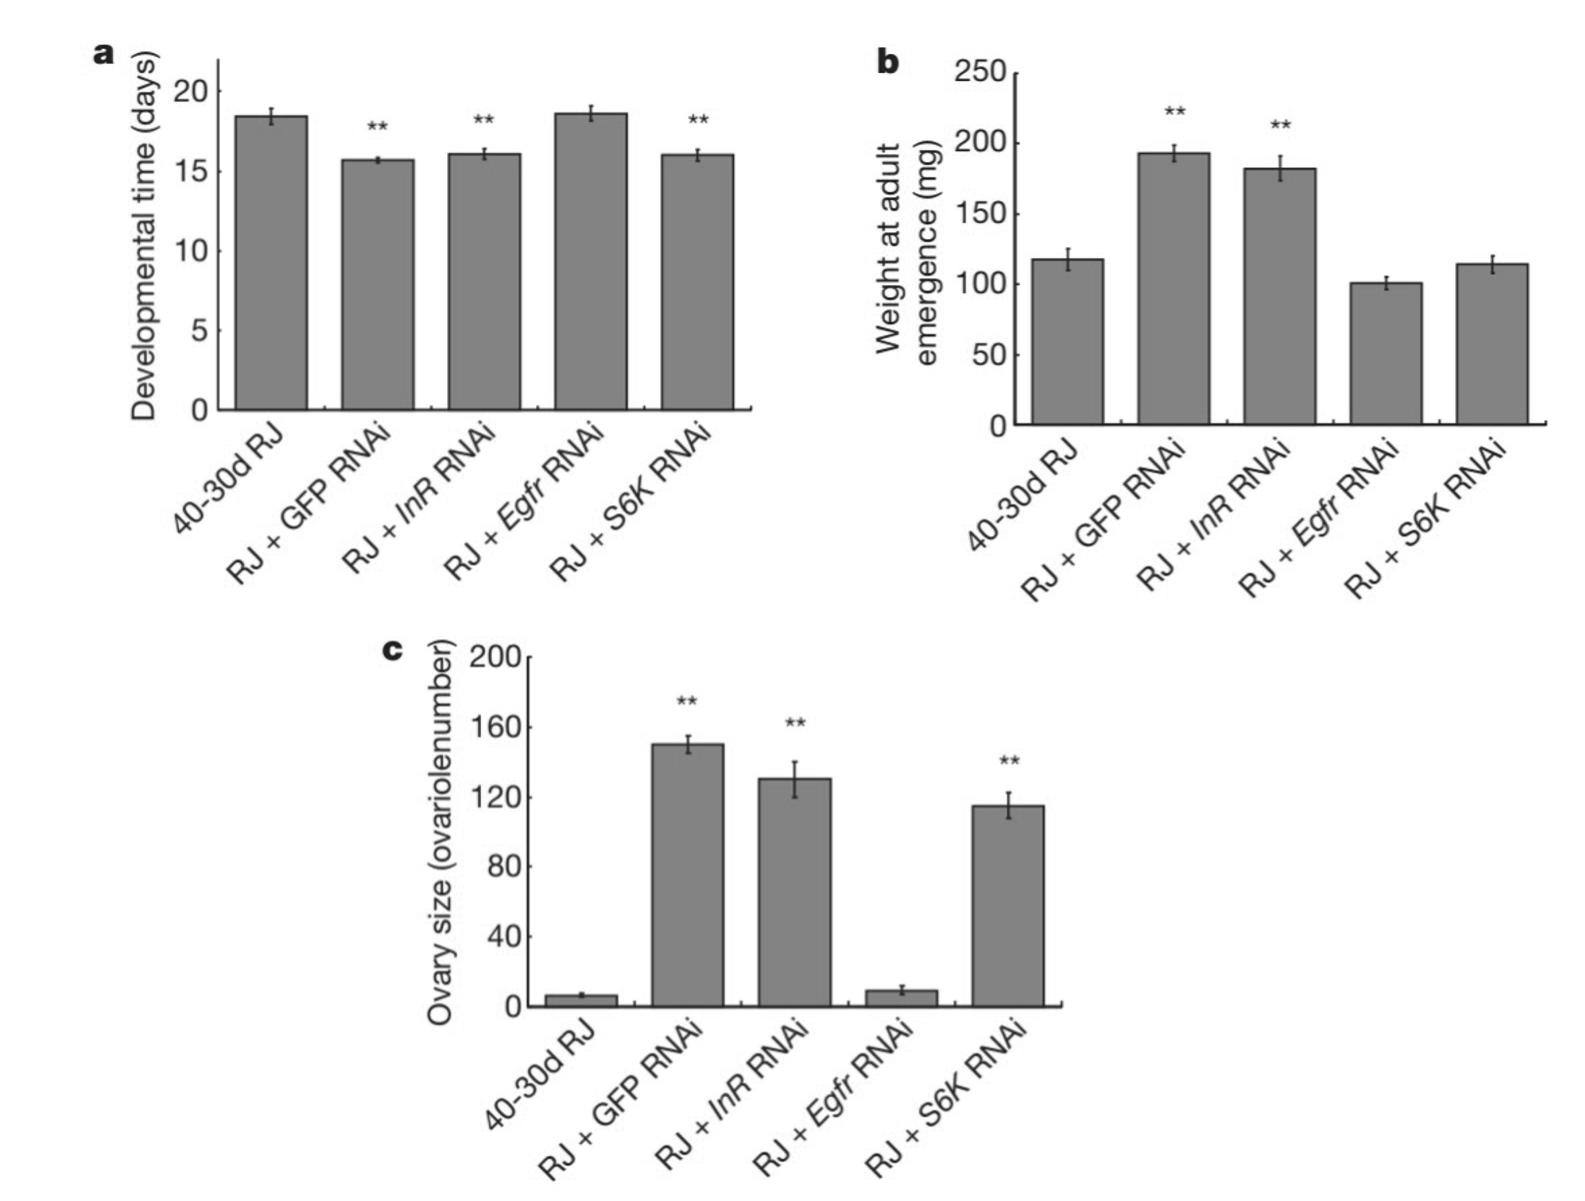
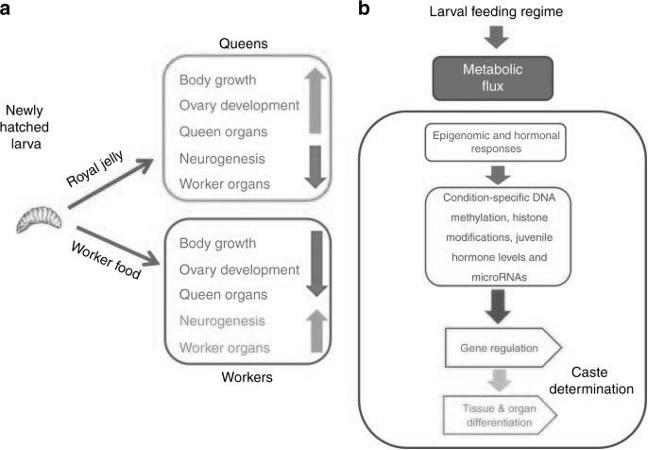
Figure 4 (Top Left). The effects of RNAi in suppressing Egfr in honeybees on developmental time, ovary size, and weight at adult eclosion. Note. (A) Honeybees without Egfr expression (RJ + Egfr RNAi) had an increase in developmental time. (B) Honeybees without Egfr expression (RJ + Egfr RNAi) weighed less at adult eclosion. (C) Honeybees without Egfr expression (RJ + Egfr RNAi) had a decrease in ovary size. Asterisks represent a significance of p < .01. Error bars represent standard deviation from the mean (Kamakura et al., 2011; Figure 4).
Figure 5 (Bottom Left). Schematic of the association between RJ and caste determination. Note. RJ first manipulates the epigenomic and hormonal response system of the larvae before impinging on DNA modifications (e.g., methylation, histone modification) and gene regulation. Such processes will ultimately lead to queen tissue and organ differentiation (Maleszka, 2019; Figure 1).
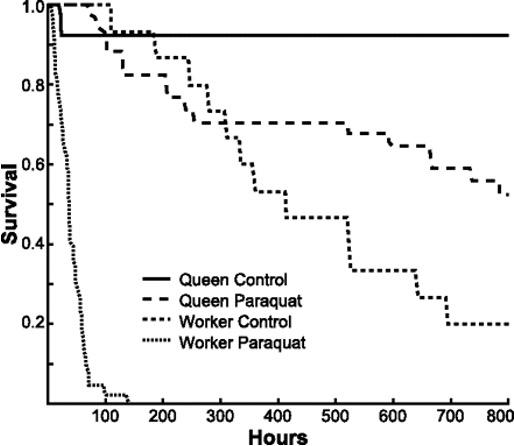
Figure 6. Comparison of the survivorship between queen and worker bees exposed to oxidative stress. Note. Queen honeybees (long-dotted line) exposed to paraquat have a significantly higher survivorship (p < .0001) in comparison to worker bees (short-dotted line; Corona et al., 2007; Figure 6).
Exercise and Neuroplasticity in Brain Injury
Bryan Handoyo Kartono is a fourth-year Neuroscience and Immunology student.
Abstract: Neuroplasticity typically refers to the nervous system’s ability to alter, reshape, and reorganize its structure, function, and connections in response to an intrinsic or extrinsic stimulus in order to adapt better to novel situations. Neural networks, depending on experiences, are not fixed, but dynamically occur and disappear throughout the lifetime. Intensive training in motor and cognitive skills and imagination of brain injury movements is thought to contribute to the reorganization of brain activity patterns, which in turn normalizes brain function. Numerous scientific articles discussed the significance of neuroplasticity on recovery following brain injury. The study conducted by Griesbach et al. observed that exercise induces neuroplasticity through the BDNF-related pathway. Studies conducted by Szulc-Lerch et al., Juenger et al., and Chin et al., show that in human subjects, exercise induces neuroplasticity in brain damage caused by radiation in patients with brain tumors, congenital hemiparesis, and traumatic brain injury. With substantial data that shows cellular and cognitive effects caused by exercise in animal models and results to support the impact of exercise in patients with different types of brain injury, strong evidence is available to support the role of exercise in inducing neuroplasticity in patients with brain injury. Key words: neuroplasticity, exercise, brain damage, brain tumor, congenital hemiparesis, traumatic brain injury, brain-derived neurotrophic factor
Introduction
Neuroplasticity is the incredible ability of the brain to change and adapt. It generally refers to the nervous system’s ability to change, remodel, and reorganize its structure, function, and connections in response to an intrinsic or extrinsic stimulus for the purpose of better ability to adapt to new situations1. Even though the idea of neuroplasticity just came out recently, it is one of the
most remarkable discoveries in the field of neuroscience. The fact is that neural networks, depending on experiences, are not fixed, but dynamically occurring and disappearing throughout the lifetime2 . While we repeatedly practice one activity, neuronal circuits are being developed, leading to a better ability to perform the practiced task with less energy2. In contrast, once we cease to practice one activity, the brain will reroute these neuronal circuits by a ‘use it or lose it’ principle2. Research showed that various aspects of the brain could be reconstructed even through adulthood3. However, the developing brain exhibits a higher degree of plasticity than the adult brain3 . Neuroplasticity ranges from microscopic changes in individual neurons to larger-scale changes such as cortical reorganization in response to brain injury4 . The concept of neuroplasticity allows one to explain various phenomena, such as habituation, sensitization to a specific position, medication tolerance, and even recovery following brain injury2 . As a matter of fact, it is known to be the basis for many of the cognitive and physical rehabilitation treatments following brain injury1. It is believed that intense training of motor and cognitive tasks and imagination of movements following brain injury leads to the reorganization of brain activity patterns, which in turn normalizes brain function5. The purpose of this review paper is to discuss the efficacy of exercise in inducing neuroplasticity in subjects with brain injury.
Numerous scientific articles have discussed the significance of neuroplasticity on recovery following brain injury in animal models. For instance, by evaluating the effects of exercise following experimental TBI, Griesbach et al. concluded that, in the rats' traumatic brain injury (TBI) model, voluntary exercise could endogenously upregulate brain-derived neurotrophic factor (BDNF) and improve recovery when applied at the appropriate post-injury time window, as they found that exercise dramatically increases the levels of hippocampal phosphorylated synapsin I and phosphorylated cyclic AMP response element-binding-protein (CREB), as well as phosphorylated synapsin I and BDNF6. A study conducted by Yamamoto et al. focused on the re-development of neural pathway following brain injury. They found that following a motor exercise for
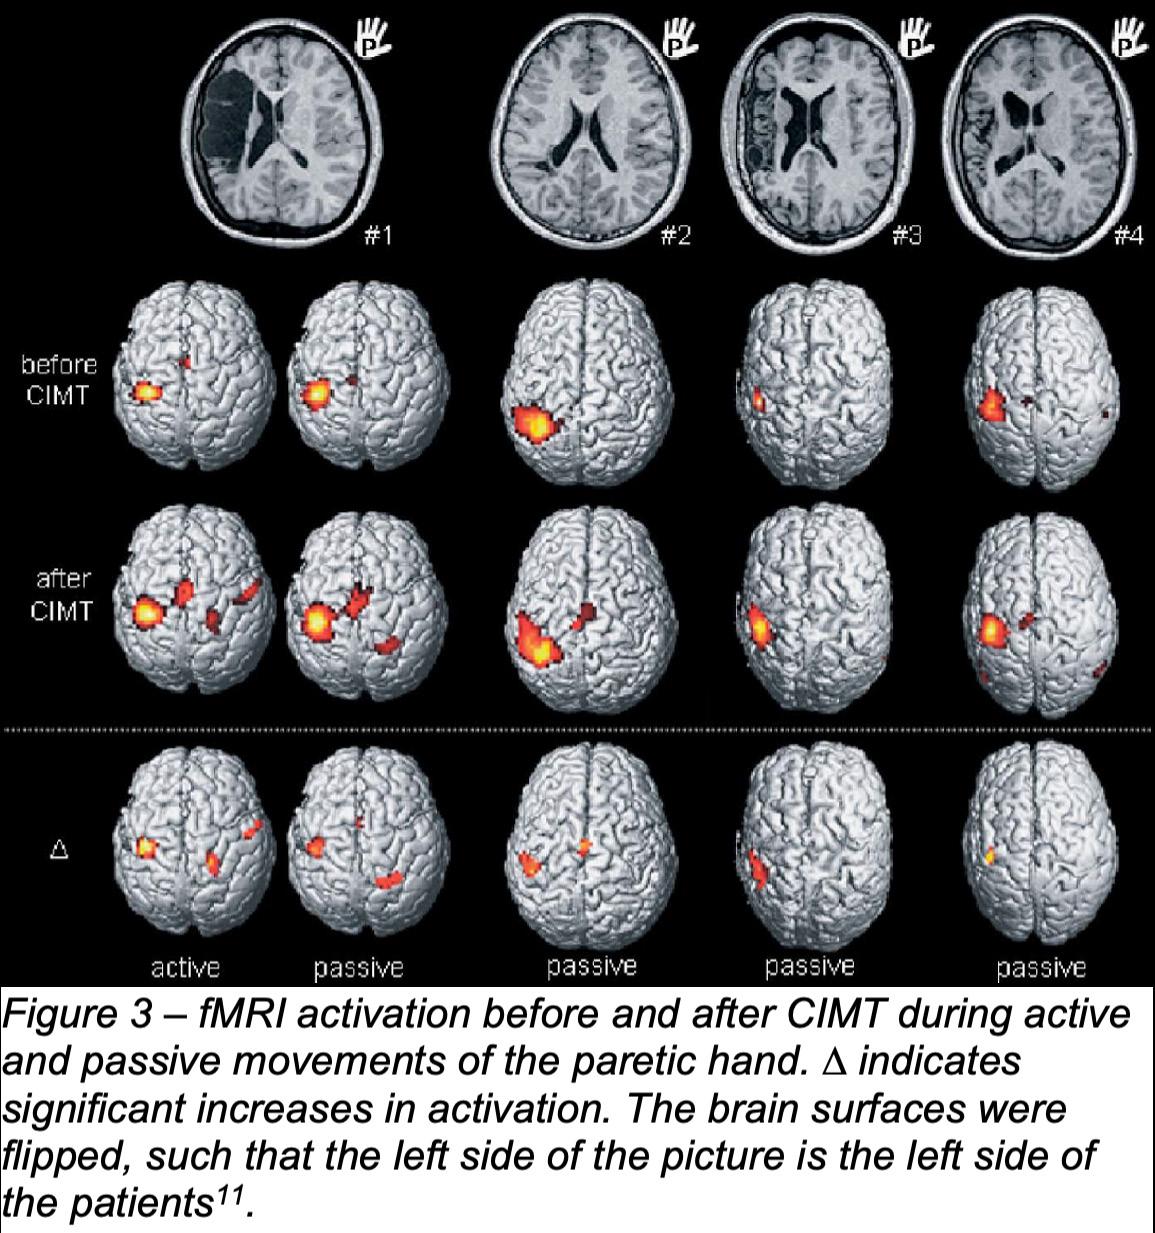
three months, adult primate brains with motor lesions can rearrange an extensive network to allow motor recovery by enhancing the coupling of sensorimotor and motor commands through rewired fronto-cerebellar connections8 . Numerous studies also support the role of exercise on neuroplasticity in human subjects. Szulc-Lerch et al., after examining the anatomical T1 magnetic resonance imaging (MRI) data and multiple behavioral outcomes, concluded that exercise in radiationtreated pediatric brain tumor patients has a benefit on the brain as it is associated with increase pre- and postcentral gyri, left temporal pole, left superior temporal gyrus, and left parahippocampal gyrus cortical thickness9. Exercise also improves the cognitive function of the brain following brain injury. Chin et al., examined the effect of aerobic exercise on TBI patients and found that aerobic exercise improves various aspects of cognitive function10. Juenger et al., the experimenters examined ten patients with congenital hemiparesis which was caused by unilateral cortico-subcortical infarctions in the middle cerebral artery territory that received a 12-day intervention of constraint-induced movement therapy (CIMT)11. Following an observation by functional MRI (fMRI), the experimenters concluded that exercise could promote changes of cortical activation in congenital hemiparesis, as they discovered increases in cortical activation during paretic hand movements in the primary sensorimotor cortex of the affected hemisphere as well as improved task performance11 .
Major Results Exercise Increases BDNF in Animal Models
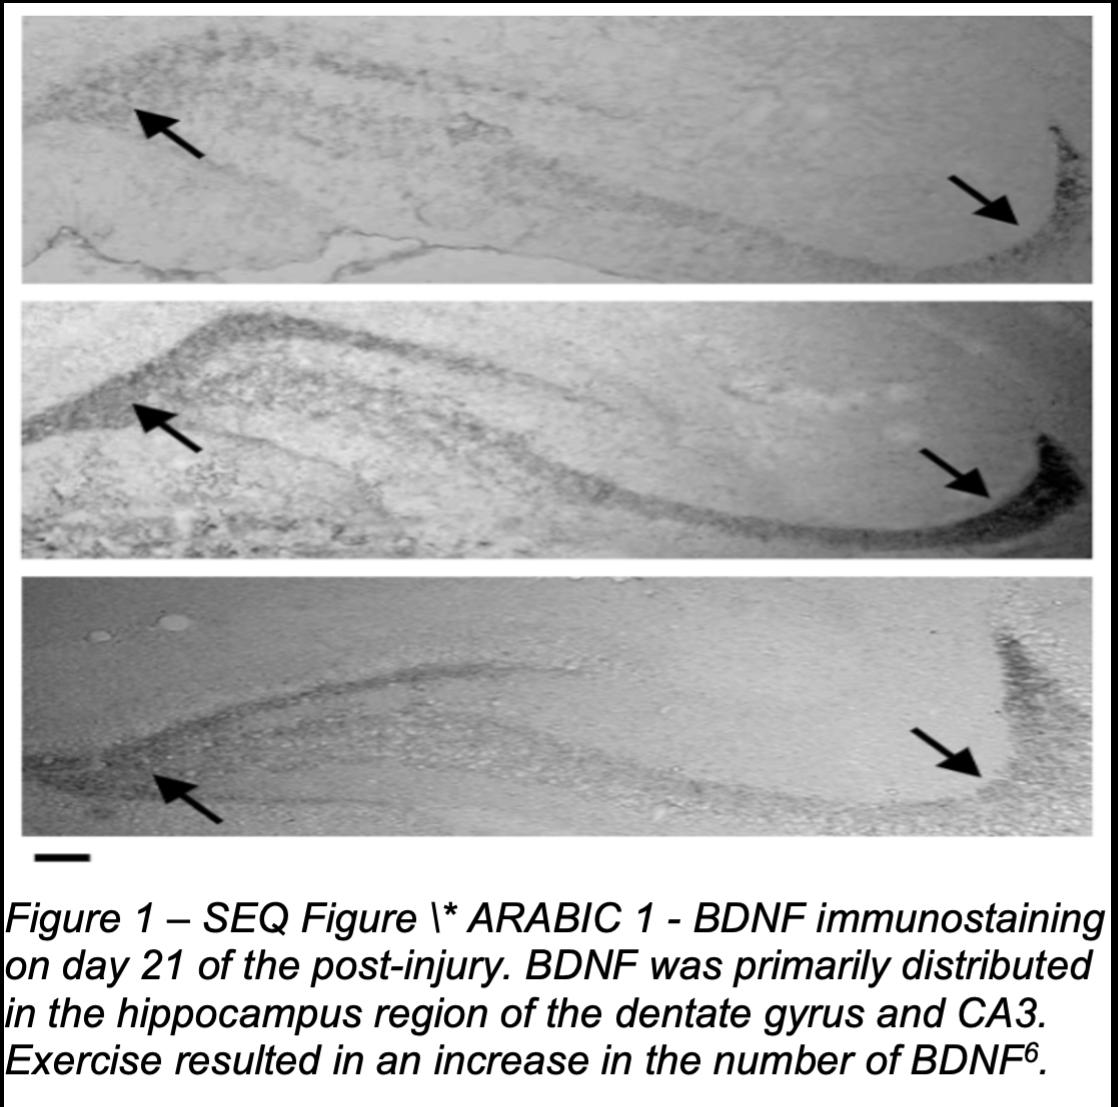
The study conducted by Griesbach et al. observed that exercise leads to the increment in BDNF (Figure 1), as well as its downstream effectors, CREB, and synapsin I6. However, the experimenters also noted that if the exercise is administered immediately after TBI, it will not yield the same result as the molecular response to exercise is disrupted, leading to a delayed recovery time6. It will instead lead to a lower level of CREB and phosphorylated synapsin I, as well as the failure to upregulate BDNF6. The experimenters also noted that the changes in the amount of BDNF and enhanced synaptic plasticity caused by exercise might improve cognitive performance6. This
finding came from the fact that mice from the delayed-exercise group perform better in the Morris water maze test than the early-exercise group6 .
Exercise in Long-Term Pediatric Brain Tumor Survivors
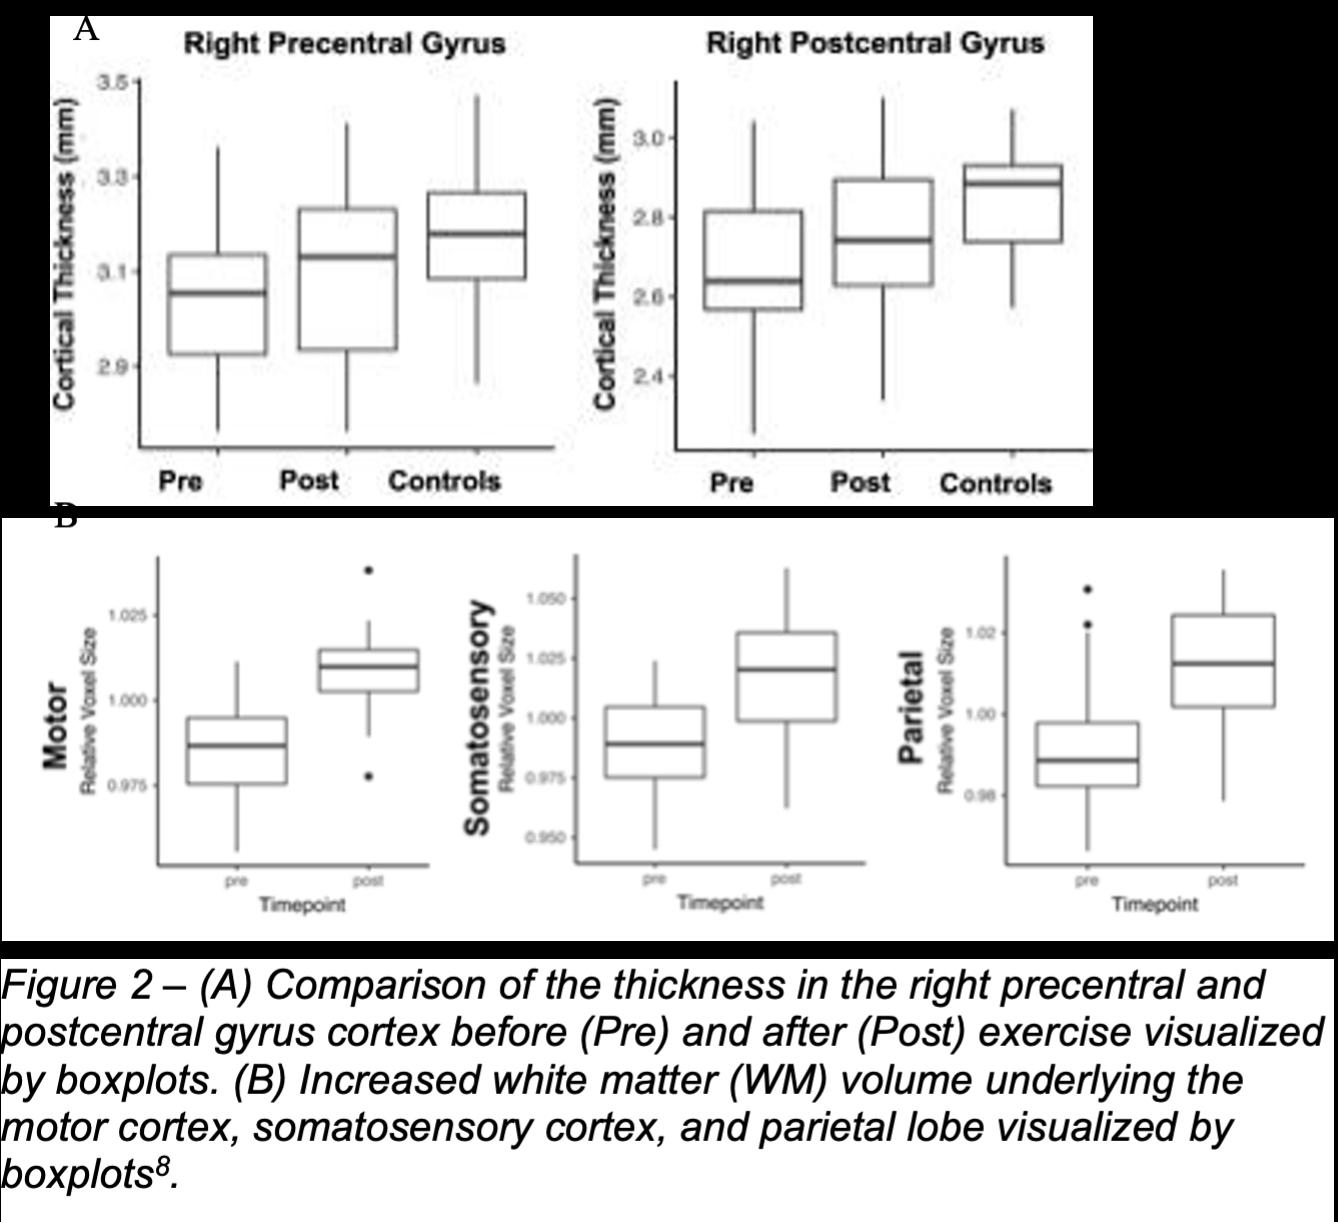
Szulc-Lerch et al. main research focus is to examine the effectiveness of exercise practice in 28 radiation-treated longterm pediatric brain tumor survivors for neural and behavioral rehabilitation9. By using unbiased automated vertex-wise analyses, as seen in Figure 2A, the experimenters found out that exercise leads to an increase in cortical thickness for the right precentral and postcentral gyri8. They also recorded an increase in cortical thickness in the left temporal pole, left superior temporal gyrus, and left parahippocampal gyrus8. As seen in Figure 2B, Szulc-Lerch et al. also found out that, based on the Deformation Based Morphometry (DBM) results, exercise resulted in increased white matter (WM) volume underlying the right motor and somatosensory cortices, as well as in the parietal lobe8. Szulc-Lerch et al. noted that the areas where they found an increase in WM volume, in motor and premotor cortices, also showed an increase in cortical thickness in response to exercise8 .
Exercise in Congenital Hemiparesis Patients
Assessing the impact of CMIT on ten patients with congenital hemiparesis caused by unilateral cortico-subcortical infarctions in the middle cerebral artery is the collective focus of Juenger et al. study11. As seen in Figure 3, FMRI during paretic hand movement revealed an increment in activation of primary sensorimotor cortex of the affected hemisphere, in this case, the left hemisphere. In addition, the researcher also found an increase in activation in the interhemispheric fissure, in the primary sensorimotor cortex of the contralesional hemisphere and in the cerebellum.
A later study by Juenger et al. discovered that the type of corticospinal reorganization in congenital hemiparesis affects the CIMT-induced diverging cortical changes16, such that, as seen in Figure 4, patients with ipsilateral corticospinal projections showed
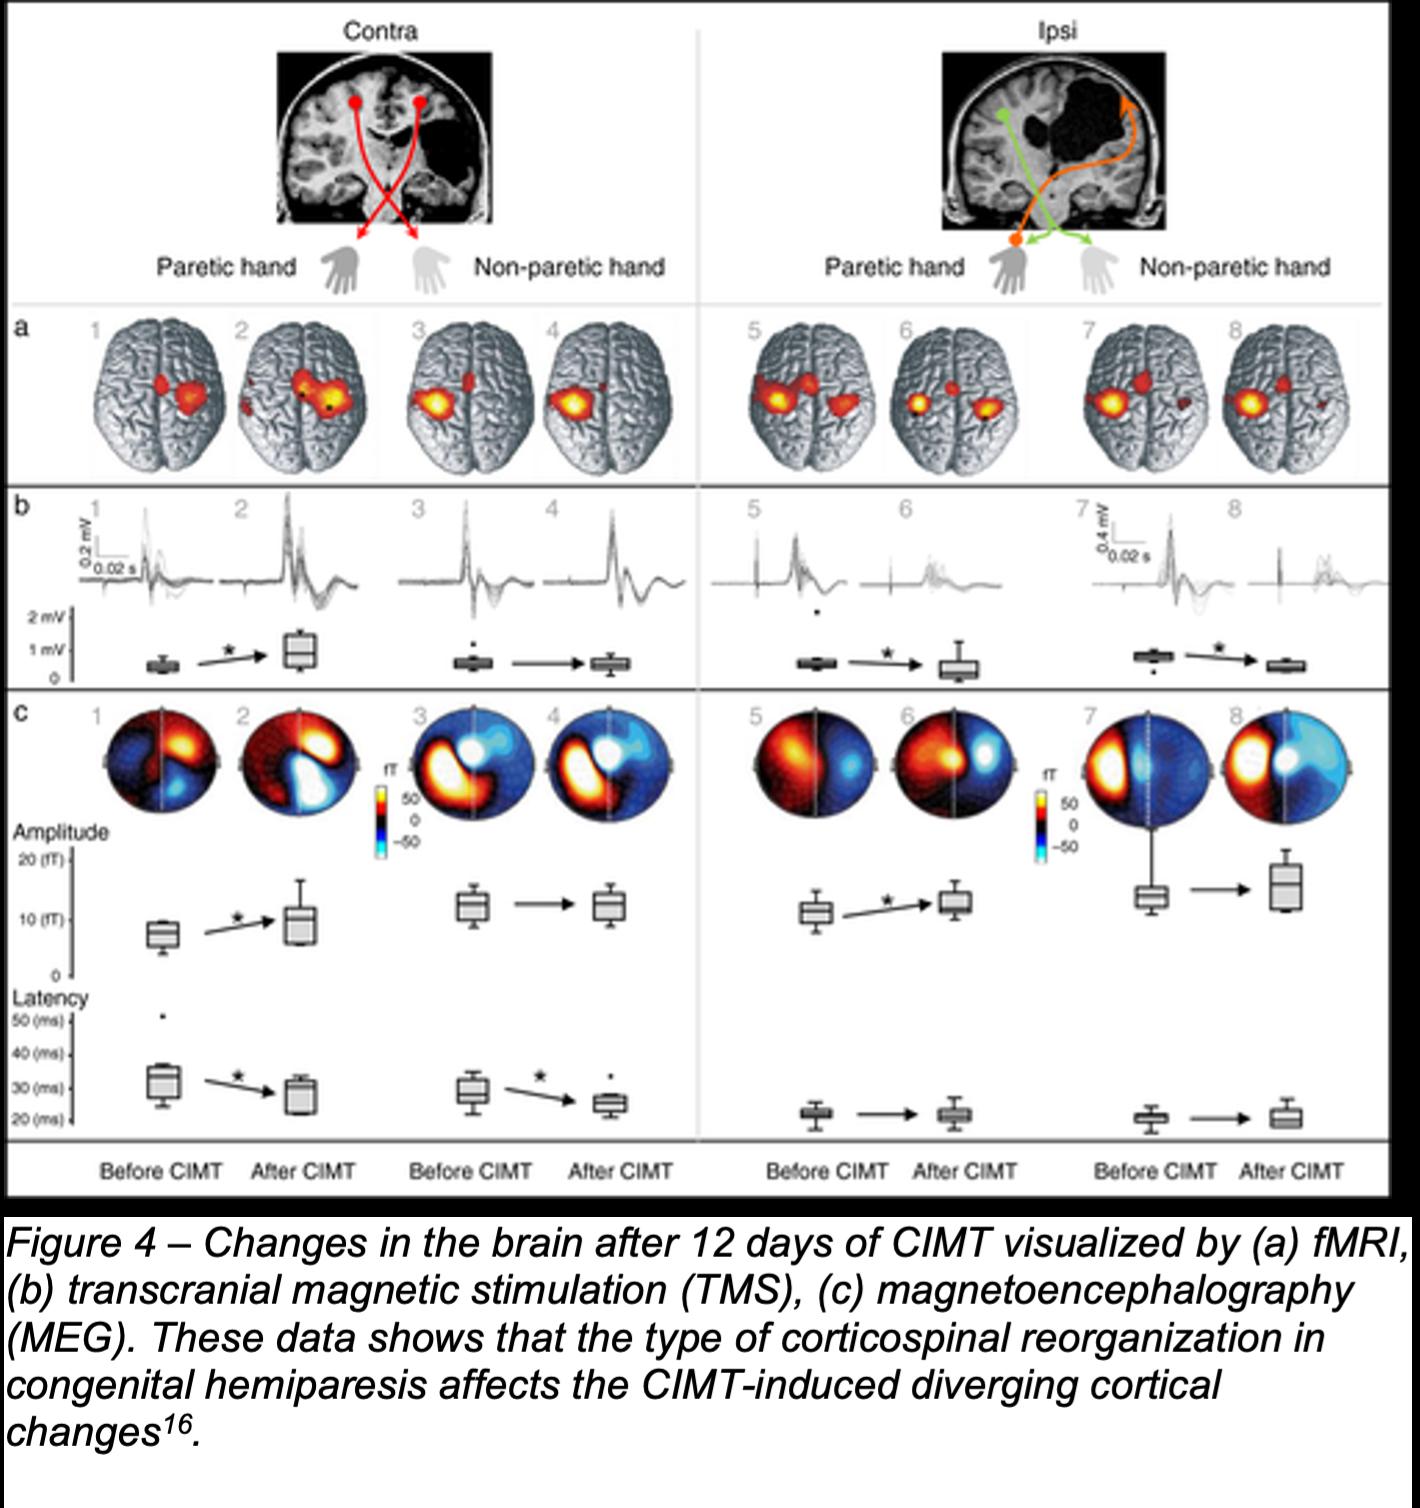
a reduced transsynaptic primary motor cortex (M1) excitability and reduced synaptic activity during paretic hand active movements after 12 days of CIMT, whereas patients with crossed contralateral corticospinal projections showed an increment in those parameters16 .
Exercise in Traumatic Brain Injury Patients
Chin et al. main research focus is to examine the effect of exercise, specifically aerobic exercise, on cognitive function of TBI patients10. Following a supervised intensive aerobic exercise program, TBI patients showed significant improvements in cognitive function10. These cognitive functions include the domains of processing speed, executive functioning, and overall cognitive function. The experimenters also noted that the magnitude of the improvements observed may be influenced by the adaptability of the patient's cardiorespiratory system to the aerobic exercise10. The positive effect of aerobic exercise on cognitive function was also reported on various study. Voss et al. found a strong association between the improvements in cardiorespiratory fitness and cognitive function in older adults13, while Kluding et al. concluded that exercise is associated with an improvement in cognitive function in stroke patients17 .
Discussion
Based on the available data showing effects that were induced by exercise in animal models, together with findings to support the effect of exercise in patients with various forms of brain injury, there is significant evidence to support the role of exercise in inducing neuroplasticity in patients with brain injury. The study conducted by Griesbach et al. concluded that, in animal models, voluntary exercise could endogenously upregulate brain-derived neurotrophic factor (BDNF) and improve recovery when applied at the appropriate postinjury time window6. This study specifically highlights the importance of exercise on BDNF, as exercise leads to the increase of BDNF, as well as its downstream effectors CREB and synapsin I, excercise will promote brain recovery6. However, it is known that the effect is time-dependent as they observed a delayed recovery when exercise is administered too soon after injury. They suggested that it might be caused by metabolic alterations that occur during the post-injury
period6. A study conducted by Lee et al. suggested that there is a lower concentration of ATP, which is the primary source of cellular energy, following TBI, and Lifshitz et al. indicated that there is a structural alteration of the mitochondria following TBI18,19. Therefore, it is suspected that if exercise is administered too soon, it may enhance ATP loss or redeploy it from functions that are vital for recovery, such as producing synaptic plasticity molecules by introducing an unnecessary additional amount of energy needed at a time when the brain is exhausted. The experimenters also noted that the changes in the amount of BDNF and enhanced synaptic plasticity caused by exercise might improve cognitive performance6. It is presumed that the lack of BDNF, synapsin I, and CREB increases reflect changes in selected molecular systems that influence cognitive performance6. It is unclear, however, if the same mechanism also applies to humans . Szulc-Lerch et al. concluded that exercise in pediatric brain tumor patients has a benefit on the brain as it was associated with increase the pre and postcentral gyri, left temporal pole, left superior temporal gyrus, and left parahippocampal gyrus cortical thickness, as well as increased WM volume underlying the right motor and somatosensory cortices, as well as in the parietal lobe9. This finding is supported by a study conducted by Chaddock-Heyman et al., in which they discovered that fitness level is directly proportional to cortical thickness in children and adults12. The exercise-induced cortical thickness increment may represent brain recovery processes in the context of injury, although it does not follow the development pattern that is normally observed in healthy children12. Szulc-Lerch et al. observation on the WM volume is also supported by Voss et al., in which, they observed training-related changes in white-matter structure in human adults13, as well as a study by Scholz et al., in which they found out that the increase in WM volume is typical following motor-skill learning. Szulc-Lerch et al also suggest that the increase in WM volume in motor and premotor cortices may be caused by the increased neural activity during exercise, which in turn may induce activity-dependent myelination or axonal sprouting and branching, which may lead to increased WM volume that was seen in this study2 . While Juenger et al. did not specifically look at brain tumor
patients, they also concluded that exercise could induce changes in the brain cortex. In this case, it induces changes in cortical activation in patients with congenital hemiparesis11. They suggest that an increment in activation of the primary sensorimotor cortex of the affected hemisphere indicates that even severe lesions acquired early during brain development do not hinder the development of neural circuits that is critical to neuroplasticity in this part of the brain11. This study is the first study to observe neuroplasticity activity predominantly in the affected hemisphere, as the contralesional hemisphere is known to be the major player during the reorganization of hand functions15. Therefore, this study brought up the possibility that neuroplasticity activity of motor recovery would also occur in the contralesional hemisphere11. In contrast, Chin et al. concluded that exercise improves the cognitive function of TBI patients10. It is suspected that cardiorespiratory fitness gains may be a determinant of the observed improvement in cognitive function10 . All in all, the current existing human studies, including studies from Szulc-Lerch et al., Juenger et al., and Chin et al., showing enhanced neurocognitive outcomes for patients with various kinds of brain injury who participated in exercise supports the need for a supervised prospective study looking at the effect of exercise on cognitive recovery. While the exact mechanism underlying the neuroplasticity in the human brain following brain injury is unclear, it is possible that, as proposed by Griesbach et al. and Chytrova et al., the BDNF, synapsin I and CREB play a significant role in promoting brain recovery6,7. These studies have some limitations. Most of these studies have small sample sizes. A small sample size leads to several problems, such as a higher probability that the results obtained from the study are due to chance, as well as the study does not represent the general population, which can render the study useless. Another limitation is that most of these studies did not look at long term effects, which means that we did not know whether the changes observed in this study ceased or maintained after completion of the training.
Critical Analysis
Several types of research indicated that neurogenesis
following brain injury in rodents was correlated with the upregulation of the BDNF, an omnipresent growth factor of the central nervous system (CNS), in the rodent hippocampus and that this process was associated with enhanced performance in temporospatial memory tasks6,7. The link found between cellular regeneration and enhanced neuroplasticity makes the signaling pathways by which exercise promotes hippocampal cell growth and in the potential for newly-born neurons to perform in the context of traumatic cell loss interesting. This also raised the possibility of the role of exercise in enhancing neuroplasticity to promote recovery following brain injury as a therapeutic intervention. Many kinds of research have helped to explain the molecular and cellular changes that occur following exercise in the hippocampus. Current work indicates that exercise promotes neuroplasticity by affecting the cellular regeneration mechanism that occurs through BDNF upregulation through a pathway that includes a CREB and synapsin I6. More research also indicates that the environment of exercise upregulates several proteins that play a role in energy metabolism and synaptic plasticity if administered at the right time6 . An increasing number of retrospective population-based research also supports the role of exercise on neuroplasticity in human studies. Nevertheless, as convincing as these studies are, they only demonstrate correlation, not causation. Research on exercise and neuroplasticity following brain injury in humans provide important insights into the potential positive effects of exercise on neuroplasticity for several important reasons. Despite the variation of exercise, time after injury, and study parameters, the current literature implies that patients with a brain injury can participate safely in exercise. Several studies on human subjects also investigated the effect of exercise on various kinds of brain injury. It has been proven that exercise work on brain damage caused by radiation in brain tumor patients, congenital hemiparesis patients, and traumatic brain injury patients9,10,11 . However, given the lack of research examining the role of exercise in promoting brain recovery, there is limited evidence to define the extent to which exercise will improve recovery mechanisms such as plasticity, regeneration, etc.
Future Directions
Current studies on exercise and neuroplasticity accentuate our narrow knowledge of the mechanism through which neuroplasticity takes place and suggest that further investigation in this area is critical. Researchers should resort more to testing the effect of exercise on a specific brain mechanism that is known to promote brain recovery. For instance, the researcher can opt to investigate BDNF in humans with brain injury, as according to animal models, the upregulation of BDNF and its related downstream effectors plays a role in promoting neuroplasticity, which in turn helps brain recovery. Results from this experiment might provide us an insight into how exactly exercise might induce neuroplasticity in patients with brain injury. While we expect to see an increase in the amount of BDNF in the brain, a negative result does not necessarily mean the study is a failure; it just simply eliminates the possibility that exercise induces neuroplasticity through the BDNF-related pathway. It is essential to specify which kind of brain injury the researcher’s are investigating as, from the previous sections, we know that exercise induces a different type of effect depending on the type of brain injury. Thus, different kinds of brain injury might have its own specific recovery mechanism that is unique from one another. We can also do an experiment in BDNF-knockout mice. As mentioned earlier, the upregulation of BDNF and its related downstream effectors is essential in promoting brain recovery through neuroplasticity. While we expect to see little-to-none improvement on BDNF-knockout mice following brain injury, a different result does not mean that the study is controversial; it means that there might be another pathway that promotes brain recovery, and this leads to more thorough research on identifying that particular pathway. We can also test this at a different time period of when the exercise was administered as based on Griesbach et al., exercise will upregulate the expression of BDNF and its related downstream effectors only if administered at the right time6. It is suspected that we will not see an increase in BDNF and its related downstream effectors if exercise is administered too soon after the brain injury occurs . However, a negative result might mean either time is not important
in human subjects or exercise does not affect neuroplasticity through the BDNF-related pathway. It is therefore essential to remove the possibility of exercise acting on the BDNF-related pathway by doing this study after a considerable amount of time, considering the result of the study by Griesbach et al6. It is also important to observe longterm effects that might be present following the exercise training. It is also interesting to test the effect of a different kind of exercise on brain plasticity following brain injury. The studies mentioned in this paper have different types of exercise, such as aerobics, cardio, and even a therapy that has a specific set of different kinds of exercises. Different kinds of exercise might exert a different kind of effect, and even if they did exert the same kind of effect, it might affect the brain through a different kind of pathway.
References
1. Cramer SC, Sur M, Dobkin BH, O'Brien C, Sanger TD, Trojanowski JQ,
Rumsey JM, Hicks R, Cameron J, Chen D, et al. Harnessing neuroplasticity for clinical applications. Brain. 2011;134(6):1591–1609. 2. Demarin V, Morović, S, Béné, R. Neuroplasticity. Periodicum biologorum. 2014;116(2):209-211. 3. Hensch TK, Bilimoria PM. Re-opening Windows: Manipulating Critical
Periods for Brain Development. Cerebrum. 2012;2012:11. 4. Pascual-Leone A, Freitas C, Oberman L, et al. Characterizing brain cortical plasticity and network dynamics across the age-span in health and disease with
TMS-EEG and TMS-fMRI. Brain Topography. 2011;24(3-4):302–315. 5. Marzouk S. S182 Introduction to neuroplasticity and its application in neurorehabilitation. Clinical Neurophysiology. 2017;128(9). 6. Griesbach G, Hovda D, Molteni R, Wu A, Gomez-Pinilla F. Voluntary exercise following traumatic brain injury: brain-derived neurotrophic factor upregulation and recovery of function. Neuroscience. 2004;125(1):129–139. 7. Chytrova G, Ying Z, Gomez-Pinilla F. Exercise normalizes levels of MAG and Nogo-A growth inhibitors after brain trauma. European Journal of
Neuroscience. 2007;27(1):1–11. 8. Yamamoto T, Hayashi T, Murata Y, Ose T, Higo N. Premotor Cortical-
Cerebellar Reorganization in a Macaque Model of Primary Motor Cortical
Lesion and Recovery. The Journal of Neuroscience. 2019;39(43):8484–8496. 9. Szulc-Lerch KU, Timmons BW, Bouffet E, Laughlin S, Medeiros CBD,
Skocic J, Lerch JP, Mabbott DJ. Repairing the brain with physical exercise:
Cortical thickness and brain volume increases in long-term pediatric brain tumor survivors in response to a structured exercise intervention. NeuroImage:
Clinical. 2018;18:972–985. 10. Chin LM, Keyser RE, Dsurney J, Chan L. Improved Cognitive Performance
Following Aerobic Exercise Training in People With Traumatic Brain Injury.
Archives of Physical Medicine and Rehabilitation. 2015;96(4):754–759. 11. Juenger H, Linder-Lucht M, Walther M, Berweck S, Mall V, Staudt M. Cortical
Neuromodulation by Constraint-Induced Movement Therapy in Congenital
Hemiparesis: An fMRI Study. Neuropediatrics. 2007;38(3):130–136. 12. Chaddock-Heyman L, Erickson KI, Kienzler C, King M, Pontifex MB,
Raine LB, Hillman CH, Kramer AF. The Role of Aerobic Fitness in Cortical
Thickness and Mathematics Achievement in Preadolescent Children. Plos
One. 2015;10(8). 13. Voss MW, Heo S, Prakash RS, Erickson KI, Alves H, Chaddock L, Szabo
AN, Mailey EL, Wójcicki TR, White SM, et al. The influence of aerobic fitness on cerebral white matter integrity and cognitive function in older adults: Results of a one-year exercise intervention. Human Brain Mapping. 2012;34(11):2972–2985. 14. Scholz J, Klein MC, Behrens TEJ, Johansen-Berg H. Training induces changes in white-matter architecture. Nature Neuroscience. 2009;12(11):1370–1371. 15. Vandermeeren Y, Sebire G, Grandin CB, Thonnard JL, Schlogel X, De Volder
AG. Functional reorganization of brain in children affected with congenital hemiplegia: fMRI study. Neuroimage 2003;20:289 – 301. 16. Juenger H, Kuhnke N, Braun C, Ummenhofer F, Wilke M, Walther M, Koerte
I, Delvendahl I, Jung NH, Berweck S, et al. Two types of exercise-induced neuroplasticity in congenital hemiparesis: a transcranial magnetic stimulation, functional MRI, and magnetoencephalography study. Developmental Medicine & Child Neurology. 2013;55(10):941–951. 17. Kluding PM, Tseng BY, Billinger SA. Exercise and Executive Function in
Individuals With Chronic Stroke. Journal of Neurologic Physical Therapy. 2011;35(1):11–17. 18. Lee SM, Wong MD, Samii A, Hovda DA. Evidence for Energy Failure following Irreversible Traumatic Brain Injury. Annals of the New York
Academy of Sciences. 1999;893(1OXIDATIVE/ENE):337–340. 19. Lifshitz J, Friberg H, Neumar RW, Raghupathi R, Welsh FA, Janmey P, Saatman
KE, Wieloch T, Grady MS, Mcintosh TK. Structural and Functional Damage
Sustained by Mitochondria After Traumatic Brain Injury in the Rat: Evidence for Differentially Sensitive Populations in the Cortex and Hippocampus.
Journal of Cerebral Blood Flow & Metabolism. 2003:219–231.
Techniques and Literature Investigating NAP, NAP Target Genes and NAP Regulators On General Senescence of Plants
Jacky Jia Jie Liu is a fourth-year Cell & Molecular Biology, Physiology and Neuroscience student. Abstract: Plant senescence is a process characterized by biomacromolecules degradation, excessive water-loss leading to desiccation, and nutrients remobilization. This process is an important part of the plant life cycle and is often the final stage; thus, controlling plant senescence can have a myriad of potentially beneficial effects, not just in science. For example, if senescence is delayed, plant lifespan can substantially increase. NAP is a transcription factor that is primarily responsible for leaf senescence and fruit senescence in Arabidopsis while having similar functions in other plant species. In the efforts of studying NAP, many in vivo and in vitro techniques were used, such as generating loss-offunction and gain-of-function NAP mutants, pull-down assay, and gene expression profiles. Of these techniques used, the ideal in vivo techniques to further investigate NAP is NAP mutants and Y1H analysis while the ideal in vitro techniques are qPCR, pull-down assay, and EMSA. These techniques are effective since they can often incorporate temporal components in the analysis. However, the in vitro techniques have limitations because they do not preserve the complex natural environment in which NAP functions, which could potentially skew the results and the interpretations. Abbreviations: Gibberellin (GA); Abscisic Acid (ABA); Quantitative Real-Time Polymerase Chain Reaction (qPCR); Yeast 1 Hybrid (Y1H); Electrophoretic Mobility Shift Assay (EMSA)
Introduction
Plants have conserved mechanisms for many fundamental biological processes like senescence. Understanding the mechanisms of various tissues’ senescence can have a great impact on how plants can be better fertilized, grown, stored, and developed. This understanding would contribute to model organism development and better experimental control of existing model organisms’ senescence.
The real-world applications on agriculture could greatly benefit the society because controlling the senescence process can affect how many fruits and vegetables are being modified, farmed, and stored. There had been many studies that used a plethora of different techniques and experiments to investigate NAP in different processes in different plants (Chen, 2011; Fan, 2015; Kou, 2012). The main goal of the review is to understand the role of NAP, specifically the downstream effectors of NAP, regulators of NAP as well as the techniques used to study NAP. This review will investigate the role of NAP in plant senescence of leaf, fruit, and flower tissues across different species with a focus on Arabidopsis thaliana (Arabidopsis) as well as the strengths and limitations of various experimental techniques and protocols performed to investigate NAP.
Senescence
Senescence is an important and often required part of plant growth, development, and aging that occurs in different tissues. It is age-dependent and inducible with stress such as dark treatment, often involving phytohormones like GA or ABA that regulate certain cellular processes like chlorophyll degradation, ion leakage, etc (Lei, 2019; Yang, 2014). These processes can be regulated by various specific transcription factors such as NAP, a transcriptional factor from the NAC family, are involved in different processes contributing to senescence (Kim, 2013).
NAP & Senescence In Arabidopsis
In Arabidopsis, GA’s role in senescence and NAP is shown by GA3 (bioactive form of GA) treatment versus water treatment that showed the levels of NAP and senescence increased in GA3 treated leaves compared to water treated leaves through qPCR (Lei, 2019). The role of NAP in GA signaling is further tested using a pull-down assay that showed that NAP physically interacts with and is inhibited by RGA and GAI, two DELLAs proteins that are degraded by GA (Lei, 2019). This suggests that NAP is normally inhibited by DELLAs, when a GA is released in response to stress or age. The DELLAs are then degraded and NAP is free to bind to AAO3 and SAG113 promoters to activate their transcription, leading
to chlorophyll degradation promoting leaf senescence (Yang, 2014; Zhang, 2012). NAP binding with the AAO3 and SAG113 promoters was confirmed by EMSA, showing that NAP binds to a segment 162 to 196 bp before the AAO3 start codon and 9 bp core sequence inside the SAG113 promoter, respectively (Yang, 2014; Zhang, 2012). After NAP is bound and AAO3 is expressed, the stay-green phenotype in extended darkness is suppressed. Endogenous ABA determination showed that ABA levels have increased which corresponds to increased senescence (Zhang, 2012). Overall, the data showed that AAO3 expression leads to the biosynthesis of ABA, a senescenceinducing hormone that causes chlorophyll degradation leading to senescence, especially in the leaves and sepal (Yang, 2014). The SAG113 gene encodes for a PP2C family protein that is involved in water-loss control, therefore once expressed, a regulatory chain of ABA-NAP-SAG113 PP2C is formed (Zhang, 2014). This is how the SAG113 PP2C gene along with NAP and ABA prevents stomata of senescing leaves from closing, accelerating water loss, and desiccation leading to greater senescence (Zhang, 2014; Fan, 2015). Using RNA gel-blot analysis, it is also shown that the actions of NAP and SAG113 are sensitive to the ABA level, in that more ABA leads to greater activity of the ABA-NAP-SAG113 PP2C chain (Zhang, 2014).
Besides GA and DELLAs interactions, NAP is also regulated by an H3K27me3 demethylase REF6 (Wang, 2019). Using gene expression profile and EMSA, it is demonstrated that REF6 functions by epigenetically upregulating NAP and other senescence promoting genes, leading to greater chlorophyll degradation and overall senescence (Wang, 2019). NAP is also involved in silique (fruit) senescence by stimulating ethylene biosynthesis, perception, and signaling, as well as ethylene-stimulated respiration (Kou, 2012). Similar to SAG113, NAP works with ABA to control fruit senescence by promoting stomata opening (Fan-2015; Kou-2012).
NAP In Other Plants & Other Non-Senescence Functions
Functions of the NAP gene are conserved among many plants, often serving similar functions in leaf and fruit senescence (Kou, 2012; Chen, 2011). For example, it is shown through expression profile analysis that NAP in Gossypium functions similarly to NAP in Arabidopsis (Fan, 2015). In peaches, there are seven peach NAPs, and through qPCR it was found that the NAPs, in different combinations, are involved in reproductive organ growth, flower, leaf, fruit senescence, and fruit ripening (Li, 2016). Besides promoting senescence, NAP has also been found to function in embryogenesis, root morphogenesis, seed development, salt, drought, and H2O2 stress (Fan, 2015; Kim, 2013).
NAP Techniques
Throughout the literature on NAP and its role in plant senescence, one commonly used technique is generating NAP mutants to observe phenotypic changes like delayed or premature senescence, response to ABA, and ethylene (Kim, 2013; Zhang, 2014; Kou, 2012). This in vivo way of observing the changes brought on by specific gene mutations and treatments is effective in showing the overall effect as well as preserving the complex natural environments of cells (Lei, 2019). Another in vivo technique that can be used is Y1H analysis that uses a reporter LacZ gene to confirm promoter binding in transformed yeasts (Zhang, 2012). This in vivo technique allows researchers to observe promoter binding and gene activation. However, its limitation is that it must be performed in yeasts and that do not possess the same environment found in Arabidopsis cells (Kim, 2013; Zhang, 2012; Yang, 2014). NAP mutants can be further analyzed through qPCR for relative expression of genes of interest, a technique that is very effective and provides a temporal component that accurately shows when each of the genes is activated or repressed (Chen, 2011; Kim, 2013; Kou, 2012; Lei, 2019; Wang, 2019; Zhang, 2014). In transformed strains of E. coli and yeasts, pull-down assays can be performed to determine if specific proteins physically interact while EMSA can also be performed to determine if specific proteins bind
with target promoters (Lei, 2019; Yang, 2014). Both techniques are effective and have low ease of manipulation. However, they are also in vitro assays and thereby limited in its inability to preserve the complex environment of normal cells.
Conclusion
Based on the existing literature, the NAP transcription factor in Arabidopsis is controlled by GA and REF6 (Lei, 2019; Wang, 2019). NAP functions to increase senescence in leaves and fruits by expressing genes promoting ABA synthesis, ethylene-stimulated respiration, and stomata opening control (Fan, 2013; Yang, 2014). As NAP is conserved in many plant species, it functions in a similar fashion in many other plants, like its role in Gossypium leaf senescence, peach fruit senescence, etc (Chen, 2011; Fan, 2013; Li, 2016). There are also additional functions of NAP such as a stressresponding transcription repressor in Arabidopsis (Kim, 2013; Lei, 2019; Zhang, 2012). This review demonstrated an important role ABA has in senescence and the functions of NAP transcription factor as well as the ideal techniques for studying NAP involving NAP mutants, Y1H analysis, qPCR, EMSA, and pull-down assays, allowing for both in vivo and in vitro level of analysis.
References
1. Chen Y, Qiu K, Kuai B, Ding Y. Identification of an NAP-like transcription factor BeNAC1 regulating leaf senescence in bamboo (Bambusa emeiensis
‘Viridiflavus’). Physiol Plant. 2011; 142: 361-371. 2. Fan K, Bibi N, Gan SS, Li F, Yuan S, Ni M, Wang M, Shen H, Wang X. A novel
NAP member GhNAP is involved in leaf senescence in Gossypium hirsutum.
J Exp Bot. 2015; 66: 4669-4682. 3. Fan K, Shen H, Bibi N, Li F, Yuan S, Wang M, Wang X. Molecular evolution and species-specific expansion of the NAP members in plants. J Integr Plant
Biol. 2015; 57: 673–687. 4. Kim YS, Sakuraba Y, Han SH, Yoo SC, Paek NC. Mutation of the Arabidopsis
NAC016 Transcription Factor Delays Leaf Senescence. Plant Cell Physiol. 2013; 54: 1660-1672. 5. Kou X, Watkins CB, Gan SS. Arabidopsis AtNAP regulates fruit senescence.
Journal of Experimental Botany. 2012; 63: 6139-6147. 6. Lei W, Li Y, Yao X, Qiao K, Wei L, Liu B, Zhang D, Lin H. NAP is involved in
GA-mediated chlorophyll degradation and leaf senescence by interacting with
DELLAs in Arabidopsis. Plant Cell Rep. 2019; 1: 75-87. 7. Li F, Li J, WQian M, Han M, Cao L, Liu H, Zhang D, Zhao C. Identification pf Peach NAP Transcription Factor Genes and Characterization of their
Expression in Vegetative and Reproductive Organs during Development and
Senescence. Front Plant Sci. 2016; 7: 147. 8. Wang X, Gao J, G S, Song Y, Yang Z, Kuai B. The H3L27me3 demethylase
REF6 promotes leaf senescence through directly activating major senescence regulatory and functional genes in Arabidopsis. PLoS Genet. 2019; 15: e1008068. 9. Yang J, Worley E, Udvardi M. A NAP-AAO3 Regulatory Module Promotes
Chlorophyll Degradation via ABA Biosynthesis in Arabidopsis Leaves. Plant
Cell. 2014; 12: 4862-74. 10. Zhang K, Gan SS. An Abscisic Acid-AtNAP Transcription Factor-SAG113
Protein Phosphatase 2C Regulatory Chain for Controlling Dehydration in
Senescing Arabidopsis Leaves. Plant Physiol. 2012; 158:961-969.
Mental Model: A Failure to Formalize and Mechanize Reasoning
Shimin Mo is a third-year Psychology Research student. Abstract: Revolution has taken place in the debate of human reasoning. Mental model theory is now a widely acceptable theory that captures the nature of human reasoning. It is able to explain the way humans perform reasoning tasks in daily life as it proposes that people construct mental models to make decisions. Although this theory attempts to analyze the reasoning process, it fails to formalize and mechanize reasoning. Thus, no computer programs or algorithms have been developed to actually simulate human reasoning. This paper investigates abduction, one of the three core reasoning concepts (deduction, induction and abduction), and discusses how it is unlikely that abduction can be performed with a mental model in a machine. Specifically, a mental model does not explain how to zero in on the relevant knowledge for abduction. No hypothesis construction or selection criterion is established, nor has a non-supervised machine been invented to recognize causal relations. In conclusion, it is unlikely that machines can reason with a mental model as the underlying supporting theory at the current state.
Mental Model: A Failure to Formalize and Mechanize Reasoning
The ability to reason and perceive are considered the two superior human cognitive capacities (Zhou, 2019). There has been a long-lasting debate on how humans reason. Thirty years ago, scientists agreed that human reason is based on mental logic, which consists of formal rules of inference similar to those in logical calculus (JohnsonLaird, 2010). However, later research on human reasoning revealed inconsistencies between mental logic and humans’ reasoning in daily life. For example, mental logic proposes that there are two steps people follow when making a deductive inference. People first recover the logical forms of the premises. In this way, only the syntax of the premises matters because words that carry meanings are extracted, and only the syntax of the sentences stays. They then apply formal rules to obtain a conclusion (Johnson-Laird, 2010). Nonetheless, everyday
assertions may not necessarily follow the same syntax format. It will be extremely complicated if the speaker wants to convey more information. Besides, attempts to mechanize reasoning failed because no algorithms can recover everyday assertions to logical forms. However, a logician can work it out successfully. Since logical forms needed for mental logic also depend on knowledge (Johnson-Laird, 2010), humans are aware of the meaning of the words within the premises. So, they can determine the relationship between premises and make deduction inferences. Moreover, mental logic also suggests that formal logic is monotonic (Johnson-Laird et al., 2015). That is, a conclusion is never withdrawn if the inference is valid, not even when a newly added premise contradicts it. However, humans do not behave in this way. Defeasible reasoning happens when additional information that falsifies the unverified preconditions is present and that the default knowledge is retracted (Longo & Dondio, 2014). The conclusion is always withdrawn if they detect inconsistencies with the new premise. Given that mental logic does not accurately depict human reasoning, an alternative theory – the mental model theory is proposed to remedy some aspects of human reasoning that mental logic fails to capture (Johnson-Laird, 2010). Although a consensus on a formal definition of a mental model has not been reached, there are two characteristics that scientists agree on: mental models are internally held and can affect individuals' behaviours (Rook, 2013). In this paper, a mental model refers to "a concentrated, personally constructed, internal conception, of external phenomena (historical, existing or projected), or experience, that affects how a person acts" (Rook, 2013). The mental model theory better captures the nature of human reasoning than mental logic does. For example, mental model theory suggests two separate systems—intuitive system and deliberative system in human reasoning (Johnson-Laird & Khemlani, 2013). Similar to the dual processing theory mechanism, the intuitive system can only represent one mental model for rapid conclusion since it has no access to working memory. On the contrary, the deliberative system can construct multiple mental models, search for alternative models and manipulate them. Hence, mental model theory is the most prevalent theory in analyzing humans' ability to reason.
Nonetheless, this paper will argue that the mental model theory, although good at analyzing reasoning, fails to formalize the abductive inference process and cannot mechanize reasoning on machines. Constructing a model for abductive reasoning requires a hypothesis construction and selection criteria and also the understanding of causal relations. However, the mental model theory does not provide such an account that can be applied to machines. This paper will first introduce two features of mental model theory to lay the foundation for further discussion. Then, it will discuss the insufficient account of abduction in mental model theory and how it is implausible to implement abduction in computers. Finally, this essay presents an example of the current attempts on machine reasoning and how those claimed implementations of machine reasoning still have deficits in their use of unsupervised learning.
Introduction to Mental Model Theory Mental model as an internally held representation of the external world
Human beings are thought to construct their mental model uniquely (Jones et al., 2011). Depending on their personal experiences, perceptions and understanding of the world, each individual’s mental model of external reality varies. Even looking at the same event may produce two different mental models for two individuals due to their diverse understanding of this event. Although individual differences widely exist, there are still principles that individualized mental models manifest (Holyoak & Morrison, 2012). The first principle – the principle of iconicity, indicates that a mental model people construct reflects the perceived premises. For example, if a problem consists of statements about the spatial relationship, the mental model one constructs is likely a reflection of the spatial relationship (Ragni & Knauff, 2013). The following problem from Ragni and Knauff’s research provides a vivid example. The Ferrari is parked to the left of the Porsche The Beetle is parked to the right of the Porsche The Beetle is parked to the left of the Hummer The Hummer is parked to the left of the Dodge
Question: Is the Porsche (necessarily) parked to the left of the Dodge? Participants in this study can easily construct a mental model that has the arrangement like the following: Ferrari Porsche Beetle Hummer Dodge With that model in mind, participants can make a decision and answer the corresponding question.
Mental Model Versus Schema: The Dynamic Nature of Mental Model
One function of the mental model is its ability to affect people's behaviours (Rook, 2013). Cognitive processes like judgment, reasoning, and problem solving that produce the behavioural responses depend on the result produced by manipulating the stimuli' complex mental representations. A substantial amount of the literature in cognitive psychology claims that a mental model is a mental organization of knowledge (Rook, 2013). People's understanding or comprehension of the world relies on the knowledge structure in the mental models. However, the external environment is constantly changing and therefore, the mental model is also dynamic (Rook, 2013). Another cognitive structure, schema, can be easily confused with the mental model (Ifenthaler & Seel, 2013). Schema is the pattern formed by capturing the common features across events and can guide people's decision making under new contexts (Pudhiyidath et al., 2020). In this empirical study done by Ifenthaler and Seel (2013), whether or not participants were doing model-based or schema-based reasoning was distinguished by measuring participants' possibility of change in their task performance at various measurement points. As mental models are dynamic and subject to change, participants were more likely to perform differently. In contrast, schemas are the subsequent stabilization of the probability of change reflected by a low probability of change. Hence, researchers concluded that cognitive structure transition from mental model to schema is characterized by the possibility of performance change from task to task. The flexibility and dynamical nature of mental models help human beings manipulate their mental models easily according to the changing external stimulus.
Abduction in Mental Model Theory
The main contribution of mental model theory is its attempts to remedy the flaws of previous theories that manage to analyze human reasoning (Johnson-Laird et al., 2015). Mental model theory is thus a better theory in analyzing human reasoning because of the improvements mentioned above. Although deduction, induction, abduction are the three systematized core concepts in C.S. Peirce’s methodological philosophy, the studies on reasoning always emphasize the latter two (Åsvoll, 2014). Sometimes, abduction is categorized as a subtype of induction, and confusion could arise (Aliseda, 2017). However, there are clear distinctions between these two reasoning processes and equating them is neglecting a crucial part of human’s ability to reason. Three major differences are identified in the article by Aliseda (2017). Abduction always starts from a single observation and ends with an explanation of the observation. Comparably, induction will extract general statements from a set of observations. Besides, the statement produced by induction can predict further observation, whereas abduction does not have a strong prediction power as induction. Lastly, induction does not require background theory to draw conclusions, but it depends on background theory to construct and test the constructed explanations.
Selection Criteria for the Best Hypothesis and Relevant Explanations
Human reasoners’ capacity to formulate explanations surpasses any known algorithm (Johnson-Laird, 2010). When given a premise and a question, people can generate different explanations. For example, when provided with a premise of “If a pilot falls from a plane without a parachute, then the pilot dies,” and a question of “The pilot did not die. Why not?”, participants provided different explanations (Johnson-Laird et al., 2004). For instance, “The plane was on the ground and s(he) did not fall far,” “The pilot fell into deep snow and so was not hurt,” or “The pilot was already dead.” This result also reflects how people could generate different mental models even when the premise is the same. Hence, mental models are highly subject to an individual’s knowledge, personal experiences and even preference for each possible model, as is mentioned in the
previously stated characteristic of the mental model. Nonetheless, the mental model theory does not address the process of abduction directly. This is not surprising as mental models start from a set of existing premises and use those given conditions to construct internal representations. As it is meaningless to repeat the premise and produce no novel or parsimonious information (JohnsonLaird, 2010), abductive reasoning does not create any mental model until a set of possible explanations toward the given observation is generated. Therefore, abductive reasoning consists of two distinct procedures: hypothesis construction and hypothesis selection (Aliseda, 2017). Although only the latter relies on the mental model, the former is a necessary step and without which the mental model of abduction is merely a repetition of the premise. C.S. Peirce’s formulation of abduction has been interpreted as the following argument-schema (see Figure 1) in AI circles (Aliseda, 2017). In this formulation, C is the observation or the given facts, A could be any hypothesis that explains C. The pilot example mentioned above can be an exemplification of this formula. From a given fact that "a pilot did not die from the fall from a plane without a parachute" (C), each participant could generate a hypothesis (A) to explain this fact. Although it is not stated explicitly in this formulation, an observation can be explained by multiple hypotheses (Aliseda, 2017). There could be hypotheses B, D, E, F, G, as shown in the pilot question, that can explain the observation. Abductive reasoning is characterized by its utilization of background theory (Aliseda, 2017). This theory consists of the possible causes of the observation event (Console et al., 1991), that is, not necessarily all possibilities. Human beings have such a knowledge base of what might cause a pilot to fall from a plane without a parachute and have that knowledge all sorted into a particular and unique theory. When asked to reason about the observation, they can extract one of the causes. During this hypothesis construction procedure, knowledge and the understanding of causal relation are two essential determinants. Knowledge provides a pool of factors in which people can judge whether every single factor has causal relation with the given premise (Johnson-Laird, 2010). However, the mechanization of hypothesis construction on computers or machines fail to address the two necessary conditions mentioned
above. If given a knowledge base that contains substantial facts that are able to answer the premise, there is no specified principle or rules that can command the computer to select the relevant facts. Not even to mention whether computer programs can identify causal relations without human supervision (Blanco et al., 2008).
Figure 1
C.S. Peirce’s Formulation of Abduction
When the abduction process moves to the hypothesis selection stage, problems still exist. If it is assumed that with a pre-existing input of relevant facts that could all cause the premise, the computer program now has to "decide" which hypothesis is the best for the explanation, namely inference to the best explanation, IBE (Harman, 1965). It is the process of picking out the most likely factors to explain the premise and no other hypothesis can outcompete it. However, how to determine which hypothesis is better is also worth considering. A better hypothesis or inference could be simpler, more plausible, more explanatory or less ad hoc (Harman, 1965). It is difficult to decide which consideration is better if the selection criterion for the best inference is not specified. Human reasoners can easily make such decisions because they are aware of the context in which a particular hypothesis outcompetes the rest. Nonetheless, this chosen factor is not paired with the premise forever. On the contrary, the best explanation can change constantly depending on the context. That is, an individual generates hypotheses and selects the best inference with the knowledge of the context (Johnson-Laird, 2010). Moreover, For human reasoners, individual differences (knowledge, personal experiences) may lead to different mental models (Johnson-Laird, 2010). For instance, participant A suggested that the pilot fell into deep snow because s(he) may have seen news reporting a similar accident before. Nevertheless, participant B may have refuted this
possibility as (s)he may know how unlikely it is for the pilot to survive after falling from the plane without a parachute. Therefore, (s)he could have concluded that the pilot was dead before falling out of the plane. In this case, participants have a preference for the best explanation. In conclusion, the mental model theory fails to account for the formulation of hypothesis selection. It does not specify what is counted as a better inference, how a better inference is selected from all the hypotheses generated and how a machine considers the knowledge of context like a human would. The obstacles of recognizing context and selecting the best explanation lies between machine abduction and mental models. Moreover, the mental model theory does not explain how humans perform non-monotonic reasoning either. Non-monotonic reasoning is crucial as people do not have a complete set of knowledge in mind in reality (Ragni et al., 2017). In reality, conclusions are withdrawn when people receive new information that contradicts the previously established one. If additional information is added to the premises, how will the dynamical mental model respond? Also, how does a reasoning program identify which premises are relevant to the newly added information? Again, if the rule of distinguishing relevancy is not established, it is difficult for a machine to perform reasoning tasks by constructing and manipulating models.
An Example of Mechanizing Mental Model on Computer Program
In this section, the discussion will be centred on the attempts to mechanize the mental model to achieve machine reasoning. Abduction has attracted some attention in artificial intelligence (AI) since abductive reasoning is a vital cognitive model (Dai et al., 2019). Although a well-developed mental model reasoning machine is scarce, there are some preliminary attempts to simulate reasoning via the mental model theory. The proposed computer programs that claimed to mechanize abduction fail to address the process of hypothesis construction and selection mentioned in the paper’s arguments. Nonetheless, the presentation of those programs serves as a counterargument that further addresses the unlikelihood of formulating or mechanizing mental models. Researchers developed the reasoning program – mSentential
and applied the principle of sentential reasoning to simulate how human reasoning constructs mental models (Khemlani et al., 2018). It is worth mentioning that the program consists of two systems: the same system 1 and 2 proposed in the dual-processing theory. System 1 bases its conclusion on a single mental model, whereas system 2 can construct many explicit models. Both systems are not the essential focus of this discussion because there is an important presupposition of this program to make it a simulation of human reasoning. A knowledge base is pre-imported inside the program as data input. The knowledge base modulates both system 1 and system 2, but at different stages. For the reasoning that happens in system 1, the program consults that knowledge base if the only constructed mental model generates a conclusion inconsistent with the premises. The pre-existing knowledge base provides relevant explanations to the program. Comparably, since system 2 can construct more than one mental model, it is also effective to avoid making meaningless models. Consider the following example: Pat visited Toronto, or she visited Canada. Rigorously, three possible models can be constructed. Pat visited Toronto Pat visited Canada Pat visited Toronto but not Canada However, human reasoners can tell that the third model is not likely. Toronto is a city in Canada, so if Pat visited Toronto, she must have also visited Canada. The blocking of particular mental models relies on the modulation of knowledge. Thus, cognitive resources are not wasted to generate models that have no meaning in reality. mSentential has explicitly stated that it looks up information from the knowledge base to either generate an explanation to resolve the inconsistency between the premise and conclusion or modulate the production of meaningful mental models. Nonetheless, there is no explanation of how the program zeroes in on the relevant information in the knowledge base. Even though it is a small knowledge base, a selection criterion or principle that restricts the searching process is necessary so that the program can simulate reasoning. If human intervention involves (supervised reasoning), this program fails to model the reasoning process and is also homunculus. It does not
indeed develop a program that can mechanize human reasoning. Instead, human researchers sit behind the scenes and pick the relevant knowledge out, not to mention that this knowledge base is already a simplified version that contains less knowledge. If, hypothetically, there is a theoretical knowledge base in which all knowledge is inside this knowledge bank, what is the formula that enables a program to look up the necessary and relevant knowledge? Programs that apply a similar algorithm as the mSentential fail to address this issue.
Conclusion
Mental model theory can remedy the flaws that previous theories on human reasoning fail to address. In this paper, abduction is the main focus among the three core reasoning concepts. Humans do not follow strict logical rules in daily life to reason or make decisions. Instead, they construct an internal representation of the premises using their knowledge to modulate the mental models. After that, they can select the hypothesis that best explains the premises. Although the mental model theory can analyze human reasoning's underlying process, it fails to formalize and mechanize it onto computer programs. The reason is that human beings can select the relevant information or knowledge in their knowledge base, but there is no conclusive formula that applies to machines. In the mSentential program, even though it is already a supervised reasoning machine and a small knowledge base that contains the required information is provided, no explanation on how the machine selects the relevant knowledge is addressed. Hence, a lack of the essential formula that can assist with relevant information selection is a devastative shortcoming of mechanizing the mental model theory onto computer programs or artificial intelligence.
References
Aliseda, A. (2017). The logic of abduction: An introduction. In L. Magnani & T. Bertolotti (Eds.), Springer Handbook of Model-Based Science (pp. 219–230). Springer International Publishing. https://doi.org/10.1007/978-3319-30526-4_10 Åsvoll, H. (2014). Abduction, deduction and induction: Can these concepts be used for an understanding of methodological processes in interpretative case studies? International Journal of Qualitative Studies in Education, 27(3), 289–307. http://dx.doi.org/10.1080/09518398.2012.759296 Blanco, E., Castell, N., & Moldovan, D. (2008, May). Causal relation extraction. Proceedings of the Sixth International Conference on Language Resources and Evaluation (LREC’08). LREC 2008, Marrakech, Morocco. http:// www.lrec-conf.org/proceedings/lrec2008/pdf/87_paper.pdf Console, L., Dupre, D. T., & Torasso, P. (1991). On the relationship between abduction and deduction. Journal of Logic and Computation, 1(5), 661–690. https://doi.org/10.1093/logcom/1.5.661 Dai, W.-Z., Xu, Q., Yu, Y., & Zhou, Z.-H. (2019). Bridging machine learning and logical reasoning by abductive learning. https://openreview.net/ forum?id=ryxA8NHeLB Harman, G. H. (1965). The inference to the best explanation. The Philosophical Review, 74(1), 88–95. https://doi.org/10.2307/2183532 Holyoak, K. J., & Morrison, R. G. (2012). The Oxford Handbook of Thinking and Reasoning. OUP USA. Ifenthaler, D., & Seel, N. M. (2013). Model-based reasoning. Computers & Education, 64, 131–142. http://dx.doi.org/10.1016/j.compedu.2012.11.014 Johnson-Laird, P. N., Girotto, V., & Legrenzi, P. (2004). Reasoning from inconsistency to consistency. Psychological Review, 111(3), 640–661. https://doi.org/10.1037/0033-295X.111.3.640 Johnson-Laird, P. N., & Khemlani, S. S. (2013). Chapter one—toward a unified theory of reasoning. In B. H. Ross (Ed.), Psychology of Learning and Motivation (Vol. 59, pp. 1–42). Academic Press. https://doi.org/10.1016/ B978-0-12-407187-2.00001-0 Johnson-Laird, P. N., Khemlani, S. S., & Goodwin, G. P. (2015). Logic, probability, and human reasoning. Trends in Cognitive Sciences, 19(4), 201–214. http://dx.doi.org/10.1016/j.tics.2015.02.006 Johnson-Laird, Philip N. (2010). Mental models and human reasoning. PNAS Proceedings of the National Academy of Sciences of the United States of America, 107(43), 18243–18250. http://dx.doi.org/10.1073/ pnas.1012933107 Jones, N. A., Ross, H., Lynam, T., Perez, P., & Leitch, A. (2011). Mental models: An interdisciplinary synthesis of theory and methods. Ecology and Society, 16(1). https://www.jstor.org/stable/26268859 Longo, L., & Dondio, P. (2014). Defeasible reasoning and argument-based systems in medical fields: An informal overview. 2014 IEEE 27th International
Symposium on Computer-Based Medical Systems, 376–381. https://doi. org/10.1109/CBMS.2014.126 Ragni, M., & Knauff, M. (2013). A theory and a computational model of spatial reasoning with preferred mental models. Psychological Review, 120(3), 561–588. https://doi.org/10.1037/a0032460 Ragni, M., Eichhorn, C., Bock, T., Kern-Isberner, G., & Tse, A. P. P. (2017). Formal nonmonotonic theories and properties of human defeasible reasoning. Minds and Machines: Journal for Artificial Intelligence, Philosophy and Cognitive Science, 27(1), 79–117. http://dx.doi.org/10.1007/s11023-0169414-1 Rook, L. (2013). Mental models: A robust definition. The Learning Organization, 20(1), 38–47. https://doi.org/10.1108/09696471311288519 Zhou, Z.-H. (2019). Abductive learning: Towards bridging machine learning and logical reasoning. Science China Information Sciences, 62(7), 76101. https://doi.org/10.1007/s11432-018-9801-4
Distinguishing the Memory of Perceived and Imagined Items
Mehraein Roointan is a fourth-year Neuroscience and Psychology student. Abstract: Perception is the process of receiving and analyzing the incoming sensory stimuli, whereas imagination is the process of creating novel images based on previous knowledge. Despite their apparent difference, studies have found that they activate similar neural pathways. This study examined the participants’ ability to recognize and make source attribution judgments for items they perceived or imagined. In this experiment, the participants saw a series of adjective-noun word pairs, some of which were followed by a corresponding image while others were followed by an empty frame, cueing the participants to imagine the item. Later, the participants were shown the words and they were asked to decide whether they had seen the word previously or if it was a new word. It was found that in general, the participants had better memory for the perceived items, and they were equally likely to make source-monitoring errors for the imagined and perceived items. A limitation of this study was that there was no measure for the vividness of mental images, hence, we couldn’t determine whether the participants were able to imagine the items or not. Future research can remove this limitation using brain imaging techniques such as fMRI, to measure the activity of the brain regions involved in imagination.
Introduction
Human’s mind is filled with knowledge and memories that stem from external or internal sources. A person experiencing an external stimulus can perceive it through analyzing the incoming sensory information, while other information results from internal sources such as the person’s thought processes, reasoning, and even imagination (Johnson & Raye, 1981). However, memories are not labeled with their source. Memories originated from either source will have certain features that allow source inference. This is called source-monitoring. Memories of perceived events contain sensory and contextual
details whereas imagined memories contain details that are based on the person’s prior knowledge and cognitive processes (Garrison et al., 2017). Despite the apparent differences, neuroimaging studies have found that both processes activate similar neural networks in the brain (Kosslyn & Thompson, 2003; Zeidman & Maguire, 2016). This finding led the researchers to suggest that memories of perceived and imagined events might interfere with each other during retrieval, leading to source-monitoring errors (Mathews et al., 2013). A study found that after a long retention interval, people report having seen a picture that they had only read its description. This false memory is likely a consequence of constructing a vivid mental image of the picture while reading its descriptions (Intraub & Hoffman, 1992), which tricks the mind into thinking that the person actually saw the imagined picture (Paivio et al., 1968). On the other hand, another study found that the participants’ memory was more accurate for the perceived objects (Rosburg et al., 2011). They justified their finding through the picture superiority effect which states that the perceptual richness of the perceived images enhanced their accessibility and led to more accurate memories. Another study conducted by Johansson, Stenberg, Lindgren, and Rosén (2002), also investigated the memory of perceived and imagined events. In this experiment, the participants were shown a series of words which were either followed by a corresponding image, or an empty frame which was a cue for the participants to try and imagine the object. The pictures used in this experiment were simple black and white line pictures, and the participants were instructed to create their mental images in the same format. Later, some of the participants took part in an old/new recognition and the rest performed a source-monitoring task. The results indicated that in both tasks, there was no difference in performance for the imagined and perceived items. This finding was not consistent with the aforementioned research. This inconsistency could be due to a few limitations of the experimental design. First, the experiment used black and white line images and instructed the participants to create mental images in the same format. However, when instructed to imagine an object, most people imagine the object in a way that they commonly see it in the real world (Mathews et al., 2013). Therefore,
it might have been harder for the participants to create mental images in this format, hence the external validity of the findings is low. Secondly, there was no retention period between the study and the test phase. Therefore, it is not clear whether after a longer retention period the memory for the imagined and perceived items would be different or not. The purpose of the present study was to examine the memory for the imagined and perceived items in combination with reality monitoring. The design of the experiment was similar to the aforementioned study. However, to remove the mentioned limitations, this experiment included a two-minute retention period, and the stimuli of this study were coloured pictures of common objects that closely resembled their appearance in the real world. Moreover, the participants were asked to imagine the items in as much detail as they could, so that their mental images would closely resemble the actual object. Furthermore, the presented word labels were adjectivenoun pairs such as a blue book, or a red ball. It was predicted that the presence of the adjectives would guide the mind into creating more vivid and specific mental images. Therefore, it was hypothesized that firstly, the participants would correctly recognize and identify the source of the items more often than not, and secondly, they would have a better memory of the imagined items due to the generation effect (Slamecka & Graf, 1978), hence, making fewer recognition errors. Lastly, they would be able to create vivid mental images, which would lead to falsely identifying the imagined items as perceived.
Methods Participants
The participants consisted of 24 individuals (N = 24), 10 males and 14 females, in the age range of 18-60. The average age was 25. They were friends or family who were recruited by the experimenters. All the participants were fluent in English, had normal or corrected vision.
Ethics
There was a low risk of group vulnerability since the participants were adults and did not have a history of psychological
and neurological disorders or any other types of pre-existing vulnerabilities. Furthermore, the tasks used in this experiment were simple cognitive tasks which did not pose any type of physical or emotional harm and stress, so this experiment is considered to be low risk.
Material and Design
All participants saw a total of 60 words that were shown in a random order. Half of the words belonged to the imagined group while the other half belonged to the perceived group. Since all participants saw the words belonging to both perceived and imagined groups, this was a within-subjects design. Due to government isolation protocols, all subjects participated in the experiment from their homes and used their own computers. The independent variable was the words that were assigned to each condition (perceived vs. imagined), and the dependent variable was the accuracy of the participants in identifying the perceived, imagined, and new items. Consent Form. The participants viewed the consent form, and they were given enough time to carefully read it. They provided verbal agreement to the experimenter via Zoom. If participants did not agree to participate in the experiment, the session was terminated immediately and no data was collected. A PDF of the consent form would be provided to the participants upon request. Debriefing. After the experiment was concluded, all participants were debriefed on the purpose, hypothesis, the importance of the research question, and the rationale behind the experiment’s design. The debriefing form can be found in Appendix A. Stimulus. The stimulus was a series of concrete adjectivenoun word pairs. A total of 90 concrete nouns were randomly chosen from a previous study that examined the concreteness of 260 words (Snodgrass & Vanderwart, 1980). A list of adjectives was created using a random word generator. The adjectives were selected if they were specific and concrete enough to evoke a mental image. The list of word-pairs can be found in Appendix B. The word pairs were randomly categorized into three conditions of imagined, perceived, and new. There were three counterbalancing groups to ensure that all words were presented in all conditions. Moreover, the participants
were randomly assigned to one of these counterbalancing groups. Pictures. For the word pairs in the perceived condition, colored pictures that accurately represented each word-pair, were acquired using Google Images. Each of the images closely resembled the real-world appearance of each object.
Procedure
The experiment took place via Zoom, using screen-sharing to present a PowerPoint presentation. The experiment consisted of a study phase, a retention period, and a test phase. All stimuli were typed in black 24-point Times New Roman, and they were presented at the center of the screen. During the study phase, each trial began with a fixation cross which was displayed for 1000 ms, followed by a word-pair which was displayed for 1000 ms. There were a total of 60 adjective-noun pairs. Half of these were followed by a corresponding image which was enclosed by a 460 x 400 frame, and the participants were instructed to look at the picture (the perceived condition). The other half were followed by an empty frame, which cued the participants to imagine the described item. Both the picture and the frame were presented for 6000 ms (Figure 1). All participants saw both groups of stimuli, and they were presented in random order. Prior to the experiment, the participants were given the required instructions, and the meaning of the empty frame was explained.
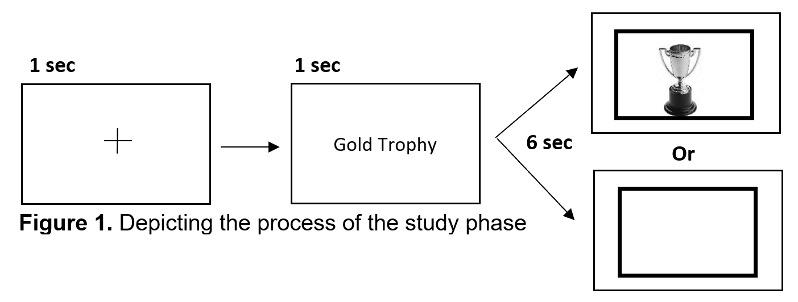
After the study phase, there was a two-minute retention period during which the participants were told to take a break. Following the retention interval, the participants received instructions, and took part in a test phase. Each trial began with a fixation cross which was displayed for 1000 ms. After that, a word-pair was presented for 1000
ms followed by a 15000 ms response interval, although the participants were instructed to respond as fast as possible. The participants were instructed to verbally identify the words as imagined, perceived, or new. (Figure 2) During the test phase, the participants saw a total of 90 word-pairs, which was composed of all 60 word-pairs that were previously studied (30 imagined items + 30 perceived items), in addition to 30 new word-pairs. Prior to each task, the participants were given thorough instructions, and they were given a test trial in order to assess their understanding of the instructions.
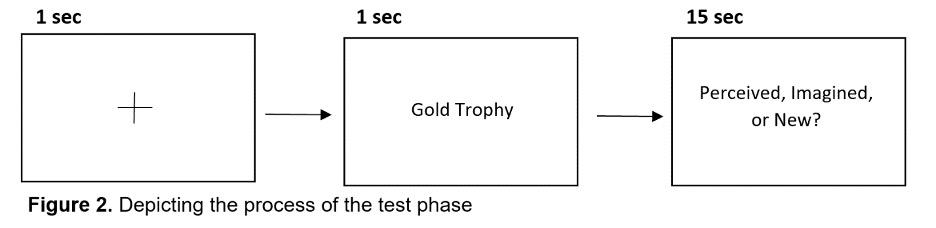
Results
In this experiment, there were two possible types of errors. The first type is the recognition error, wherein the participants did not recognize the items studied during the study phase, regardless of their source. To test for this type of error and to ensure that the participants were not randomly answering imagined or perceived for all words, the proportion of old responses was compared to the proportion of new responses across the three conditions of perceived, imagined, and new. In this case, the imagined and perceived responses for each of these conditions were combined, and they were considered as old responses. Since this experiment followed a within-subjects design, a series of paired samples t-tests were used to analyze the results. It was found that the proportion of old responses was significantly lower for the new condition. However, both perceived and imagined conditions displayed a high proportion of old responses (Figure 3). A paired-sample t-test was performed to compare the proportion of old responses for the imagined (M = 0.86, SD = 0.15) and perceived (M = 0.93, SD = 0.064) conditions. It was found that the proportion of old responses was significantly higher for the perceived condition compared to the imagined condition t(23) = -2.52, p < .05; d = .51.
However, the effect size is lower than Cohen’s (1988) baseline for a large effect size. This finding indicates that the participants recognized and identified the perceived items as old more often than the imagined items. This suggests that the participants generally had a better memory for the perceived items than the imagined items. Since it was expected that the participants would have a better memory for the imagined items due to the generation effect, this finding was not consistent with the hypothesis.
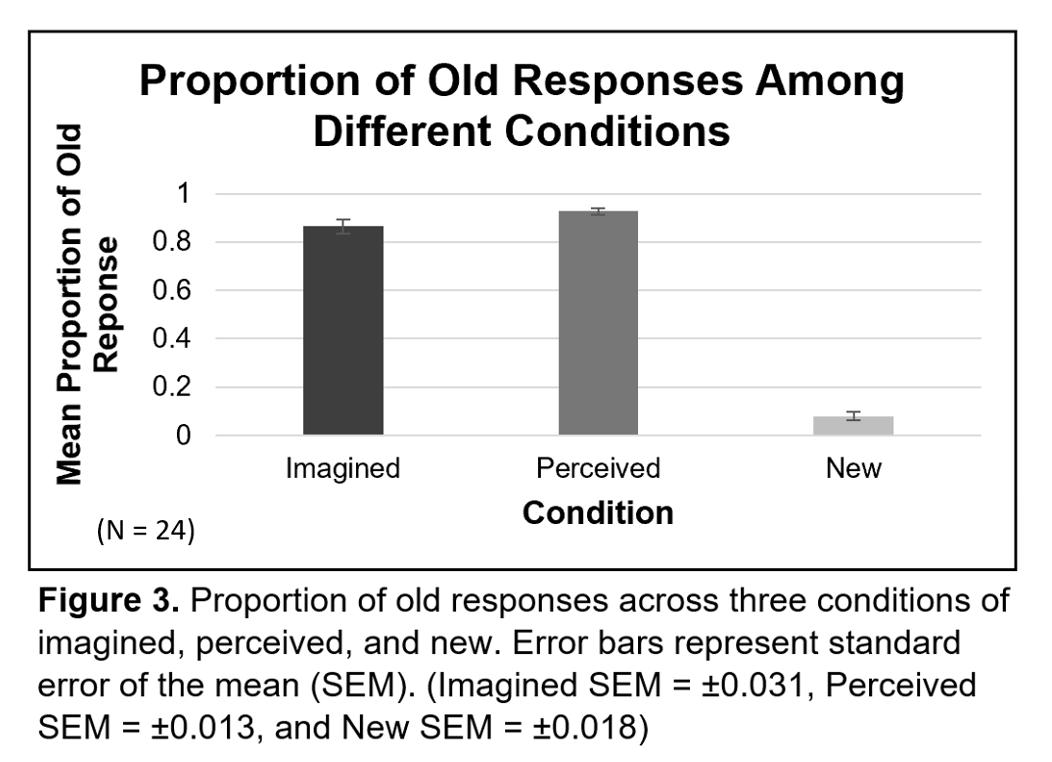
The second type of error in this experiment was a source monitoring error, where the participants recognized an item as old, but could not make correct source-attribution judgments. Therefore, another paired sample t-test was performed to compare the proportion of correct responses between the imagined (M = 0.83, SD = 0.19) and perceived conditions (M = 0.87, SD = 0.12). It was found that there was no significant difference in the proportion of correct responses between these two conditions t(23) = -1.44, p = .16. This finding indicates that both the imagined and perceived items were equally likely to be correctly attributed to their sources, which is inconsistent with the hypothesis, which stated that the participants would be better at source monitoring for the perceived items. Furthermore, another paired sample t-test was carried out to compare the proportion of wrong answers in perceived (M = 0.13,
SD = 0.12) and imagined (M = 0.17, SD = 0.19) conditions. The analysis revealed that there was no significant difference between the proportion of wrong answers between these two conditions t(23) = 1.45, p = .16. Therefore, the likelihood of making source-monitoring errors was similar for both the perceived and imagined items. This finding was also inconsistent with the hypothesis which had predicted that the participants would make more source-attribution errors for the imagined items. Since there were two possible wrong answers for each condition, a paired sample t-test was carried out to find if there was a difference between the proportion of perceived responses (M = 0.33, SD = 0.052) compared to the proportion of new responses (M = 0.14, SD = 0.15) in the imagined condition. It was found that the proportion of new responses was significantly higher compared to the proportion of perceived responses in the imagined condition t(23) = -4.16, p < .05; d = .85 (Figure 4A). The effect size for this analysis was found to exceed Cohen’s (1988) baseline for a large effect, indicating that the participants were more likely to misidentify the imagined items as new rather than perceived. Hence, they did not have a good memory for the imagined items, and upon encountering these items in the test phase, it was as if they had encountered them for the first time. This finding was not consistent with the hypothesis. A paired sample t-test was carried out for the proportion of imagined responses (M = 0.55, SD = 0.083) compared to the proportion of new responses (M = 0.074, SD = 0.064) for the perceived items. (Figure 4B) It was found that there was no significant difference between these two types of wrong responses in the perceived condition t(23) = -1.039, p = .31 (Figure 2B). This finding implies that the participants were equally likely to make recognition or source monitoring errors for the perceived items. Taken together, it can be concluded that the participants were more likely to recognize and correctly identify the sources of the items than to not recognize or misattribute their sources; which is consistent with the hypothesis. However, when they did make mistakes, they were equally likely to make source attribution errors for both the perceived and imagined items. Although, for the imagined items, the
participants were more likely to make recognition errors rather than source-monitoring eros. Suggesting that overall, in contrast to the hypothesis, the participants did not have a good memory for these items.
Discussion:
Despite the apparent differences, studies have found that imagination and perception engage similar neural pathways within the brain (Kosslyn & Thompson, 2003). Therefore, during retrieval, especially if the mental images are vivid, it might be hard to distinguish between the two, which can lead to source monitoring errors (Paivio et al., 1968). The results of this experiment supported the hypothesis which stated that the participants would correctly recognize and identify the source of the items more often than not. However, the hypothesis, which predicted that the participants would make more source attribution errors rather than recognition errors for the imagined items compared to the perceived items, was not supported. In contrast, it was found that the participants were more likely to make recognition errors for the imagined items. Moreover, in contrast to expectation, the participants recognized the perceived items more often than the imagined items, indicating that they had a better memory for the perceived items. This finding was not consistent with the study conducted by Johansson, Stenberg, Lindgren, and Rosén (2002). It is noteworthy that due to the small sample size, the statistical power of this analysis was lower than 80%; therefore it is
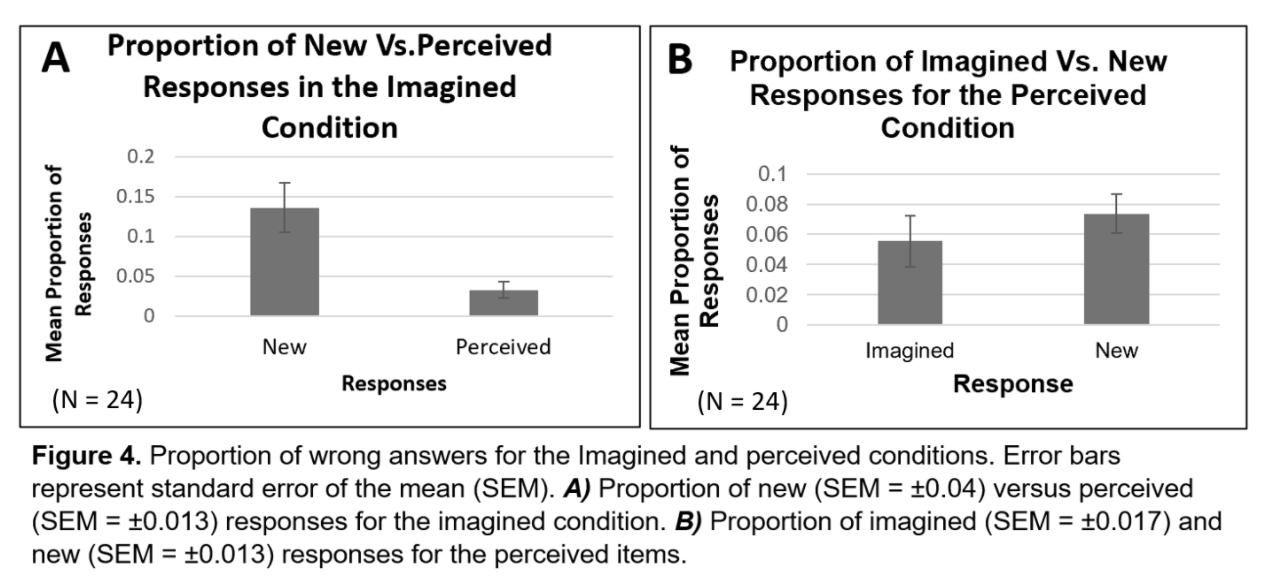
possible that this statistically significant difference was in fact a false positive (Button et al., 2013). The better memory of the participants for the perceived items can be justified by the picture superiority effect, which states that items presented as pictures are better remembered and recognized compared to items presented in words, even if the words were concrete and provoked creation of mental images (Defeyter et al., 2009). Furthermore, during the study phase, the participants had six seconds to either perceive the image or try to imagine the item. Creating a mental image requires attention and cognitive resources (Pelaprat & Cole, 2011), so it is possible that while trying to imagine the item, the participants were not able to rehearse the word itself. Hence, for those items that they weren’t able to create vivid mental images, during the test phase, not only the word wouldn’t cue them into remembering the mental image, the word itself wouldn’t seem familiar to them either (Paivio et al., 1968). Therefore, they were more likely to identify these items as new. On the other hand, when the perceived items were presented during the study phase, the participants were not required to make an effort to create a novel image, so they could spend their time observing the images, processing them, and rehearsing the words. Consequently, during the test phase, they were more likely to recognize the perceived items because not only the word would remind them of the picture, but the word itself would also seem familiar. After recognizing the items, the participants had to attribute them to their source. It was found that in general, the participants correctly attributed the items to their sources more often than not. However, in contrast to the expectations, they were equally likely to make source-attribution errors for both the perceived and imagined items. Seeing the word in the test phase would trigger a memory, and in order for the participants to make source-attribution judgments, they would have to evaluate the cognitive, perceptual, and contextual features of each of the memories. This evaluation process is slow and requires time and effort (Johnson, 1997). However, since the participants were instructed to respond as quickly as possible, it is possible that they did not perform an extensive evaluation. Furthermore, due to the small sample size, the power of this analysis
was significantly low, which significantly increased the chance of type II error. Therefore, it is highly possible that this was a false negative (Banerjee et al., 2009); and it is likely that a study with a larger sample size and higher statistical power, would find significance. One of the main limitations of this experiment was the small sample size, which significantly reduced the statistical power. Therefore, it is possible that the observed results, regardless of being significant or not, were not in fact true effects. Furthermore, due to the restrictions due to the pandemic, the participants were not chosen randomly, therefore, the external validity of the findings are questionable (Mitchell, 2012). Another limitation of this experimental design was that the experiment consisted of a single long trial. Research has shown that the average attention span is 15 minutes, and after that the mind will begin to lose focus from the main task (Bradbury, 2016). Therefore, it is possible that the participants became tired towards the end of the experiment, which led to less accurate judgments during the test phase. Furthermore, since imagination requires effort and uses cognitive resources (Pelaprat & Cole, 2011), it is possible that during the study phase, the participants were fatigued after a while, and hence did not try to imagine the rest of the items or made less effort, leading to less vivid mental images. This limitation can be removed by having two trials and a break in between rather than one long trial. Lastly, in this experiment, it was not possible to check if the participants were actually imagining the items, so some of the participants may not have even tried to imagine the items. This limitation can be removed by including questionnaires or self-reports regarding the vividness of the mental images. Future studies can remove the aforementioned limitations and take a step further by using brain imaging techniques such as fMRI to measure the activity of brain regions involved in imagination, such as the left supramarginal gyrus (Oberhuber et al., 2016), to confirm that the participants are in fact trying to imagine the items. If future studies also find that the memory is better for the perceived items compared to the imagined items, this can have implications for teaching strategies. Based on this result, it would be plausible to conclude that including pictures, diagrams, graphs, and other visual aids in slides and teaching materials can lead to better learning for the
students and increase material retention. This study found that in general, people are able to recognize and correctly make source-attribution judgments for the items they have previously studied. However, it was found that they had better memories for the perceived items compared to the imagined items. Due to the small sample size, the statistical power of this analysis was very low, therefore, the findings may not be true effects. Future studies can remove the limitations of the current experiment and examine the memory for the perceived and imagined items at a much deeper level.
Acknowledgments
The author is grateful to Madeline Antidormi and Christie Lai for their assistance in designing the experiment and recruiting participants.
References
Beaty, R. E., Christensen, A. P., Benedek, M., Silvia, P. J., & Schacter, D. L. (2017). Creative constraints: Brain activity and network dynamics underlying semantic interference during idea production. NeuroImage, 148, 189-196. https://doi.org/10.1016/j.neuroimage.2017.01.012 Benedek, M., Schües, T., Beaty, R. E., Jauk, E., Koschutnig, K., Fink, A., & Neubauer, A. C. (2018). To create or to recall original ideas: Brain processes associated with the imagination of novel object uses. Cortex, 99, 93-102. https://doi.org/10.1016/j.cortex.2017.10.024 Banerjee, A., Chitnis, U. B., Jadhav, S. L., Bhawalkar, J. S., & Chaudhury, S. (2009). Hypothesis testing, type I and type II errors. Industrial psychiatry journal, 18(2), 127–131. https://doi.org/10.4103/0972-6748.62274 Bradbury, N. A. (2016). Attention span during lectures: 8 seconds, 10 minutes, or more? Advances in Physiology Education, 40(4), 509–513. doi: 10.1152/ advan.00109 Button, K. S., Ioannidis, J. P., Mokrysz, C., Nosek, B. A., Flint, J., Robinson, E. S., & Munafò, M. R. (2013). Power failure: Why small sample size undermines the reliability of neuroscience. Nature Reviews Neuroscience, 14(5), 365-376. doi:10.1038/nrn3475 Defeyter, M. A., Russo, R., & Mcpartlin, P. L. (2009). The picture superiority effect in recognition memory: A developmental study using the response signal procedure. Cognitive Development, 24(3), 265-273. doi:10.1016/j. cogdev.2009.05.002 Garrison, J. R., Bond, R., Gibbard, E., Johnson, M. K., & Simons, J. S. (2017).
Monitoring what is real: The effects of modality and action on accuracy and type of reality monitoring error. Cortex, 87, 108-117. doi:10.1016/j. cortex.2016.06.018 Intraub, H., & Hoffman, J. E. (1992). Reading and Visual Memory: Remembering Scenes That Were Never Seen. The American Journal of Psychology, 105(1), 101. doi:10.2307/1422983 Johansson, M. (2002). Memory for perceived and imagined pictures—an eventrelated potential study. Neuropsychologia, 40(7), 986-1002. doi:10.1016/ s0028-3932(01)00148-8 Johnson, M. K., & Raye, C. L. (1981). Reality monitoring. Psychological Review, 88(1), 67–85. https://doi.org/10.1037/0033-295X.88.1.67 Johnson M. K. (1997). Source monitoring and memory distortion. Philosophical transactions of the Royal Society of London. Series B, Biological sciences, 352(1362), 1733–1745. https://doi.org/10.1098/rstb.1997.0156 Kosslyn, S. M., & Thompson, W. L. (2003). When is early visual cortex activated during visual mental imagery?. Psychological bulletin, 129(5), 723–746. https://doi.org/10.1037/0033-2909.129.5.723 Lamberts, K., Brockdorff, N., & Heit, E. (2002). Perceptual processes in matching and recognition of complex pictures. Journal of Experimental Psychology: Human Perception and Performance, 28(5), 1176–1191. https://doi. org/10.1037/00961523.28.5.1176 Mathews, A., Ridgeway, V., & Holmes, E. A. (2013). Feels like the real thing: imagery is both more realistic and emotional than verbal thought. Cognition & emotion, 27(2), 217–229. https://doi.org/10.1080/0269993 1.2012.698252 Mitchell, G. (2012). Revisiting Truth or Triviality: The External Validity of Research in the Psychological Laboratory. Perspectives on Psychological Science, 7(2), 109-117. Retrieved December 10, 2020, from http://www. jstor.org/stable/41613550 Mitchell, K. J., & Johnson, M. K. (2009). Source monitoring 15 years later: What have we learned from fMRI about the neural mechanisms of source memory? Psychological Bulletin, 135(4), 638-677. doi:10.1037/a0015849 Mullally, S. L., & Maguire, E. A. (2014). Memory, Imagination, and Predicting the Future: A Common Brain Mechanism? The Neuroscientist, 20(3), 220–234. https://doi.org/10.1177/1073858413495091 Oberhuber, M., Hope, T. M. H., Seghier, M. L., Parker Jones, O., Prejawa, S., Green, D. W., & Price, C. J. (2016). Four Functionally Distinct Regions in the Left Supramarginal Gyrus Support Word Processing. Cerebral Cortex, 26(11), 4212–4226. https://doi.org/10.1093/cercor/bhw251 O'Connor, M. K., Deason, R. G., Reynolds, E., Tat, M. J., Flannery, S., Solomon, P. R., Vassey, E. A., & Budson, A. E. (2015). The imagination inflation effect in healthy older adults and patients with mild Alzheimer's disease. Neuropsychology, 29(4), 550–560. https://doi.org/10.1037/neu0000195 Paivio, A., Rogers, T. B., & Smythe, P. C. (1968). Why are pictures easier to recall than words? Psychonomic Science, 11(4), 137-138. doi:10.3758/
bf03331011 Pearson, D. G., Deeprose, C., Wallace-Hadrill, S. M. A., Heyes, S. B., & Holmes, E. A. (2013). Assessing mental imagery in clinical psychology: A review of imagery measures and a guiding framework. Clinical Psychology Review, 33(1), 1–23. https://doi.org/10.1016/j.cpr.2012.09.001 Pelaprat, E., & Cole, M. (2011). “Minding the Gap”: Imagination, Creativity and Human Cognition. Integrative Psychological and Behavioral Science, 45(4), 397-418. doi:10.1007/s12124-011-9176-5 Random word generator. Random Word Generator. (n.d.). Retrieved November 20, 2020, from https://randomwordgenerator.com/ Rosburg, T., Mecklinger, A., & Johansson, M. (2011). Electrophysiological correlates of retrieval orientation in reality monitoring. NeuroImage, 54(4), 3076-3084. doi:10.1016/j.neuroimage.2010.10.068 Schacter, D. L., Addis, D. R., & Buckner, R. L. (2007). Remembering the past to imagine the future: the prospective brain. Nature Reviews Neuroscience, 8(9), 657–661. https://doi.org/10.1038/nrn2213 Schacter, D. L., Addis, D. R., Hassabis, D., Martin, V. C., Spreng, R. . N., & Szpunar, K. K. (2012). The Future of Memory: Remembering, Imagining, and the Brain. Neuron, 76(4), 677–694. https://doi.org/10.1016/j. neuron.2012.11.001 Schwikert, S. R., & Curran, T. (2014). Familiarity and recollection in heuristic decision making. Journal of experimental psychology. General, 143(6), 2341–2365. https://doi.org/10.1037/xge0000024 Slamecka, N. J., & Graf, P. (1978). The generation effect: Delineation of a phenomenon. Journal of Experimental Psychology: Human Learning & Memory, 4(6), 592-604. doi:10.1037/0278-7393.4.6.592 Zeidman, P., & Maguire, E. A. (2016). Anterior hippocampus: the anatomy of perception, imagination and episodic memory. Nature Reviews. Neuroscience, 17(3), 173–182. https://doi.org/10.1038/nrn.2015.24
Appendix A. Experimental Debriefing Sheet You just completed a cognitive psychology experiment that is part of a class project. We are studying whether people are more biased towards the retrieval of perceived or imagined features in memory. We also wanted to study the effects of using life-like images and concepts on imagination and memory. We had participants first learn a set of perceived and imagined concepts. We then had participants complete a recognition test, answering “perceived”, “imagined” or “new”, to measure memory recall for each item. We manipulated across participants which concepts were imagined and which were perceived. We hypothesized that people would be able to recall the imagined items better as a result of having to self-generate the items. Our main dependent variable is the proportion of correct responses for the word pairs that were perceived, imagined and new in comparison to one another. Some of the zoom calls were recorded in order to verify participants' answers for data analysis. If you are interested in reading more about this kind of research, check out this journal article: Johansson, M. (2002). Memory for perceived and imagined pictures—an event-related potential study. Neuropsychologia, 40(7), 986-1002. doi:10.1016/ s0028-3932(01)00148-8 If you have any questions, please contact the researchers [Mehraein Roointan; m.roointan@mail.utoronto.ca, Madeline Antidormi; m.antidormi@mail.utoronto.ca, Christie Lai; christiee.lai@ mail.utoronto.ca] or the course instructor (Dr. Meg Schlichting; meg. schlichting@utoronto.ca). Please let the researcher know at this time if you would like to withdraw your data, now that you know the specific purpose of this study. Thanks again for participating in our experiment!
Appendix B. List of the adjective-noun word pairs used in the study.
Excited Baby Fuzzy Bed Fluffy Dog Chocolate Cake Smiling Tiger Plain Snack Chubby Chicken Large Hospital Whole Heart Big Mouse Skinny Dog Icy Cup Brown Jacket Tiny Owl Burning Candle Spicy Pepper Shiny Button Straight Line Blue Vase Blue Butterfly Old Book Tight Belt Empty Bottle Pleated Skirt Green Apple Slim Fish Orange Plate Closed Refrigerator Curly Hair Thick Toast Pricey Watch Wide Entrance Loose Tie Gold Ring Soft Pants Bright Sun Damaged Shoe Steaming Kettle Heavy Crown Fluffy Blanket Green Eye Black Glasses Wounded Soldier Wet Gorilla Soggy Fries Pink Chair Wild Horse Dull Pencil Small Tomato Round Table Yellow Bowl Thick Forest Pink Flower Young Puppy Red Ball White Mitten Blue Balloon Purple Phone Long Coat Broken Toaster Pale Skin Green Box Fresh Bread Glossy Dress Plastic Fork Modern House Royal Ring Huge Finger Illuminated Lamp Wooden Window Lazy Guy Angry Mother Pretty Breakfast New Basket Rusty Ship Silver trumpet Short Ladder White Whale Heavy Stool Messy Room Half Moon Historical Door Dark Cloud Fluffy Caterpillar Black Bear Basic Clock Leather Couch Happy Clown Fearful Duck Fat Cat
Multipartite mutualisms in Medicago truncatula are affected by drought stress
Jessie Wang is a fourth-year Ecology & Evolutionary Biology student. Abstract: Mutualisms are commonly viewed as bipartite systems between two symbionts, predominantly in isolation from other organisms. Multipartite mutualisms have strong ecological implications, though the dynamics of multiple mutualists are not well-understood. The legume-rhizobium symbiosis is a welldocumented mutualistic system. Rhizobia fixes atmospheric N2 to supply the plant with nitrogen resources, while the plant provides the bacteria with organic carbon and shelter inside of root nodules. Legume plants are also known to associate with mycorrhizal fungi which aid plant uptake of low mobility nutrients and water. This association may be costly in situations with minimal nutrient or water stress. In this study, we examined the effects of multiple microbial partners in Medicago truncatula under drought conditions. We found that water limitation mediates earlier flowering in fungi-associated plants. However, we did not uncover significant performance benefits in other areas of plant growth and survival that could be attributed to the additional symbiont. Our study suggests the ability to uncover context-specific effects of multipartite mutualisms and demonstrates the need to investigate the dynamics of multiple mutualists in varying resource environments.
Introduction
Symbiosis describes when two or more species closely interact or continuously associate. These relationships are prevalent across all levels of biological organization. Mutualism arises when the interaction is positive; each species involved receives fitness benefits from the association and this acts to reinforce the mutualistic relationship (Currie et al., 2003; Fujita et al., 2014). These associations are commonly viewed as bipartite systems between two symbionts, predominantly in isolation from other organisms (Currie et al., 2003). Theoretical and experimental studies call for the examination of multiple mutualistic partners to evaluate altered fitness landscapes that stem from cooperative and competitive interactions between the
parties involved, which may not be ascertainable in bipartite studies. Examining multipartite mutualisms and the network of interactions between partners is key to understanding the evolutionary dynamics and stability of mutualisms (Currie et al., 2003; Poulsen & Currie, 2010).
Interspecific interactions brought about by mutualisms are essential to maintain the structure of ecological systems. Multipartite mutualisms have strong ecological implications due to the number of species involved and the potential for greater complexity in interaction networks. The rewards provided by each mutualistic partner can vary in strength, similarity, and in the context of the environment (Stachowicz, 2001). Multiple partners may also compete for shared resources provided by a focal mutualist (Johnson & Bronstein, 2019). Multispecies mutualisms can facilitate context-dependent responses through changes in the magnitude and direction of interactions for all partners. These interactions are most advantageous when all rewards provided are beneficial and unique, while redundant benefits are likely to incur negative costs (Stachowicz & Whitlatch, 2005; Afkhami et al., 2014). Benefits provided by mutualists are often costly to produce; changes to the local environment can change the degree to which the interaction is mutually beneficial. In some cases, the net outcome may even be negative (Bronstein, 1994). One well-documented pairwise mutualism occurs between legumes and nitrogen-fixing bacteria, rhizobia. Plants provide rhizobia with organic carbon and shelter inside of root nodules, while rhizobia supply the plant with nitrogen resources synthesized (fixed) from atmospheric N2 (Vance, 2002; Fujita et al., 2014). Recent work has suggested up to 90% of legumes participate in this type of interaction with rhizobia and other nitrogen-fixing bacteria (Afkhami et al., 2018). Furthermore, mutualistic associations between plants and mycorrhizal fungi are widespread in nature. Fungi colonize plant roots, are provided with organic carbon, and in return aid plant uptake of low mobility nutrients (such as phosphorus and nitrogen) and water (Smith et al., 2010; Singh & Prakash, 2012). Studies have observed that mycorrhizal plants grown under water stress conditions display increased drought tolerance and lower drought stress compared to non-mycorrhizal plants (Duan et al., 1996; Augé et al., 2001).
However, the association between plants and mycorrhizal fungi may be costly in situations where there is minimal nutrient or water stress (Stachowicz, 2001). Microbial symbionts may confer complementary benefits to a host plant, and they may also positively influence one another. The effects of multiple mutualists in Medicago truncatula (barrelclover) were previously investigated by Afkhami and Stinchcombe (2016). The study found synergistic effects of rhizobia and mycorrhizal fungi on plant performance; plants grown with both mutualists had higher aboveground biomass, more leaves, and more branches compared to those with one or no mutualistic partner. These findings suggest additional benefits can be induced by coaction of partner mutualists on the focal mutualist. Previous studies have also found positive effects of the partner mutualists on each other; rhizobia increase fungi colonization and sporulation on plant roots while fungi increase rhizobia root nodule number and biomass (Bagyara et al., 1979; Champawat, 1990; Geneva et al., 2006). Synergistic effects of these microbial symbionts may vary with resource environments. Under nutrient-rich and saturated soil conditions, there is minimal nutrient or water stress. In this context, the association with mycorrhizal fungi may be more costly than beneficial. The fungi would still consume carbon but would not provide palpable benefits (i.e. water or nutrients) to the plant. However, under environmental stress, the association with fungi may provide enough benefit to the plant, outweighing the cost by supplying water and nutrients that are otherwise limited or inaccessible. In this study, we examined the effects of a multipartite association with mycorrhizal fungi in conjunction with rhizobial bacteria in M. truncatula. We sought to uncover the contextdependent effects of specific environmental conditions in the greenhouse on plant performance. We hypothesized the association with mycorrhizal fungi would buffer against the costs of drought stress on M. truncatula. If the association were to be advantageous, it could account for the maintenance of the interaction in the wild despite the apparent costs of an additional microbial symbiont.
Methods
Study system We investigated the impact of drought stress on the tripartite mutualism between Medicago truncatula and two microbial symbionts. M. truncatula is widely considered to be a model system for legumes (Young and Udvardi, 2009). In accordance with Afkhami and Stinchombe (2016), we used microbial symbionts that are found with M. truncatula alone and together to simulate natural microbial interactions — rhizobia (Ensifer meliloti) and mycorrhizal fungi (Rhizophagus irregularis) (Zribi et al., 2004).
Experimental design All techniques and materials were conducted in sterile conditions to avoid contamination. The original experiment was conceived by Pebesma and Stinchcombe (2019 EEB488 project proposal; unreferenced). To prepare seeds for germination, we scarified M. truncatula seeds using a razor blade, followed by surface sterilization in ethanol, then bleach, rinsed off with distilled water, and left to soak in distilled water. Seeds were germinated on sterile 0.08% agar plates wrapped in tinfoil and placed in the fridge at 4°C for 10 days. After overwintering, the seeds were removed from the fridge and let sit at 21°C for 18 h, as per Afkhami and Stinchcombe (2016). We individually planted the germinated seeds into pots in the greenhouse. Pots were constructed using nested magenta boxes, with the lower box containing sterile distilled water and a cotton rope wick to transfer moisture to the upper box containing autoclaved sand, as per Heath et al. (2010). No additional nutrients were added to the pots. To ensure a sterile and closed system, we autoclaved all equipment at 121°C prior to use in the experiment. We planted 208 seeds in a generalized randomized block design with a 2x2 factorial design of treatments: mycorrhizal fungi (M±) and drought (D±). All plants across all treatments were inoculated with rhizobia. We set up thirteen spatial square blocks of 16 plants each, with 20 cm between blocks and 4 cm between plants within each block. Treatments were equally represented within each block and between blocks — each treatment comprised a quarter of the plants in
each block (4 plants of each treatment). Plants were inoculated with rhizobia and fungi twice — once on the day of planting and again one week after planting. Four treatment groups: 1. Inoculated with living fungi, exposed to drought (M+D+) 2. Inoculated with living fungi, no drought exposure (M+D-) 3. Inoculated with heat-killed fungi, exposed to drought (M-D+) 4. Inoculated with heat-killed fungi, no drought exposure (M-D-) Prior to inoculation, we grew rhizobia in TY media for 24 hours and diluted to an optical density of 0.1 with sterile distilled water. Each plant received 1 mL of rhizobial inoculant during both inoculations. Each M+ plant was inoculated with sterile water containing 300 spores (Premier Tech, Riviere-du-Loup, Quebec, Canada; Antunes et al., 2008; Powell et al., 2009). The same fungal solution was autoclaved three times at 121°C for 45 minutes to ensure spore inviability before inoculation in M- plants. Two weeks after the second inoculation, at the start of week four, we simulated drought exposure by removing the water supply from the D+ plants for three days. Water was returned for the remaining four days of the week. This process was repeated weekly, for a total of 9 droughts. The water from the D+ plants was stored in sterile 150 mL cups for the duration of the drought; the same water was returned at the end of the drought to ensure any microbes in the water were returned.
Harvest and data collection During the first two weeks after planting, we collected data on germination time, days to first leaf (cotyledon), and days to first true leaf (non-cotyledon, trifoliate adult leaf). We collected measurements of leaf count one week and two weeks after planting. After we started implementing droughts, we collected measurements of leaf count and branch count before and after each drought period. Plants were inspected daily to accurately record survival. Once the plants started to flower, we collected data on flowering time. The plants were divided into two harvest cohorts: early (harvested on day 38 of the experiment) and late (harvested at the end of the experiment). The early harvest cohort consisted of four blocks (roughly 30% of the experimental
population) which were harvested on day 38 of the experiment. Peak nitrogen fixation levels occur around flowering; root nodules will start to senesce shortly after (Serova and Tsyganov, 2014). By harvesting after 50% of the cohort had flowered, the early harvest allowed more accurate measurements of nodule count. The remaining nine blocks comprised the late harvest cohort, growing for the full 13 weeks of the experiment. At the time of harvest, we collected measurements of height aboveground, root length, nodule count, and fruit count (if produced). Aboveground and belowground tissue from all plants were collected and separated. The plants were dried at 60°C for three days. The separated plant tissue was weighed for biomass. Seed count was excluded due to the low proportion of plants that had produced mature fruit at the time of harvest.
Statistical analysis All statistical tests were performed using RStudio v1.4. We tested the main effects of mycorrhizal fungi treatment (living/heatkilled) and drought treatment (presence/absence), their interaction, and accounted for block effects to generate ANOVA models of the following response variables: nodule count, height aboveground, root length, aboveground biomass, belowground biomass, and fruit number. Length and biomass variables were assessed for covariance and analyzed using MANOVA models. The results from each harvest cohort were analyzed separately. We used box plots comparing trait values between treatments to aid in visual comparisons of responses across treatments. We plotted the difference between before- and after-drought measurements of leaf count and branch count to visually assess trends in plant growth over time. Additionally, we converted flowering and survival data to binary response variables to allow survival analysis using the Kaplan-Meier method and the Cox regression model.
Results
Germination time and days to first true leaf We converted the data on germination time and days to first true leaf to binary response variables (event occurred/event did not occur). The time taken to germinate was consistent across
treatments. The time to the production of the first trifoliate leaf was also consistent across treatments. At the time of data collection, the drought simulations had not yet begun.
Leaf count and branch number We averaged the values of leaf count for each treatment before and after each drought to plot the change in the number of leaves after drought stress. The same process was applied to the data on branch number before and after each drought. There were no significant effects of drought or fungi. Additionally, we did not observe any significant trends in the change in leaf or branch number across treatments (p > 0.5).
Nodule Count Root nodules were counted for each individual at the time of harvest. The data collected from the early and late harvest cohorts were analyzed separately. The data from the early harvest cohort (Fig. 1A) was a more accurate assessment as the data was collected around the time of flowering before most nodules had started to senesce. The nodule data from the late harvest cohort (Fig. 1B) was likely lower than what would have been at the time of peak nitrogen fixation. This data lacked nodules that senesced and could not be observed at the time of harvest. No significant effects of drought or fungi treatments were observed in either harvest cohort (p > 0.5).
Height aboveground Plant height was measured at the time of harvesting. Height was defined as the distance between the base of the stem to the base of the highest fully expanded leaf. No significant effects of drought or fungi treatments were observed in either harvest cohort (p > 0.5).
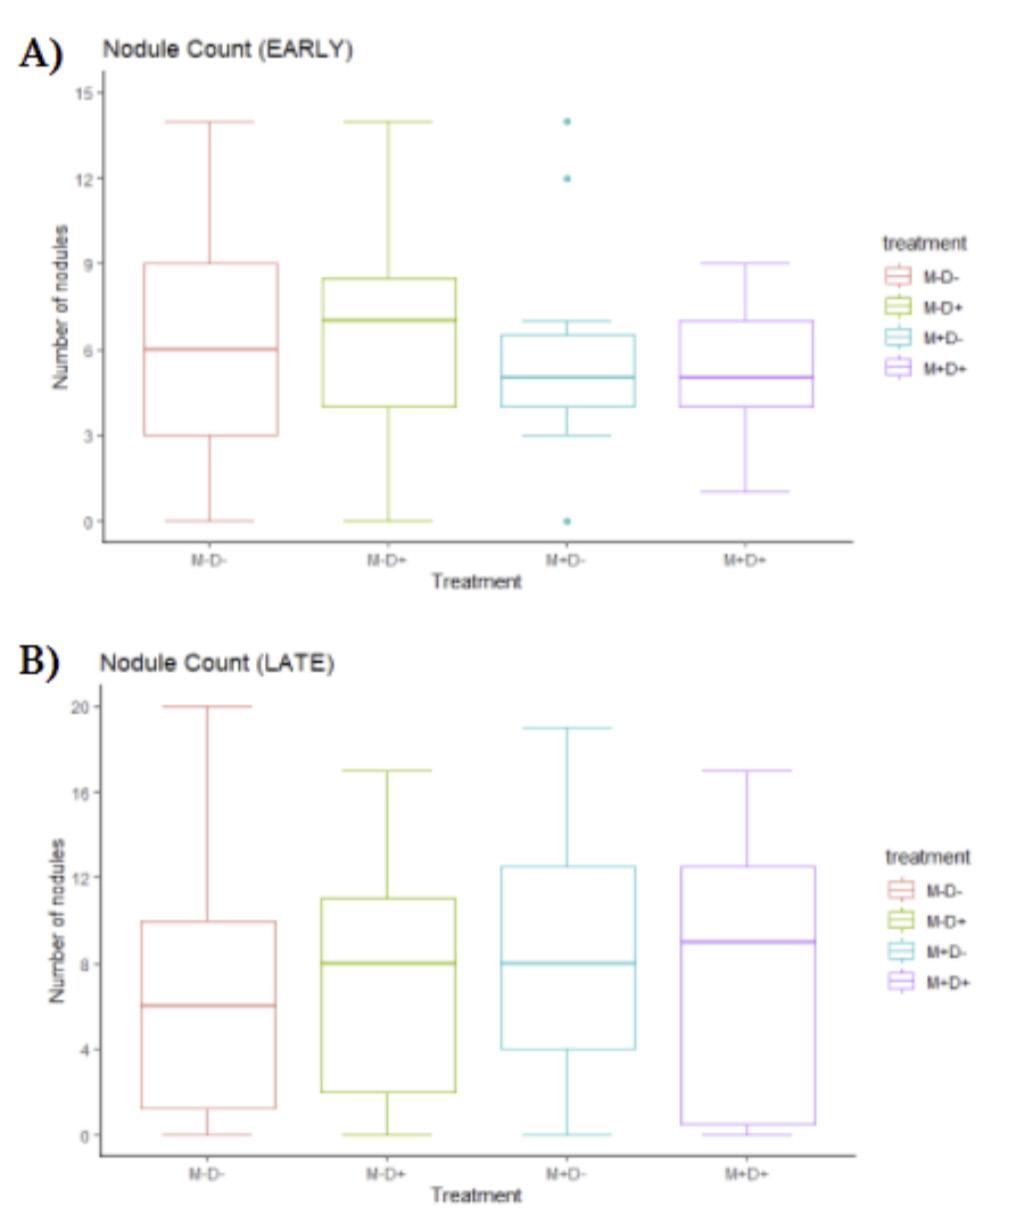
Figure 1: Nodule counts. Plot showing the distribution in the number of root nodules in individuals, separated by treatment (mycorrhizal fungi (M±), drought (D±)). Horizontal lines within each box denote median values. Error bars extend outside of each box. Outliers are shown as circles. Treatments are differentiated by colour. (A) Early harvest cohort. (B) Late harvest cohort.
Root length Root length was measured at the time of harvesting. Root length was defined as the furthest distance from the base of the stem to either the primary root or the lateral roots. We found that drought
significantly increased root length in both the early (p = 0.00119; Fig. 2A) and late (p = 0.0212; Fig. 2B) harvest cohorts. This trend was not affected by the presence of fungi in either cohort.
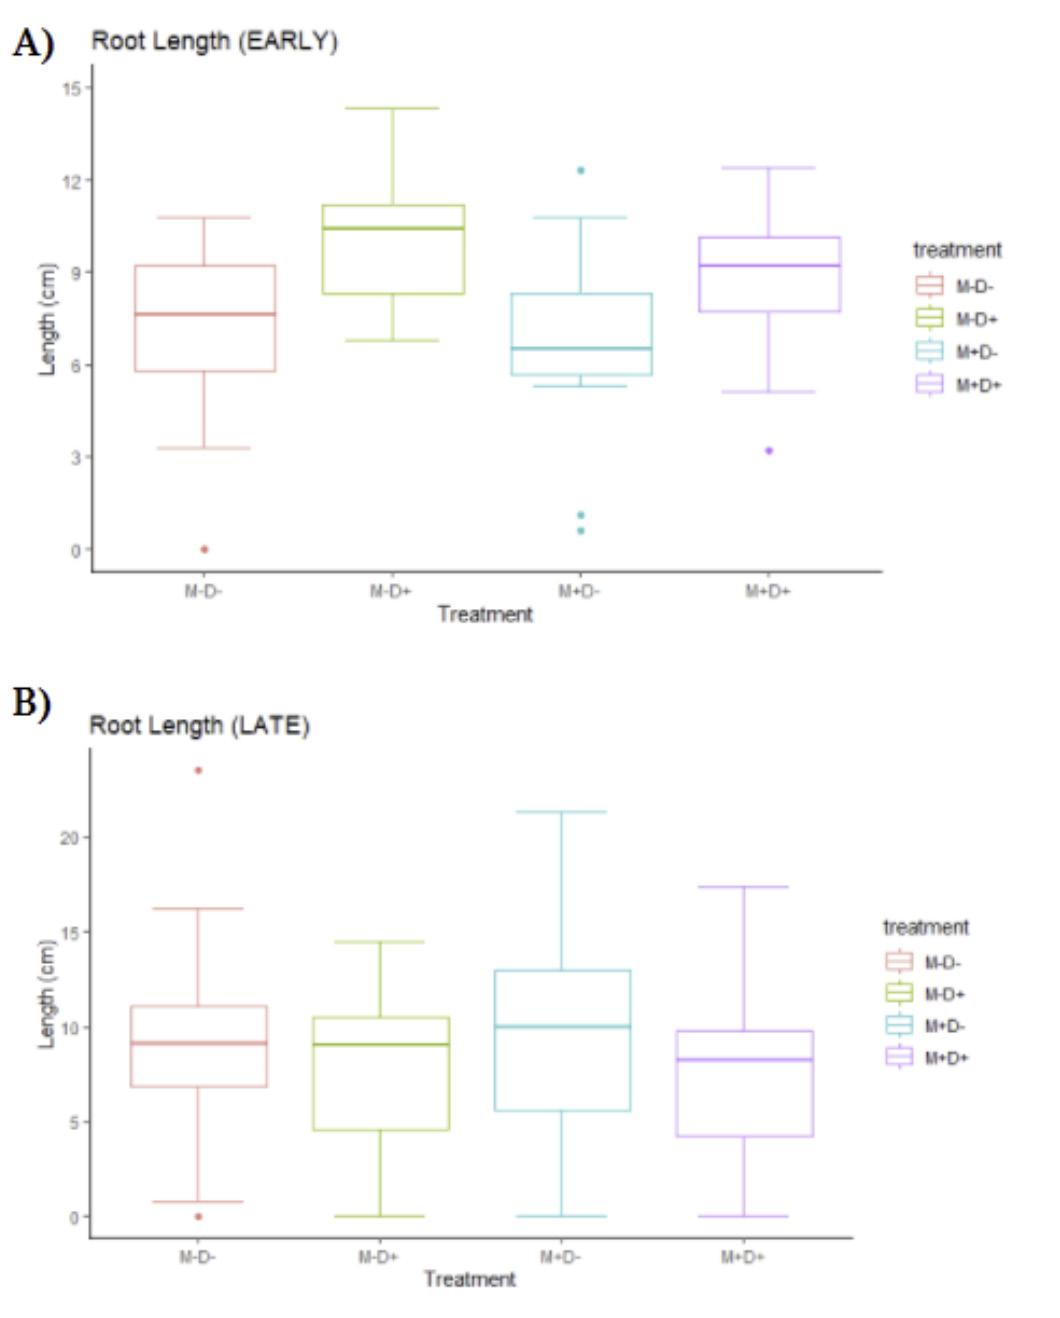
Figure 2: Root length in the early harvest cohort. Plot showing the distribution in root length, separated by treatment (mycorrhizal fungi (M±), drought (D±)). Horizontal lines within each box denote median values. Error bars extend outside of each box. Outliers are shown as circles. Treatments are differentiated by colour. (A) Early harvest cohort. (B) Late harvest cohort.
Height and root length were correlated in both harvest cohorts. We used MANOVA models to assess the effects of our independent variables on a composite variable composed of height and root length. In the early harvest cohort, we found significant effects of drought on the composite variable of height and root length (p = 0.003136). In the late harvest cohort, we found significant effects of both drought (p = 0.01700) and fungi (p = 0.01653) on the composite variable of height and root length.
Biomass Prior to drying, plants were separated into aboveground and belowground portions. Once dried, aboveground tissue and belowground tissue were weighed and analyzed separately. Fruits (if produced) were included in the measurement for aboveground biomass. We did not observe any significant effects of drought or fungi on biomass (p > 0.5). However, we did find a significant block effect (p = 0.00262; Fig. 3A) on aboveground biomass in the late harvest cohort. This was not observed in the early harvest cohort (Fig. 3B).
Flowering Data on flowering time was collected as the days taken to produce the first flower. We found that the presence of fungi had a significant effect on flowering time (p = 0.00308). There was a non-significant interaction effect between fungi and drought (p = 0.06761). Plants inoculated with living fungi flowered later than those that received heat-killed fungi, though the fungal-inoculated plants that experienced drought conditions flowered slightly earlier than those that did not. We converted the flowering data to a binary response variable (flowered/not flowered) to create a time-to-event plot using the Kaplan-Meier method (Fig. 4).
Figure 3: Aboveground biomass in the late harvest cohort. Plot showing the distribution in the biomass of aboveground plant tissue, separated by treatment (mycorrhizal fungi (M±), drought (D±)). Horizontal lines within each box denote median values. Error bars extend outside of each box. Outliers are shown as circles. Treatments are differentiated by colour. (A) Early harvest cohort. (B) Late harvest cohort. Three outliers are omitted from this plot for scaling purposes: 0.5268 (M+D-), 0.2136 (M+D+), 0.2148 (M+D+).
Figure 4: Flowering time. Kaplan-Meier curve depicting timeto-event data. A value of 1.00 indicates the individual has not yet flowered. A value of 0.00 indicates the individual has flowered. Treatments (mycorrhizal fungi (M±), drought (D±)) are differentiated by colour.
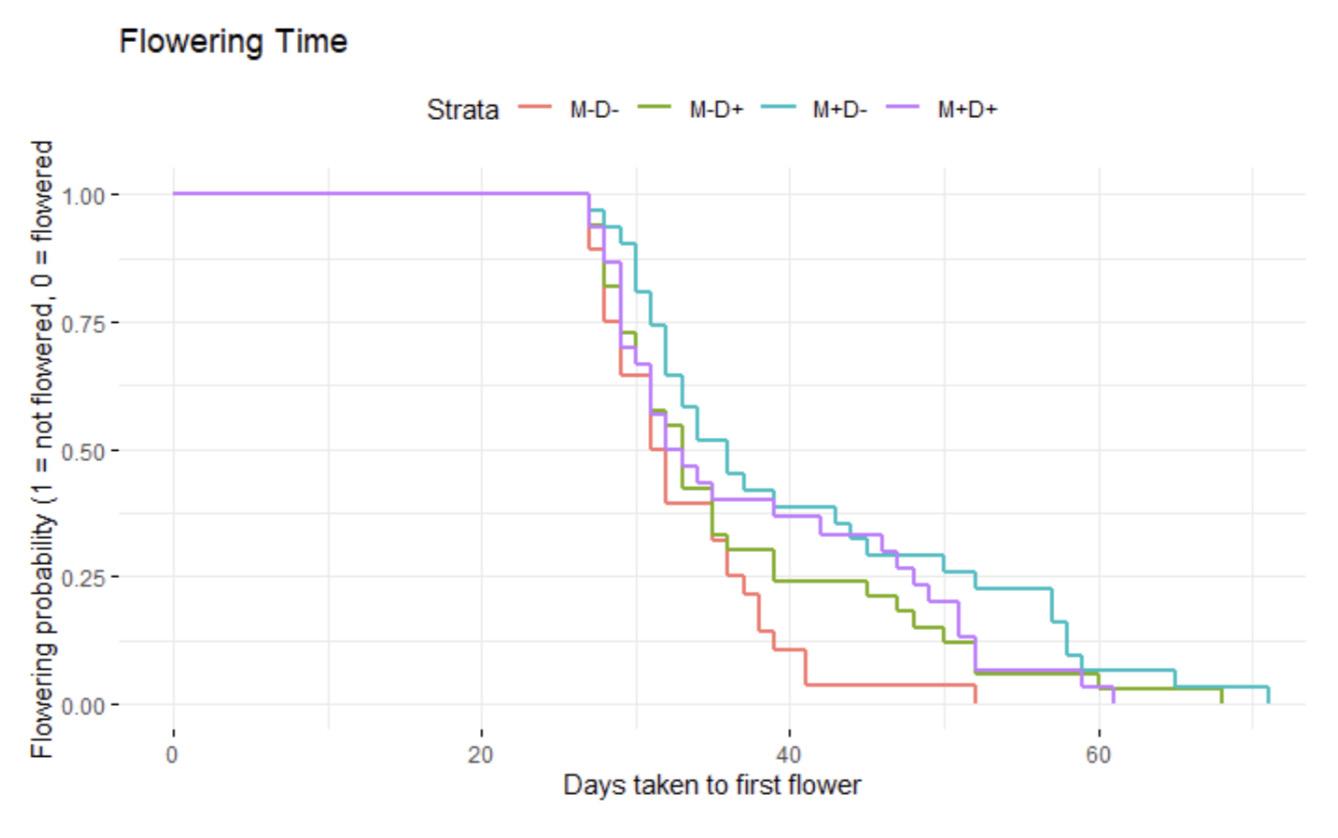
Fruit Production Fruit number was analyzed exclusively from the data collected from the late harvest cohort (Fig. 5). At the time of harvest, only 50% of the early harvest cohort had flowered, much less gone on to produce fruit. The low percentage of plants in the late harvest cohort that successfully produced fruit (~40%) prevented the discovery of any significant effects of treatment on fruit production. An even smaller percentage of the late harvest cohort produced at least one fruit that had matured by the time of harvest (~14%).
Survival Plants were inspected daily to accurately report survival times. We created a binary response variable of survivorship (died before the end of the experiment/survived to the end of the experiment). Survival analysis found that plants in the M-D- treatment group experienced the highest median survival time (Fig. 6). Using the Cox regression analysis of survivorship, we did not find any significant effects of drought or fungi on survivorship (p > 0.5).
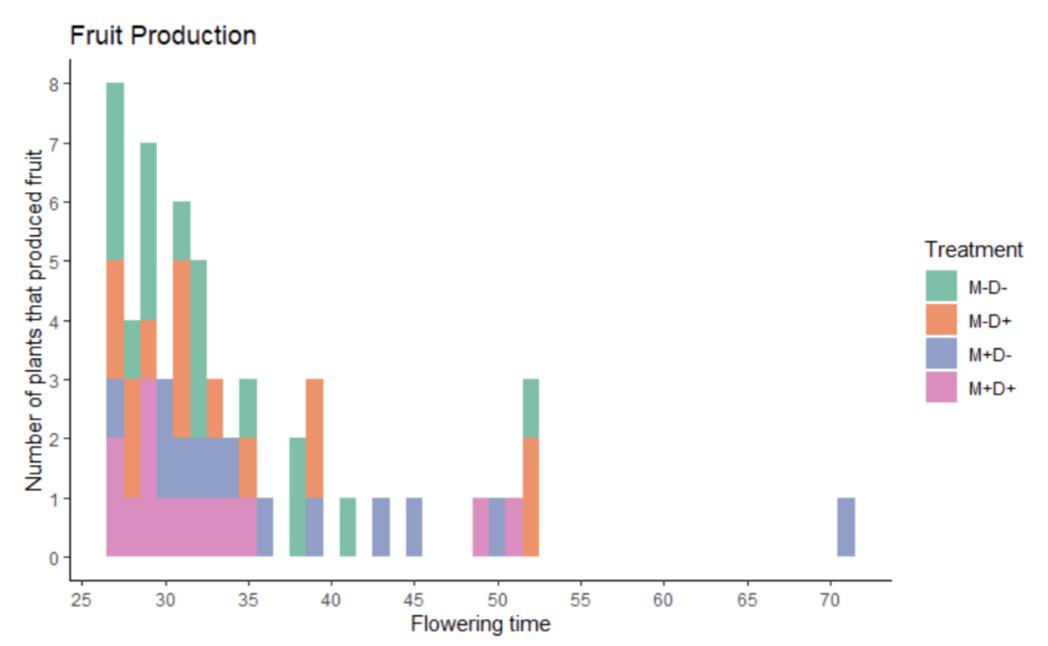
Figure 5: Distribution of fruit production across flowering time.
Plot depicting the distribution of plants that produced at least one fruit, sorted by their flowering time. Treatments (mycorrhizal fungi (M±), drought (D±)) are differentiated by colour within each time point.
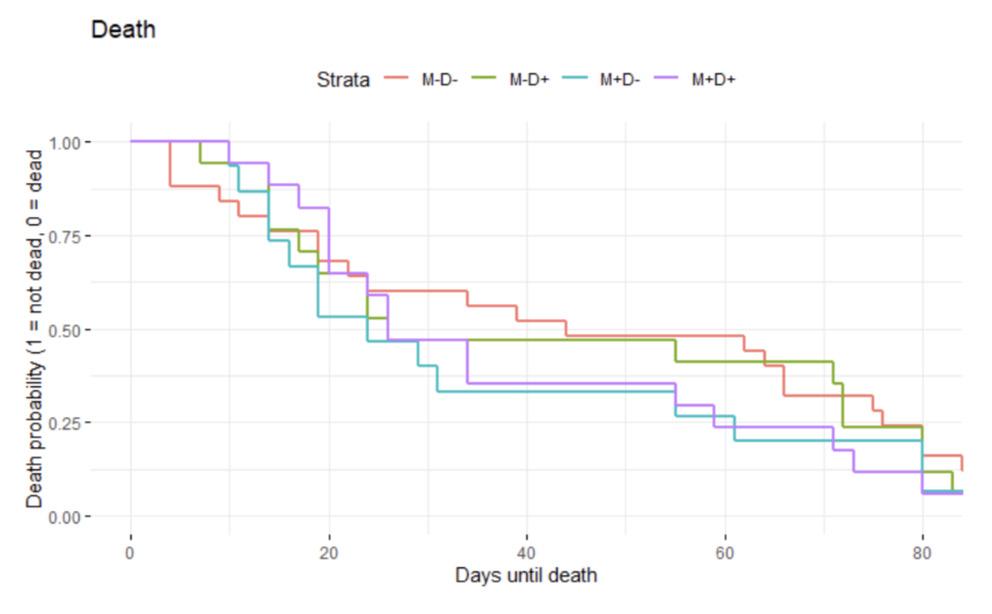
Figure 6: Plant survivorship across treatments. Kaplan-Meier survival curve depicting survivorship. Treatments (mycorrhizal fungi (M±), drought (D±)) are differentiated by colour.
Discussion
Our study revealed partial dynamics of multiple mutualists. We uncovered a context-specific benefit of multiple mutualists on flowering time. Though the presence of the fungal symbiont led to a later onset of flowering, drought stress mediated earlier flowering in plants inoculated with fungi. This suggests a benefit of multiple mutualists specific to water-limited conditions, though this benefit was weak. The strength of the drought treatment may have been inadequate to uncover other benefits in growth and performance. The lack of a clear trend in the changes in leaf count and branch number between droughts suggests the stress from the drought treatment was not sufficient to offset plant growth. Although the drought treatment led to longer roots, the fungal inoculant did not affect this trend. It is also possible that benefits that may be provided through symbiosis with mycorrhizal fungi in conditions of water limitation are more restricted to reproductive output as opposed to plant growth. The absence of significant differences in nodule number suggests the mutualism between the plant and rhizobia was not compromised by the addition of the fungal symbiont. Mycorrhizal fungi did not enhance rhizobia nodulation and we did not observe synergistic effects on plant performance. The different mutualists may have drastically different impacts on plant performance in a nutrient-limited environment. We did not add any additional nutrients or fertilizers to the growth environment which could have minimized the potential benefits of mycorrhizal fungi in belowground nutrient uptake. Conversely, rhizobia can access nitrogen outside of the rhizosphere and have the potential to confer greater resource benefits to the plant. The lack of nutrient supplementation in fertilizers may have contributed to a growth environment that was not suitable for efficient plant growth and reproduction. The low percentage of plants that produced fruit barred accurate analysis of fitness. However, nutrient-rich environments may mask the potential benefits of mycorrhizal fungi and lead to a costly association. Our results demonstrate the need for investigating multiple mutualists in varying resource environments. This could include stronger water limitation and nutrient supplementation and removal.
Other compounds produced by naturally occurring vegetation may play a role in shaping the environment upon which mutualisms transpire and are maintained. Aromatic plants produce monoterpenes that can enter the soil and affect the amount and availability of nitrogen in the soil (White, 1994; Pavolainen et al., 1998). Ehlers et al. (2012) found that plant and root symbiont fitness is strongly affected by such compounds in the soil. Multiple mutualists have also been shown to be beneficial in agricultural practices. Inoculation with both rhizobia and mycorrhizal fungi led to improved yield and nitrogen fixation efficiency in intercropping legumes with non-legumes (Meng et al., 2015).
Life history traits may also be important factors when considering the consequences of multiple mutualists. Differences in growth strategies lead to varying investment in microbial partners and dependency on these symbionts for success (Wilson & Hartnett, 1998; Middleton & Bever, 2012). The outcome of microbial interactions in long-lived plants may be more sensitive to environmental variation due to greater investment in belowground production. Larimer et al. (2014) found that the benefits of concurrent symbioses with rhizobia and fungi in the perennial legume Amorpha canescens depended on phosphorus level, but the tripartite mutualism was essential for the long-term fitness of the plant. It is also important to consider the community context of interactions between species (Thompson, 2005; Agrawal et al., 2007), especially when appraising coevolved mutualistic interactions that may vary across environments. The effects of the local environment both in abiotic resources and co-occurring species may be principal factors in shaping the dynamics of these associations (Piculell et al. , 2008). Together, this study has provided promising encouragement for further investigations into the dynamics of multiple mutualists. Ultimately, the role of environmental conditions in the mutualistic landscape requires greater attention, to understand the greater network of interactions and its implications in the broader ecological and evolutionary landscapes.
Contributions
JRS conceptualized the study and obtained funding. JW, JAB, DP, and JRS designed the study. JW performed the experiment and analyzed data. JW, JAB, DP, and JRS interpreted data. JW wrote the original manuscript. JW and JRS revised and edited the manuscript.
References
Afkhami ME, Rudgers JA, Stachowicz JJ. 2014. Multiple mutualist effects: conflict and synergy in multispecies mutualisms. Ecology 95(4): 833–844. Afkhami ME, Stinchcombe JR. 2016. Multiple mutualist effects on genomewide expression in the tripartite association between Medicago truncatula, nitrogen-fixing bacteria and mycorrhizal fungi. Mol Ecol 25: 4946–4962. Afkhami ME, Mahler DL, Burns JH, Weber MG, Wojciechowski MF, Sprent J, Strauss SY. 2017. Symbioses with nitrogen-fixing bacteria: nodulation and phylogenetic data across legume genera. Ecology 99(2): 502. Agrawal AA, Ackerly DD, Adler F, Arnold AE, Cáceres C, Doak DF. 2007. Filling key gaps in population and community ecology. Front Ecol Environ 5: 145–152. Antunes PM, Miller J, Carvalho LM, Klironomos JN, Newman JA. 2008. Even after death the endophytic fungus of Schedonorus phoenix reduces the arbuscular mycorrhizas of other plants. Funct Ecol 22(5): 912–918. Augé RM, Stodola AJW, Tims JE, Saxton AM. 2001. Moisture retention properties of a mycorrhizal soil. Plant Soil 230: 87–97. Bagyara, D, Manjunath A, Patii RB. 1979. Interaction between a vesiculararbuscular mycorrhiza and rhizobium and their effect on soybean in the field. Phytologist 82(1):141–145. Bronstein JL. 1994. Conditional outcomes in mutualistic interactions. Trends Ecol Evol 9(6): 214–217. Champawat, RS. 1990. Effect of dual inoculation of Rhizobium and vesicular arbuscular mycorrhizal fungi on Pisum sativum. Folia Microbiol 35: 236. Currie CR, Bot ANM, Boomsma JJ. 2003. Experimental evidence of a tripartite mutualism: bacteria protect ant fungus gardens from specialized parasites. Oikos 101(1): 91–102. Duan X, Neuman DS, Reiber JM, Green CD, Saxton AM, Augé RM. 1996. Mycorrhizal influence on hydraulic and hormonal factors implicated in the control of stomatal conductance during drought. J Exp Bot 47(10): 1541–1550. Ehlers BK, Grøndahl E, Ronfort J, Bataillon T. 2012. "Ménage à trois": the presence/absence of thyme shapes the mutualistic interaction between the host plant Medicago truncatula (Fabaceae) and its symbiotic bacterium Sinorhizobium meliloti. Ecol Evol 2(7): 1676–1681. Fujita H, Aoki S, Kawaguchi M. 2014. Evolutionary Dynamics of Nitrogen
Fixation in the Legume–Rhizobia Symbiosis. PLoS ONE 9(4): e93670. Geneva M, Zehirov G, Djonova E, Kaloyanova N, Georgiev G, Stancheva I. 2006. The effect of inoculation of pea plants with mycorrhizal fungi and Rhizobium on nitrogen and phosphorus assimilation. Plant Soil Environ 52: 435–440. Heath KD, Stock AJ, Stinchcombe JR. 2010. Mutualism variation in the nodulation response to nitrate. J Evolution Biol 23(11): 2494–2500. Johnson CA, Bronstein JL. 2019. Coexistence and competitive exclusion in mutualism. Ecology 100(6): e02708. Larimer AL, Clay K, Bever JD. 2014. Synergism and context dependency of interactions between arbuscular mycorrhizal fungi and rhizobia with a prairie legume. Ecology 95(4): 1045–1054. Meng L, Zhang A, Wang F, Han X, Wang D, Li S. 2015. Arbuscular mycorrhizal fungi and rhizobium facilitate nitrogen uptake and transfer in soybean/ maize intercropping system. Front Plant Sci 6: 339. Middleton EL, Bever JD. 2012. Inoculation with a native soil community advances succession in a grassland restoration. Restor Ecol 20: 218–226. Pavolainen L, Kitunen V, Smolander A. 1998. Inhibition of nitrification in forest soil by monoterpenes. Plant Soil 205: 147–154. Piculell BJ, Hoeksema JD, Thompson JN. 2008. Interactions of biotic and abiotic environmental factors in an ectomycorrhizal symbiosis, and the potential for selection mosaics. BMC Biol 6: 23. Poulsen M, Currie CR. 2010. Symbiont Interactions in a Tripartite Mutualism: Exploring the Presence and Impact of Antagonism between Two Fungus-Growing Ant Mutualists. PLoS One 5(1): e8748. Powell JR, Campbell RG, Dunfield KE, Gulden RH, Hart MM, Levy-Booth DJ, Klironomos JN, Pauls KP, Swanton CJ, Trevors JT, and Antunes PM. 2009. Effect of glyphosate on the tripartite symbiosis formed by Glomus intraradices, Bradyrhizobium japonicum, and genetically modified soybean. Appl Soil Ecol 41(1): 128–136. Serova T, Tsyganov V. 2014. Symbiotic Nodule Senescence in Legumes: MolecularGenetic and Cellular Aspects (review). Sel’skokhozyaistvennaya Biologiya [Agricultural Biology] 5: 3–15. Singh S, Prakash A. 2012. Tripartite Association Among Plant, Arbuscular Mycorrhizal Fungi and Bacteria. In: Satyanarayana T, Johri B, Anil Prakash, editors. Microorganisms in Sustainable Agriculture and Biotechnology. Dordrecht: Springer. p. 243–259. Smith SE, Facelli E, Pope S, Smith FA. 2010. Plant performance in stressful environments: interpreting new and established knowledge of the roles of arbuscular mycorrhizas. Plant Soil 326: 3–20. Stachowicz JJ. 2001. Mutualism, Facilitation, and the Structure of Ecological Communities: Positive interactions play a critical, but underappreciated,
role in ecological communities by reducing physical or biotic stresses in existing habitats and by creating new habitats on which many species depend. Bioscience 51(3): 235–246. Stachowicz JJ, Whitlatch RB. 2005. Multiple Mutualists Provide Complementary Benefits to Their Seaweed Host. Ecology 86(9): 2418–2427. Thompson JN. 2005. The geographic mosaic of coevolution. Chicago (IL): University of Chicago Press. Vance CP. 2002. Root-bacteria interactions: symbiotic N2 fixation. In: Waisel Y, Eshel A, Kafkafi U, editors. Plant roots: the hidden half. New York (NY): Marcel Dekker, Inc. p. 839–868 White CS. Monoterpenes: their effects on ecosystem nutrient cycling. 1994. J Chem Ecol 20: 1381–1406. Wilson GWT, Hartnett DC. 1998. Interspecific variation in plant responses to mycorrhizal colonization in tallgrass prairie. Am J Bot 85: 1732–1738. Young ND, Udvardi M. 2009. Translating Medicago truncatula genomics to crop legumes. Curr Opin Plant Biol 12: 193–201. Zribi K, Mhamdi R, Huguet T, and Aouani ME. 2004. Distribution and genetic diversity of rhizobia nodulating natural populations of Medicago truncatula in tunisian soils. Soil Biol Biochem 36: 903–908.
191