38 tilapia cultured in hapa (mesh cages ) installed in an earthen pond.
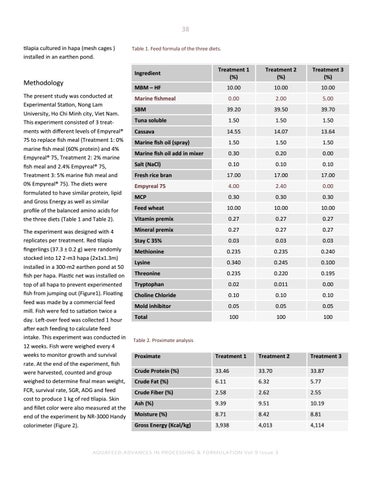
Table 1. Feed formula of the three diets.
Ingredient
Treatment 1 (%)
Treatment 2 (%)
Treatment 3 (%)
MBM – HF
10.00
10.00
10.00
The present study was conducted at Experimental Station, Nong Lam University, Ho Chi Minh city, Viet Nam. This experiment consisted of 3 treatments with different levels of Empyreal® 75 to replace fish meal (Treatment 1: 0% marine fish meal (60% protein) and 4% Empyreal® 75, Treatment 2: 2% marine fish meal and 2.4% Empyreal® 75, Treatment 3: 5% marine fish meal and 0% Empyreal® 75). The diets were formulated to have similar protein, lipid and Gross Energy as well as similar profile of the balanced amino acids for the three diets (Table 1 and Table 2).
Marine fishmeal
0.00
2.00
5.00
SBM
39.20
39.50
39.70
Tuna soluble
1.50
1.50
1.50
Cassava
14.55
14.07
13.64
Marine fish oil (spray)
1.50
1.50
1.50
Marine fish oil add in mixer
0.30
0.20
0.00
Salt (NaCl)
0.10
0.10
0.10
Fresh rice bran
17.00
17.00
17.00
Empyreal 75
4.00
2.40
0.00
MCP
0.30
0.30
0.30
Feed wheat
10.00
10.00
10.00
Vitamin premix
0.27
0.27
0.27
The experiment was designed with 4 replicates per treatment. Red tilapia fingerlings (37.3 ± 0.2 g) were randomly stocked into 12 2-m3 hapa (2x1x1.3m) installed in a 300-m2 earthen pond at 50 fish per hapa. Plastic net was installed on top of all hapa to prevent experimented fish from jumping out (Figure1). Floating feed was made by a commercial feed mill. Fish were fed to satiation twice a day. Left-over feed was collected 1 hour after each feeding to calculate feed intake. This experiment was conducted in 12 weeks. Fish were weighed every 4 weeks to monitor growth and survival rate. At the end of the experiment, fish were harvested, counted and group weighed to determine final mean weight, FCR, survival rate, SGR, ADG and feed cost to produce 1 kg of red tilapia. Skin and fillet color were also measured at the end of the experiment by NR-3000 Handy colorimeter (Figure 2).
Mineral premix
0.27
0.27
0.27
Stay C 35%
0.03
0.03
0.03
Methionine
0.235
0.235
0.240
Lysine
0.340
0.245
0.100
Threonine
0.235
0.220
0.195
Tryptophan
0.02
0.011
0.00
Choline Chloride
0.10
0.10
0.10
Mold inhibitor
0.05
0.05
0.05
Total
100
100
100
Methodology
Table 2. Proximate analysis
Proximate
Treatment 1
Treatment 2
Treatment 3
Crude Protein (%)
33.46
33.70
33.87
Crude Fat (%)
6.11
6.32
5.77
Crude Fiber (%)
2.58
2.62
2.55
Ash (%)
9.39
9.51
10.19
Moisture (%)
8.71
8.42
8.81
Gross Energy (Kcal/kg)
3,938
4,013
4,114