A.P. MØLLER HOLDING A/S CSR REPORT 2023 Esplanaden 50 apmoller.com DK - 1263 Copenhagen K CVR 25 67 92 88
A.P. Moller Holding’s statutory statement on CSR in accordance with section 99a of the Danish Financial Statements Act. The CSR report is part of the Annual Report for 2023.
2
CONTENTS
A.P. Moller Holding 3 APMH Invest...............................................................................................................5 A.P. Moller – Maersk..................................................................................................6 Unilabs....................................................................................................................... 72 Faerch......................................................................................................................... 76 Maersk Product Tankers 103 KK Wind Solutions 107 Nissens Cooling Solutions 152 Maersk Supply Service.........................................................................................157 Maersk Tankers......................................................................................................161 A.P. Moller Capital.................................................................................................165
OUR INVESTMENTS
A.P. MOLLER HOLDING
This report represents the statutory consolidated statement of A.P. Møller Holding A/S on CSR in accordance with section 99a of the Danish Financial Statements Act. It represents policies, activities, and results achieved in 2023 for entities owned and controlled by A.P. Møller Holding A/S.
A.P. Møller Holding A/S (A.P. Moller Holding) is 100% owned by A.P. Møller og Hustru Chastine Mc-Kinney Møllers Fond til almene Formaal (the A.P. Moller Foundation), one of the largest, industrial foundations in Denmark.
As the parent company of the A.P. Moller Group, our purpose is to build and develop businesses that have a positive impact on society – ‘nyttig virksomhed’. We drive long-term value and growth in our businesses. Through engaged and valued ownership, we leverage our family name, values, insights, and global networks to set our businesses up for success.
‘Nyttig virksomhed’ is a key element in our investment strategy, and we are open to reconsider ownership of a business, if its business model does not have a positive impact on society. Hence, social responsibility is integrated into our purpose and is core in everything we do.
Striving for good governance is part of our ethical culture, and we continue to update our policies and systems to secure a
solid basis for our future activities as an engaged investment company.
We focus highly on mitigating the risk of being abused by third parties that A.P. Moller Holding engages with. This is especially relevant in relation to our investments, where we always conduct proper and adequate due diligence measures on relevant counterparties such as advisors, co-investors, etc.
An example is our Anti-Bribery and Corruption policy which illustrates our zero tolerance towards fraud and bribery. This is one of the cornerstones in our overall framework for how to exercise due care to prevent bribery and corruption internally as well as in relation to third parties acting on behalf of A.P. Moller Holding. The policy provides overall guidelines in relation to procedures to be followed when investing, when interacting with other business relationships, e.g. government officials, and in relation to gifts and hospitality, etc.
As an international investment company with a broad range of investment activities, A.P. Moller Holding has a significant influence on society. We acknowledge the responsibilities that this entails and make an effort to ensure that we are recognised as a trustworthy group of companies.
The Board of Directors of each of our portfolio companies define their own specific CSR policies and Codes of Conduct. We are represented on each board, and these representatives ensure that CSR policies, including human rights, climate change, and environmental impact, are enforced. Policies are adapted to meet the circumstances in which each of the affiliates operate.
CSR POLICIES AT A.P. MOLLER HOLDING
At A.P. Moller Holding, being a good corporate citizen is an integral part of the way we do business, globally as well as locally.
We are committed to work internally and with our business relations to promote responsible practices. Our aspiration is to ensure that all our business relations acknowledge our values and share our commitment to conduct business in an ethical, legal, and socially responsible manner. Continually, we strive to improve the performance of our business relations within the areas of human rights, labour standards, and the environment, and to work against any form of corruption, fraud, and bribery.
We strongly believe that high standard governance measures will create value for all parties and contribute to establish a long-term sustainable relationship with our business partners, our employees, and the societies in which we operate.
We expect our suppliers to avoid participation in or knowingly benefit from any kind of corruption, money-laundering, market abuse, extortion, or bribery.
Furthermore, we expect our suppliers to respect all applicable laws and regulations and prevailing industry standards.
A.P. MØLLER HOLDING A/S CSR REPORT 2023 3
As such, we expect our suppliers to integrate environmental considerations in their activities and strive for continuous improvement by minimising any adverse effects of their activities on the environment.
We expect our suppliers to provide a safe and healthy working environment for all their employees. This includes high focus on respectful treatment, equal opportunity rights, freedom of association and collective bargaining, compliance with applicable working hours, etc.
Based on the CSR policies of A.P. Moller Holding, specific CSR policies and codes of conduct for the subsidiaries are laid down by their respective Boards of Directors, in which A.P. Moller Holding is represented.
The CSR reports of our portfolio companies – each outlining company-specific policies, activities, and results for 2023 – are enclosed in this report.

WE ARE GUIDED BY OUR FIVE CORE VALUES

CONSTANT CARE
Take care of today, actively prepare for tomorrow

HUMBLENESS
Listen, learn, share, and give space to others

UPRIGHTNESS
Our word is our bond

OUR EMPLOYEES
The right environment for the right people

OUR NAME
The sum of our values: passionately striving higher
A.P. MØLLER HOLDING A/S CSR REPORT 20233
APMH INVEST
In the fully owned holding company, APMH Invest A/S, A.P. Moller Holding decides upon and includes investments’ CSR policies in the continuous assessment of which companies should be invested in.
As of 31 December 2023, the investment companies fully owned by and/or where A.P. Moller Holding controls the entity comprise:
• APMH Invest A/S
• APMH Invest V ApS
• APMH Invest IX ApS
• APMH Invest X P/S
• APMH Invest XI ApS
• APMH Invest XIII ApS
• APMH Invest XIV ApS
• APMH Invest XVI ApS
• APMH Invest XVIII ApS
• APMH Invest XX A/S
• APMH Invest XXI ApS
• APMH Invest XXII ApS
• APMH Invest XXIV ApS
• APMH Invest XXV ApS
• APMH Invest XXVI A/S
• APMH Invest XXVII A/S
• APMH Invest XXIX ApS
• APMH Invest XXX ApS
• APMH Invest XXXI ApS
• APMH Invest XXXII ApS
• APMH Invest XXXIII ApS
• APMH Invest XXXIV ApS
• APMH Invest XXXV ApS
• APMH GE P/S
• APMHI GP ApS
• AIF I Sponsor Invest K/S
• Iv3 Aqua Holding A/S
• Iv3 Aqua Corporation
• A.P. Møller Maritime ApS
• ZeroNorth A/S
APMH Invest V ApS, APMH Invest XI ApS, APMH Invest XX A/S, APMH Invest XXVI A/S, and APMH Invest XXVII A/S, APMH Invest XXX ApS, APMH Invest XXXI ApS, APMH Invest XXXII ApS, APMH Invest XXXIII ApS, APMH Invest XXXIV ApS and APMH Invest XXXV ApS are dormant companies as of 31 December 2023.
Being owned by A.P. Moller Holding, APMH Invest A/S takes its origin in the same values and commitments towards CSR as A.P. Moller Holding. Hence, APMH Invest is committed to make investments in an ethical, legal and socially responsible manner.
A.P. MØLLER HOLDING A/S CSR REPORT 2023 5
A.P. MOLLER – MAERSK
The Sustainability Report for 2023 is enclosed on the next pages.
A.P. MØLLER HOLDING A/S CSR REPORT 2023 6
ALL THE WAY

2023 Sustainability Report
ESG performance highlights
Climate change
Ocean: ~50% reduction in carbon intensity (EEOI) by 2030¹
Ocean: Min. 25% of cargo transported with green fuels by
Safety and security
100% of Learning Teams completed following a High Potential Incident by 2023
About the report
Human capital
Employee Engagement Survey score in the top quartile of global norm by 2025
Diversity, equity and inclusion
>40% women in management and leadership by 2025
>30% diverse nationality (non-OECD) of executives by 2025
Business ethics
100% employees (in scope) trained in the Maersk Code of Conduct by 2023
Data ethics
100% of employees (in scope) trained on data ethics by 2023
Sustainable procurement
100% of suppliers (in scope) committed to the Supplier Code of Conduct by 2024
This is the Annual Sustainability Report of A.P. Møller - Mærsk A/S (hereinafter referred to as A.P. Moller - Maersk or Maersk as the consolidated group of companies and A.P. Møller - Mærsk A/S as the parent company). The report covers activities in the 2023 calendar year and represents our statutory statement on social responsibility, diversity and data ethics in accordance with sections 99a, d and 107d of the Danish Financial Statements Act, and our compliance with the EU Taxonomy disclosure requirements.
As a supplement to the Annual Sustainability Report, we prepare an ESG Factbook with key performance indicators as well as TCFD and SASB index tables. The ESG Factbook can be downloaded at https://www.maersk. com/sustainability
Previous years’ reports and data tables are also available online. Please visit https://www.maersk.com/ sustainability.
2023 -4% 2023 3%
See full ESG performance data overview on pp. 48-51. See accounting policies pp. 55- 61 for more information on definition and scope of KPIs. 1 From 2024 A.P. Moller - Maersk will be reporting against new targets aligned with our validated science-based targets. Read more in the climate change chapter pp. 18-27.
2030 (Target) 2023 (Target) 2025 (Target) 2025 (Target)
2030¹ 25% 100% >40% >30%
2022 2% 2023 99% 2022 83% 2023 2022 2025 (Target) >75% 60% 67% 2022 33% 2023 35% 2022 16% 2023 20%
2023 2022 2023 (Target) 100% 92% 83% 2024 (Target) 100% 2023 95% 2022 96% 2023 (Target) 100% 2023 91% 2022 67% 2022 +7% 2030 (Target) -50% Baseline (2020) 2 Strategy and governance Progress on ESG Data and assurance Introduction Sustainability Report 2023

Ocean
Improving life for all by integrating the world
The integration illustrated by five years of Automatic Identification System (AIS) transponder data from A.P. Moller - Maersk vessels registered in the company’s scheduling system GSIS Gateway and hub terminals
A.P. Moller - Maersk is an integrated logistics company working to connect and simplify its customers’ supply chains. As a global leader in logistics services, the company has 100,000+ customers, operates in more than 130 countries and employs around 100,000 people. A.P. Moller - Maersk is aiming to reach net zero emissions by 2040 across the entire supply chain with new technologies, new vessels and green energy solutions.
Green methanol-enabled vessels on order 24
Containers per annum (m FFE), serving over 475 ports worldwide 11.9
Container vessels deployed 670+
Logistics & Services
7,800k+ sqm warehousing capacity worldwide across 460+ sites
Electric vehicles in operation; 200+ more on order 100+
Intermodal volumes managed (m FFE) 4.0 M
Terminals*
Moves in 2023 21.7m
Vessel calls 27,000+
Operating facilities across 35 countries; 3 new port projects 62
* Gateway terminals and hubs
RS
OUR PURPOSE 3 Strategy and governance Progress on ESG Data and assurance Introduction Sustainability Report 2023
Introduction
5 Letter from our CEO
6 Our business and how we create value
7 Re-wiring of global supply chains
Strategy and governance
9 ESG strategy and governance
13 Our material ESG topics
Progress on ESG
17 Environment
18 Climate change
28 Environment and ecosystems
31 Responsible ship recycling
32 Social
33 Our people
34 Safety and security
36 Human capital
37 Diversity, equity and inclusion
39 Employee relations and labour rights
40 Human rights
41 Governance
42 Business ethics
43 Sustainable procurement
45 Data ethics and Responsible tax
46 Citizenship


Data and assurance
48 ESG performance data
52 EU Taxonomy
55 ESG performance data accounting policies
62 Statement of the Board of Directors and the Executive Board
63 Limited assurance statement
64 Stay up to date

Our people Our material ESG topics ESG performance data
Read more Read more Read more
Contents
4 Strategy and governance Progress on ESG Data and assurance Introduction Sustainability Report 2023
Letter from our CEO
2023 was a year of extraordinary challenges affecting millions around the world, from geopolitical conflicts to record-setting weather events. But there were also highlights we can celebrate, such as the International Maritime Organization setting ambitious intermediate and long-term targets for shipping to reach net zero, and the COP 28 agreement on the need to transition away from fossil fuels.
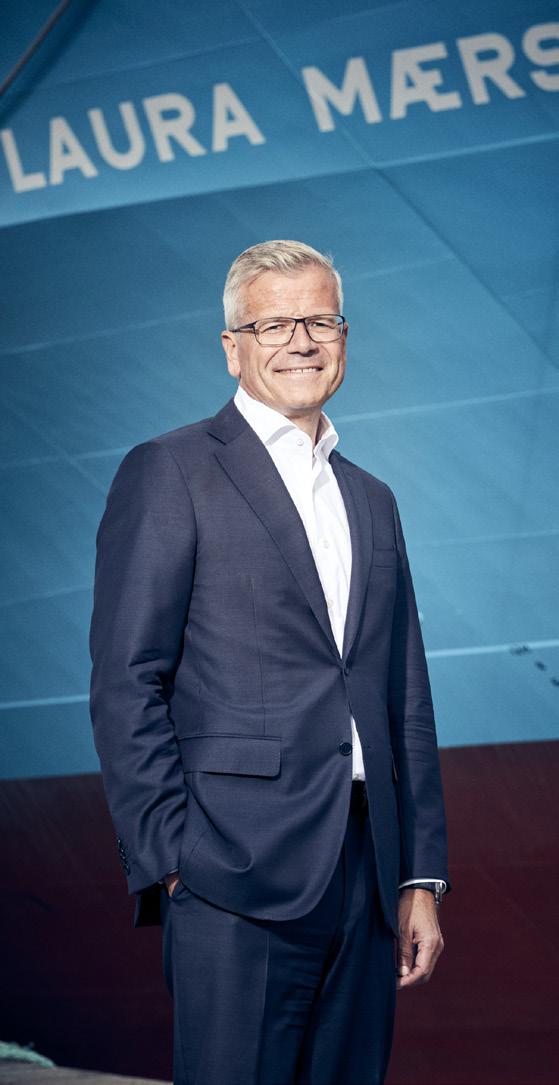
The arrival of Laura Mærsk, the world’s first green fuel-enabled container vessel, is a major milestone in our ESG strategy and our efforts to decarbonise logistics. The vessel serves as a clear signal to green fuel producers, policy makers and our customers that the energy transition is happening and will play a pivotal role in shaping global supply chains.
Today some 180 methanol capable vessels are on order across the industry, and Maersk has taken delivery of the first of 24 new, larger vessels in January 2024. However, this is only the beginning and many challenges lie ahead – especially the enormous task of enabling and scaling the world’s supply of green fuels. Today we are meeting supply challenges through a large portfolio of fuel partners, and in 2023 we signed the shipping industry’s first large offtake agreement with Goldwind, who will supply 500 kilotonnes of green methanol annually from 2026 - enough to propel the first 12 methanol-capable vessels.
Ocean activities are our main source of emissions; however our decarbonisation commitment extends across our full operations. In 2023, we helped customers further reduce emissions across their supply chains, powering terminals in Europe and Latin America with 100% renewable energy, new green warehouses and building electric truck capacity in Europe, North America and China.
The imperative for collaboration across all stakeholders
One especially significant achievement is that Maersk is the first in the shipping industry to secure validation from the Science-Based Targets initiative for 1.5°C-aligned 2030 targets and net zero 2040 targets. We know the journey to achieve the targets will be challenging, and we cannot do it alone. Maersk continues to rely on support from the industry, regulators and, the starting point for all we do, our customers.
Many of them have been willing to co-lead this journey with us, in support of their own ambitious climate goals.
Our industry needs ambitious regulatory frameworks as a prerequisite to drive investments at scale, along with a massive build-up of renewable energy. I was proud to stand with fellow CEOs from the world’s leading shipping lines at COP28, as we jointly called for an end date for fossil-powered newbuilds and urged the IMO to create more supportive regulatory conditions for the green fuel transition. This includes our advocacy for a market-based carbon measure to close the cost gap and level the playing field between fossil and green fuels.
Our impact on society
A key focus for Maersk, as part of our holistic ESG strategy approach, is ensuring that this green transition is inclusive and just - benefitting the environment and society. We also take responsibility to ensure a safe, fair and inclusive workplace for our people. In 2023, however, we tragically lost four colleagues in fatal accidents - this is something that no single member of our team can accept, and we are taking firm measures to stay ahead of constantly evolving risks.
2023 ended with the unfortunate attacks on several cargo vessels in the Red Sea and Gulf of Aden, including two Maersk vessels. These attacks are very concerning and something we take very seriously; job one for Maersk is ensuring the safety and security of our people, and our customers’ supply chains. It is gratifying to see strong government support from many nations to reopen this critical shipping lane, and we remain optimistic that a solution will be found that allows transport to safely resume.
I encourage you to explore this report and learn more about our progress across ESG in 2023. The conversation about sustainable, inclusive trade is one that requires all voices. This is why Maersk remains committed to the UN Global Compact and recognises the importance of collaboration around the world’s most difficult ambitions, outlined in the UN Sustainable Development Goals. I want to thank all our customers, partners and employees for their tremendous support in 2023, as a year where we, together, took important steps towards making the green transition a reality for our customers and society.
 Vincent Clerc CEO of A.P. Møller - Mærsk A/S
5 Strategy and governance Progress on ESG Data and assurance Introduction Sustainability Report 2023
Our business and how we create value
A.P. Moller - Maersk is a purpose-driven company and always has been. Increasing complexity in global supply chains drives the need for integrated logistics. We aim to fulfil that need by sustainably and responsibly delivering better, simpler and more reliable outcomes for our customers – improving life for all by integrating the world.
Customer synergies
Logistics & Services
Financial & operational synergies
Terminals Ocean
What we depend on
Purpose-driven people and our culture
Our talented, diverse team of 100,000+ employees with 181 nationalities.
Our brand
For over a century, we have built partnerships with customers, enabling them to prosper by facilitating global trade.
Natural resources
Our business relies on natural resources such as steel for vessels and oil, biomass and water for conventional and green fuels.
Stakeholder relationships and partnerships
We rely on constructive relationships with customers, suppliers, peers and authorities.
Assets and end-to-end delivery network
Our assets, supplier relationships and logistics expertise ensure resilient supply chains.
Financial capital
We have a strong balance sheet and are committed to remaining investment grade-rated.
Technology and data
Technology and data are key to connecting and simplifying supply chains.
ESG People Technology
Value created for
Our customers
We aspire to provide truly integrated logistics for 100,000+ customers' supply chains, while helping them meet their debarbonisation commitments.
Our people
We keep our people safe and engaged while offering equitable and interesting career paths. Society
By integrating global logistics, we improve the flow of goods and materials that sustain people, businesses
and economies the world over and contribute to improved quality of life and prosperity.
The planet
Our industry is a significant contributor to global greenhouse gas (GHG) emissions, and we are committed to realising net zero emissions by 2040.
Shareholders
In our transformation to become the global integrator of container logistics, we continue to innovate and grow shareholder value.
MAERSK
6 Strategy and governance Progress on ESG Data and assurance Introduction Sustainability Report 2023
Re-wiring of global supply chains
In 2023, megatrends connected to geopolitics, consumer sentiment and sustainability continued to impact global trade and supply chains, with technology playing a leading role in the transformation. While postpandemic congestion has largely eased, the year remained full of global supply chain disruptions, including record-setting severe weather events and ongoing geopolitical conflicts.
Post-pandemic trends show longevity
Among many trends impacting global supply chains, the post-pandemic normalisation had the greatest impact on A.P. Moller - Maersk (Maersk) and its customers during 2023. In addition to economic factors including inventory destocking and the ease of supply chain congestion, ESG-related factors have also had an impact. The re-wiring of supply chains continued, as manufacturers sought to increase resilience and reduce their dependence on global supply chains that are vulnerable to local disruptions. This is driving global players to take more of a regional approach, with fewer intermediate products traded over long distances.
Re-wiring is also driven by the continued slowdown of globalisation, as trade policy and social attitudes remain less supportive to open trade – especially due to inflationary pressures and increased nationalism and protectionism. For Maersk and its customers, this re-wiring creates material ESG risks and opportunities, from ensuring more sustainable trade to managing ESG-related trade regulations.
While helping customers navigate this re-wiring and increase in trade compliance requirements related to ESG, Maersk remains committed to supporting globalisation and free trade that provides socio-economic growth and lifts people out of poverty. An important part of this commitment is ensuring that we understand and manage potential negative social risks such as inequality, exploitation of workers
and human rights abuses. Maersk is actively working with its customers, experts, policy makers and partners to develop platforms and initiatives that support inclusive and sustainable global trade, for example through the Global Alliance for Trade Facilitation, the World Economic Forum and ITC/SheTrades (see our key partnerships on p. 15 and learn more about our ITC/SheTrades engagement on p. 46).
The imperative for addressing climate change and decarbonising supply chains continues, with strong momentum in the industry and with policy makers. In 2023, severe heat waves, flooding and wildfires around the globe caused tragic loss of life and humanitarian crises as well as disrupting supply chains, further elevating climate change as an important supply chain risk criterion. Read more about Maersk’s decarbonisation ambitions in the Climate chapter of this report.
The re-wiring of supply chains, inclusive and equitable trade, decarbonisation and climate change are lasting trends more than transient developments, and Maersk expects these to be material throughout this decade.
Increased global conflict impacts supply chains
2023 saw increasing geopolitical tensions which continue to have a profound and direct impact on supply chains. This includes ongoing impacts to food and energy supply chains from the Russian invasion of Ukraine, and the attacks related to the Gaza war on several commercial cargo ships in the Bab al-Mandab Strait en route to the Suez Canal. These attacks caused the world’s largest shipping companies, including Maersk, to pause or suspend shipments through the Red Sea and Gulf of Aden to the Suez Canal – which is used by roughly one-third of global container ship cargo. These conflicts are likely to continue in 2024, pressuring customers to adapt their supply chains for contingencies with agility, such as rerouting Asia to Europe cargo around the Cape of Good Hope.
Regulatory action is now a key driver of the sustainability agenda
New regulatory requirements for sustainability reporting and due diligence are driving companies across all sectors to take a stronger approach to managing and disclosing impacts and risks related to ESG and responsible business practices in their operations and across value chains. The EU Corporate Sustainability Reporting Directive and its accompanying European Sustainability Reporting Standards
set a comprehensive standard for ESG reporting founded in a double materiality assessment.
Further, the anticipated EU Corporate Sustainability Due Diligence Directive will make human rights and environmental due diligence mandatory across value chains – increasing responsible business requirements both for Maersk and our customers. These regulations are part of the European Union’s Green Deal, which also includes other wide-reaching measures in support of the green transition with implications for companies and trade compliance. In addition to climate, there is also an increase in regulation targeting biodiversity loss, in response to the Global Biodiversity Framework agreed at the UN COP15 in December 2022. Biodiversity loss and ecosystem collapse are considered two of the fastest deteriorating global risks and financially material for many companies, according to the World Economic Forum’s 2023 Risk Report.
The new requirements expand the notion of companies’ responsibility beyond only accounting for own operations, to ensure due diligence and increase transparency across the value chain. This is challenging for many companies with global supply chains and will be a journey for Maersk to further mature our own processes over the coming years, while we also recognise opportunities to support our customers across their logistics supply chains.
Technology investments drive visibility
A large percentage of supply chains are already, or well on their way to being, fully digitised, with customers seeking visibility into their shipments to improve sustainability, reliability and responsiveness to disruption. 2023 saw especially strong technology developments in solutions such as digital platforms to do business directly with customers, artificial intelligence and predictive analytics. This elevates the materiality of ESG topics such as data ethics and the social impact of technology and automation on people.
E-commerce technology investments remained robust in 2023 to meet rising demand for supply chains that support omni-channel, digitally enabled experiences. This includes highly agile logistics solutions for growing urban populations such as ‘quick commerce,’ where goods are delivered in less than an hour. Maersk is developing localised logistics solutions from green warehouses to electric vehicles to ensure trends such as urbanisation and quick commerce can be sustainably supported.
7 Strategy and governance Progress on ESG Data and assurance Introduction Sustainability Report 2023

Strategy and governance
8 Strategy and governance Progress on ESG Data and assurance Introduction Sustainability Report 2023
ESG strategy and governance
A.P. Moller - Maersk’s ESG strategy
Strategic targets Performance
2023 Updates to targets
Building on over a decade of commitment to sustainability progress, the ESG strategy of A.P. Moller - Maersk (Maersk) charts an ambitious course and establishes ESG as core to our purpose, critical to the success of our business strategy and a differentiator in the value we create for our customers.
The strategy encompasses the material sustainability impacts, risks and opportunities for Maersk and is centred around three core commitments, each with supporting strategic KPIs and targets. These commitments represent issues where Maersk’s position, scale and reach can create the most significant impact, which in turn define our ambition level – whether we want to be good, excellent or an industry leader in specific ESG topics. Our strategic priorities and targets are shown in the figure at right.
The development of the ESG strategy in 2021 was informed by an assessment of material topics based on globally recognised frameworks, ESG benchmarks and our understanding of stakeholder expectations. An array of topics were assessed in terms of the impact we have through our business model, the value our stakeholders have at stake, and the risks and opportunities we face as a company. The outcome of this assessment was a holistic strategy spanning 14 ESG categories with defined sub-topics, ambitions, KPIs and metrics to track progress internally, and to report externally (see the relevant sections of this report).
This year, we are introducing changes to some of the strategic KPIs going forward. On Climate change, our new validated science-based targets for 2030 and 2040 will replace previous targets (read more in the chapter on Climate change). The targets for Business ethics and Data ethics, set for 2023, will be carried over as annual targets going forward. On Safety & Security, the Learning Teams target will also carry over as an annual target, while the leadership training target is being rescoped and will not continue for 2024. We report towards all current targets in this 2023 report.
Environment We will take leadership in the decarbonisation of logistics
We will deliver on our customer commitment to decarbonise their supply chains in time and our societal commitment to act and have impact in this decade
2030: Aligned with the Science Based Targets initiative 1.5°C pathway
Industry-leading green customer offerings across the supply chain
2040:
Net zero across the business 100% green solutions to customers
Carbon intensity (Ocean) decreased by 4% compared to 2020 baseline
13% reduction of GHG emissions (scope 1 and 2) in Terminals since 2020
Share of ocean freight transported with green fuels increased to 3%
2030:
35% absolute reduction in total scope 1 emissions
100% renewable electricity sourcing
22% absolute reduction in total scope 3 emissions
2040:
96% absolute reduction in total scope 1 and 2 emissions
90% absolute reduction in total scope 3 emissions
Social We will ensure that our people thrive at work by providing a safe and inspiring workplace
We ensure everyone gets home safe by preventing fatal and life-altering incidents
We create an engaging environment for all colleagues
We facilitate diversity of thought
2023:
100% of Learning Teams completed following High Potential incidents
Global Leadership (Top 1,200) upskilled in Maersk’s safety and security principles
2025: Employee Engagement Survey score in the 75th percentile of global norm
2025: >40% women in management and leadership
>30% diverse nationality (non-OECD) of executives
99% Learning Teams completed following High Potential Incidents
98% leadership trained in Maersk’s safety and security principles
Only the target on Learning Teams will continue in 2024
60th percentile No change to target
35% women in management and leadership
20% diverse nationality (non-OECD) of executives
Governance We operate based on responsible business practices
We live our Code of Conduct
We protect and treat data with respect
We procure sustainably
2023: 100% of employees (in scope) trained in Maersk Code of Conduct
2023: 100% of employees (in scope) trained on data ethics
No change to targets
92% of employees (in scope) trained Target continues for 2024
91% of employees (in scope) trained Target continues for 2024
2024: 100% of suppliers (in scope) committed to the Supplier Code of Conduct 95% of suppliers (in scope) committed No change to target
Please see accounting policies on pp. 55-61 for more information on definitions. All targets are for end of year.
9 Strategy and governance Progress on ESG
and assurance Introduction Sustainability Report 2023
Data
Strategy
Since the launch of the ESG strategy in early 2022, a key focus has been on defining roadmaps and strong governance to ensure progress and realise the strategic ambitions. In addition, Maersk has matured its reporting processes, enabling us to add new ESG KPIs to our performance table again this year (see pp. 48-51). Like existing KPIs, these are covered by external assurance.
Working actively and strategically with all aspects of sustainability risks and impacts is a baseline requirement from our key stakeholders today, and expectations continue to grow and develop. Looking ahead, external expectations and regulatory reporting requirements will continue evolving, and new ESG landscapes are taking shape regionally and globally - raising the need to revisit our existing strategy. This work will take place in 2024, and will include a review of ambition levels to reflect the outcomes of the updated double materiality assessment conducted this year (see pp. 13-14).
How the ESG strategy is governed
In early 2023, Maersk announced a new organisational structure and a new Executive Leadership Team (ELT), following the appointment of Vincent Clerc as CEO. As a result of these organisational changes, new ELT members took over sponsorship for several ESG categories ensuring continued ownership and leadership focus. Sponsorship includes driving initiatives forward and being accountable to the full executive team and Board of Directors for delivering on targets. Responsibility for executing on the strategy resides with the relevant functional areas reporting to the respective ELT member. To facilitate oversight and support decisionmaking for strategic dilemmas and risks through the year, ESG progress updates are provided to the ELT quarterly for our strategic KPIs and biannually across all 14 categories.
Ultimately, governance is anchored with the Board of Directors, that endorses the overall ESG strategy. In 2023, a new Board ESG Committee was established with the primary purpose of supporting the development of our ESG strategic direction, acting as a sounding board for the ELT and supporting the Board with strategy insights into specific ESG matters. This Committee meets quarterly to discuss selected deep dives on strategic topics throughout the year. Among the topics discussed in 2023 were our ESG and decarbonisation commitments, the current and emerging regulatory landscape for ESG, human and labour rights, diversity, equity and inclusion (DE&I) and ESG
Governance of ESG in A.P. Moller - Maersk in 2023
Board committees (ESG relevant)
ESG Committee
Audit Committee
Remuneration Committee
Board of Directors
Endorses ESG strategy as part of annual strategy review
Executive Leadership Team
Defines ESG strategy and oversees implementation
ELT committees (ESG relevant)
Risk & Compliance Committee
Investment Committee
Cross-category: Key corporate functions
Strategy Corporate Sustainability Finance
Facilitates ESG strategy and oversight, guides and enables category owners
Category-specific governance
Environment
ESG category ELT sponsor Owner
Climate change Rabab Boulos Energy Transition
Environment and ecosystems Rabab Boulos Safety & Resilience Social
ESG category ELT sponsor Owner
Human capital Susana Elvira People function
Diversity, equity and inclusion Susana Elvira People function
Human rights Caroline Pontoppidan Sustainability
Employee relations and rights Susana Elvira People function
Safety and security Rabab Boulos Safety & Resilience
Sustainable/ inclusive trade Caroline Pontoppidan Sustainability
Governance
ESG category ELT sponsor Owner
Governance Caroline Pontoppidan Sustainability
Business ethics Caroline Pontoppidan Compliance
Sustainable procurement Rabab Boulos Procurement
Responsible tax Patrick Jany Tax
Citizenship Caroline Pontoppidan Sustainability
Data ethics Navneet Kapoor Technology
10
on ESG Data and assurance
Report 2023
and governance Progress
Introduction Sustainability

targets for executive remuneration – the latter is incorporated into the Long Term Incentive programme and scorecard for approval by the Remuneration Committee.
In addition, the Audit Committee ensures oversight of key ESG risks and external reporting and receives regular updates on our ESG reporting process - in 2023 with a particular focus on preparations for the EU Corporate Sustainability Reporting Directive (CSRD) reporting including the update of the double materiality assessment.
At the ELT level, the Risk and Compliance Committee (RCC) is the main governance forum for ESG as well as other key risk and compliance processes and topics across Maersk, including our internal Commit governance framework (see box) and enterprise risk management process. The RCC meets quarterly to discuss the ESG progress updates that are subsequently shared with the full ELT, as well as deep dives in ESG categories. In 2023, key topics included the update of Maersk’s science-based targets, DE&I progress, human and labour rights, review of the sustainable procurement programme and ESG reporting. With the RCC now having oversight across ESG, the Decarbonisation and ESG steering committees were discontinued in 2023.
On an operational level, cross-functional steering committees or working groups facilitate coordination, ensuring that relevant functional and business areas are included in strategic decisions and supporting implementation.
Managing inorganic changes to the organisation
Acquisitions are a key part of Maersk’s Global Integrator strategy, especially as we add capacity and expertise in areas like project logistics and e-commerce to our global portfolio and local coverage.
To ensure that all inorganic growth targets are aligned with our ESG strategy and commitments, we continue our efforts to strengthen due diligence processes by incorporating ESG risk assessment more systematically into the mergers and acquisitions (M&A) process. In 2023, this included training for the M&A team on ESG priorities and further embedding climate change impact assessment into the due diligence and investment decision processes.
In 2023, A.P. Moller - Maersk completed the divestment of Maersk Supply Service, a leading provider of global offshore marine services and project solutions for the energy sector. The divestment to A.P. Moller Holding, the parent company of the A.P. Moller Group, is
aligned with our global integrator strategy to focus on truly integrated logistics. Aligned with our accounting policies (see pp. 55-61), we include 2023 ESG data from Maersk Supply Service until the date of divestment in this year’s report.
The three key elements of Commit –Maersk’s internal governance framework
As a company, Maersk ensures internal governance that provides our employees with direction and guidance on how we work and achieve our main objectives. This is structured around three core elements, which together form the Maersk governance framework called Commit:
• Our guiding Core Values, which have been shaped and strengthened since our foundation in 1904, and latest updated in 2022 to ensure they were consistently interpreted, easy to apply, and have a strong connection to our Purpose.
• Our Code of Conduct sets global standards for how we engage with colleagues, customers, suppliers, communities, authorities and other stakeholders. The Code of Conduct was also updated in 2022 to align with Our Purpose and ESG strategy.
• 21 Rules of business ethics, governance and authority are included in the governance framework, providing detailed internal instructions for all employees covering high-risk areas. These are subject to internal controls and an annual internal assurance process.
ESG topics related to compliance and responsible business practices are integrated into Commit through the Code of Conduct and Commit rules on HSSE, global employee relations, anti-corruption, sustainable procurement and data privacy and data ethics. Each rule has a designated owner in the organisation who is responsible for compliance. Executive oversight of compliance with Commit is managed through the annual internal assurance process, anchored with the Risk and Compliance Committee.
11 Strategy and governance Progress on ESG Data and assurance Introduction Sustainability Report 2023
Speaking up
A key process anchored in the Commit framework is the whistleblower programme of A.P. Moller - Maersk (Maersk), which aims to create a safe and secure environment for anyone to speak up and report violations without fear of retaliation. This is supported by effective investigations led by independent and impartial investigators, and by ensuring appropriate follow-up action to address violations and implement controls to avoid repetition.
The whistleblower programme supports anonymous reporting of cases and is available in multiple languages. Maersk fosters a speak-up culture and welcomes inquiries, questions and concerns from employees and outside parties. In addition to the whistleblower programme, there are other available channels such as direct management or leadership team members, and our Compliance, People or Ombuds functions.
In 2023, Maersk continued its internal, global Speak Up campaign to reinforce a speak-up culture and encourage people to report concerns without the fear of retaliation. This year’s campaign focused on warehouse and terminal workers, covering 120 entities out of the targeted 450 entities.
In 2023, Maersk received 1,154 whistleblower reports, a significant increase compared to the 735 cases recorded for 2022. 80% of the cases received during 2023 are already closed. In particular, we have seen an increase in cases received from the North America, Latin America and Asia-Pacific regions during 2023. Topics that contributed most to the increased number of cases received in 2023 relate to HR-related issues. We assess the increase in reports to partly be a positive development reflecting greater awareness of our whistleblower programme and the strengthening of our speak-up culture.
Whistleblower reports received per topic area in 2023
1,154 whistleblower reports received
HR-related matters
HSSE
Business integrity
Sustainable procurement
Fraud
IT security
Out of scope
Report outcomes and actions among closed whistleblower reports in 2023
doesn’t feel right please speak
926 closed
Insufficient information
Out of scope
Unsubstantiated
Substantiated
Dismissal
Disciplinary action
Training Warning
Policy/process
No action necessary
28% 17% 24% 3% 9% 4% 3% 6% 6% 45% 24% 22% 5% 1% 2% 1%
Maersk’s annual whistleblower campaign helps employees feel safe and empowered to speak up. If
up! Report with no fear Call to report the issue 24/7 You can stay anonymous
it
review
cases For numbers from previous years, see the 2023 ESG Factbook. 12 Strategy and governance Progress on ESG Data and assurance Introduction Sustainability Report 2023
Our material ESG topics
In preparation for the EU CSRD reporting requirements, which will be mandatory from 2024, we have this year updated our double materiality assessment. The results of this initial assessment, illustrated on the right¹, confirm that the material topics of A.P. Moller – Maersk’s (Maersk) ESG strategy are also those that come out as most material, including Climate change, Safety, DE&I and Business ethics. Political engagement/ lobbying, a topic that does not have its own ESG category within our ESG strategy, but cuts across topics, was identified as a material issue comprising of both potential positive and negative impacts. Recognising our global presence and the nature of our business as an integrator of global supply chains, this is not an exhaustive list, but shows where Maersk may have the largest impacts on people and planet through our activities, or where Maersk is exposed to the most significant financial risks or opportunities. Some topics such as microplastics, substances of concern, water discharges and marketing practices were identified as relevant in the assessment but fell below the thresholds applied for materiality.
Maersk has already for many years been guided by a double materiality perspective as the foundation for our sustainability and ESG strategy and reporting. The criteria of the European Sustainability Reporting Standards (ESRS) add more rigour to the assessment through a common set of requirements for how to conduct and report on double materiality, aligning closely with recognised standards such as the OECD Guidelines on Responsible Business Practices. For example, all topics were assessed for severity, which covers an assessment of scale, scope and remediable character of the topic – concepts we already apply in the identification of our salient human rights issues. Our focus in 2023 has been on establishing robust methodology aligned with the approach and criteria outlined in the ESRS. Going forward, we will continue the work to further mature, develop and refine our approach in line with best practice and as more guidance becomes available. For more information on the methodology, please see the 2023 ESG Factbook.
ESG category Material issues Impact description
Climate change mitigation Impacts related to GHG emissions across our value chain and to our energy usage
Climate change
Climate change adaptation
Our business activities’ exposure to climate-related physical risks and corresponding impacts to our workforce and customers due to business disruptions
Resource inflows Use of high-emitting resources that can put pressure on environment and societies
Pollution to air, water and soil
Environment and ecosystems
Pollution to air, water and soil from our operations, e.g. accidental environmental spills from our vessels or terminals, and releases of pollutants during operation of our assets
Water use Withdrawal and consumption of water from areas classified as water-stressed, which can put pressure on ecosystems and societies' access to water
Biodiversity and state of species
Degradation of ecosystems
Waste and ship recycling
Biodiversity loss driven by our material environmental issues (e.g. pollution, climate change, water withdrawal and land-use change), direct impact to species in locations where we operate, and releases of invasive species by our vessels
Production of fuels and infrastructure developments contributing to land and sea-use change, soil sealing and gradual ecosystems degradation
Waste generation from operations, including related to ship recycling
Safety and security Safety and security Risks of work-related injuries or fatalities and our exposure to global security risks
Violence and harassment Risk of unsafe work environments for underrepresented or vulnerable groups of our workforce
DE&I
Diversity and diverse ability Potential discrimination based on, e.g., ethnicity, gender and nationality in our global workforce
Work-life balance Ability to support our employees’ changing life situations by ensuring favourable global standards
Human capital Talent development Ability to attract and scale the right talents
Working conditions
Employee relations and labour rights
Work-related rights
Human rights Salient human rights issues
Business ethics
Impacts related to our workers’ access to decent working conditions such as working time, wages, employment terms and access to housing and sanitation
The rights of workers across our value chain including freedom of association and collective bargaining, modern slavery and child labour
Impacts and risks to people related to our activities across our value chain. See p. 40 for information on our salient human rights issues.
Corruption and bribery Risks of corruption and bribery across our value chain
Protection of whistleblowers Impacts related to accessibility, availability and security of grievance mechanisms across our value chain
Corporate culture and transparency Promoting a strong corporate culture and transparency in Maersk and in our business relations
Data ethics Data privacy and ethics The privacy of our employees’ and customers’ data and impacts related to an ethical use of data and AI
Sustainable procurement Supplier relations
Impacts and risks related to being a responsible and ethical business partner towards our more than 41,000 suppliers globally
Responsible tax Responsible tax Being a responsible and transparent taxpayer
Citizenship Citizenship Leveraging our position to drive positive impact on communities and societies where we operate
Climate advocacy Potential GHG emission reduction through advocacy towards industry-wide decarbonisation
Acrosscategories
Political engagement Potential impacts related to Maersk’s policy positions and engagement
Environment
GHG Positive impact Financially material impact Negative impact 1 Please see more information on the topics in the relevant chapters. Two of our ESG categories, Sustainable & inclusive trade and Governance, are kept separate from this assessment as they are not managed and reported as separate ESG programmes but rather incorporated into relevant sections of the report. Positive impacts will be screened for financial materiality in 2024. 13 Strategy and governance Progress on ESG Data and assurance Introduction Sustainability Report 2023
Social Governance
How we impact people and the environment across our operations and value chain
As part of our double materiality assessment, we have assessed material impacts across our operations and value chain as shown below. These impacts are not exhaustive but highlight the variety of some of the material impacts from our activities as an integrator of global supply chains. For information on how we manage these impacts to minimise harm and mitigate risk, please see the relevant ESG category chapters.
Key stakeholder groups
The expectations of seven key stakeholder groups have been considered in our materiality assessment. Please see more information on how we engage with them on p. 15.
GHG
Our assets are exposed to climate-related hazards. Climate change adaptation is material to the resilience of our business and to our customers’ supply chains.
Acting responsibly also means considering potential indirect impacts and mitigating risks of, e.g., facilitating illegal wildlife or timber.
Large infrastructure projects pose risks related to workers’ rights, in particular for contracted and migrant workforces.
Resource inflows: Shipbuilding and large infrastructure projects across our operations require a large inflow of high-emission materials such as steel.
As an end-to-end logistics provider, we store and manage data on customers, suppliers and workers.
Operating globally means exposure to security risks, from, e.g., geopolitical tension, terrorism and local conflicts.
The nature of our work carries risks of injuries and fatalities in our operations and across our value chain.
Underrepresented and vulnerable groups are at risk of violence, harassment and discrimination – especially in areas where gender norms and power imbalances influence perceptions, and local laws are inadequate.
GHG
GHG emissions are significant across all of our operations, but fuels for our ocean segment is the major contributor of our GHG footprint.
Electrification of our assets increases the demand for new minerals which can put pressure on ecosystems and communities.
Employees Authorities NGOs Investors and analysts Communities and nature Customers Suppliers and business partners
Ecosystem degradation: Clearing of waterways for vessels can impact underwater ecosystems through the dredging of sediments.
Corruption and bribery is an industry-wide risk for the transport and logistics industry.
A large part of our water consumption in land-side operations occurs in areas of high water stress.
Long working shifts and inadequate access to housing and sanitation can impact truck drivers’ well-being and conditions of work.
Pollution to air and water from chemical spills is an industry wide risk along with release of air pollutants. Recycling of a vessel can result in both pollution to soil and water and cause unsafe working conditions if not managed responsibly.
Our vessels sometimes operate in sensitive marine areas, e.g. with risk of whale strikes, and invasive species may be moved between ecosystems through ballast water or biofouling.
We work with more than 41,000 suppliers including approximately 5,100 high-risk suppliers in our global supply chain.
Barriers to accessible local grievance mechanisms can be a risk for third-party labour across our operations.
MAERSK
14 Strategy and governance Progress on ESG Data and assurance Introduction Sustainability Report 2023
Engaging with key external stakeholders
To inform our double materiality assessment we consider the perspectives of our key stakeholders, both those that may be directly impacted by our activities and those who are users of the information that we publish. The table at right shows our seven prioritised stakeholder groups. Through various channels, colleagues and teams across Maersk regularly engage with these stakeholder groups and collect valuable insights on topics that are important to them. As an example, our biannual engagement survey gives insight into the expectations of our employees (read more on p. 37). These insights inform our assessment of material issues and underpin the development of our solutions and initiatives in delivering on our ESG commitments and KPIs. ESG ratings are also a source of insight on stakeholder expectations, and our submissions are valued by customers and investors. We have prioritised those that are most material to our stakeholders and align with our priorities, including EcoVadis, CDP, MSCI and Sustainalytics. During 2024, we will work towards strengthening our format for directly collecting and incorporating external stakeholder perspectives into our double materiality process to ensure that stakeholder perspectives are continuously reflected in our ESG priorities.
Active engagement in alliances and partnerships
We actively engage in cross-industry partnerships and coalitions to set standards, develop solutions and drive common agendas across the ESG agenda. This active engagement is core to our ESG strategy and in recent years, we have seen significant growth in engagement requests. We aim to prioritise our efforts where we have the biggest impact and where it adds the greatest value, and therefore consciously assess and prioritise our partnerships to determine the appropriate level of engagement (or disengagement).
As noted in our materiality assessment, political engagement/ lobbying is an area where we may have potential positive impact and we ensure to mitigate potential negative impact through firm corporate policies guiding our approach to policy engagement.
In 2023, Maersk engaged in policy and regulatory debates at national, regional and global levels to strengthen requirements for responsible business conduct and contribute to a level industry playing field. This includes an ambitious IMO MEPC80 agreement to support net zero shipping emissions by or around 2050 (see p. 25 for more information).
Key external stakeholders and how we engage with them
Stakeholder Stakeholder expectations on ESG Engagement channels
Employees
Customers
Investors and analysts
Suppliers and business partners
Meaningful work, fair treatment and wages, a sense of belonging for all, and good development opportunities
Solutions that ensure responsible business practices and net zero emissions in their supply chain
Strategies, plans and actions to mitigate short and long-term risk to the business model
Responsible business practices and partnership on strategic issues
Authorities Compliance with regulation and industry leadership on transformation to net zero
Daily interactions between managers and colleagues – Engagement surveys – Inclusion survey
Regular business dialogues – ESG criteria in tender processes – Strategic Customer Council – Partnerships and collective action alliances
Regular engagement with investors and analysts – Investor roadshows and ESG investor calls – Investor surveys – Collective action alliances
Regular dialogue – Collective action alliances
Bilateral engagement with local, national and international agencies and authorities – Engagement through industry associations –Collective action alliances
NGOs Responsibility and accountability towards material issues, and industry leadership on topics of highest impact and leverage Bilateral engagement – Collective action alliances and partnerships
Communities and nature
Responsibility and accountability towards material issues, and positive contributions in areas of highest impact and leverage
Engagement with community representatives – Collective action alliances and partnerships – Scientific studies
Key partnerships and coalitions


 Alliance of CEO Climate Leaders Alliance for Clean Air
15 Strategy and governance Progress on ESG Data and assurance Introduction Sustainability Report 2023
At COP28, the CEOs of Maersk, CMA-CGM, Hapag Lloyd, MSC and Wallenius Wilhelmsen signed a Joint Declaration calling for four regulatory cornerstones for GHG reductions, including: 1) an end date for fossil-only vessels, 2) a global fuel standard, 3) a Green Balance Mechanism to fill the price gap between fossil and green fuels and 4) a well-to-wake life cycle methodology within an established regulatory framework. Maersk and CMA-CGM also signed a Public Private Partnership Commitment at COP28 with the governments of France, Korea and Denmark calling for the IMO to work towards higher targets for its GHG strategy in line with the Paris Agreement.
Engaging with our customers
Maersk customers are increasingly looking to deepen partnerships that can help them meet their decarbonisation commitments. This is driven by more ambitious science-based target setting and net zero roadmaps, including supply chain logistics emissions as well as the need for compliance with increased regulation and reporting requirements and pressure from their end customers.
Across many of our commercial segments, we see customers with an appetite for logistics partners that are at least as ambitious on decarbonisation as themselves and have credible solutions to make these ambitions a reality. Almost 60% of Maersk’s top 200 customers have committed to, or set, science-based targets, highlighting their need to increasingly decarbonise their scope 3 (supply chain) emissions as well as scopes 1 and 2. Going forward, we are solely tracking how many of our top customers/key accounts have committed to, or set, emission reduction targets with the Science Based Targets initiative (SBTi), and we are disregarding other emission reduction targets. Science-based targets represent the highest level of commitment, and most include scope 3 emission targets, giving us a better indication of customers’ ambitions and market potential for low-emission solutions.
We see the increasing trend towards the strategic importance of ESG and sustainability mirrored in the growing maturity of the sustainability commitments made by our customers, evolving from a baseline focus on managing the risks of poor performance in supply chains to more ambitious strategies and investments. This is driving a shift from transactional procurement of green solutions to more long-term, strategic partnering that contributes to industry-level sustainability and transformation.
Maersk’s annual Strategic Customer Council (SCC) is a platform for collaborating with our customers’ executive leadership on the future of logistics, where we use the joint problem solving approach to enable scaling of decarbonised logistics solutions on Ocean and beyond. In 2023, Maersk partnered with several customers, including Nike and Volvo Group, on strategic sustainability initiatives.
ECO Delivery uptake continues rising
ECO Delivery is Maersk’s product family for low-emission transportation.
Maersk ECO Delivery Ocean, ECO Delivery Inland and ECO Delivery Air help customers reduce GHG emissions from ocean shipping, inland transport and air freight, respectively. In 2023, Maersk customers shipped higher percentages of their ocean volumes with ECO Delivery Ocean - increasing to 3% in 2023 over 2% in 2022. Customers across many segments including Volvo Cars, Nestlé, BESTSELLER and Novo Nordisk are now moving 100% of their Maersk ocean volumes with ECO Delivery Ocean — sending a clear signal from larger corporations taking leadership in decarbonising their supply chains.
Maersk also continued developing low-emission inland transportation solutions across our wider logistics offerings, including
the extension of our electric vehicle capabilities in Germany, the UK, Norway, Sweden and China. HP Inc. partnered with Maersk on an integrated ECO Delivery Ocean and Inland solution, which led to the deployment of electric trucks in the United States supporting the needed development of low emission end-to-end logistics solutions.
Sustainability and decarbonisation are complex topics that require specific knowledge to have meaningful discussions with customers. In 2023, Maersk prioritised the training and upskilling of its global sales force on both, including decarbonisation theory and deep dives in low emission transportation and emission visibility solutions.
“Scaling alternative fuels in shipping is a challenge. Nike and Maersk acknowledge that getting from idea to inception to implementation will take time. We work with partners like Maersk, who are also committed to the long-term vision of decarbonisation, to move towards a more sustainable future.”
Noel Kinder Chief Sustainability Officer, Nike


We collaborate with customers on topics across ESG: Since 2019, Maersk’s rainbow containers have served as a symbol of our commitment to diversity and inclusion in its widest sense - gender, race, disability, religion, age and LGBTQ+.
In addition to visiting Maersk sites and Pride events around the world, the rainbow containers have been part of many customer events celebrating our shared values on inclusion.
16 Strategy and governance Progress on ESG Data and assurance Introduction Sustainability Report 2023
Environment

A. P. Moller - Maersk is taking a leading role in decarbonising logistics and in providing green solutions to help our customers reach their climate goals. Learn more about our progress including newly validated science-based targets for 2030 and 2040 and how we minimise our impact on the natural environment.
Climate change
Environment and ecosystems
Responsible ship recycling
2023’s milestone moment in our decarbonisation journey was the arrival of Laura Mærsk, the world’s first container vessel capable of sailing on green methanol.
17 Strategy and governance Progress on ESG Data and assurance Introduction Sustainability Report 2023
Why it matters
The world is facing a climate emergency. We see it as our obligation – as an industry leader and with the resources available to us – to do all we can to get to net zero operations as fast as possible and to help our customers decarbonise their global supply chains end to end.
Ambition
We will deliver an emergency response to the climate crisis and take leadership in the transformation of the transport and logistics sector to net zero operations.
Targets
2040
• Net zero across our business and 100% green solutions to customers
2030
• Aligned with a Science Based Targets initiative 1.5-degree pathway
• Industry-leading green customer offerings across the supply chain
New validated science-based targets from 2024:
2040
• 96% Reduction in total scope 1 and 2 emissions
• 90% Reduction in total scope 3 emissions
2030
• 35% Reduction in total scope 1 emissions
• 100% Renewable electricity sourcing
• 22% Reduction in total scope 3 emissions
Climate change
2023 was the hottest year in recorded history. Severe weather-related incidents in all regions of the world impacted millions of people and underscored the urgency of addressing climate change. As a key player in global logistics supply chains, which are responsible for 11%¹ of all global greenhouse gas (GHG) emissions, A. P. Moller - Maersk (Maersk) is committed to leading the decarbonisation of logistics and taking responsibility for being a part of the solution. Our approach is guided by the recognition that climate-related risks, and government and market actions to mitigate such, will have an impact on how we operate.
This year, concrete progress on this journey was delivered, following the ambitious climate goals we announced in 2022 of reaching net zero emissions by 2040 in our own operations and in 100% of our solutions for customers – many of whom have equally ambitious and science-based targets.
2023’s most notable milestone was the arrival of Laura Mærsk, the world’s first container vessel with a dual fuel engine that is capable of running on green methanol. In addition to marking a starting point for Maersk’s new fleet of green fuel vessels, Laura Mærsk served as an important signal that green fuel and green vessel demand from industry leaders will be an industry-shaping force in the coming years. Since we announced the order of Laura Mærsk in 2021 – a first for the shipping industry – we have already seen strong industry followership, and today some 180 new methanol capable vessels on order or being retrofitted industry-wide.
Ocean activities are the largest source of Maersk’s GHG emissions, but they are not the only source. In 2023, progress was made across our entire value chain, from terminal electrification to electric vehicles for local logistics and low and very lowemission warehouses. See pp. 21-24 for more details on our Ocean, Terminals and Logistics & Services activities.
In 2023, Maersk also became the first in the shipping industry to have its 2030 and 2040 targets validated by the Science Based Targets initiative (SBTi) in alignment with a 1.5°C and net zero pathway. These new targets, which are critical to our decarbonisation efforts, and to aligning with our customers’ targets, include specific sub-targets for our scope 1, 2 and 3 emissions and will replace previous targets announced in early 2022 (see pp. 19-20 for more details).
Despite this momentum, serious challenges remain – including sourcing green fuels at scale. Regulatory incentives will be critical to overcome this challenge,
including two much-needed IMO measures coming into force in 2027 - a global fuel standard and a maritime GHG emissions pricing mechanism (see p. 25 for more details). In the greater economy, slowdowns in key markets are reducing logistics demand and in some cases the appetite for investments in energy transition. And while many Maersk customers have shown a willingness to pay a premium to decarbonise their supply chains, rising interest rates threaten to push fuel costs to customer limits. Maersk’s position is that climate change needs to be tackled with a sense of urgency and action – we cannot wait until the market, regulatory and technical challenges are all resolved. We therefore continue our approach of implementing while we are innovating, and doubling down on solutions that have immediate impact. Achieving our SBTi-validated targets will be challenging, but we remain confident that the job can be done with the support of key stakeholders.

Maersk’s first large, ocean-going container vessel capable of running on green methanol being floated at the Busan, South Korea shipyard. The vessel comes into service in February 2024.
1 MIT research based on IEA data and Global Logistics Emissions Council guidance (read more)
18 Strategy and governance Progress on ESG Data and assurance Introduction Sustainability Report 2023
Maersk’s climate commitments validated by the Science Based Targets initiative
2030
Net zero by 2040 Aligned with 1.5 degree pathway by 2030
Main KPIs and targets: Baseline year 2022²
Scope 1
Own operations
Scope 2
Purchased electricity
Scope 3 Value chain
35%
100%
Absolute reduction in total scope 1 emissions
Renewable electricity sourcing
22% Absolute reduction in total scope 3 emissions
Sub KPIs and targets: Baseline year 2022
Maritime operations³
35% Absolute reduction in scope 1 and scope 3 well-to-wake emissions from own container shipping operations
17% Absolute reduction in scope 3 well-towake emissions from subcontracted container shipping operations
Other operations
42% Abolute reduction in scope 1 emissions from all other sources
25% Absolute reduction in scope 3 fuel and energy related activities and upstream transportation
42% Absolute reduction in scope 3 emissions from use of sold products covering distributed fossil fuels
96%
90%
Absolute reduction in total scope 1 and 2 emissions⁴
Absolute reduction in total scope 3 emissions⁴
Maritime operations³
96% Absolute reduction in scope 1 and scope 3 well-to-wake emissions from own container shipping operations
97% Absolute reduction in scope 3 well-towake emissions from subcontracted container shipping operations
Other operations
90% Absolute reduction in scope 1 and scope 2 emissions from all other sources
90% Absolute reduction in scope 3 emissions from all other sources
GHG MAERSK
2040 2 Please refer to the Climate Change section of our Sustainability website for specific details on the science-based targets shown in this overview. 3 Following the maritime sectoral framework, the sub-targets for maritime operations cover emissions from fuels across scope 1 and 3 (well-to-wake). Well-to-wake emissions refer to the sum of upstream (well-to-tank) and downstream (tank-to-wake) emissions. 4 Residual emissions will be neutralised in accordance with the Net Zero criteria of the Science Based Targets initiative.
19 Strategy and governance Progress on ESG Data and assurance Introduction Sustainability Report 2023
Aligning our decarbonisation path to the Science Based Target initiative
In 2023, Maersk had a total GHG footprint of 79.5 million tonnes, a decrease of 4.1% compared to 2022 (see table below). The decrease was mainly driven by reduced purchases of capital goods (scope 3), and reduced fuel consumption (scope 1 and 3). Moreover, to align with our SBTi validated targets, the 2022 baseline has been recalculated, which led to a 6% increase of previously stated emissions. See the accounting policies pp. 55-61 for more detailed explanations on the changes.
As part of the work to set SBTi-aligned targets, we have significantly improved the methodology for calculating scope 3 emissions, increasing the share of emissions that is calculated based on activity data from 50% to 82%. Our new targets therefore reflect a clearer understanding of our performance with a shift from spendbased estimates to activity-based estimates. This methodology eliminates the effect of operational and administrative charges which
Maersk’s GHG emissions footprint 2023 (2022)
in 1,000 tonnes CO₂e
79,462 (82,877)
34,138 (34,453)
Total GHG emissions
Including scope 1, scope 2 (location-based), and scope 3 emissions
Scope 1 emissions – from financially controlled own operations
Where 92% of the emissions come from our ocean operations related to fuel use
386 (444)
Scope 2 emissions – from generation of purchased electricity (location-based)
Where 56% of the emissions come from our terminals
44,938 (47,980)
Scope 3 emissions – created in the value chain as result of Maersk’s business activities
Including emissions from cargo transported under vesselsharing agreements and sourcing of marine fuels to third-party customers. The main drivers of these emissions are:
do not actually lead to emissions, and inflationary effects that cause uncertainty in spend-based estimates.
Aligning our roadmap to the Science Based Targets initiative pathway
The Science Based Targets initiative (SBTi) is a widely adopted framework for setting corporate climate targets in line with the 2015 Paris agreement's pathway limiting global temperature rise to 1.5°C. The number of companies adopting SBTi targets – many of whom are our customers – has doubled each year over the past eight years.
In early 2022, Maersk announced an accelerated net zero 2040 target, including key milestones needed by 2030 from a 2020 baseline, and committed to aligning our targets with the SBTi 1.5 degree pathway to 2030 and the 2040 net zero standard. Following the publication of the long-awaited SBTi sectoral framework for maritime shipping in late 2022, we have, during 2023, done extensive work to prepare and submit 2030 and 2040 targets. These have successfully been validated by the SBTi as the first in the shipping industry, allowing us to deliver on our public commitment to externally verified emissions reduction targets.
The SBTi-validated targets are not directly connected to our previous business segment sub-targets. They have a different baseline year (2022), reflecting that 2022 is a more representative baseline compared to the previous two years of pandemic, and enabling us to take recent acquisitions into account in the baseline. A significant change is that they are absolute emissions reductions targets rather than relative intensity targets, and for the first time we are setting specific targets for scope 1, 2 and 3 emissions across Maersk, with required sub-targets for certain operations and GHG sources - in particular related to ocean activities as we follow the maritime sector framework. This means that the sub-targets for maritime operations cover well-to-wake emissions, whereas our previous ocean KPI on EEOI is a relative target covering only tank-to-wake emissions. While our overall roadmap to decarbonise remains the same, our new targets will require additional effort in certain business areas. In this year’s report, we continue to report towards the previous targets, and will commence reporting on the new validated SBTi targets in 2024.
Emissions reduction pathways to achieve SBTi-aligned 2030 and 2040 targets
20,465 (26,575)
10,428 (8,799)
5,728 (3,248)
5,653 (5,949)
• Upstream transportation and distribution
• Use of sold product (incl. sale of marine fuels and reefer containers to third parties)
• Purchased goods and service
• Fuel and energy-related activities
(m tonnes CO₂e/year) Residual emissions will be neutralised in accordance with the
criteria
Scope 3 Scope 2 Scope 1 GHG removals 2040 2039 2029 2038 2028 2037 2027 2036 2026 2035 2025 2034 2024 2033 2023 2032 2031 2030 2022 6.4 82.9 59.8 -6.4 -100% -90% -22% -96% -35%
Net Zero
of the Science Based Targets initiative.
20 Strategy and governance Progress on ESG Data and assurance Introduction Sustainability Report 2023
Decarbonising our Ocean business
The two key levers to decarbonising our Ocean business – the largest source of Maersk’s GHG emissions – are improving fuel efficiency and transitioning to green fuels.
Improving fuel efficiency
In 2023, Maersk continued increasing the energy efficiency of our fleet through more fuel-efficient operations and the continuous roll-out of
Ocean energy efficiency performance 2023
Relative energy efficiency
*EEOI: Energy Efficiency Operational Indicator
efficiency technologies on owned and time charter vessels including new and improved propellers, bulbous bows, shore power enablement and tech solutions like the Maersk’s energy efficiency platform StarConnect (read more on p. 45). Combined with the continued use of second-generation biodiesel in our fleet, we managed to lower our emissions intensity measure, EEOI⁵, from 13.0 in 2022 to a record low of 11.68 in 2023. In 2023, we also implemented better governance and forecasting processes for EEOI and leading indicators to be able to better track and act on progress during 2024.
Due to the significantly elevated security risk, Maersk in January 2024 decided that all vessels due to transit the Red Sea / Gulf of Aden will be diverted south around the Cape of Good Hope for the foreseeable future. While this will increase fuel consumption and emissions for the affected vessels, the overall impact on Maersk’s emissions in 2024 is highly uncertain, as it will ultimately depend on numerous factors, including vessel speed and duration of the conflict.
Transitioning to green fuels
A hallmark moment for Maersk - and the shipping industry - was the arrival this year of Laura Mærsk, the world’s first methanol-enabled container vessel. The 2,100 TEU (Twenty-foot Equivalent Unit container) feeder vessel completed its entire maiden voyage from South Korea to its name-giving ceremony in Copenhagen on green methanol, and is now in service on the Baltic Sea, operating on green fuels.
In 2023, we expanded our portfolio of methanol-enabled vessels on order with six additional vessels with a capacity of 9,000 TEU each, to be delivered in 2026 and 2027. In 2024, we will begin taking delivery of the
“We’re continually exploring sustainability opportunities across our supply chain and our overall business, as we work towards becoming a climate-neutral company by 2040. By switching to renewable fuel, we have achieved an immediate reduction in fossil CO₂ emissions from intercontinental ocean freight by at least 84% compared to fossil fuel.
This initiative shows that we can act now and implement solutions that achieve significant results. We all have a responsibility to act.”
Javier Varela Chief Operating Officer and Deputy CEO at Volvo Cars
first seven large container vessels, each with a capacity of 16,000 TEU. The first of these, Ane Mærsk, is expected to enter service on Maersk’s string connecting Asia and Europe, which includes port calls in Shanghai, Tanjung Pelepas, Colombo and Hamburg.
In addition to ordering new methanol-enabled vessels, Maersk also announced in 2023 our intentions to convert an existing 14,000 TEU vessel from a traditional diesel engine to a dual-fuel methanol engine. This first-of-its-kind project will help demonstrate that new builds are no longer the only pathway to decarbonisation. A vessel conversion will take place in 2024, with the intention of replicating the retrofit on additional vessels in the coming years.
Relative EEOI from 2020 (%) 2030 target pathway for relative EEOI, 2020 index 107% 96% 106% 2030 2020 2021 2022 2023 Actual EEOI* 2023 11.68 5 Please refer to the accounting policies on p. 55 for more information on how the 'Reduction in carbon intensity (Ocean) by 2030 (baseline year 2020)' is calculated.
21 Strategy and governance Progress on ESG Data and assurance Introduction Sustainability Report 2023
Continued growth in Maersk ECO Delivery 2023 saw continued demand growth for the ECO Delivery products of Maersk, which replace fossil fuels with biodiesel and green methanol certified with International Sustainability and Carbon Certification to ensure fully traceable, responsible feedstock and sourcing. In 2023, over 683,000 tonnes GHG savings were achieved, and around 3% of Maersk Ocean volumes are now transported with ECO Delivery Ocean.
To date over 212 customers have opted for ECO Delivery, and in 2023 global brands such as Nestlé and Inditex committed to shipping 100% of the ocean volumes they ship with Maersk via ECO Delivery Ocean. This growth reflects customers’ growing engagement with supply chain partners who can help realise their climate ambitions with impactful solutions and credible data to support their science-based targets and enhanced reporting requirements.
In 2023, Maersk also introduced a new methodology to support customers’ needs for more accurate emissions reporting, based on Global Logistics Emission Council standards. Biofuel per transported
container will be verified by an external third party for the scope of customers’ Maersk ECO Delivery Ocean agreement.
2023 saw positive progress in securing green fuels for both Maersk’s immediate needs and towards meeting 2030 targets. The ECO Delivery Ocean product today relies mainly on the use of drop-in biodiesel as a fuel, which can be used in conventional vessels. In 2023, Maersk continued expanding its global biodiesel supply infrastructure to key bunkering hubs in Europe and Singapore. We will continue to rely on biodiesel to scale the green fuel base while building up the supply base of other green fuels such as methanol.
Securing green methanol today
Since Laura Mærsk was ordered from Hyundai Heavy Industries in 2021, we have worked diligently to ensure her maiden voyage and operational route in the Baltic Sea could be run on green methanol. Biomethanol was secured from Dutch producer OCI Global to cover Laura Mærsk’s maiden 21,500 km journey from Ulsan, South Korea, to Copenhagen, Denmark – more than halfway around the globe. OCI produces its
green methanol at a US-based facility by using captured biogas from decomposing organic waste in landfills.
Within her current Baltic Sea feeder route, Laura Mærsk will be bunkered in Rotterdam with biomethanol produced from biomethane and certified in accordance with the EU Renewable Energy Directive. It is produced by global energy company Equinor, using existing facilities and infrastructure for a quick route to market and contributing to a greener gas grid while also capturing methane emissions that would otherwise arise from the feedstock manure.
In 2021, Maersk signed a deal to secure future volumes for Laura Mærsk from a European Energy facility in Southern Denmark. The production plant is expected to come online in 2024 and will produce e-methanol from renewable electricity from the Danish electricity grid and from an on-site solar PV park and using biogenic waste CO₂ from upgrade of biogas to biomethane.
The necessity of exploring several different pathways illustrates the complexity of securing green fuels at scale today. The graphic below shows some of the different pathways to green methanol.

biomass Bio-methanol Bio-methanol E-methanol
Bio-methane added into gas grid and physically connected to production facility Methanol plant takes biomethane out of the grid to produce green methanol on mass-balance basis Methanol synthesis Gasification Syngas Electrolysis Biogas reforming to bio-methane Waste biomass Renewable electricity Green hydrogen Biogenic CO2 +
70% = = =
Source Production Fuel type Min. lifecycle greenhouse gas emissions reduction Waste
Biogas reforming to bio-methane
65% 65%
22 Strategy and governance Progress on ESG Data and assurance Introduction Sustainability Report 2023
Securing tomorrow’s green fuels
In November 2023, Maersk signed a landmark offtake agreement with Chinese developer Goldwind, a global leader in clean energy, that significantly de-risks our emission reduction commitments in the coming decade. In the global shipping industry’s first large scale offtake
Maersk’s definition of green fuels
We define ’green fuels’ as fuels with low to very low GHG emissions over their life cycle compared to fossil reference fuels. Different green fuels achieve different life cycle reductions depending on their production pathway. By ‘low’ we refer to fuels with 65-80% life cycle GHG reductions compared to fossil fuels. ‘Very low’ refers to fuels with 80-95% life cycle GHG reductions compared to fossil reference fuels.
agreement, Goldwind will supply annual green methanol volumes of 500,000 tonnes starting in 2026 - enough to allow green methanol operations for the first 12 of our coming 24 methanol-capable vessels. To help further catalyse this ramp-up, A.P. Moller Holding, together with A.P. Moller - Maersk as a minority owner, created a seed investment in C2X – an independent company that will build, own and operate assets to produce green methanol at scale. C2X plans to bring three million tonnes of green fuels to market annually starting in 2030, and large projects are underway in Egypt and Spain.
Maersk continues working hard on securing the volumes of green methanol and other green fuels needed to reach our 2030 and 2040 targets through a large portfolio of green fuel suppliers. Technologies are being developed to enable more scalable and competitive methods of producing biofuels, green methanol (biomethanol and e-methanol) and green ammonia, and Maersk continues to explore potential future fuels.

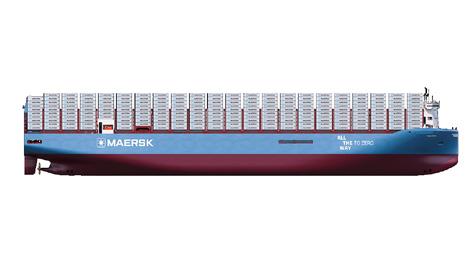

Laura Mærsk
In operation since September 2023
18 vessels
6
Ammonia is one promising fuel we are investigating for Maersk vessels. Substantial groundwork and R&D have been conducted, and Maersk is facilitating a comprehensive assessment of the environmental impacts of using ammonia as a shipping fuel with various industry partners. The assessment encompasses a full life cycle assessment of ammonia, as well as a thorough evaluation of the environmental risks posed by ammonia spills from vessels. The study results, to be published in 2024, will be benchmarked against other relevant shipping fuels, providing a neutral and science-based comparison to promote informed decisionmaking. Maersk is also investigating other potential energy sources that could support the decarbonisation of our fleet.
Decarbonising Logistics & Services
The rapidly growing need for end-to-end logistics solutions and heightened expectations for sustainable supply chains are driving demand for more road, rail, warehouse and air decarbonisation solutions. These are reflected in our commitments to increase our adoption of renewable electricity and/or green fuels in these operations.
In our landside transportation business, Maersk is investigating both existing and emerging trucking technologies from battery-electric to fuel cells and hydrogen. We currently see battery-electric becoming the dominant energy system. Transitioning our landside transportation however presents challenges beyond technology. Maersk is dependent on our suppliers’ willingness to invest in green assets, and on energy providers and energy infrastructure for green power.
Addressing these challenges will likely require Maersk to rethink how we engage with suppliers, partners and customers to effectively de-risk capital investment across the value chain and incentivise the scaling of these technologies until the end of the decade, when we forecast cost of ownership for electric trucks to reach parity with fossil fuels.
In 2023, Maersk launched an ECO Delivery Inland product in select locations within the USA using owned/leased electric vehicles. Further, we began deploying heavy duty electrical trucks, together with partners, in Germany, Norway, Sweden, the UK and China, and pilots in Brazil. We also launched low and very low-emissions dry storage warehouses in the UK, Malaysia and Colombia.
2,100 container capacity 16,000 / 17,000 container capacity 9,000 container capacity
2024-2025 delivery
vessels 2026-2027 delivery
23 Strategy and governance Progress on ESG Data and assurance Introduction Sustainability Report 2023
In 2024, we will continue broadening our ECO Delivery Inland offerings across both geographies and transport modes, building more vendor partnerships. This includes expanding to electric rail, barge solutions, and increasing our heavy electric truck capacity.
Decarbonising storage facilities (excluding depots) is already possible from a technology perspective and offers a positive business case in terms of increased operational efficiencies. A key challenge is making the business case for investments with longer payback periods. Like landside transport, efficiencies for these facilities are also reliant on access to green electricity and underlying infrastructure.
In warehouses, we will continue driving energy consumption visibility and corresponding reduction targets through the retrofitting of smart meters and site level energy transition roadmaps. Maersk is also designing a strategy for sourcing renewable electricity in 100+ key locations during 2024.
Air cargo remains a critical part of supply chains for many customers, and a significant contributor to logistics emissions. Sustainable Aviation Fuel (SAF) is the only current available solution, however it is costly and expected to remain too scarce to make a significant emission reduction impact. Although there is currently no line of sight on scalable solutions, Maersk remains committed to driving transformation through deep engagement with airlines, fuel suppliers and customers. In 2023, Maersk focused on the needed governance and resources to support SAF sourcing requirements, and on engaging with customers to test viable solutions. In 2024, we will continue building relationships with suppliers and airlines, as well as working closely with our customers to design the right future solutions. We have also started piloting our ECO Delivery Air solution with our first customers.
Decarbonising Terminals and Towage
Maersk’s decarbonisation commitment also applies to APM Terminals’ network of owned and operated terminals. Levers that will be activated to reduce emissions at terminals include switching to renewable electricity, direct electrification, battery-electric mobile equipment, energy optimisation and green fuels. To ensure a successful implementation of our global strategy, we are building local roadmaps with our terminals.
Since 2020, APM Terminals has reduced its absolute scope 1 and 2 emissions by 13%. Additionally, 40% of electricity demand is now procured by renewable resources. Key initiatives driving the emissions reduction include the implementation of dedicated green tariffs in European terminals, Elizabeth (USA) and Callao (Peru), a virtual power purchase agreement covering 40% of electricity in Pipavav (India), switching from diesel to renewable diesel in Los Angeles (USA), installation of on-site solar in Pipavav (India), Aqaba (Jordan) and Barcelona (Spain), and implementation of energy optimisation initiatives at 12 terminals to reduce fuel and electricity use.
In 2023, APM Terminals and DP World published a joint white paper emphasising the importance of electrified container handling equipment (read more). The high cost of battery-electric equipment is a primary challenge to decarbonisation in the terminals industry; however, the white paper shows that with the right actions from industry stakeholders, battery-electric equipment can be an affordable and accessible solution this decade, and competitive with incumbent diesel technologies. The white paper offers a roadmap for container terminal electrification, with key levers and actions for all players across the value chain. The companies also announced the formation
of the Zero Emission Port Alliance during COP28 – an industry-wide strategic coalition with the goal of accelerating container handling equipment electrification.
To prepare internally for the transition to battery-electric equipment, APM Terminals kicked off the first of five electric equipment pilot projects at the Aqaba Container Terminal in Jordan this year.
Decarbonising Terminals:
2023 highlights
13% reduction in absolute scope
1 and 2 emissions since 2020
40% electricity procured by renewable resources
In our Svitzer towage business, decarbonisation efforts focus on equipment, behaviour and fuels. Around 16% of its fully-owned fleet are now operating on biofuel, and in 2023 the Svitzer fleet achieved over 18% improvement in vessel carbon intensity. Svitzer also has methanol hybrid fuel cell and high speed methanol engine TRAnsverse vessels in development. Decarbonisation efforts enable Svitzer to develop new value propositions, like Ecotow, to support customers to meet their own ESG goals.
MAERSK
24 Strategy and governance Progress on ESG Data and assurance Introduction Sustainability Report 2023
Regulatory drivers of progress
Regulation that creates a level playing field and encourages investments in vessels, fuel and infrastructure remains critical to achieving climate neutral supply chains. In 2023, concrete progress continued through regional initiatives and globally with the International Maritime Organization (IMO) and through forums like the United Nations Climate Change Conference (COP28).
Maersk is committed to conducting all our policy outreach in alignment with the goal of limiting global temperature rise to 1.5°C. We actively engage with policymakers and stakeholders to advocate for regulations and policies that support this crucial objective, ensuring our business strategies are in harmony with global mitigation efforts.
The European Union’s Fit for 55 legislative package, aimed at reducing net greenhouse gas emissions by at least 55% by 2030 compared to 1990 levels, includes the EU Emissions Trading System and the groundbreaking FuelEU Maritime fuel standard, which takes a ‘well to wake’ approach to ensure emissions are not merely shifted from sea to shore. Maersk is preparing for these regional measures and hopes they will be a steppingstone for IMO global measures.
Globally, the 80th session of the IMO’s Marine Environmental Protection Committee marked a significant advancement in maritime environmental regulations. The committee adopted a revised strategy including enhanced ambitions to reach net zero GHG emissions from international shipping by 2050.
For Maersk, the two most important and complementary measures in the revised strategy are a mandate to develop a global fuel standard and a maritime GHG emissions pricing mechanism. A global fuel standard of 5-10% green fuels by 2030 will ramp up the use of green fuels in shipping, while the GHG price addresses energy efficiency.
A number of GHG pricing mechanism proposals are under consideration, with different price points and different approaches, e.g. from well-to-wake to a levy to emissions trading or feebate systems. Maersk, along with other members of the World Shipping Council, has put forward a proposal for a Green Balance Mechanism –essentially a subsidy-fee mechanism including an administrative and redistribution element on top, as well as a just and equitable transition element and R&D fee. Read more about our policies and positions on our website
COP28 marks milestone
Maersk believes that the United Nations Climate Change Conference (COP28) marked a pivotal moment in global climate negotiations. This was the first time a COP agreement was reached that calls on all countries to move away from using fossil fuels. The scope includes accelerating efforts towards the phase-down of unabated coal power, phasing out inefficient fossil fuel subsidies and other measures that drive the transition away from fossil fuels in energy systems in a just, orderly and equitable manner, with developed countries continuing to take the lead.
Another notable achievement was the commitment to significantly increase renewable energy. Around 118 countries agreed to triple renewable power generation capacity and double energy efficiency by the end of this decade. These ambitions hinge on strong government support and substantial financing to bridge a USD 18 trillion investment gap. However, for Maersk, the final text of COP28 fell short in one key area. It lacked explicit language to ‘phase out’ or ‘phase down’ fossil fuels. Nevertheless, Maersk still sees this agreement as a milestone and hopes that the COP momentum can be sustained throughout 2024 - not least in difficult upcoming IMO negotiations.

Natural Climate Solutions
As part of our commitment and in line with the SBTi Net Zero standard, which recommends that companies compensate for emissions above and beyond abatement targets to deliver net zero, Maersk continues to evaluate the options for Natural Climate Solutions (NCS) and how we can build a portfolio of projects. NCS refers to a range of voluntary activities to avoid and remove GHG emissions from the atmosphere through projects such as reforestation, renewable energy and methane capture. These activities are registered by private carbon standard organisations, and carbon credits are issued that match verified GHG emission reductions and removals associated with the activities. Our work is in a nascent phase, and we will report more on this in future reports.
See more on our COP28 engagement on p. 16.
Ensuring a just transition
Achieving net zero global supply chains will require massive changes in society, as well as industry and policy. These will affect the way people live and work as well as the flow of goods around the world. In line with Our Purpose, Maersk is committed to ensuring that the green transition is just and inclusive, so that it benefits society and improves lives, and does not have unintended negative impacts of people’s rights or wellbeing. Maersk continues maturing its approach to ensure a just transition across our three key touchpoints:
• Responsibly supporting green fuel supply chain creation, which should not come at the expense of people, including workers and local communities.
• Preparing the workforce of tomorrow, including upskilling and the creation of new, decent jobs in the green energy supply chain.
• Policy advocacy, to ensure a human-centred and just approach with the policy frameworks on which we rely.
Maersk CEO Vincent Clerc, together with the CEOs of CMA-CGM, Hapag Lloyd, MSC and Wallenius Wilhemsen, jointly called for a phase out of fossil-fueled vessels and a global green balance mechanism at COP28.
25 Strategy and governance Progress on ESG Data and assurance Introduction Sustainability Report 2023
EU Taxonomy reporting
The EU Taxonomy is a classification system for which economic activities can be considered environmentally sustainable. It is a cornerstone of the EU’s sustainable finance framework and an important market transparency tool defining criteria for economic activities that are aligned with a net zero trajectory by 2050 and broader environmental goals other than climate. In this way, it serves to help direct investments to the economic activities most needed for the transition, in line with the European Green Deal objectives to reduce greenhouse gas emissions in the EU by at least 55% by 2030, compared to 1990 levels. It is used as a key reference point and requirement in current and upcoming sustainability and ESG-related disclosure regulation and standards, including CSRD, and we expect it to set the standard for other countries to follow. From 2023, the EU Taxonomy has expanded in scope beyond the two climate-related objectives to include more economic activities and screening criteria across six climate and environmental objectives outlined in the regulation.
A.P. Moller - Maersk (Maersk) uses the EU Taxonomy criteria in our Green Financing Framework (GFF) to define the types of activities and assets that are eligible under the GFF, and we see increasing interest and expectations from investors and other financial market participants to Maersk’s EU Taxonomy performance and reporting. Since 2022, we have reported the share of activities that are ‘taxonomy-aligned’ and ‘taxonomy-eligible’. Aligned activities are the share of Maersk’s eligible activities that meet both the ‘substantial contribution’ and ‘do no significant harm’ criteria outlined in the taxonomy regulation. In addition to these activity-specific criteria, we have also completed a group-level assessment on how we comply with the social minimum safeguards and how we do not violate any of the additional exclusion criteria of the EU Taxonomy. We have assessed that the economic activities of the new environmental objectives, included from 2023, are less relevant to Maersk’s business model and decarbonisation strategy. Thus, we continue to use climate change mitigation as our primary screening criteria.
The results of Maersk’s taxonomy screening for 2023 confirm that the company has significant opportunity to substantially contribute towards climate change mitigation, and that it is in its early stages of the journey to decarbonise its end-to-end value chain. Hence, we see a high share of eligible revenue, Capex and Opex, but a significantly
lower share of revenue, Capex and Opex related to taxonomyaligned activities. Over the coming years, we expect to see a modest gradual increase of taxonomy-aligned revenue and a continued steady increase in the taxonomy-aligned Capex in line with our decarbonisation strategy.
Ocean
The eligible activities in Ocean mainly relate to ocean container transport and associated services. Aligned revenue in Ocean is related to 22 conventional vessels as well as our first green methanol vessel that meet the technical screening criteria. Aligned Capex relates to 1) capital expenses in relation to existing aligned vessels; and 2) milestone payments for the ordered green methanol vessels incurred during the year. Aligned Opex is the repair and maintenance expenditures in relation to aligned vessels incurred during the year. The share of non-eligible activities in Ocean mainly relates to investments in and repair/maintenance of containers and activities related to trading of marine fuels.
Logistics and Services
In line with the recently updated criteria, eligible activities in Logistics and Services relate to warehousing as well as to road, rail and air freight. As warehousing in itself is not an eligible activity, the focus is on the buildings we acquire and refurbish, potentially leading to aligned Capex and Opex, but no revenue. Aligned revenue is related to electrical trucking and rail freight. As Maersk does not own any trains, aligned Capex and Opex relate to the electrical trucks that passed the screening criteria. Non-eligible activities in Logistics and Services mainly relate to services within supply chain management and e-commerce.
Terminals
Eligible activities in Terminals mainly relate to port infrastructure supporting ocean-based transportation. Aligned revenue, Capex and Opex are linked to electrical equipment used to operate the terminals, including cranes, trucks and lifts etc. Non-eligible activities in Terminals relate to terminal concession rights and operational software.
Towage and Maritime Services
Eligible activities in Towage and Maritime Services mainly relate to Maersk Supply Services’ and Svitzer’s operation of service vessels and
vessels required for port operations and auxiliary activities. For Svitzer, no activities are currently aligned. For Maersk Supply Services , revenue from aligned activities includes enabling activities in installation, maintenance and repair of renewable offshore wind parks. Aligned Capex relates to:
1. Existing service vessels that have undergone retrofitting meeting the technical screening criteria;
2. Expenditures incurred towards offshore electrical charging infrastructure project; and
3. Milestone payments for an offshore wind installer vessel.
For a detailed overview of Maersk’s eligible and aligned activities, see pp. 52-54. For more information on how the numbers have been prepared, see pp. 52-54.
A.P. Moller - Maersk taxonomy reporting for 2023
Segment Revenue Capex Opex Ocean Aligned Eligible but not aligned Non-eligible 2% 58% 3% 11% 27% 9% 1% 26% 27% Logistics & Services Aligned Eligible but not aligned Non-eligible 0% 12% 15% 0% 15% 15% 0% 15% 1% Terminals Aligned Eligible but not aligned Non-eligible 2% 4% 0% 6% 11% 0% 6% 14% 4% Towage and Maritime Services Aligned Eligible but not aligned Non-eligible 0% 2% 2% 0% 4% 2% 0% 6% 0% Consolidated Aligned Eligible but not aligned Non-eligible 4% 76% 20% 17% 57% 26% 7% 61% 32% Taxonomy-eligible activities as share of
26 Strategy and governance Progress on ESG Data and assurance Introduction Sustainability Report 2023
Climate-related risks
2023 was another year of weather extremes that disrupted global economies and affected millions of people worldwide. Our business and operational efficiency may be directly impacted by such incidents, for example the drought of the Panama Canal, which prompted us to perform operational adjustments to our shipping transits. This serves as a clear indication of the urgency of addressing the physical impacts of climate change. We are further impacted by complex transition risks and opportunities that unfold on the journey towards a green and just transition. Our approach to working with climate-related risks and opportunities aims to ensure a comprehensive risk management and strategic approach as a foundation for climate-resilient investments.
Key identified risks and mitigative actions
Two climate-related risks and opportunities stand out as the most significant to our business. These are:
1. Transition risk and opportunity: Failure to decarbonise our supply chain or generate business value from decarbonisation. The growing market/demand for our ECO Delivery products is a corresponding opportunity.
2. Physical risk: The physical impact of climate change on our assets, networks and global supply chains.
Transition risk and opportunity
Failure to decarbonise at a speed that meets the expectations of customers, regulators and investors is a strategic risk for Maersk. This year, we have successfully submitted and secured SBTi validation of our 2030 and 2040 targets supported by robust transition plans. Ensuring access to green fuels at scale is a risk which we are mitigating by building a robust portfolio of green fuels supply agreements. We continue to see a strategic opportunity to support our customers with ECO Delivery products, with 3% of our Ocean volume today transported on green fuels. However, ultimately the key to ensuring that Maersk derives business value from decarbonisation will be global regulations and incentives to level the playing field between green and black fuels, and we are stepping up our advocacy and industry engagement in support of such measures. See p. 25 for more details.
In 2023, we conducted a study to understand the potential ways in which Maersk might be exposed to, and mitigate, climate change-related legal liability risks. These include liabilities stemming from failure to mitigate our impact on climate change, potential errors or omissions in the disclosure of climate change related metrics and greenwashing allegations in connection with the marketing and sales of ECO Delivery products. We assess these risks to fall below the materiality threshold, and there is strong internal governance around our decarbonisation efforts, with enhanced transparency and data quality as key mitigating actions to such risks.
Physical risk
Our assets around the world are impacted by extreme weather events such as typhoons and hurricanes, wildfires, droughts and flooding. For example, in 2023, four properties in Durban were damaged as a consequence of extensive floods. Besides causing physical damage such events also cause disruption of the operation of the assets and furthermore have an impact on our ability to operate the network.
As a response to the physical risk to our assets, all our majorityowned terminals and large warehouse locations are part of a loss prevention programme entailing an assessment of climate change related exposure (e.g. flooding, storms etc). In 2023, we conducted 13 risk engineering reports for selected terminals (which we revisit every third year), and we performed an extended advisory for Port Elizabeth, as a follow up on the findings from the climate change risk assessment conducted in 2022.
Please see the TCFD index in our ESG Factbook here for more information on climate-related risks and opportunities. This year, we have expanded the index to incorporate more detailed disclosure for each recommendation outlined in the TCFD framework.

Image courtesy of The Panama Canal Authority. Climate-driven drought in 2023 caused restrictions for the number of vessels that could transit the Panama Canal, one of the world’s most important shipping lanes.
27 Strategy and governance Progress on ESG Data and assurance Introduction Sustainability Report 2023
Why it matters
We have a responsibility to minimise negative environmental impacts from our operations, in compliance with regulations, and to live up to the requirements and expectations of our customers and other key stakeholders.
Ambition
We see ourselves as active citizens of the Earth, operating on the oceans and increasingly on land. We are committed to doing as little harm as possible while actively participating in restoring ocean and land health, as well as protecting habitats and biodiversity where we operate. We aspire to be recognised by our stakeholders for our commitment and actions.
Targets
Within the category of Environment and ecosystems, we prioritise four key areas of action: 1) Biodiversity and ecosystem health, 2) Pollution and waste, 3) Efficient resource consumption, and 4) Responsible ship recycling (see p. 31). We set targets and measure our progress through KPIs and relevant metrics which we transparently share with our stakeholders. Please refer to each of the subject areas on the following pages to see current targets.
Environment and ecosystems
As a global company operating on land, air and sea, A.P. Moller – Maersk (Maersk) takes care to minimise negative impacts from our activities to the environment and ecosystems, and we also seek to contribute positively to ecosystem health where we can leverage our assets to do so. Our strategic efforts within this ESG category span a broad scope of topics, including biodiversity and ecosystem health, waste and pollution and resource use.
In 2023, Maersk progressed in identifying material environmental topics based on stakeholder engagement and mapping of our main impacts, risks and opportunities in a comprehensive double materiality assessment (see pp. 13-16).
Global biodiversity and nature standards and frameworks are rapidly developing, and the expectations of our customers, regulators, communities and investors are rising. In 2022, a historic international agreement was reached at the UN COP15 with the adoption of the Global Biodiversity Framework (GBF) and its vision to reverse biodiversity loss by 2030. This agreement, together with other key policy developments, global standards and benchmarks, are fundamental to framing our efforts.
We aim to apply consistent methods and indicators across Maersk operations and supply chain in alignment with emerging regulations and standards, including working more systematically to enhance biodiversity assessments in our green fuel projects. This will enable a roadmap that goes beyond upcoming compliance requirements and aligns with GBF ambitions.
Ecosystem health and biodiversity
As a first step in our roadmap, a more comprehensive identification of baselines for biodiversity impacts will progress in 2024, guided by globally recognised frameworks including the Science-based Targets for Nature and the Taskforce on Nature-related Financial Disclosures. The baseline work will build upon ongoing efforts already taking place across our business segments as outlined below.
Implementing a global ESIA standard
In 2023, we continued the roll-out of a global requirement for Environmental and Social Impact Assessment (ESIA) aligned with international standards, with initial focus across our terminals business and further expansion across our logistics businesses planned for 2024. The requirement covers all new projects screened and categorised based on their scale and potential for impacts. Projects in scope are required to have ESIAs undertaken in accordance with Maersk’s requirements, host country requirements and, where relevant, lender requirements such that the ESIAs are appropriate to the type and nature of projects, and are proportionate to the sensitivity, scale and significance of environmental and social impacts.
Green fuels
Maersk has set strong guidance based on life cycle assessment (LCA) for noncommodity fuels such as green methanol. See our website for more details. This includes an assessment of potential environmental and social impacts – for example Maersk only accepts waste and residues as feedstock and no firstgeneration crops such as corn, soy, rapeseed or palm oil. Maersk is also deepening its biodiversity focus with an ongoing LCA 2.0 project that looks to quantify biodiversity loss with a new metric, phylogenetic diversity loss, providing a more nuanced perspective for more informed decisions.
Supporting ocean and climate science
Maersk continues to leverage our vessels and ocean networks in support of ocean and climate science through long-standing partnerships with research organisations. In 2023, Maersk supported the Oceans X - Xploration ISAMO (read more) project, an exploration of solutions that could one day recreate the natural process of methane oxidation, which removes methane (a greenhouse gas) from the atmosphere. Maersk crew on vessels crossing the Atlantic collected and returned 280 samples for analysis in 2023, helping scientists understand why methane oxidation occurs at an increased rate over the sea and in areas with high iron content, as well as the impact of dust from the Sahara Desert over the Atlantic Ocean.
We collaborate with universities to ensure that we learn and improve and give back to the societies we are part of. One example of this in 2023 was when we invited students from the Technical University of Denmark to sail on the Munich Maersk to study opportunities for improving ESG performance. The students came up with many different ideas considering everything from ballast water handling to embracing crew wellbeing and change management.
28 Strategy and governance Progress on ESG Data and assurance Introduction Sustainability Report 2023
Targets - ecosystem health and biodiversity
• Avoid invasive species from ballast water
• Avoid or minimise operations in sensitive or protected areas in oceans and on land
• Support ocean health through scientific research collaborations and partnerships
• Avoid transport of illegal wildlife and endangered species
Preventing transport of invasive species
We are working diligently to minimise the risks of accidentally transporting invasive species between ecosystems via biofouling on our ships and ballast water. Maersk complies with international conventions to perform pest control and we are making good progress on ballast water treatment system installation on our vessels. In 2023, we completed installations on 93% of our fleet and are on track to achieve 100% by September 2024, the deadline set by the Ballast Water Management Convention for all shipowners to have treatment systems installed on their vessels.
Protecting ocean life and habitats
• Avoid spills from vessels and minimise pollution impacts across all operations
• Reduce air pollutants impacts (SOx, NOx and particulate matters)
• Avoid accidental loss of containers to the sea
• Ensure strong environmental management systems in place across all operations
Maersk takes care to avoid or minimise vessel operations in sensitive and protected marine areas. Reflecting our commitment to sustainable shipping practices, we have decided not to utilise Arctic routes for our vessels. This decision reflects our deep respect for the fragile Arctic environment and aligns with our long-term strategy for responsible and sustainable shipping. We recognise that while the Northern Sea Route may present a shorter passage, its environmental risks and challenges outweigh potential operational advantages.
To reduce the risk of whale strikes or disturbing breeding whales, Maersk follows all mandatory speed reduction schemes at sea and has also implemented voluntary schemes, reducing speed or avoiding transit in restricted zones. A key lever is better leveraging technology to automate decision making and provide more accurate route planning to protect wildlife. In 2023, Maersk started adding geofencing to StarConnect, our AI-powered fleet energy efficiency platform. Procedures in our Safety Management System help our crews know where whale protection zones and MARPOL areas exist, and to comply with required regulations.
Underwater Radiated Noise (URN) generated by commercial shipping and its impact on marine life is acknowledged as an increasing problem, with regulatory measures under discussion at the IMO, in the EU and Canada. In 2023, Maersk continued work to gain more insight into the underwater noise created by our vessels at different speeds and draughts and the potential for retrofits and new build designs, providing input for marine regulations. We also collected URN data from vessels and collaborated with suppliers and class rating organisations, with the ambition of establishing a baseline to measure the impact of improvements such as propeller blade noise frequency adjustments or noise dampening solutions.
Illegal wildlife and timber
Trade in endangered species, banned timber and illegal wildlife remains a lucrative illegal business run by sophisticated and well-organised international crime networks. Maersk has a firm policy against transporting illegal wildlife supporting the Convention of the International Trade of Endangered Species (read more), and a
prohibition of transporting protected shark and whale products (read more). We are determined to comply with all applicable regulations and will not accept any bookings of prohibited goods. The 2023 discovery of illegal timber in stolen Maersk containers in Gabon shows that we cannot fix these complex challenges on our own. We support a collaborative process engaging across stakeholders to combat the demand and supply of illegal wildlife and timber, e.g. through our engagement with United for Wildlife and the Environmental Investigation Agency (EIA).
Pollution and waste
Our commitments to reduce pollution and waste cover impacts to land, air and oceans. We focus on improving our management systems and methods for accounting and reporting on air emissions, waste and environmental incidents in line with the European Sustainability Reporting Standards.
Air pollution
Combustion of fuel in our operations results in air pollutants that have adverse impacts on human health and the environment. We hold ourselves accountable by measuring and reporting on air pollutants.
As part of our engagement with the Alliance for Clean Air, Maersk has contributed to the development of a new methodology for calculating air
Air pollutants Amount (1,000 tonnes) 2023 2022 Nitrogen oxides (NOx) 672 611 Sulphur oxides (SOx) 90 100 Non-methane volatile organic compound (NMVOCs) 16 27 Carbon monoxide (CO) 77 55 Particulate matter (PM10*) 49 51 Particulate matter (PM2.5) 38 43 Black carbon (BC) 3 3
Targets - waste and pollution
*By default, PM10 includes smaller particles (such as PM2.5 and Black Carbon).
29 Strategy and governance Progress on ESG Data and assurance Introduction Sustainability Report 2023
pollutants beyond SO x and NO x¹. Since 2022, we have used this methodology to expand our reporting on air pollutants. See performance in the table on p. 29. To date, our inventory accounts for pollutants associated with electricity generation, direct fuel combustion and industrial processes. We aim to expand our inventory in coming years to cover all the pollutants generated throughout our value chain, e.g. from third-party transportation, and to set targets to measure the impacts of our mitigation efforts.
Oil spills
In 2023, Maersk did not have any significant oil spills (>10 m3) to the environment.
Lost containers
We continue to drive a range of initiatives aimed at reducing the risk of containers lost at sea, including the evaluation of new vessel lashing force calculation tools, roll dampening technologies and parametric roll resonance. Maersk also validated new stack resonance calculations with real vessel data, and successfully tested a next generation tether lashing system for further development.
Unfortunately, we were not successful in eliminating container loss this year. In 2023, Maersk had two container loss incidents, both occurring in December: Six containers were lost at sea off the coast of Spain from the chartered vessel Toconao, operated by an external ship management company. Our own vessel, the Mayview Maersk, lost 46 containers during a storm in the North Sea off the coast of Denmark. None of the containers contained dangerous goods. While investigations in both cases are underway to determine the causes, we are taking responsibility to ensure cleanups and are in close dialogue with local authorities. We will make every effort to learn from the outcome of the investigations to avoid such incidents occurring again.
Improving waste management
Following the introduction of a Global Waste Management requirement in 2022, a Global Waste Management Review (covering Logistics and APM Terminals) is set to be initiated in 2024 with the aim of developing a baseline understanding of waste generation and management across our organisation. The results will be used to strengthen our waste
policies and enable target-setting. In support of the global requirement, we are developing training modules for environmental awareness across our operations.
In 2023, we generated a total amount of 533,000 tonnes of waste, a decrease from 553,000 tonnes in 2022. The decrease was mainly driven by an increased focus on waste reduction on vessels including environmental awareness raising of our crew.
Efficient resource consumption
Managing our resources effectively, and reducing the resource impacts from our operations, is of vital importance to Maersk and essential to delivering on our ESG agenda.
Materials and circularity
Maersk is engaged in several initiatives focusing on recycling and circular materials use. A prominent example relates to green steel connected with our ship recycling activities, see p. 31.
Another example is a mooring ropes recycling pilot initiated with C-Loop, a Wilhelmsen-backed venture. Mooring ropes are made of around 400 kg of plastic, need to be replaced every 3-5 years, and are currently disposed of in landfills or incinerated - emitting GHGs and other pollutants, including microplastics. Maersk and C-Loop are exploring several solutions to repurpose or recycle the retired ropes.

A pilot with 200 mooring ropes began in Singapore which will help scale up the initiative and validate a final solution including traceability and transparency for key factors such as life cycle GHG emissions.
Water
The increasing expansion of our landside activities and the rising sourcing of biofuels and e-fuels will increase water consumption in our operations and supply chain. For example, the creation of e-fuels begins with an electrolysis process that extracts hydrogen from water. Throughout 2023, we have continued to assess the increasing risk of water stress and enhanced our methodologies to ensure greater consistency and accuracy in our assessments.
Our consumption of freshwater in our direct operations increased by ~18% from 2.5 to 2.96 million m3 in 2023. This increase is mainly due to Maersk's acquisition of LF Logistics in 2022, which has significantly increased our landside footprint, and that has been included for the first time in our ESG performance data this year.
Similar to last year, we have been able to provide water stress context to Maersk’s total 2023 consumption, using Aqueduct 4.0 data from the World Resources Institute (WRI)². In 2023, around 45% of Maersk’s water consumption took place in high and extremely high water stress zones. Further, ~6% of the water consumption occurs in arid zones, which are classified by WRI to both have low water availability as well as low water withdrawal.
Total water consumption (1,000 m³)
Out of the total water consumption in 2023, 51% was consumed in high water stress zones, extremely high water stress zones and arid zones. The comparative percentage was 49% in 2022. See the full overview of context-based water consumption data in the ESG Factbook 2023.
Water consumption in water stress zones 1 The methodology is being developed by the Climate and Clean Air Coalition and the Stockholm Environment Institute and is available here 2 In 2023, we updated the water-context analysis to align with the latest iteration of WRI’s water risk framework, Aqueduct 4, which was released in August 2023. We have restated our 2022 water context-based data to align with the updated water stress filter and updated the water risk categories to align with the categories used in Aqueduct 4.0. 2023 2,957 2022 2,504
30 Strategy and governance Progress on ESG Data and assurance Introduction Sustainability Report 2023
Maersk and C-Loop initiating the mooring ropes recycling pilot in Singapore
Why it matters
As a responsible shipowner, Maersk ensures responsible recycling of our vessels at end of life. Across the global industry, there is an urgent need to create new responsible practicedriven, financially viable solutions for responsible recycling that can also meet the projected growth in demand for recycling capacity of large vessels. While leveraging these volumes, shipping can contribute towards decarbonisation of the global steel value chain. As a leader in the shipping industry, we have a responsibility to use our leverage to make a positive impact.
Ambition
Ensure safe and responsible ship recycling globally to the benefit of workers, environment, responsible yards and shipowners.
Targets
• Create global opportunities for responsible post-Panamax ship recycling
• Work with stakeholders to support compliance with the EU ship recycling regulation complianceand the Ship Recycling Transparency Initiative
• Continue wider Alang area development
• Position Maersk’s role in decarbonising the global steel value chain
Responsible ship recycling
A.P. Moller - Maersk (Maersk) sent three vessels for recycling in 2023. Two projects have been completed, and the third will be completed in the first quarter of 2024. The vessels were responsibly recycled according to Maersk’s Responsible Ship Recycling Standards without injury or environmental incident (more information is available here).
Maersk has responsibly recycled vessels at Alang, India, since 2016, and we continue our commitment and contribution to the broader development of the Alang area through health care initiatives.
In addition to ensuring that our vessels are recycled to our high standards, which go beyond the core requirements of the Hong Kong Convention (see our policy and position here), we aim to work as a catalyst for transformational change in the ship recycling industry, promoting adoption of responsible environmental and social practices as suppliers scale capacity.
Demand for ship recycling is expected to increase in the coming years, as some 4.7 million TEU in newbuilt capacity will be delivered while at the same time, IMO Carbon Intensity Indicator regulations are likely to push shipowners to scrap older vessels with inferior efficiency ratings. This demand increase could result in a shortfall of recycling capacity as soon as 2026.
A significant share of the anticipated recycling volume increase will come from the largest ‘post-Panamax’ vessels (i.e. too large to pass the Panama canal prior to its 2016 expansion), which few ship recycling yards are capable of handling today. The first of Maersk’s post-Panamax vessels will be due for recycling as early as next year and the pipeline will grow significantly over the next decades. In 2023, Maersk continued sending clear demand signals and enhanced our support for creating new opportunities via dialogue with several ecosystem stakeholders including ship building, repair and recycling yards.
Maersk also supports opportunities for ship recycling to contribute towards global steel decarbonisation efforts. In 2023, Maersk engaged with several steel value chain players to understand their appetite for securing steel from ship recycling and contributed to a publication by the Sustainable Shipping Initiative on Green Steel and Shipping, available here. Towards this effort, Maersk remains engaged with the SteelZero initiative (read more)
Maersk was recognised at Global Maritime India Summit for its Responsible Ship Recycling programme in Alang. We also received a second CSR Health Impact award from the Integrated Health and Wellbeing Council for funding a mobile health unit and awareness training for ship recycling workers.
Alang impact assessment: Highlights
We continue monitoring the impact of Maersk’s ship recycling activities in Alang, India. The data below covers the period 2017-2023 during which 16 vessels were responsibly recycled at six yards, engaging more than 1,100 workers. Please see the full assessment on our website.
Our engagement
3,250+ Man days of supervision
4,800+ Health and safety trainings
120+ Audits performed, including 45+ Lloyd’s Register audits, 40+ environmental tests and 35+ Maersk Sustainable Procurement audits.
The impact
Zero Fatalities
Zero Lost-time injuries
Zero Spills and hazardous materials incidents
Regulations remain a critical capacity enabler Maersk continues engaging with stakeholders for a conducive regulatory environment, addressing the key capacity challenge to meet increased demand for ship recycling. In Europe, an expected revision of the Waste Shipment Regulation will ensure that the EU Ship Recycling Regulation (SRR) will set the legal frames for ship recycling. The SRR is currently under review, and Maersk contributed to public consultations in 2022 and 2023.
Maersk supports empanelment of eligible yards located outside the EU into approved lists of Ship Recycling Facilities and also recommends a focus on circularity in the revised SRR - such as the certification of recycled steel as ’green steel’.
On a global level, Maersk welcomes the latest ratifications of the IMO’s Hong Kong Convention on Ship Recycling (HKC), which enters into force in 2025. Maersk sees the HKC as the primary international legislative instrument for regulating ship recycling, with some updates needed to reflect the latest industry developments.
31 Strategy and governance Progress on ESG Data and assurance Introduction Sustainability Report 2023
Social

A.P. Moller
strives to provide a safe and inspiring environment for our people to grow, develop and thrive as a diverse and global team. Our actions are guided by our Purpose and Core Values, international standards and the expectations of our key stakeholders.
Safety and security
Human capital
Diversity, equity and inclusion
Employee relations and labour rights
Human rights
- Maersk
32 Strategy and governance Progress on ESG Data and assurance Introduction Sustainability Report 2023
Our people
The people of A.P. Moller - Maersk (Maersk) are the foundation of our success and the ones who deliver on our customer promises and our Environmental, Social and Governance commitments.
Maersk’s approximately 100,000 people are also going through a transition, as we continued accelerating our journey in 2023 towards becoming the global integrator. This transition is creating demand for new roles and people profiles in Maersk, especially in expanding business areas such as Logistics & Services, where we are building the firepower needed to offer customers truly integrated logistics.
It also means having the right experts to drive our ambitious technology agenda as we digitise global supply chains. Lastly, it means that Maersk teams need to develop new skills, such as having impactful conversations with customers about our shared commitments to decarbonising supply chains and ensuring inclusive and responsible trade.
Whether our people work on a vessel or in a warehouse, terminal, or office, our goal is to ensure they are able to make meaningful contributions, learn and grow and have inspiring leaders. This holds true in strong market cycles and in challenging years such as 2023, where our people had to navigate difficult markets, change and uncertainty. Our Employees and Constant Care are both core values to Maersk and are fully aligned with our People strategy.
From an ESG perspective, Maersk’s material social impacts, both positive and negative, as well as risks and opportunities, are managed in our approach to Safety and security, Diversity, equity and inclusion, Human capital, Employee relations and labour rights, and Human rights.
The people who make up A.P. Moller - Maersk
100,000+ colleagues, 181 nationalities
28% of our workforce have frontline jobs
61% of our colleagues work from offices
11% of our people are seafarers
Colleagues providing hands-on customer support such as warehouse workers, truck drivers, terminal crane operators and aircraft maintenance teams.
Employees by region
The experts bringing our Terminals, Ocean and Logistics & Services offerings to life and innovating new solutions.
The dedicated crew who safely operate and maintain Maersk’s fleet of ~300 owned vessels.
Asia Pacific
Europe
Indian subcontinent, Middle East & Africa 32% 26% 20%
North America 12% Latin America 10%
20% Indian 12% Chinese 8% Filipinos 8% U.S. American 3% Brazilian 3% Danish 33 Strategy and governance Progress on ESG Data and assurance Introduction Sustainability Report 2023
Top 6 employee nationalities
Why it matters
Safety and security at work is a basic human right, and we have a duty of care to keep our employees and anyone operating on our sites safe. It is one of our Core Values and a responsibility for us as a company towards our employees, their families and communities.
Ambition
We ensure everyone gets home safe by preventing fatal and life-altering incidents.
Targets
2023 and 2024:
100% of Learning Teams completed following a High Potential Incident
2023:
Global Leadership (top 1,200 leaders) upskilled in Maersk’s safety and security principles
Safety and security
A.P. Moller - Maersk (Maersk) continues to work diligently to ensure that all people within our duty of care across all our operations have safe and secure working conditions. This commitment goes beyond compliance and legal requirements, and is core to our long-standing company values.
As part of our global integrator business strategy, Maersk has built a substantial global logistics operation and since 2018 we have gone from zero to hundreds of warehouses and added thousands of new logistics colleagues. The speed of this growth, as well as our expansion into new locations with diverse practices and safety cultures increases our risk profile. Additionally, land-based logistics presents a different risk picture than our Ocean operations, as it is often manual labour intensive, with a mix of Maersk employees, contractors and customer representatives working in close proximity in confined spaces with heavy equipment in complex and high-intensity traffic patterns. Therefore, Maersk is proactively addressing this challenge with a comprehensive Safety & Security Transformation Programme across our global transportation and fulfilment portfolios. As part of these efforts, we are strengthening our commitment with a new Safety & Resilience Assurance programme, assuring our global standards. This includes a one-time HSSE assessment initiated in 2023 of our sites . An ‘Essential 8’ global campaign, driving awareness and mitigation of eight critical hazards with potential to cause
The core elements of Maersk’s essential 8 campaign


severe or even fatal harm, was also rolled out in 348 warehouses and depots in 2023. The Essential 8 campaign directly supports and leads into a new campaign in 2024 designed to support global implementation of the Maersk HSSE Management Framework. This will bring further standardisation across our sites, which today are at very different Health, Safety, Security and Environment (HSSE) maturity levels. This endeavour will be gauged through an action plan employing distinct strategies catering for different maturity levels across our sites.
To ensure all our leaders are upskilled in safety and security at Maersk, a Lead with Care programme was launched upskilling leaders in Maersk’s safety and security principles, with a year-end completion of 98%.
Creating the right safety culture
Underlying our global standards and assurance efforts is a core approach to improving safety and staying ahead of constantly evolving risks. This is done by building a culture of trust, enabling all colleagues to contribute to safety reporting, raising concerns and even challenging how things are done to find safer ways of working. The goal is to create a physically and psychologically safe workplace with a strong reporting culture where all colleagues feel safe to speak up.
To ensure the right tools and competencies to support this cultural change, a training and upskilling programme was launched in 2023 to improve reporting culture. The goal is to sharpen our risk and incident reporting processes and systems across the regions, including a deep dive on data quality checks to ensure proper adoption and usage of data to allow proactive risk management. This was further driven through Maersk’s Global Safety Day 2023 campaign, ‘We make it safe to Speak Up.’


In 2023, we recorded an increase in our lost-time injury frequency rate from 0.93 to 1.11. We assess this to be partly driven by our focus on improving the reporting culture, where all colleagues feel safe to speak up, which led to more reported cases. We remain committed to keeping our employees and anyone operating on our sites safe through awareness raising, trainings and by implementing risk mitigating measures.
Progress indicator
Lost-time injury frequency rate 2022 0.93 2023 1.11 2019 1.16 2020 1.22 2021 0.93
34 Strategy and governance Progress on ESG Data and assurance Introduction Sustainability Report 2023
Fatalities in 2023
Despite our progress, the tragic loss of four people working for Maersk in 2023 underscores that we still have much work to do on understanding and staying ahead of our risks and building the right safety culture. We have a solemn obligation to learn from these incidents and take action to ensure they do not happen again.
Business segment Location Employed by
Logistics and Services Kenya Maersk
Logistics and Services China Third-party contractor
APM Terminals Nigeria Third-party contractor
Ocean Eugen Maersk (at sea) Maersk
In 2023, incident reporting increased by 25% in our Logistics business, showing an improving speak-up culture that enhances risk understanding to help reduce severe incidents. We conducted focused training towards Learning Teams across our portfolio, aiming to address all High Potential Incidents ending the year at 99% completion. This will continue in 2024 to continue strengthening and maturing our learning culture. A person/machine separation workshop programme looked to identify the critical risks at 60 sites with the highest risk of person/ machine collisions.
Work also continued in APM Terminals on creating a more mature and fit-for-purpose Safety & Resilience organisation, with strong focus on standardisation, building bottom-up global standards most relevant to Terminal operations, and mitigating and minimising critical risk. These ways of working will be embedded in a HSSE and Business Resilience management framework, to be delivered in 2024.
Deepening our security focus to stay ahead of increased risks
As a global company, Maersk’s reach and influence extends across geographical borders and diverse cultures. This exposes us to a
wide spectrum of security risks across markets, from terrorism and organised crime to supply chain disruptions and geopolitical instability. We are committed to protecting individuals, customers and operations from emerging threats and challenges by leveraging cutting-edge technology, strategic partnerships and a deep understanding of security dynamics.
We have identified five key security risks for our business, addressed through our Global Security programme – people (our duty of care, travel and expat security), cargo (theft, bribes, non-compliance), illicit cargo (contraband including drugs and illegal wildlife and timber), conflict (armed conflict, terrorism, geopolitical instability) and facilities (customer security compliance).
2023 saw continuity of geopolitical instability in many regions, negatively affecting commodity prices, inflation, unemployment, crime and drug trafficking. To mitigate the likelihood and impact of threats materialising and affecting our people, customers and business, we increased physical security in exposed sites, closed open terminals security gaps and strengthened access to incident data. We further upskilled more than 40 HSSE professionals in Transported Asset Protection Association (TAPA) requirements and signed up more than 140 HSSE professionals for a new security upskilling journey, to be completed in 2024. Lastly, we established a threat intelligence network between security, cyber, public affairs and marine security, increasing supply chain loss prevention capacity. This will come to life in 2024, with the aim of mitigating cargo losses and claims expenditure.
In 2023, we also strengthened our customer focus on Warehouse & Distribution facility security by aligning our minimum security requirements for facilities with those of TAPA Facility Security Requirements (TAPA-FSR) and Customs Trade Partnership Against Terrorism (CTPAT). Of Maersk’s 241 Warehouse & Distribution facilities, 21 are TAPA-FSR compliant and 58 are CTPAT compliant. We expect these to increase significantly in 2024 to support many new and future customers who require compliance with those standards.
For illicit cargo (contraband) we have developed a Global Contraband Strategy and implementation roadmap. We are not fighting contraband as that is not our mandate, but we collaborate with authorities, ensuring proportionate security is introduced to safeguard our people, operations and customers while remaining compliant with international and local legislation.
Red Sea shipping attacks
In November 2023, commercial vessels from several shipping lines were attacked in the Bab al-Mandab Strait en route to the Suez Canal as part of the escalating regional conflict. The Suez Canal is the gateway for trade between Asia and Europe, making the Red Sea and Gulf of Aden passage to Suez one of the world’s most critical shipping lanes. These attacks are extremely concerning and we continuously monitor this very dynamic situation, while prioritising the safety and security of our seagoing colleagues, our vessels and our customers’ cargo.
Two vessels, the Maersk Gibraltar and the Maersk Hangzhou, were attacked in December. There were no injuries among the crew, which was our primary concern. Following these attacks, in January 2024 Maersk decided that all vessels due to transit the Red Sea / Gulf of Aden will be diverted south around the Cape of Good Hope for the foreseeable future.
The deployment of the multinational security initiative, Operation Prosperity Guardian, to allow maritime commerce to pass through the Red Sea / Gulf of Aden, was welcome news for the entire industry and the flow of global trade. We continue to hope for a long-term sustainable solution in the near future.

Maersk’s front line workers are our real safety experts, and they are encouraged to speak up.
35 Strategy and governance Progress on ESG Data and assurance Introduction Sustainability Report 2023
To deliver on the ambitions of our Global Integrator business strategy, Maersk is dependent on highly engaged employees and significant new capabilities within, for example, technology, data analysis, leadership and sales and marketing. These are all areas with fierce global competition for talent.
A highly engaged workforce is also essential to delivering on the aspirations of our ESG strategy. Conversely, establishing ourselves as a leader in ESG can be a key enabler to attracting talent in these areas.
Why it matters Ambition
We aspire to create an engaging environment for all colleagues and to become a company where our employees can develop and have thriving careers.
Human capital
In 2023, we continued investing in our People strategy, making progress on initiatives for performance management, leadership capabilities, career building and upskilling our teams while ensuring the talent pipeline needed to bring our business strategy to life.
Progress and investment in these areas continued despite 2023’s sharp market downturn, which necessitated a workforce reduction by the end of 2023. In line with our values, A.P. Moller - Maersk (Maersk) worked to reduce the impact to our people as much as possible through natural attrition, local savings and organisational adjustments, and ensured that all people changes were done in a responsible manner, in full compliance with local laws and all applicable labour agreements.
We continuously evaluate our progress on attracting, engaging and retaining employees through two key metrics – our biannual global Employee Engagement Survey (EES) and our voluntary attrition rate.
90,568 colleagues shared their views in the EES carried out in the second half of 2023, resulting in a participation rate of 85% – down 2% vs. the first half year, but still significantly above the average participation for surveys of this kind (81%) by Gallup, Maersk’s main Employee Engagement Survey provider. The EES results on engagement indicate a setback from the positive trend seen in previous years, with the grand mean declining to the 60th percentile (in both halves of 2023). We still consider this a solid result, considering the challenging business environment and extent of organisational change during 2023. We have taken several follow-up actions, including conducting listening sessions, refining processes and policies as necessary and continuous investment in leadership and overall capabilities. Leaders are working with their teams to embed our business strategy and deliver on our customer promises by reinforcing how colleagues’ contributions help Maersk succeed. Praising good work, acknowledging contributions and demonstrating care will help build engagement further.
Our second important measure, the voluntary attrition rate, is 6.3%, which was a steady decrease from 7.9% in December 2022. This is ahead of the current external benchmark (PwC Saratoga) for the Transport & Logistics industry of 10.9%.
Building a performance culture
In 2023, we continued building on the Performance Management approach and culture launched in 2022, moving away from traditional ratings to continuous
performance conversations, with the goal of improving performance, alignment and career growth. The focus is on ensuring that colleagues have objectives and continuous conversations with their leaders about their performance and career. These conversations are intended to provide valuable insights that guide employees to their full potential and give a positive and psychologically safe experience throughout their Maersk journey.
2023 performance towards our strategic targets
41th 54th
59th
67th 60th percentile
In 2023, highlights of our progress on human capital priorities included:
• Helping talent advance through an array of solutions such as in-person training and on-line learning platforms, leadership development programmes, mentorship programmes and feedback and coaching sessions.
• Addressing diverse training needs in specific roles through our flagship academy series in areas such as Finance, Technology and People.
• Introducing our High Performing Teams journey, with the vision of helping every team reach their full potential through a standardised, global approach to team development. Over 140 teams started this journey; we anticipate 600 teams will finish phase one by the end of 2024.
• Launching three general content upskilling platforms, including deep-skilling university-affiliated programmes and technology-specific content. In 2023, 40,200 employees took advantage of these offerings.
• Engaging with external experts to establish a global ambition and approach to pay equity and pay transparency. This work will continue in 2024.
Progress indicator 2023 2019 2020 2021 2022
2025
36 Strategy and governance Progress on ESG Data and assurance Introduction Sustainability Report 2023
Employee Engagement Survey score in the 75th percentile of global norm Targets
Why it matters
It is a Core Value in Maersk and a basic responsibility not to discriminate against our employees. Discrimination bars people from living up to their full potential, creates inequality and less stable and prosperous societies. Moreover, we need diversity of thought to continue to improve and develop our business. Facilitating a culture where everyone feels comfortable and is treated fairly will help us gain access to a larger, more diverse pool of talent.
Ambition
We want to facilitate diversity of thought and create a more diverse, equitable and inclusive workplace at Maersk, where our employees feel able to bring their whole selves to work and contribute to their fullest.
Targets
Target for the Board of Directors: Three women on the Board of Directors, if the Board consists of less than twelve members, and four women, if the Board consists of twelve or more members.
2025
>40% women in management and leadership (job level 4+)
>30% diverse nationality (non-OECD) of executives (job levels 8 and 9)
Diversity, equity and inclusion
Diversity, equity and inclusion (DE&I) is core to the people strategy of A.P. Moller - Maersk (Maersk), and solid progress was made in a number of supportive initiatives in 2023. However there are clear signs that more work needs to be done towards the targets we have set in this area.
The year began with a restructuring of Maersk’s Executive Leadership Team, which role modelled DE&I from the top with the new 16 member body including 11 nationalities and 6 women. During 2023, Maersk’s DE&I focus was on activating visible, inclusive leadership from the top down to all levels of management. Inclusive leadership at scale is critical to having balanced and resilient teams that can meet new customer demands and challenging markets.
Key 2023 DE&I actions include:
• Updating our DE&I strategy to put DE&I at the core of Maersk’s People strategy and providing the red thread to align all our DE&I efforts and drive real, long-term results with enhanced metrics and leader accountability. This was supported with the creation of a Chief DEI Officer role reporting directly to the Chief People Officer.
• Strengthening our DE&I Performance Management and data-driven decisionmaking with the launch of a new DE&I Dashboard for our People Business Partners that supports leaders in driving People actions.
• Shifting from diversity targets to a greater focus on inclusion as a driver of behavioural change. This focuses on developing leadership inclusion capabilities by shifting their mindsets from passive allies to active advocates and driving accountability. The 2023 roll-out focused on Maersk top 160+ leaders. In 2024 inclusion training will be required for all people leaders.
• Creation of three psychological safety learning journeys, which have been used by more than 1200 employees and leaders during the year. Modules on Psychological Safety, Embracing Vulnerability and Team Learning and Innovation were introduced to all levels of the organisation in support of psychological safety and settling of teams during 2023’s many organisational changes.
• Strengthening DE&I criteria in new Talent Attraction and Acquisition approaches, including hiring criteria (e.g. inclusive job advertisements), prescreening (diverse shortlist), interviewing (behaviour-based Interviews) and candidate evaluation (bias checks).
Strengthening our support for colleagues with diverse abilities

In 2023, Maersk broadened its scope of inclusiveness with a new Diverse Abilities policy designed to eliminate barriers and ensure equal opportunities so people with diverse abilities can fully participate in all aspects of employment and a series of training programmes on neurodiversity in the workplace. At Maersk, we intentionally call disabilities ‘diverse abilities’ to focus on our colleagues’ skills and capabilities rather than their perceived limitations.
Click here to see Leigh Ramsay, Senior Diversity, Equity & Inclusion Partner at Maersk, share her personal journey and the importance of making all employees feel at home in the workplace.
Progress indicator
37 Strategy and governance Progress on ESG Data and assurance Introduction Sustainability Report 2023
Regulatory and market expectations increasing 2023 also saw DE&I developments on the regulation and customer side including new legislation from the EU and Danish authorities requiring gender targets and disclosure for Board, Executive and non-executive leadership in the coming years.
The EU CSRD will require Maersk to equip wider teams to report in holistic, material ways on a wide range of DE&I topics such as gender pay gap percentage, salary equity ratio, percentage of diverse ability workers, details of disability and maternity payments and total number of discrimination incidents – among traditional metrics.
To prepare for this new regulatory and reporting landscape, Maersk is establishing internal collaborations and external advisory partnerships. This is work in progress to be concluded in 2024.
Room for improvement remains 2023 saw progress on many fronts, and there was improvement in both our representation for gender diversity (Women in Management & Leadership) and target nationality even as markets conditions significantly toughened. Following the new organisation structure announced in the first half of 2023, we put the priority of settling into a good operating rhythm at the forefront. This, coupled with the decision to strengthen internal controls, impacted external hiring and advancement, which in turn slowed our representation target progress. We expect 2024 will continue to present market challenges that could impact our growth journey and hence the opportunity to attract new and diverse talent.
Maersk is addressing this challenge with a new Diversity in Teams metric for 2024, which looks at gender and nationality in our leadership pipeline. Maersk’s People strategy supports leaders to build a visible commitment to inclusion that will improve our DE&I performance and help narrow gaps until the underlying market conditions behind the current stagnation improve.
We also acknowledge that targets alone cannot create balanced workforce leadership. In 2023, an updated ‘Women in Leadership’ programme was relaunched, with the goal of accelerating careers for women who are in the talent pool for leadership positions at specific job levels. Rather than addressing individual situations, the programme takes a holistic look which includes not only rising talent, but also their managers and sponsors.

Representation of women on the A.P. Moller - Maersk A/S Board of Directors (2023)
3 women out of 9
2023 performance towards our strategic targets
>40% women in management and leadership (job level 4+)
Women in management and leadership continued to make steady progress despite toughening market conditions impacting company growth.
>30% diverse nationality (non-OECD) of executives
levels 8 and
Through focus and intent, we have been able to increase our target nationality at the leadership level.
(job
2023 20% 2025 (Target) 30% 2022 2019 2020 2020 31% 16% 2021 2021 31% 2019 15% 12% 2022 13% 33% 2025 (Target) 40% 2023 35% 33%
9)
38 Strategy and governance Progress on ESG Data and assurance Introduction Sustainability Report 2023
Why it matters
The way we treat our employees and their representatives is fundamental to responsible business practices. This begins with ensuring respect for internationally recognised labour rights in all our workplaces.
Ambition
Employee relations and labour rights are an essential part of Maersk’s social commitments. We offer decent, fair and equitable working conditions for all our people. We identify risks for employees and third-party labour, and implement mitigating and preventive actions to ensure that our operations and growth consider our social responsibilities.
Targets
2023 and 2024
100% of employees (in scope) trained in employee relations and labour rights
Employee relations and labour rights
A positive working environment begins with respect for the fundamental rights of our employees and colleagues. In A.P. Moller - Maersk (Maersk), these rights are described in the Commit Rule on Global Employee Relations, which is part of the broader Maersk COMMIT Governance Framework. These rights set expectations around compliance practices and employee behaviours and ensure labour rights are respected, protecting our reputation and minimising the possibility of fines and loss of business from non-compliance.
We rely on a large number of third-party contracted labour who are not directly employed by Maersk, but work on our premises with us and for us in our customers’ value chain. We take responsibility to ensure that these extended colleagues are treated responsibly, in line with international standards and our policies.
Starting with our Supplier Code of Conduct as a base, in 2023 we clarified our labour expectations for suppliers with new global third-party labour standards, including child labour guidelines. Trainings around these new global standards were piloted during the year, with the first implementations in APM Terminals and Maersk’s Delivery organisation.
A core process in our labour rights due diligence is a company-wide assessment done every two-three years under the oversight of the Maersk Global Labour Rights Council. This will be rolled out early in 2024, based on the new standards and guidelines.
In 2023, Maersk achieved 90% of our employee relations and labour rights training target of 100%. Recognising that reaching all employee groups, especially through workforce changes, is a continued challenge, we will keep the rigour of a 100% target on an annual basis, with a particular focus on reaching frontline employees and new hires.
Additional key actions in 2023 include:
• Consistent promotion of freedom of association, non-association and the right to collective bargaining across all global operations through engagement with appropriate employee representative bodies (trade unions, works councils and personnel representative forums).
• Creating a new Labour Relations function within the newly created Delivery organisation to build capabilities and embed employee relations/labour rights across our growing inland operations.
• Further integration of Employee Relations into APM Terminals daily operations through face-to-face training for frontline leaders. 779 leaders across 21 terminals have been trained since 2018.
• Incorporation of an Employee Relations checklist in the change management approach applied by the modernisation and automation team of APM Terminals
• A continued focus and refined approach to equal pay for equal work. We aim to ensure that any differences in pay are due solely to objective factors such as experience, skills, knowledge and performance.

Progress indicator
39 Strategy and governance Progress on ESG Data and assurance Introduction Sustainability Report 2023
Why it matters
Many aspects of our business touch on human rights, including our employees' working conditions, health and safety, how our vessels are recycled, how we use digital data and technologies, and our suppliers' business practices. Our conduct within our own business and through our business relationships can therefore have a significant impact on society, both positive and negative. Further, increasing regulation and growing expectations from our stakeholders confirm that human rights is a material topic for Maersk.
Ambition
Continue aligning our business practices with the UN Guiding Principles, and ensure that human rights considerations are integrated into our due diligence processes and ESG governance mechanisms.
Targets
• Capacity building on human rights, including targeted trainings for human rights issue owners
• Continued integration of human rights into key due diligence processes
Human rights
Recognising the potential for global trade and supply chains to make positive contributions to society and socio-economic development, A.P. Moller – Maersk (Maersk) is committed to respecting human rights in its own operations and entire value chain. Maersk’s approach is founded in our Purpose and Values and based on the UN Guiding Principles on Business and Human Rights (UNGPs), which serve as a north star in navigating the often-complex impacts of global trade on people. The transport and logistics industry faces heightened expectations to act responsibly from key stakeholders including regulators, investors and customers. To continue navigating increased expectations and fulfil our commitment to respect human rights, we support regulatory measures that strengthen requirements for responsible business conduct and contribute to levelling the playing field globally.
Maturing our due diligence processes and building capacity
In 2023, we continued to mature key internal due diligence processes, in line with our identified need to strengthen processes and prepare for upcoming regulatory requirements such as the EU Corporate Sustainability Due Diligence Directive (CSDDD). We are also addressing emerging risks from new business activities, such as the development of green fuel supply chains. In 2023, Maersk developed a green fuel sourcing due diligence framework. As part of this process we assess high-risk suppliers’ abilities to identify and manage potential impacts on people and the environment, and aim to use our influence to mitigate potential impacts.
Responsibility for making decisions with respect for human rights lies with all Maersk leaders, so building capacity is critical to our commitment. In 2023, we continued human rights training with key functions and human rights issue owners, to support and equip leaders with the knowledge and tools to handle dilemmas in a manner sensitive to potential human rights impacts.
Responsible business in high-risk areas
As an example of a heightened human rights due diligence, Maersk conducted a human rights due diligence assessment in Myanmar during the year, with the conclusion that it is possible for Maersk to responsibly operate there with the support of robust management systems. Maersk in Myanmar positively impacts an estimated 12,500 people in terms of employment, standard setting and economic contributions and services to the market and partners. We will continue our engagement with all stakeholders to support responsible business practices in the country. Work on improvement areas identified in the assessment will continue in 2024.
Addressing our salient human rights issues
We continue to work on addressing our prioritised salient human rights issues, identified in our 2021 corporate-level human rights assessment. For more information on how we have progressed on these issues during the year, please see the chapters as referenced below.
Health and safety in the supply chain
More information:
Safety and security (pp. 34-35)
Access to remedy
More information: Maersk whistleblower (p. 12)
Violence and harassment at work
More information: DEI (pp. 37-38)
Impacts of climate change and decarbonisation (just transition)
More information: Climate change (p. 25)
Working conditions in the supply chain
More information:
Employee relations and Labour Rights (p. 39)
Sustainable Procurement (pp. 43-44)
Maersk continued its follow up on a 2021 complaint through the Danish Mediation and Complaints-Handling Institution for Responsible Business Conduct (NCP Denmark) around the activities of a joint venture in Cameroon. Maersk disagrees with the allegations and continues its ongoing engagement with NCP Denmark.
Progress indicator
40 Strategy and governance Progress on ESG Data and assurance Introduction Sustainability Report 2023
Governance
At A.P. Moller - Maersk, high standards of responsible business practices are foundational for the services we deliver to customers and the value we create for the communities where we operate. Learn more about how we earn the trust of our customers and partners every day, and act as a responsible member of the global communities we call home.

Business ethics
Sustainable procurement
Data ethics and Responsible tax
Citizenship
41
and governance Progress on ESG Data and assurance Introduction Sustainability Report 2023
Strategy
Why it matters
Corruption is illegal and a key compliance risk. It undermines social and economic development, destabilises the business environment and adds to the cost of doing business and participating in global trade. It is against our values and affects external confidence as well as company morale. Non-compliance with bribery and corruption law may lead to legal and reputational risks, extra costs, inefficiencies in our business, fines, imprisonment and debarment from markets.
Ambition
With the aspiration to contribute to eliminating corruption in the industries where we are active, through both multistakeholder collaboration and actions in our own operations, our ambition is to stay best in class, meeting the highest international standards in particular when operating in jurisdictions with high exposure to corruption, sanctions, export controls and human rights abuses.
Targets
2023 and 2024:
100% of employees (in scope) trained in the Maersk Code of Conduct
Ongoing:
Regular compliance and business ethics risk assessments covering 100% of our operational entities (conducted every second year), and continued implementation and revision of risk mitigation measures.
Business ethics
By 2025, A.P. Moller - Maersk (Maersk) aims to have in place a best-in-class compliance programme that helps us promote sustainable trade and a more equal society by preventing, detecting and correcting behaviour that is not aligned with our Purpose, Core Values and internal governance framework (Commit Rules) on business ethics (see p. 11 for details). We operate in a dynamic environment and will continue enhancing our compliance programme to adapt to evolving regulatory requirements, market conditions and geopolitical events.
Maersk bases and measures our performance to these high standards against the UN Global Compact principles, US FCPA guidance, ISO 37001 standards and the OECD Guidelines on Responsible Business Conduct, and our programme is audited regularly by A.P. Moller - Maersk’s Group Internal Audit.
As in many other industries, corruption remains a global problem in shipping and logistics and no country is immune. Facilitation payments when interacting with port and border control authorities are one of the primary corruption risks in our ocean and logistics businesses.
Through a dedicated team of 50+ Compliance experts and our Business Compliance Ambassador (BCA) programme, running since 2017, we are able to monitor and manage these risks across Maersk. These experts, represented in all our regional offices and some high-risk locations, screen all customers, vendors, banks and transactions. Maersk is also an active member of the Maritime Anti-Corruption Network, a network working to eliminate corruption in the maritime and port industries.
Geopolitical instability has made trade more complex, where sanctions and export controls restrict or ban business with certain countries, individuals, companies, and even restrict or ban the movement of goods and services. As a Danish-headquartered company and global leader in ocean transport and logistics services, Maersk complies with all applicable sanctions and export controls laws. We continuously monitor the geopolitical situation and have strengthened our processes and controls to screen all our transactions for sanctioned parties and commodities either sanctioned or controlled, in particular for highly sanctioned or high-risk countries. Trade with the highly sanctioned countries is becoming increasingly difficult, and in November, as an example, Maersk ceased business in Syria (save for humanitarian aid and relief).
In 2023, highlights of our progress on business ethics priorities included:
• Roll-out of our third Global Risk Assessment to all active entities to monitor compliance risks rates, 96% completed the assessment. The key takeaway was increased and continued compliance engagement.
• Roll-out of a new Code of Conduct introduction and updated annual refresher e-learning course. Code of Conduct training is a strategic KPI. This year, 92% of Maersk employees completed the mandatory Code of Conduct training against our target of 100%. Challenges in reaching all employee groups remain, particularly due to organisational changes, but we are working to close this gap with a goal of 100% completion in 2024.
• Maersk completed over 31 compliance spot checks on selected entities and processes together with the use of internal controls covering critical risks within the areas of anti-corruption, sanctions compliance, competition law and data privacy.
• Launch of a new internal, user-friendly myCompliance tool to digitalise Maersk’s compliance approvals, operations and share knowledge. The portal will also enable and further increase data insights and monitoring.

Progress indicator
42 Strategy and governance Progress on ESG Data and assurance Introduction Sustainability Report 2023
Why it matters
Our operations and purchasing decisions have an impact on social, environmental and economic conditions in our industry, global supply chains, and communities. We rely on more than 41,000 suppliers, including approximately 5,100 high-risk suppliers, in our global supply chains. Addressing sustainability risks in our supply chain strengthens stakeholders’ trust in our brand and prepares us for regulation of due diligence in supply chains.
Ambition
To live up to our commitment to procure sustainably, we will integrate ESG as a strategic topic across supplier life cycle stages and establish end-to-end visibility on supplier performance through collaboration and engagement, with an ultimate goal of co-development and innovation towards sustainable outcomes.
Targets
2024:
100% of suppliers (in scope) committed to the Supplier Code of Conduct
>85% of strategic/high-risk suppliers undergoing ESG assessments
>80% of high-risk category suppliers with Improvement Plan successfully closed
100% procurement staff trained in Sustainable Procurement
Sustainable procurement
In 2023, A.P. Moller - Maersk (Maersk) continued building on the Sustainable Procurement foundation established in 2022, with a focus on driving execution and integrating ESG deeper into our procurement activities. This included scaling up supplier engagement, embedding ESG requirements into our procure-to-pay process, and preparing for increased regulatory due diligence requirements. Maersk conducts business with more than 41,000 suppliers across 150 countries, including approximately 5,100 in high-risk categories such as outsourced labour, trucking, warehousing, shipyards and terminals.
Maersk takes a broad, structured approach to engaging with and supporting local suppliers to ensure they understand our global standards and our ESG assessment process.
Third-party contractors’ compliance with safety and security standards
As our strategy drives significant logistics growth, we’re increasingly dependent on outsourced services and suppliers to deliver customer solutions. It is crucial that our third-party contractors maintain the same safety and security standards as our own facilities, and that we are aware of, and comply with, essential customer requirements. Maersk’s safety and security initiative is designed to achieve this by making sure that supplier-facing safety and security standards are appropriate and in line with our internal standards. This includes the development of categoryspecific assessment tools supported by platforms and finding ways to enhance supplier due diligence and assurance to meet Maersk needs.
Working with our suppliers on scope 3 emissions
As part of our decarbonisation commitments, Maersk is addressing scope 3 emissions within our supply chain. By utilising a dual approach of activity-based data and spend data, we will map our scope 3 emissions in detail and gain a comprehensive understanding of the impact of our suppliers’ greenhouse gas emissions on Maersk’s environmental performance, while aligning these efforts with our science-based targets (SBTs).
To guide these endeavours, we will employ hotspot analysis and develop strategic roadmaps, enabling us to prioritise and focus on achieving our SBTs. Recognizing specific categories within scope 3 emissions that will warrant
attention, we will strategically shift from spend data to activity-based data where relevant. This transition will allow us to create key performance indicators that accurately reflect the impact of our initiatives. Following the development of future strategic roadmaps, our objective will be to formulate comprehensive strategies for implementing and optimising green logistics practices within the supply chain. Additionally, we will actively engage in collaborative initiatives with our suppliers to foster the adoption of sustainable practices and products throughout the supply chain.
Our commitment will extend to strengthening our suppliers’ capabilities, providing education on sustainable procurement practices, and emphasising their pivotal role in reducing carbon emissions.

Progress indicator
Ensuring that our many third-party suppliers follow Maersk’s environmental and social standards is a critical focus in Maersk’s procurement activities.
43 Strategy and governance Progress on ESG Data and assurance Introduction Sustainability Report 2023
1
Putting people front and centre
As a core ESG strategy focus, diversity, equity and inclusion is also a key part of our Sustainable Procurement activities. In 2023, Maersk connected with several of our top key client partners to collaborate around supplier diversity goals. This included two pilot surveys where we captured useful insights from 112 suppliers, with high participation engagement. Maersk also completed a Supplier Diversity Pilot for North America, with the goal of seeking a proof of concept to collect Supplier Diversity & Inclusion statistics through a structured, efficient process. Work based on the survey results and proof of concept will continue in 2024.
One of Maersk’s core procurement activities and risk areas is thirdparty labour (see also Employee relations and labour rights on p. 39). In 2023, Maersk introduced new Global Standards for Third-Party Labour. APM Terminals is implementing these new standards in all our terminals, across all business segments with cross-functional teams including Procurement, Employee Relations and external human/ labour rights consultants. The learnings from these pilots will be used to develop trainings for the wider Maersk organisation in 2024.
Driving excellence through cross-industry partnerships
In 2023, the Strategic Extended Partnership Agreement (SEPA) consortium began collaborating around the ESG topics that were most significant for partner companies. This included a thorough review of the supplier codes of conduct for Maersk, Carlsberg, Danske Bank and FrieslandCampina during 2023. An addendum, now integrated into the foundational agreement with SEPA partners, facilitates the mutual acceptance of each other’s supplier codes of conduct. This enhances Maersk’s efforts in supplier relationship management and knowledge exchange on ESG reporting related to suppliers.
Additional specific actions in 2023 include:
• Roll-out of a supplier ESG risk assessment tool, developed in 2023, for buyers and suppliers across all Maersk brands, to provide a single overview to monitor and evaluate supplier ESG performance. The ESG Data Management Module is being reviewed in line with regulatory requirements to make it fit for purpose for the future.
• Implementation of a Green Travel Policy that shifted from prioritising lowest cost to encouraging sustainable alternatives
such as climate compensated tickets. Maersk extended its Sustainable Aviation Fuel (SAF) contract with Air France KLM, reducing scope 3 emissions footprint. 6% of Maersk corporate air travel is now low emissions.
• In 2023, Maersk began embedding the Technology Sustainability Index (TSi) in its technology tenders. TSi is a free, open-source concept that provides sustainability maturity ratings based on questions on a variety of ESG topics. It allows intra-industry collaboration between global leaders, where buyers and sellers can work together on the broader sustainability agenda.
• All new Maersk offices are evaluated using the Carbon Risk Real Estate Monitor (CRREM) Sustainability Matrix, with a focus on specifying and sourcing green-certified buildings.
• Roll-out of an online Sustainable Procurement course to all global procurement colleagues, with a target of 100% completion by 2024. Year-end 2023 status is 91% completion.

2023 performance towards our strategic targets
100% of suppliers (in scope) committed to the Suppliers Code of Conduct by 2024
>85% of strategic suppliers undergoing ESG assessment by 2024
>80% of high-risk category suppliers with Improvement Plan successfully closed by 2024¹
100% procurement staff trained in Sustainable
In 2023, we saw a decrease in our strategic KPIs on supplier Code of Conduct and suplier ESG assessments. This is partly driven by a restructuring of our procurement function causing changes to our supplier management set-up. To address this our focus has been on our digital transformation and capability building within the new teams through faster adoption of the new sustainable procurement training.
2024 (Target) 2023 2022 95% 96% 100%
2024 (Target) 2023 2022 71% 77% 85%
2024 (Target) 2023 2022 79% 69% 80%
Procurement 2024 (Target) 2023 Training not rolled out in 2022 2022 91% 100%
Minimum standards for third party labour will be integrated into procurement in 2024.
categories
Trucking and
warehousing services, facility management, outsourced labour, terminals, shipbuilding yards and drydocks, security offshore, promotional items, customs agents, security onshore, construction, chemicals and paints, equipment, maintenance and repair, container manufacturers and manning (seafarers). 44 Strategy and governance Progress on ESG Data and assurance Introduction Sustainability Report 2023
Our 15 high-risk
are:
Intermodal,
Data ethics
Why it matters
Responsibly managing data from stakeholders, including customers, is a critical issue in today’s societies where the risks of undue influence and abuse of data are growing.
Ambition
We demonstrate leadership in our ability to ethically manage and use data, with customers trusting that we use their data appropriately, and do not abuse or lose their trust. We prepare Maersk for a future with high ethical standards for data as a differentiator for our customers and support to our employees.
Targets
2023 and 2024
100% of employees (in scope) trained on data ethics
Responsible tax
Why it matters
Well-functioning tax systems, both locally and internationally, help finance education, healthcare, transport, infrastructure and other public services that support the sustainable development of societies, businesses and trade. We recognise the need for companies to support the local economies in which they do business.
Ambition
Maersk acts responsibly and with integrity in all tax matters, ensuring full compliance in every jurisdiction across the world. We work closely with tax authorities to ensure that we fully disclose relevant information and pay the correct amount of taxes while balancing our obligations towards our shareholders.
Targets
2023 and 2024
Full public country-by-country tax reporting
Ongoing
Ensure full compliance with tax regulations in all countries where we operate and continue to engage in dialogue with stakeholders on tax matters.
Data ethics Responsible tax
The digitalisation of global supply chains is elevating the importance of data ethics, as our customers rely on partners with the highest ethical standards. Our aim is that A.P. Moller - Maersk (Maersk) can be trusted to protect and respect the data of our customers, business partners and employees.
By end of 2023, over 91% of Maersk employees have completed our mandatory data ethics e-learning against a target of 100%. While challenges in reaching all employee groups may remain, we maintain the rigour of a 100% target also for 2024, with a particular focus on ensuring all new employees are trained.
Maersk’s data ethics strategy balances opportunity and risks as we develop innovative products and services to our customers while implementing proper compliance measures and ethics, and leverage technology and artificial intelligence (AI) for our decarbonisation ambitions as well. See box below.
The rapid development in AI is a defining moment where we are guided by our data ethics principles: Respect, Security, Transparency and Innovation. We build on our existing governance foundation by automating preventive controls, institutionally anchoring risk management and exploring governance technologies in preparation of AI regulation. Our governance is already applied in generative AI tools supporting Sales, Software Engineering and our People function.
Maersk conducts and manages our tax affairs in accordance with our Tax Principles, which are available online here. These principles are updated and approved annually by the Board of Directors and are closely aligned with Maersk’s Purpose, Core Values, Code of Conduct and business strategy. We strive to be a compliant and accountable taxpayer in all countries where we operate, contributing to those countries’ welfare. We manage our tax risk and reputation through responsible and transparent tax practices.
AI in action
StarConnect is Maersk’s stateof-the-art AI-powered fleet energy efficiency platform that processes 2.5 billion data points annually from ~700 vessels. This advanced system uses machine learning to forecast and optimise fuel consumption and safety, taking into account environmental conditions. In 2023, StarConnect enabled Maersk to save over 101K metric tonnes of fuel and 314 metric tonnes of CO₂ emissions.
*This is not the actual software
Maersk operates globally and generates profits across different business segments. To ensure we are prepared for the global development in tax legislation towards increased compliance reporting and continue operating in accordance with our Tax Principles, we have increased our focus on following and engaging in international tax developments via relevant business forums and organisations. We are also allocating significant resources to secure our continuing global tax compliance and governance by automating and digitalising work where feasible, ensuring a continued robust and efficient in-house tax function. Progress indicator


Since 2020, we have publicly disclosed the tax paid by Maersk in key countries in our annual Tax Report which covers approximately 92% of all corporate taxes, in accordance with OECD Country by Country Reporting (CbCR) principles. To increase transparency even further, in 2023 we are disclosing our full CbCR for all countries where we operate. For more information, see the 2023 Tax Report.
45 Strategy and governance Progress on ESG Data and assurance Introduction Sustainability Report 2023
Why it matters
Maersk takes active responsibility to support the societies where we operate by partnering with communities and non-profits on social and environmental causes. It is grounded in our Core Values and also an expressed expectation to us from our key stakeholders. We prioritise six causes: Humanitarian relief, empowering for trade, protecting the natural environment and oceans, education, safety and health.
Ambition
We engage in global partnerships and support local communities and initiatives in areas where we can leverage Maersk assets and expertise to make an impact aligned with Maersk’s business and sustainability goals. Donations and social investments are guided by corporate guidelines.
Targets
• Continue engagement and key partnerships including the Logistics Emergency Teams
• Leverage partnership platforms to promote employee engagement
• Improve documentation and disclosure of donations activities and impact
Citizenship
2023 was sadly marked by several major natural disasters and armed conflicts, creating unprecedented levels of humanitarian crises. A.P. Moller - Maersk (Maersk) worked together with governments, UN agencies and other humanitarian organisations to support emergency response efforts, both as a member of the Logistics Emergency Team and bilaterally. Maersk also contributed USD 2.5 million in aid around the world, including financial and in-kind support.
As an example, 400+ containers were donated to support victims of the devastating earthquakes in Türkiye, including retrofitted containers to accommodate displaced families. We also deployed a Maersk Air Cargo 767 to airlift 20 mobile warehousing units to act as last-mile distribution centres. As part of our efforts to assist during the stabilization phase following the earthquake in Morocco, Maersk has donated 40 containers for the construction of temporary schools. In Ukraine, where energy infrastructure has been severely damaged, Maersk donated one million LED light bulbs. The goal was to help reduce Ukraine’s electricity usage by replacing outdated, inefficient light bulbs.
In addition to critical humanitarian aid, during 2023 Maersk continued supporting a number of environmental and social initiatives in the communities it calls home, engaging its own employees and partners.
Maersk has established a central donation facility through the Danish Red Cross to make it easier for employees to contribute financially to relief efforts and to enhance transparency and due diligence. In 2023, Maersk employees donated over USD 79,000 through this facility to support earthquake victims in Türkiye and Syria, which the company matched.
As part of the company’s annual Go Green week, coinciding with the World Ocean and Environment Days, employees in every region and 35+ countries participated in local cleanup activities (e.g., beaches, streets, natural reserves etc.) and reforestation activities (e.g., tree plantings). Corporate and local activities during the week engaged colleagues on environmental topics to raise awareness while connecting with families of our colleagues, communities and local stakeholders such as NGOs, schools and customers.
2023 was the milestone 5th year anniversary of Maersk’s support of The Ocean Cleanup, providing offshore and logistics support for cleanup systems to rid the world’s oceans and major rivers of plastic pollution. 2023 included a major upgrade
from The Ocean Cleanup’s current System 002, which helped remove 282,787 kg of trash covering an area of 8,352 km², to a new System 003 with three times the capacity. Towards the end of 2023, Maersk Supply Service (MSS), A.P. Moller - Maersk and The Ocean Cleanup agreed to extend their collaboration through 2024 to complete the validation of the new system. At the same time, the A.P. Moller Foundation will provide a one-time grant to The Ocean Cleanup.
Empowering trade: advancing women entrepreneurs globally

Inclusive global trade is a key driver of economic growth and job creation, particularly for small and medium-sized enterprises - including those owned or led by women. Since 2018, Maersk has partnered with ITC SheTrades to support women entrepreneurs, equipping them with the tools and skills to thrive in global markets and to overcome barriers.
Our partnership focuses on delivering technical and market intelligence, effective advocacy and offering innovative services and solutions. Over the last five years, we have enabled over 3,775 beneficiaries to receive technical expertise through training and other solutions in over 88 countries. One of our beneficiaries is Olasumbo Adeleke, a shea butter processor and supporter of smallholder farmers in rural communities in Nigeria. Learn more about her journey as an entrepreneur and other beneficiaries in our web series here
46 Strategy and governance Progress on ESG Data and assurance Introduction Sustainability Report 2023
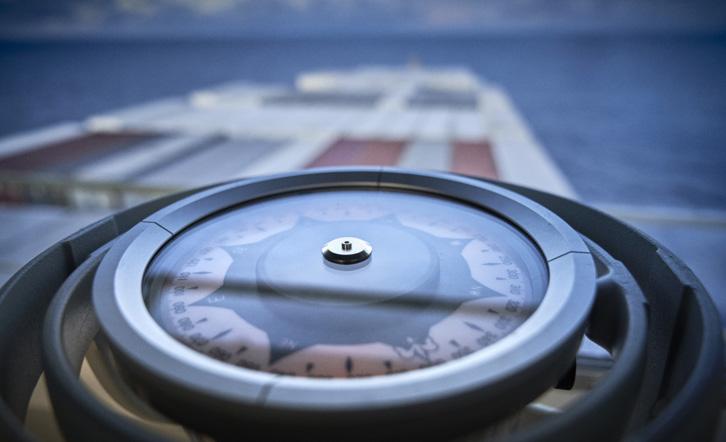
Data and assurance
47 Strategy and governance Progress on ESG Data and assurance Introduction Sustainability Report 2023
ESG performance data
Climate and environmental performance
Energy consumption
1.1 Fossil energy consumption
1.1 Climate change Fuel oils
1.1 Climate change
1.1 Climate change Other fuels
1.1
1.2 Renewable energy consumption
1.2 Climate change Renewable electricity
1.2 Climate change Green fuels
1.3 Total energy consumption
1.3 Climate change
1.4 Climate change
on 2023 ESG performance data
Fuel oil consumption decreased by 6.5% in 2023 compared to 2022. This is mainly driven by improved fuel efficiency on vessels, which is also reflected in the improved Ocean: Reduction in carbon intensity (EEOI) KPI in this table.
The significant increase of 53% in gas fuels consumption from 2022 to 2023 is driven mainly by the inclusion of LF Logistics, Pilot and Senator for the first time in 2023.
The significant increase from 2022 to 2023 is because of inclusion of lubricant oils for the first time in 2023.
In 2023, we recorded a 15% reduction in electricity and heating consumption compared to 2022. This is mainly driven by an over-estimation of electricity consumption in LF Logistics, Senator and Pilot, that was included in 2022. The data from acquisitions was included to align with our SBTi validated target baseline.
Renewable electricity consumption decreased 1% in 2023 compared to 2022. This is mainly driven by energy efficiency improvements in some of our terminals operating on renewable electricity.
Green fuels consumption increased 11% from 2022 to 2023. This is driven by an increase in consumption of biofuel in Maersk’s operations during the year.
Total energy consumption decreased by 6% in 2023 compared to 2022. This was mainly driven by a decrease in fuel oil consumption.
The share of renewable energy in 2023 is on par with 2022.
significant increase in energy intensity is mainly driven by Maersk’s decreased revenue in 2023 compared to 2022. Greenhouse Gas (GHG) Emissions
2.1
2.2
2.3 Climate change
2.4
In 2023, we recorded a 1% decrease in scope 1 emissions compared to 2022. This was driven mainly by our reduced fuel oil consumption.
The decrease in both scope 2 (location-based) and scope 2 (market-based) emissions are driven mainly by the afore-mentioned over-estimation of electricity consumption in LF Logististic, Senator and Pilot in 2022.
Maersk’s scope 3 emissions decreased 6.3% in 2023 compared to 2022. The decrease is mainly driven by lower freight volumes, container purchases and fuel consumption. See a full breakdown of emissions from the 12 twelve 3 categories applicable to Maersk in the ESG Factbook 2023.
In 2023, we recorded a 4.1% decrease in Total GHG emissions compared to 2022. This main drivers for the decrease are lower emissions across scope 1, 2 and 3.
Unit 2023 2022 2021 2020 2019
Comments
GWh 112,971 120,816 128,646 119,145
GWh 113 74 86 185
Gas fuels
-
GWh 14 5 5 7
-
GWh 763 900¹ 772 715 -
Climate change Electricity and heating
GWh 231 233¹ 90 124
-
GWh 2,433 2,195 - - -
GWh 116,526 124,223¹ 129,599 120,176
Total energy consumption
-
Share
energy % 2 2² 0² 0² -
of renewable
Energy intensity (based
revenue) GWh/million USD 2.28 1.52² 2.10² 3.02² -
1.5 Climate change
on
The
Direct GHG emissions (scope 1 GHG protocol) 1,000 tonnes CO₂e 34,138 34,453¹ 36,597 33,958 -
Climate change
Indirect GHG emissions (scope 2 GHG protocol) - location-based 1,000 tonnes CO₂e 386 444¹ 351 324 -
Climate change
Indirect GHG emissions (scope 2 GHG protocol) - market-based 1,000 tonnes CO₂e 346 423¹ 335 348 -
Climate change Value chain GHG emissions (scope 3 GHG protocol) 1,000 tonnes CO₂e 44,938 47,980¹ 39,436 36,487
Climate change Total GHG emissions (scope 1, 2 - location-based and 3) 1,000 tonnes CO₂e 79,462 82,877¹ 76,385 70,770
2.5
-
Total GHG emissions (scope 1, 2 - market-based and 3) 1,000 tonnes CO₂e 79,422 82,856¹ 76,369 70,794 -
Number has been restated in 2023 based on work performed to improve reporting processes and data quality. See more in the ‘Changes affecting the ESG performance data in 2023’ section of the Accounting policies chapter.
Numbers not part of PwC’s limited assurance for 2023. 48 Strategy and governance Progress on ESG Data and assurance Introduction Sustainability Report 2023
2.5
Climate change
1
2
1
2
3
2.6 Climate change GHG emission intensity (based on revenue) tonnes CO₂e/ million USD
2.7 Climate change Biogenic emissions (scope 1,2 3) 1,000 tonnes CO₂e
Segment-specific climate change KPIs
3.1 Climate change Ocean: Share of freight transported with green fuels
3.2 Climate change Ocean: Reduction in carbon intensity (EEOI) by 2030 (2020 baseline)
In 2023, our GHG emissions intensity increased to 1,549 compared to 1,011 in 2022. The increase is mainly driven by the significant decrease in revenue in 2023 compared to 2022.
In 2023, we emitted 639,000 tonnes CO₂e biogenic emissions. These were mainly related to combustion of biofuels in our vessel operations.
% of FFE 3 2 - -From 2022 to 2023, we recorded a 1%-point increase in the share of ocean freight transported by green fuels. This reflects customers’ growing engagement with supply chain partners who can help realise their climate ambition.
% reduction
3.3 Climate change Terminals: Reduction of scope 1 and 2 emissions by 2030 (2020 baseline) % reduction
In 2023, we improved the operational efficiency of our vessels, reducing Maersk’s EEOI by 4% compared to the 2020 baseline. This is driven by more fuel-efficient operations, continuous roll-out of efficiency technologies, shore power enablement and increased use of biofuels.
Since 2020, APM Terminals has reduced its absolute scope 1 and 2 emissions by 13%. Key drivers include implementation of dedicated green tariffs in European terminals and implementation of energy optimisation initiatives at 12 terminals to reduce fuel and electricity use.
SOx emissions decreased 10% in 2023 compared to 2022. The decrease is driven mainly by the reduction in heavy fuel oil (HFO) consumption in our vessel operations.
While the total HFO consumption decreased, the conversion factors used for HFO have increased from 0.0578 in 2022 to 0.0691 in 2023 leading to Maersk’s overall NOx emissions increasing 10%. If the factors stayed the same as last year, NOx emissions would have decreased by 43,000 tonnes.
In 2023, particulate matter (PM10 and PM2.5) and NMVOC emissions decreased with 4%, 12%, and 43% respectively, compared to 2022. The main drivers for the decrease are due to lower volumes of heavy fuel oil consumed in Ocean and the use of scrubbers, which reduce air pollutant emissions.
Black carbon emissions in 2023 is on par with 2022.
The 39% increase of Carbon Monoxide (CO) emissions in 2023 compared to 2022 is driven by significantly higher consumption of kerosine fuel by Maersk Air Cargo due to increased air freight volumes.
In 2023, we recorded a 4% decrease in waste generation from our operations. This was mainly driven by an increased focus on waste reduction initiatives on our vessels. This decrease was partly offset by an increase in waste in the new logistics entities LF Logistics, Senator and Pilot that were included for the first time in 2023.
Water consumption increased by 18% in 2023 compared to 2022. This increase is mainly due to Maersk’s acquisition of LF Logistics in 2022, which has significantly increased our landside footprint, and that has been included for the first time in our ESG performance data this year.
Maersk
2023, Maersk had two container loss incidents, both occurring in December. Six containers were lost at sea off the coast of Spain and 46 containers in the North Sea of the coast of Denmark. See note on p. 30.
1,549 1,011² 1,231² 1,773² -
639 - - -
-
4 -7 -6 0 -
13 5 - 0
-
Air
Environment and ecosystems SOx 1,000 tonnes 90 100¹ 107 102 569
4.1 Environment and ecosystems NOx 1,000 tonnes 672 611¹ 887 825 888
pollutants 4.1
4.1 Environment and ecosystems NMVOCs 1,000 tonnes 16 27² - - -
4.1 Environment and ecosystems CO 1,000 tonnes 77 55² - -4.1 Environment and ecosystems PM103 1,000 tonnes 49 51² - -4.1 Environment and ecosystems PM2.5 1,000 tonnes 38 43² - -4.1 Environment and ecosystems Black Carbon 1,000 tonnes 3 3² - -Other resource consumption 5.1 Environment and ecosystems Waste 1,000 tonnes 533 553¹ 357 289 299
5.2 Environment and ecosystems Water consumption 1,000 m3 2,957 2,504 2,156 1,754 1,696
Environmental incidents 6.1 Environment and ecosystems Hydrocarbon spills (>10 m3) # 0 0 2 2 0 In 2023,
6.2 Environment and ecosystems Containers lost at sea # 52 118 - -In
did not record any significant oil spills (>10 m3) to the environment.
Number has been restated in 2023 based on work performed to improve reporting processes and data quality. See more in the ‘Changes affecting the ESG performance data in 2023’ section of the Accounting policies chapter.
Numbers not part of PwC’s limited assurance for 2023.
By default, PM10 includes smaller particles (such as PM2.5 and BC). 49 Strategy and governance Progress on ESG Data and assurance Introduction Sustainability Report 2023
7.1
The 14% increase in the number of employees in 2023 compared to 2022 is mainly driven by the inclusion of acquisitions, including LF Logistics, Pilot and Senator for the first time in 2023. 7.2
In 2023, we recorded a decrease in our ranking score in global norms of 7 percentage points. This indicates a setback that is mainly driven by the organisational change and challenging business environment in 2023.
7.10 Safety and security Learning Teams completed following a High Potential Incident
7.11 Safety and security Global Leadership (top 1,200 leaders) upskilled in Maersk Safety & Security Principles
7.12 Employee relations and labour rights Employee relations and labour rights training
Governance performance
8.1
8.2
In 2023, we continued to make steady progress on gender diversity with an increase in both the share of women in management (Job Level 4+) and Women in leadership (Job Level 6+) KPIs.
Moreover, we observed a 1% increase in the share of women and an unchanged share of target nationalities in our total employee population.
Through focus and intent, we have been able to increase our target nationality at the leadership level from 16% in 2022 to 20% in 2023.
Regrettably, we recorded 4 fatal accidents in 2023. Two Maersk employees and two third-party contractors working on behalf of Maersk. See more on p. 35.
In 2023, we recorded an increase in our lost-time injury frequency rate from 0.93 to 1.11. This is partly driven by our focus on improving the reporting culture, where all colleagues feel safe to speak up, which has led to more reported incident cases.
In 2023, we achieved a 99% completion rate of Learning Teams performed following a High Potential Incident.
Completion rate 98 - - -In 2023, we recorded a 98% completion rate for the Lead with Care programme aimed at upskilling leaders (Job level 6+) in Maersk’s safety and security principles.
Completion rate 90 83 - - -
In 2023, Maersk achieved a 90% of our employee relations and labour rights training target of 100%. Recognising that reaching all employee groups, especially through workforce changes, is a continued challenge, we will keep the rigor of a 100% target on an annual basis.
Completion rate 92 83 - - -
This year 92% of Maersk employees completed the mandatory Code of Conduct training. Challenges in reaching all employee groups remain, particularly due to organisational changes, but we are working to close this gap with a goal of 100% completion in 2024.
% 96 95 95 -In 2023, 96% of Maersk’s entities completed a risk assessment on compliance and business ethics. This is a 1% increase from the previous group-wide risk assessment that was done in 2021.
Social performance Unit 2023 2022 2021 2020 2019 Comments on 2023 ESG performance data
Human capital Number of employees Headcount 108,934 95,966 84,796 74,326 76,455
Human capital Employee
percentile
norm Percentile rank 60 67 59 54 41
Engagement Survey score in the 75th
of global
7.3 DE&I Gender - female/total % (headcount) 34 33 31 28 28
7.4 DE&I Women in management (Job level 4+) % (headcount) 35 33 33 31 31 7.5 DE&I Women in leadership (Job level 6+) % (headcount) 27 26 22 21 20 7.6 DE&I Target nationalities/total % (headcount) 67 67 72 72 71 7.7 DE&I Target nationalities in
leadership (Job level 8 and 9) % (headcount) 20 16 15 12 13
executive
7.8 Safety and security Fatalities # 4 9 4 1 5
7.9 Safety and security Lost-time injury frequency (LTIf) Rate 1.11 0.93¹ 0.93 1.22 1.16
99 83 - - -
Completion rate
Unit 2023 2022 2021 2020 2019
Business ethics Code of Conduct training
Number has been restated in 2023 based on work performed to improve reporting processes and data quality. See more in the ‘Changes affecting the ESG performance data in 2023’ section of the Accounting policies chapter. 50 Strategy and governance Progress on ESG Data and assurance Introduction Sustainability Report 2023
Business ethics
%
of operations covered by a risk assessment on compliance and business ethics risks
1
8.3 Business ethics Whistleblower cases
8.4 Sustainable procurement Suppliers committed to Maersk Supplier Code of Conduct (CoC)
8.5 Sustainable procurement Tier 1 high-risk category/ strategic suppliers undergoing ESG assessments
8.6 Sustainable procurement High-risk category/strategic suppliers assessed with Improvement plan successfully closed
# 1,154 735 634 - -
% 95 96 - - -
% 71 77 - - -
% 79 69 - - -
8.7 Sustainable procurement Procurement staff trained in Sustainable Procurement (SP) Completion rate 91 - - - -
8.8 Data ethics Data ethics training
Completion rate 91 67
In 2023, Maersk received 1,154 whistleblower reports, a significant increase compared to the 735 cases recorded for 2022. The increase is driven mainly by an improved speak-up culture. See more on p. 12.
By the end of 2023, 95% of our suppliers had committed to Maersk’s Supplier Code of Conduct. This is a decrease of 1% compared to 2022. Our target remains to have 100% of our suppliers committed by 2024.
In 2023 the share of our tier 1 high risk category/strategic suppliers with ESG assessment completed decreased to 71% from 77% in 2022. We are prioritising supplier assessments in 2024 to ensure we exceed the targets committed for 2024.
In 2023, the share of high-risk category/strategic suppliers assessed and with improvement plans successfully closed increased to 79% from 69% in 2022. This is close to our 80% target by 2024.
In 2023, we recorded a 91% completion rate and are well on our way to meeting the 100% target for 2024.
By the end of 2023, 91% of Maersk employees in scope for training have completed our mandatory data ethics e-learning against a target of 100%. This is a significant improvement compared to 2022, as we expanded the number of employees in scope for training to also include employees from LF Logistics, Pilot and Senator during 2023 in alignment with roll-out plans.
Financial data is taken from the audited 2023 Annual Report of A.P. Moller - Maersk. The Annual Report can be found at investor.maersk.com
The results of Maersk’s taxonomy screening for 2023 confirm that the company has significant opportunity to substantially contribute towards climate change mitigation, and that it is in its early stages of the journey to decarbonise its end-to-end value chain. Hence, we see a high share of eligible revenue, Capex and Opex, but a significantly lower share of revenue, Capex and Opex related to taxonomy-aligned activities. Over the coming years, we expect to see a modest gradual increase of taxonomy-aligned revenue and a continued steady increase in the taxonomy-aligned Capex in line with our decarbonisation strategy.
Please see a detailed breakdown of the EU Taxonomy KPIs on the following pages.
In 2018, Maersk launched a 5-year Revolving Credit Facility that is linked to the efficiency (EEOI) performance of our vessels (vs a 2008 baseline). Since 2008, we have improved the efficiency of our vessel operations (EEOI) by 44.7% compared to the 2008 baseline.
-
- -
Economic performance Unit 2023 2022 2021 2020 2019 9.1 Revenue USD million 51,065 81,529 61,787 39,740 38,890
9.2 Profit/loss before financial items (EBIT) USD million 3,934 30,860 19,674 4,186 1,725 9.3 Capex USD million 3,646 4,163 2,976 1,322 2,035 9.4 Tax for the year USD million 454 910 697 407 458 EU Taxonomy
10 Share of aligned revenue % 4 3 - -10 Share of eligible revenue % 80 85 - -10 Share of aligned Capex % 17 7 - -10 Share of eligible Capex % 74 64 - -10 Share of aligned Opex % 7 10 - -10 Share of eligible Opex % 68 100 - -Revolving Credit Facility KPI performance Unit 2023 2022 2021 2020 2019 11 Relative CO₂ reduction (percentage vs. 2008 baseline) % reduction 44.7 39.9 39.8 42.7 41.8
51 Strategy and governance Progress on ESG Data and assurance Introduction Sustainability Report 2023
Proportion of revenue from products or services associated with Taxonomy-aligned economic activities 2023
Financial year 2023
Economic activities
2023
NACE codes Absolute revenue (mio USD)
Proportion of revenue (%)
Climate change mitigation (Y; N; N/EL)
Climate change adaptation (Y; N; N/EL)
Substantial contribution DNSH
Water and marine resources (Y; N; N/EL)
Circular economy (Y; N; N/EL)
Pollution (Y; N; N/EL)
Biodiversity and ecosystems (Y; N; N/EL)
Climate change mitigation (Y/N)
Climate change adaptation (Y/N)
Water and marine resources (Y/N)
Circular economy (Y/N)
Pollution (Y/N)
Biodiversity and ecosystems (Y/N)
Minimum safeguards (Y/N)
Proportion of Taxonomyaligned or eligible revenue 2022 (%)
Enabling activity (E)
Transitional activity (T)
A. Taxonomy-eligible activities
A.1. Environmentally sustainable activities (Taxonomy-aligned)
6.2
6.6 Freight transport services by road
6.10 Sea and coastal freight water transport
6.16 Infrastructure enabling low-carbon water transport
7.6 Installation, maintenance and repair of renewable energy technologies
H52.22, N77.34
but not environmentally sustainable activities (not Taxonomy-aligned activities)
H49.20 19 0.0% Y N N/EL N/EL N/EL N/EL Y Y Y Y Y Y Y 0.0%
Freight rail transport
H49.4.1, H53.20,
0 0.0% Y N N/EL N/EL N/EL N/EL Y Y Y Y Y Y Y 0.0%
N77.12
H50.2,
9284 1.8% Y N N/EL N/EL N/EL N/EL Y Y Y Y Y Y Y 1.9% T
F42.91, F71.1, F71.20 1,058 2.1% Y N N/EL N/EL N/EL N/EL Y Y Y Y Y Y Y 1.5% E
M71,C28 1 0.0% Y N N/EL N/EL N/EL N/EL Y Y Y Y Y Y Y 0.0% E Revenue of environmentally sustainable activities (Taxonomy-aligned) 2,006 3.9% 3.9% 0% 0% 0% 0% 0% Y Y Y Y Y Y Y 3.4% Of which Enabling 1,059 2.1% 2.1% 0% 0% 0% 0% 0% Y Y Y Y Y Y Y 1.5% E Of which Transitional 928 1.8% 1.8% 0% 0% 0% 0% 0% Y Y Y Y Y Y Y 1.9% T A.2. Taxonomy-eligible
(EL; N/EL) (EL; N/EL) (EL; N/EL) (EL; N/EL) (EL; N/EL) (EL; N/EL) 6.2 Freight rail transport H49.20 38 0.1% EL EL N/EL N/EL N/EL N/EL 0.1% 6.6 Freight transport services by road H49.4.1, H53.20, N77.12 5,214 10.2% EL EL N/EL N/EL N/EL N/EL 6.1% 6.10 Sea and coastal freight water transport H50.2, H52.22, N77.34 30,516 59.8% EL EL N/EL N/EL N/EL N/EL 72.8% 6.16 Infrastructure enabling low-carbon water transport F42.91, F71.1, F71.20 1,897 3.7% EL N/EL N/EL N/EL N/EL N/EL 2.8% 6.19 Passenger and freight air transport H51.1, H51.21 1,222 2.4% EL N/EL N/EL N/EL N/EL N/EL 0.0% 7.6 Installation, maintenance and repair of renewable energy technologies F42, F43, M71,C28 - 0.0% EL EL N/EL N/EL N/EL N/EL 0.0% Revenue of Taxonomy-eligible but not environmentally sustainable activities (not Taxonomy-aligned activities) (A.2) 38,887 76.2% 76.2% 0% 0% 0% 0% 0% 81.8% A. Revenue of Taxonomy-eligible activities (A.1+A.2) 40,893 80.1% 80.1% 0% 0% 0% 0% 0% 85.2% B. Taxonomy Non-eligible activities Revenue of Taxonomy-non-eligible activities 10,172 19.9% Total 51,065 100% 4 One of the vessels, Laura Mærsk, contributing USD 4 million to the aligned revenue under 6.10 has been partially (56%) financed via a green bond. The total aligned revenue under 6.10 excluding the aligned revenue from the vessel partially financed via green bonds would therefore be adjusted by USD 2.36 million to USD 926 million. The adjusted share of aligned revenue would remain the same at 1.8%. 52 Strategy and governance Progress on ESG Data and assurance Introduction Sustainability Report 2023
F42,F43,
Proportion of Capex from products or services associated with Taxonomy-aligned economic activities 2023
Financial year 2023
Economic activities
2023
NACE codes Absolute Capex (mio USD)
Proportion of Capex (%)
Climate change mitigation (Y; N; N/EL)
Climate change adaptation (Y; N; N/EL)
Substantial contribution DNSH
Water and marine resources (Y; N; N/EL)
Circular economy (Y; N; N/EL)
Pollution (Y; N; N/EL)
Biodiversity and ecosystems (Y; N; N/EL)
Climate change mitigation (Y/N)
Climate change adaptation (Y/N)
Water and marine resources (Y/N)
Circular economy (Y/N)
Pollution (Y/N)
Biodiversity and ecosystems (Y/N)
Minimum safeguards (Y/N)
Proportion of Taxonomyaligned or eligible Capex 2022 (%)
Enabling activity (E)
Transitional activity (T)
A. Taxonomy-eligible activities
A.1. Environmentally sustainable activities (Taxonomy-aligned)
6.6 Freight transport services by road H49.4.1, H53.20, N77.12
6.10 Sea and coastal freight water transport H50.2, H52.22, N77.34
6.12
6.16
7.6 Installation,
but not environmentally sustainable activities (not Taxonomy-aligned activities)
5 Of the aligned Taxonomy 6.10 Capex, 603 mUSD is in 2023 related to financing via the issuance of green bonds under Maersk’s Green Finance Framework. Aligned CAPEX for Transitional 6.10 activities would result in 7 mUSD. The adjusted share of aligned Capex would be 0.14%. For more details on our green bonds allocation please refer to the allocation reports for 2021 - 2023 which can be found here: investor.maersk.com
1 0.0% Y N N/EL N/EL N/EL N/EL Y Y Y Y Y Y Y 0.0%
6105 10.5% Y N N/EL N/EL N/EL N/EL Y Y Y Y Y Y Y 4.6% T
Retrofitting
and passenger water transport H50.2 22 0.4% Y N N/EL N/EL N/EL N/EL Y Y Y Y Y Y Y 0.3% E
of sea and coastal freight
Infrastructure
low-carbon water transport F42.91, F71.1, F71.20 357 6.1% Y N N/EL N/EL N/EL N/EL Y Y Y Y Y Y Y 1.2% E
enabling
renewable energy technologies F42,F43, M71, C28 28 0.5% Y N N/EL N/EL N/EL N/EL Y Y Y Y Y Y Y 1.0% E Capex of environmentally sustainable activities (Taxonomy-aligned) (A.1) 1,018 17.5% 17.5% 0% 0% 0% 0% 0% Y Y Y Y Y Y Y 7.1% Of which Enabling 407 7.0% 7.0% 0% 0% 0% 0% 0% Y Y Y Y Y Y Y 2.5% E Of which Transitional 610 10.5% 10.5% 0% 0% 0% 0% 0% Y Y Y Y Y Y Y 4.6% T
Taxonomy-eligible
(EL; N/EL) (EL; N/EL) (EL; N/EL) (EL; N/EL) (EL; N/EL) (EL; N/EL)
Freight transport services by road H49.4.1, H53.20, N77.12 48 0.8% EL EL N/EL N/EL N/EL N/EL 2.2% 6.10 Sea and coastal freight water transport H50.2, H52.22, N77.34 1,550 26.6% EL EL N/EL N/EL N/EL N/EL 38.3% 6.12 Retrofitting of sea and coastal freight and passenger water transport H50.2 257 4.4% EL EL N/EL N/EL N/EL N/EL 9.4% 6.16 Infrastructure enabling low-carbon water transport F42, F43, M71,C28 628 10.8% EL N/EL N/EL N/EL N/EL N/EL 6.5% 6.19 Passenger and freight air transport H51.1, H51.21 155 2.7% EL N/EL N/EL N/EL N/EL N/EL 0.0% 7.6 Installation, maintenance and repair of renewable energy technologies F42, F43, M71,C28 0 0.0% EL EL N/EL N/EL N/EL N/EL 0.0% 7.7 Acquisition and ownership of buildings L68 684 11.7% EL EL N/EL N/EL N/EL N/EL 0.0% Capex of Taxonomy-eligible but not environmentally sustainable activities (not Taxonomy-aligned activities) (A.2) 3,322 57.0% 57.0% 0% 0% 0% 0% 0% 56.4% A. Capex of Taxonomyeligible activities (A.1+A.2) 4,340 74.5% 74.5% 0% 0% 0% 0% 0% 63.5%
Taxonomy
activities Capex of Taxonomy-non-eligible activities 1,489 25.5% Total 5,829 100.0%
maintenance and repair of
A.2.
6.6
B.
Non-eligible
53
and governance Progress on ESG
and assurance Introduction
Report 2023
Strategy
Data
Sustainability
Proportion of Opex from products or services associated with Taxonomy-aligned economic activities 2023
Financial year 2023 2023
Economic activities
NACE codes Absolute Opex (mio USD)
Proportion of Opex (%)
Climate change mitigation (Y; N; N/EL)
Climate change adaptation (Y; N; N/EL)
Substantial contribution DNSH
Water and marine resources (Y; N; N/EL)
Circular economy (Y; N; N/EL)
Pollution (%) Biodiversity and ecosystems (Y; N; N/EL)
Climate change mitigation (Y/N)
Climate change adaptation (Y/N)
Water and marine resources (Y/N)
Circular economy (Y/N)
Pollution (Y/N) Biodiversity and ecosystems (Y/N)
Minimum safeguards (Y/N)
Proportion of Taxonomyaligned or eligible Opex 2022 (%)
Enabling activity (E)
Transitional activity (T)
A. Taxonomy-eligible activities
A.1. Environmentally sustainable activities (Taxonomy-aligned)
6.6 Freight transport services by road H49.4.1, H53.20, N77.12
6.10 Sea and coastal freight water transport H50.2, H52.22, N77.34
6.16 Infrastructure enabling low-carbon water transport F42.91, F71.1, F71.20
7.6 Installation, maintenance and repair of renewable energy technologies
A.2. Taxonomy-eligible but not environmentally sustainable activities (not Taxonomy-aligned
0 0.0% Y N N/EL N/EL N/EL N/EL Y Y Y Y Y Y Y 0.0%
14 1.5% Y N N/EL N/EL N/EL N/EL Y Y Y Y Y Y Y 2.1% T
54 5.8% Y N N/EL N/EL N/EL N/EL Y Y Y Y Y Y Y 7.8% E
F42,
M71, C28 0 0.0% Y N N/EL N/EL N/EL N/EL Y Y Y Y Y Y Y 0.2% E Opex of environmentally sustainable activities (Taxonomy-aligned) (A.1) 68 7.3% 7.3% 0% 0% 0% 0% 0% Y Y Y Y Y Y Y 10.1% Of which Enabling 54 5.8% 5.8% 0% 0% 0% 0% 0% Y Y Y Y Y Y Y 8.0% E Of which Transitional 14 1.5% 1.5% 0% 0% 0% 0% 0% Y Y Y Y Y Y Y 2.1% T
F43,
(EL; N/EL) (EL; N/EL) (EL; N/EL) (EL; N/EL) (EL; N/EL) (EL; N/EL) 6.6 Freight transport services by road H49.4.1, H53.20, N77.12 6 0.6% EL EL N/EL N/EL N/EL N/EL 0.9% 6.10 Sea and coastal freight water transport H50.2, H52.22, N77.34 302 32.2% EL EL N/EL N/EL N/EL N/EL 55.0% 6.16 Infrastructure enabling low-carbon water transport F42.91, F71.1, F71.20 132 14.1% EL N/EL N/EL N/EL N/EL N/EL 34.0% 6.19 Passenger and freight air transport H51.1, H51.21 66 7.0% EL N/EL N/EL N/EL N/EL N/EL 0.0% 7.6 Installation, maintenance and repair of renewable energy technologies F42, F43, M71, C28 0 0.0% EL EL N/EL N/EL N/EL N/EL 0.0% 7.7 Acquisition and ownership of buildings L68 64 6.8% EL EL N/EL N/EL N/EL N/EL 0.0% Opex of Taxonomy-eligible but not environmentally sustainable activities (not Taxonomy-aligned activities) (A.2) 570 60.7% 60.7% 0% 0% 0% 0% 0% 89.9% A. Opex of Taxonomy eligible activities (A.1+A.2) 638 68.0% 68.0% 0% 0% 0% 0% 0% 100.0% B. Taxonomy Non-eligible activities Opex from non-eligible activities 300 32.0% Total 938 100.0% 54 Strategy and governance Progress on ESG Data and assurance Introduction Sustainability Report 2023
activities)
ESG performance data accounting policies
Basis of reporting
Reporting period
The ESG performance data reporting of A.P. Moller – Maersk A/S (Maersk) covers the period from 1 January to 31 December 2023.
Reporting boundaries and use of reporting frameworks
Our approach to sustainability and ESG reporting is to focus on material issues and activities, in line with a double materiality (DMA) principle, encompassing areas where Maersk may have the largest impacts on people and planet through our activities, or where Maersk is exposed to the most significant financial risks or opportunities. For the first time in 2023, we have conducted an initial DMA based on the criteria outlined in the European Sustainability Reporting Standards (ESRS). The results of the DMA have shaped the content of this report. We are guided by the reporting principles set out in the GRI 101: Foundation Standard to determine the report content and quality in terms of materiality, stakeholder inclusiveness, sustainability context, completeness, balance, comparability, accuracy, timeliness, clarity and reliability. For an overview of our use of and alignment with ESG reporting frameworks, incl. TCFD and SASB, please refer to our ESG Factbook 2023 here.
Scope and consolidation
Unless otherwise stated, the ESG performance data is reported based on the same principles as the financial statements. Thus, the ESG performance data include consolidated data from the parent company, A.P. Møller - Mærsk A/S, and subsidiaries controlled by Maersk. Data is collected per legal entity per activity, and the figures are consolidated line-by-line. Consolidation of ESG performance data using financial scope implies that data from the following assets are included:
• Owned assets that Maersk financially owns and that are operated by Maersk
• Long-term leased-in assets that Maersk treats as capital assets and that are treated as such on Maersk’s balance sheet in accordance with IFRS16
• Leased-out assets that Maersk treats as wholly owned assets in financial accounting and are treated as such on Maersk’s balance sheet (e.g. short-term leased-out assets to third parties).
Using financial scope also implies that data from the following assets are not included:
• Long-term leased out assets that are treated by the lessee as wholly owned assets in financial accounting and therefore appearing on the lessee’s balance sheet and not Maersk’s i.e. a financial lease
Technical management of an asset on behalf of third parties follow the same consolidation principles.
The consolidation for Safety (Fatalities and Lost-time injury frequency) data differs from the financial principles described above. Safety data is consolidated using an operational scope approach. This means that Maersk includes all safety data when A.P. Møller - Mærsk A/S or one of its subsidiaries has the governing authority and responsibility for health, safety and environmental management of the people, the processes, and facility. This approach includes contractors and thirdparties that are working under the oversight, instructions and HSSE management system of Maersk.
Mobile assets are included when operated by Maersk. For vessels, the International Safety Management Code Document of Compliance must be held by Maersk to be included in the safety data.
The consolidation of greenhouse gas (GHG) emissions data is based on the financial consolidation approach and stated in accordance with the GHG Protocol: direct emissions from owned and long term leased-in assets as defined by IFRS 16 (scope 1), indirect emissions from purchased electricity and district heating (scope 2), and value chain emissions (scope 3), which also includes emissions related to leased out assets as defined by IFRS 16.
To ensure completeness in reported data from our offices, office standards have been developed, which can be used for offices with no production or warehouses. The office standards define average consumption values per FTE and are only used if other more accurate information is not available.
Data from divestments are included until the day of transaction, while data from acquisitions are included from the reporting year following the transaction. In 2023, data from Pilot Freight Services (Pilot), Senator International (Senator) and LF Logistics, which were acquired in 2022, has been included in the ESG performance data.During 2023, the acquisitions of Martin Bencher Group and Grindrod Logistics was completed. Data from these companies will be included in the Annual Report 2024. Data from Maersk Supply Services is included up until the divestment date of 15 May 2023.
Emission conversions and calculations
GHG emissions are calculated using conversion factors for energy consumption and other GHG gases. Primary schemes used are AR6 (updated 2022), EMEP/EEA air pollutant emission inventory guidebook (2019 database), IEA (updated 2023), GLEC Framework (updated 2023), DEFRA (updated 2022) and CEDA6 (updated in 2022). The principles for choosing among the schemes for default conversion factors are:
• The most recent and internationally recognised schemes are preferred
• Specific industry schemes can be included when not in conflict with the above.
Changes affecting the ESG performance data in 2023
For 2023, we have restructured the energy performance data to more clearly indicate the types of fuels and the share of energy consumption that are based on fossil and renewable sources. We have also aligned the unit of measurement for energy consumption in the ESG performance table to further enhance the readability and comparability of our energy consumption data and restated comparison year numbers back to 2020 accordingly. Likewise, we have aligned the unit of measurement for Number of employees from FTE’s to headcounts, which is also used to calculate our DE&I KPIs. We have restated comparison year numbers accordingly. The FTE numbers continues to be available in our Annual Report.
In alignment with our ESG Strategy, we have for the first time included the share of global leadership upskilled in Maersk’s safety and security principles, as well as the share of the procurement staff that has been trained in sustainable procurement.
Furthermore, and in preparation for the EU CSRD requirements, we have introduced a new energy and climate change-related intensity KPIs
55 Strategy and governance Progress on ESG Data and assurance Introduction Sustainability Report 2023
in our report along with KPIs related to biogenic CO₂ and air pollutants, including NMVOCs, carbon monoxide, particulate matter (PM10.5, PM 2.5 and black carbon).
Hence, from 2023, the following new KPIs have been included in our ESG performance data:
Environment:
• Climate change: Renewable electricity
• Climate change: Green fuels
• Climate change: Share of renewable energy
• Climate change: Energy intensity (based on revenue)
• Climate change: GHG emission intensity (based on revenue)
• Climate change: Biogenic emissions (scope 1, 2, 3)
• Environment & ecosystems: Other air pollutants (particulate matter, black carbon, carbon monoxide, NMVOCs)
Social:
• Safety & security: Global Leadership (top 1,200 leaders) upskilled in Maersk Safety & Security Principles
Governance:
• Sustainable procurement: Procurement staff trained in Sustainable Procurement (SP)
Changes made to align with new science-based targets
Maersk submitted GHG reduction targets to the Science-based Target Initiative (SBTi) for validation in June 2023, which were validated in September 2023. For SBTi alignment, the submission required a restatement of 2022 data reported in the sustainability report. Maersk followed the maritime and general guidance for SBTi for the target setting and determined the year 2022 to be representative of its current and future operations as an integrated logistics company. Key changes to the baseline compared to previously reported 2022 climate change data are:
• Inclusion of emissions from recent acquisitions, namely Pilot, Senator and LF Logistics
• Inclusion of emissions from joint ventures and associate companies based on equity share in line with SBTi requirements
• Inclusion of emissions for liners serviced at APM Terminals under use of sold products in line with SBTi requirements
When including acquisitions, we noted in the case of Pilot and Senator sites, gathering actual electricity consumption for 2022 was not possible due to the lack of data owing to previous operational processes within these acquisitions. To ensure completeness of the baseline submitted for SBTi, Maersk gathered data on characters per site in these acquisitions (mainly area in square metres). The electricity consumption for 2022 was modelled based on publicly available EU estimates for non-residential sites. Location-based estimates of emission were calculated using IEA factors. For market-based estimates, it was assumed that the sites only use the residual electricity mix. We note that the 2022 electricity emissions estimates are likely conservative, i.e. too high. For 2023, the acquisitions has provided actual consumption based on invoices. The actual data indicate a significant lower consumption and related scope 2 emissions than was estimated in 2022 and this is the main driver for the reduction in these numbers from 2022 to 2023.
The above changes made to align with the SBTi targets led to a 6% increase in our total 2022 GHG emissions compared to previously reported data.
Furthermore, we have as part of the process made improvements to emission inventory methodologies to ensure alignment with SBTi in the future. This includes improvements in the application of the financial control principle and increased share of activity-based estimates in scope 3 data.
Other restatements
Work to further improve the quality of Maersk’s ESG data resulted in restatements of the 2022 Lost-time injury frequency, waste generation numbers in 2022 and our Biofuel consumption for 2021 and 2022. The Lost-time injury frequency for 2022 was restated to 0.93 (from 0.90). This is linked to an identified over-reporting of exposure hours. Waste generation for 2022 has been restated to 553 (1,000 tonnes) from the previously reported 460 (1,000 tonnes). The correction is related to omission of waste generated on chartered vessels that was not included in the 2022 reporting. The biofuel consumption for 2021 and 2022 is restated as the previously reported amounts included the blended fossil fuel amount. Corrections impacted the reported scope 1 emissions, which now correctly considers blend of biofuels. In these areas, the robustness of our reporting processes have been improved to mitigate risks of misstatements going forward.
Accounting policies – environmental performance
1.1 Fossil energy consumption
Fossil energy consumption encompasses all fossil-based energy consumption that is consumed/combusted at Maersk controlled entities/vessels. Fossil energy consumption includes the following:
• Fuel oil, incl. heavy fuel oil, marine diesel oil, gasoline, diesel and kerosene
• Gas fuels, incl. liquified petroleum gas (LPG), liquefied natural gas (LNG) and natural gas
• Other fuels, incl. heating oil and cylinder oil
• Electricity and heating
1.2 Renewable energy consumption
Renewable energy consumption encompasses all renewable energy consumption, incl. renewable electricity, heating and green fuels that are consumed at Maersk controlled entities/vessels. Renewable electricity includes electricity from solar panels, wind turbines, and batteries, covering on-site self-generated and purchased renewable electricity from the grid. Green fuels, include biofuels and green methanol. Thus, renewable energy consumption is reported as:
• Renewable electricity
• Green fuels
1.3 Total energy consumption
Total energy consumption is the sum of fossil energy consumption and renewable energy consumption.
1.4 Share of renewable energy
The share of renewable energy is the percentage of total energy consumption that is derived from renewable energy sources.
1.5 Energy intensity (based on revenue)
Energy intensity is the total energy consumption per unit of revenue (million), as stated in the Annual Report.
2.1 Direct GHG emissions (scope 1)
Direct GHG emissions (scope 1) is the sum of all six Kyoto gases converted to CO₂ equivalents. Kyoto gases comprise: CO₂, CH₄, and N₂O, which are calculated based on amount of direct energy (i.e. the fuels
56 Strategy and governance Progress on ESG Data and assurance Introduction Sustainability Report 2023
stated under ‘Energy consumption’) that are consumed/combusted and HFCs, SF₆, and NF₃, which are based on direct consumption at at entities/ vessels controlled by Maersk.
2.2 Indirect GHG emissions (scope 2) – location-based
Indirect GHG emissions (scope 2) is the CO₂ equivalents’ converted sum of CO₂, CH₄ and N₂O, calculated based on consumed electricity and district heating bought from a third party and using location-based IEA emission factors.
2.3 Indirect GHG emissions (scope 2) – market-based
Indirect GHG emissions (scope 2) is the CO₂ equivalents’ converted sum of CO₂, CH₄ and N₂O, calculated based on consumed electricity and district heating bought from a third party and using country-specific market-based factors for EU countries and the US and IEA factors for other countries.
2.4 Value chain GHG emissions (scope 3)
Value chain GHG emissions (scope 3 GHG ) are the CO₂ equivalents’ converted sum of CO₂, CH₄ and N₂O from Maersk’s value chain activities. Of the 15 scope 3 categories in the GHG Protocol, 12 categories are currently determined as applicable to Maersk’s business model and activities. The excluded categories are: Category 9 – downstream transportation and distribution, Category 10 – processing of sold products and Category 14 – franchises. Thus, value chain GHG missions comprise of emissions relating to: Category 1 – purchased goods and services, which are reported based on financial data and includes operational goods. Category 2 – capital goods, which is reported based on life cycle assessments and reported capital expenditure. This category covers capital investments such as new asset purchases, retrofit of vessels, and dry docking. We include the full scope 3 impact in the year of investment. Category 3 - fuel and energy-related activities, which are reported based on actual fuel procured and consumed. Category 4 – upstream transportation and distribution, which is calculated using the Global Logistics Emissions Council (GLEC) methodology utilising transport data per transport category. For supporting logistics related activities such as terminal services, financial data is multiplied by relevant emission factors. Category 5 –waste generated in operations, which is reported based on amounts and types of waste. Category 6 – business travel, which is reported based on activity-data for our direct air travel and procurement data for other
business travel related activities. Category 7 – employee commuting, which is reported based on employee headcounts per location, estimated commuting distance and transportation modes. Category 8 – upstream leased assets, which is reported based on operations of assets that are leased and not reported in scope 1 and 2. Category 11 – use of sold products, is based on activity data for marine fuels traded by Maersk to third parties, estimated fuel use of liner calling APM Terminals, and estimated emissions from the use of refrigerate containers produced by Maersk Container industry. Category 12 end-oflife treatment of sold products, which is reported based on activity data for end of life and retreatment of sold new and second-hand reefers. Category 13 – downstream leased assets, which is reported based on fuel consumption from vessels, tugs and planes leased to third parties. Category 15 – Investments, emissions are calculated to the extent of the equity share in non-controlled joint ventures and associates using financial data and corresponding factors. Please refer to ESG Factbook 2023 for a category breakdown of scope 3 emissions.
2.5 Total GHG emissions
Total GHG emissions have been stated as both the sum of scope 1, scope 2 - location-based and scope 3 emissions as well as scope 1, scope 2market-based and scope 3 emissions.
2.6 GHG emission intensity
GHG emission intensity is the GHG emissions expressed per unit of revenue (million) - based on total GHG emissions (sum of reported scope 1, scope 2 - location-based and scope 3 emissions) and revenue as stated in the Annual Report.
2. 7 Biogenic emissions (scope 1, 2, 3)
Biogenic CO₂ emissions result from the combustion or biodegradation of biomass. Biomass is defined as any material or fuel produced by biological processes of living organisms, including organic non-fossil material of biological origin (such as plant material), biofuels (such as liquid fuels produced from biomass feedstocks), biogenic gas (such as landfill gas), and biogenic waste (such as municipal solid waste from biogenic sources). In Maersk’s current inventory, the calculation of biogenic CO₂ is limited to the combustion of fuels based on biogenic feedstock. This may expand based on evolving international standards detailing the treatment of biogenic emissions in corporate inventories.
3.1 Ocean: Share of freight transported with green fuels
The share of freight transported with green fuels is calculated as the share of FFE (Forty-Foot container Equivalent) containers transported using Maersk’s EcoDelivery product out of the total FFEs transported by Maersk in the Ocean segment during the year. Transportation data, both total and EcoDelivery-labelled, is based on registrations in Maersk’s Line of Sight system, which captures all container bookings in Maersk’s Ocean segment.
3.2 Ocean: Reduction in carbon intensity (EEOI) by 2030 (2020 baseline)
Maersk’s Ocean: Reduction in carbon intensity (EEOI) by 2030 (2020 baseline) covers container vessels under Maersk’s operation. We report on reduction in carbon intensity using the EEOI (Energy Efficiency Operational Indicator) methodology. EEOI is defined by IMO in MEPC.1/ Circ.684 and is calculated as gCO₂/(Ton cargo x Nm). In practice we calculate EEOI on voyage level and aggregate it in the following way:
(g CO₂ voy1 + g CO₂ voy2 + g CO₂ voy3)
((Tonne cargo x Nm)voy 1+ (Tonne cargo x Nm)voy 2+ (Tonne cargo x Nm) voy 3)
The data sources are:
1. g CO₂ – Based on fuel consumption, from departure voyage 1, to departure voyage 2, multiplied with relevant CO₂ factor (3.114 for HFO, 3.206 for MDO and 0 for biofuels).
2. Tonne cargo – Calculated via draft and displacement tables, subtracting vessel weight and ballast water and fuel stock.
3. Nm – GPS distance from departure voyage 1, to departure voyage 2.
Ocean: Reduction in carbon intensity (EEOI) by 2030 is calculated as this year’s EEOI relative to the EEOI of the 2020 baseline.
3.3 Terminals: Reduction of absolute scope 1 and 2 emissions by 2030 (2020 baseline)
The reduction of scope 1 and 2 emissions from APM Terminals is calculated as the percentage reduction of scope 1 and 2 emissions during the year compared to the scope 1 and 2 emissions from APM Terminals in 2020.
57 Strategy and governance Progress on ESG Data and assurance Introduction Sustainability Report 2023
4.1 Air pollution
Air pollution is the amount of air pollutants emitted in relation to Maersk’s operations, besides GHG emissions. Air pollutants included are SOx, NOx, Non-Methane Volatile Organic Compounds (NMVOCs), Carbon monoxide (CO), Particulate Matter (PM10 and PM2.5, and Black Carbon (BC)). By default, PM10 includes smaller particles (such as PM2.5 and BC).
Air pollutants have been prepared and stated based on the first version of the Stockholm Environment Institute’s (SEI) reporting guide, except for BC and PM10 reporting from the fleet of Maersk, which is based on the methods outlined by IMO in MEPC 75/7/15 as our data availability allows for IMO’s more accurate assessment. In case of scrubber use, SOx pollutants are reported based on Clean Cargo guidelines, where SOx output is assumed to be maximum for the operating area in which the vessel spends 80% of time.
5.1 Waste
Waste is reported as the sum of all waste types generated.
5.2 Water
Water is reported as the sum of all water consumed, excluding ballast water and water for re-injection.
6.1 Spills
Spills is reported as the number of uncontained hydrocarbon liquids spills greater than 10 m3, resulting from any unintended, irreversible release associated with current operations.
6.2 Containers lost at sea
Containers lost at sea is based on the recorded number of containers (independent of size) lost at sea during the year. This includes containers lost at sea from own and time-chartered vessels, but does not include containers falling overboard in ports and other cases where containers will be picked up.
Accounting policies – social performance
7.1 Number of employees
Number of employees is the number of headcounts with an employment contract with Maersk who are on payroll regardless of the type of contract at year end. Excluded are employees on garden leave
and unpaid leave, contractors, and third-party workers. Number of employees is based on registrations in Maersk’s HR systems.
7.2 Employee Engagement Survey score in the 75th percentile of global norm
The Employee Engagement Survey score in the 75th percentile of global norm is calculated as Maersk’s aggregated ranking in the top quartile (75% or above) of employee engagement relative to Maersk’s survey vendors’ global organisational employee engagement norm. Gallup is Maersk’s main Employee Engagement Survey provider covering 97% of employees in scope while one other provider covers the remaining share of Maersk employees in scope.The overall employee employee engagement percentile score is calculated as the average (mean) of the two respective percentile scores weighted by the total respondents for each survey. Employees in Maersk Supply Services (MSS) are not included in the score as MSS was divested before the Employee Engagement Survey was performed in Q4 2023.
7.3 Gender – female/total
Gender – female over total is the percentage of women employed based on headcount. Headcount definition is outlined in 7.1 Number of employees.
7.4 Women in management
Women in management is the percentage of women at job levels 4, 5, 6, 7, 8 and 9, corresponding to Managers, Senior Managers, Leaders, Senior Leaders, and Executives, compared to total headcount of the same levels. Headcount definition is outlined in 7.1 Number of employees.
7.5 Women in leadership
Women in leadership is the percentage of women at job levels 6, 7, 8 and 9, corresponding to Leaders, Senior Leaders, and Executives, compared to total headcount of the same levels. Headcount definition is outlined in 7.1 Number of employees.
7.7 Target nationalities in executive leadership
Target nationalities in leadership is the percentage of leaders with nonhigh-income OECD nationalities at job levels 8 and 9, corresponding to Executives, compared to total headcount of the same levels. Headcount definition is outlined in 7.1 Number of employees.
7.8 Fatalities
Fatalities is the headcount number of work-related accidents leading to the death of the employee regardless of time between injury and death.
7.9 Lost-time injury frequency
Lost-time injury frequency is the number of lost-time injuries per million exposure hours. A work-related injury, which results in an individual being unable to return to work and carry out any of his/her duties within 24 hours following the injury, unless caused by delays in getting medical treatment.
Excluded from LTIs are suicide or attempted suicide, ‘natural causes’, incidents during the commute to and from the regular place of work and incidents which occur off the ship, but where the consequences appear onboard at some later time. Exposure hours are the total number of work hours in which an employee is exposed to work related hazards and risks. Leave and non-work-related sickness are excluded from exposure hours.
7.6 Target nationalities/total
Target nationalities over total is the percentage of target nationalities with non-high-income OECD nationalities employed based on headcount. Headcount definition is outlined in 7.1 Number of employees.
7.10 Learning Teams completed following a High Potential Incident Learning Teams completed following a High Potential Incident is calculated as the share of Learning Teams completed following a High Potential Incident has been recorded. The number of High Potential Incidents and Learning Teams completed is based on reporting by Brands and maintained and quality assured by the Group Safety & Resilience team of Maersk. To give the organisation sufficient time to complete a learning team and maintain completeness in our reporting, the reporting period is 31 October in the previous year to 31 October in the reporting year, i.e. for 2023 the reporting period is 31 October 2022 - 31 October 2023. A high potential incident may be exempted from conducting a learning team in cases where a full-scale investigation has been carried out by internal or external parties, or the involved parties are outside APMM operational control, or legal circumstances does not allow to engage due to a legal investigation, or due to recurrence of an incident for which a Learning Team has been completed previously. A Learning Team is defined as a group of workers brought together to: discuss
58 Strategy and governance Progress on ESG Data and assurance Introduction Sustainability Report 2023
specific work, identify performance influencing conditions that make safe work difficult and specify suggestions for improvement. A High Potential Incident is defined as safety incident with a potential severity of 4 or higher Maersk’s HSSE Brand-specific risk assessment matrices.
7.11 Global Leadership (top 1,200 leaders) upskilled in Maersk Safety & Security Principles
Global Leadership (top 1,200 leaders, i.e. leaders in Job Level 6+) upskilled in Maersk’s Safety & Security Principles is the percentage of APMM Global Leadership (Job Level 6+ leaders) that have been upskilled in Maersk’s safety and security principles by completing the Lead with Care Senior Leaders e-learning programme. Job Level 6+ leaders correspond to Leaders, Senior Leaders, and Executives, compared to total headcount of the same level. Excluded are leaders (Job Level 6+) on long-term leave that have outstanding training on the day of final annual reporting, leaders (Job Level 6+) that have joined Maersk within two months before the day of final annual reporting, and leaders (Job Level 6+) working in companies newly acquired by Maersk within twelve months before the day of final annual reporting.
7.12 Employee relations and labour rights training
Employee relations and labour rights training is the completion rate of employees in scope for the Employee relations and labour rights e-learning out of the total employee population in scope. The employees in scope for the e-learning in 2023 are active white-collar Maersk employees. This excludes white-collar employees on long-term leave, consultants and employees that have joined Maersk after 31 October in the reporting year. The completion rate is based on registrations in Maersk’s Learning Management system.
Accounting policies – governance performance
8.1 Code of conduct training
Code of Conduct training is the completion rate of employees in scope for the Maersk Code of Conduct e-learning out of the total employee population in scope. The employees in scope for the e-learning in 2023 are active white-collar Maersk employees. This excludes white-collar employees on long-term leave, consultants and employees that have joined Maersk after 31 October in the reporting year. The completion rate is based on registrations in Maersk’s Learning Management system.
8.2
% of operations covered by a risk assessment on compliance and business ethics risks
% of operations covered by a risk assessment on compliance and business ethics risks is the percentage of entities that have completed the risk assessment survey on compliance and business ethics risks during the year when the assessment is rolled out. The groupwide risk assessment is carried out every second year with the latest one completed in 2023. The % of operations covered by a risk assessment on compliance and business ethics risks is based on the records from Maersk’s Global Entity Management System, considering owned or controlled operational entities and based on the brands in scope organisational structure.
8.3 Whistleblower cases
Whistleblower cases is the number of whistleblower cases recorded in Maersk’s whistleblower system during the year. All cases are recorded in Maersk’s whistleblower system irrespective of who makes a misconduct report, or how such a report is received, including via telephone, e-mail, Maersk’s whistleblower system or audits. Whistleblower cases does not include cases reported via other channels such as Maersk’s Ombudsfunction.
8.4 Suppliers committing to Maersk Supplier Code of Conduct
Suppliers committing to Maersk Supplier Code of Conduct (CoC) is the percentage of existing valid contracts with active suppliers which include a sustainable procurement clause, a reference to Supplier CoC in the contract or a CoC acknowledgment document out of the total number of valid active supplier contracts. The Suppliers committing to Maersk Supplier CoC is based on registrations in Maersk’s Sustainable Procurement database, DocuSign Insights.
8.5 Tier 1 high-risk category/strategic suppliers undergoing ESG assessments
Tier 1 high-risk category/strategic suppliers undergoing ESG assessments is the share of Tier 1 high-risk and strategic suppliers that have undergone an ESG assessment out of the total number of Tier 1 high-risk category and strategic suppliers with valid contracts. The suppliers undergoing ESG assessments is based on registrations in database maintained by the Sustainable Procurement team.
8.6 High-risk category/strategic suppliers assessed with Improvement Plan successfully closed
High-risk category/strategic suppliers assessed with improvement plans successfully closed is the percentage of active high-risk category/ strategic suppliers with valid contracts that have successfully closed gaps observed within the agreed timelines through an improvement plan implementation out of the total high-risk category/strategic suppliers with improvement plans. The suppliers assessed with Improvement Plan successfully closed is based on registrations made in database maintained by the Sustainable Procurement team.
8.7 Procurement staff trained in Sustainable Procurement (SP)
Procurement staff trained in Sustainable Procurement is the completion rate off procurement employees in scope for the SP e-learning out of the total employee population in scope. The employees in scope for the e-learning in 2023 procurement employees in Maersk. This excludes procurement employees on long-term leave and procurement employees that have joined Maersk after 31 October in the reporting year. The completion rate is based on registrations in Maersk’s Learning Management system.
8.8 Data ethics training
Data ethics training is the completion rate of employees in scope for the Data ethics e-learning out of the total employee population in scope. The employees in scope for the e-learning in 2023 are active whitecollar Maersk employees. This excludes white-collar employees on long-term leave, consultants and employees that have joined Maersk after 31 October in the reporting year. The completion rate is based on registrations in Maersk’s Learning Management system.
Accounting policies – economic performance
9.1 Revenue
Revenue as presented in the Consolidated income statement of the Annual Report 2023.
9.2 EBIT
EBIT as presented in the Consolidated income statement of the Annual Report 2023.
59 Strategy and governance Progress on ESG Data and assurance Introduction Sustainability Report 2023
9.3 CAPEX
Capex as presented in the Consolidated cash flow statement and specified in Note 5.5 Cash flow specifications of the Annual Report 2023. This represents cash payments for intangible assets and property plant and equipment excluding acquisitions and divestments.
9.4 Tax for the year
Tax as presented in the Consolidated income statement of the Annual Report 2023.
10 EU Taxonomy accounting policies
In 2023, Maersk’s has continued to apply the climate change mitigation technical screening criteria when assessing its economic activities. As the EU Taxonomy regulation matures and evolves, we will change and align our reporting accordingly, which may also impact the taxonomy KPIs previously reported. Key changes from 2022 include use of total Opex (repair and maintenance) costs when calculating Maersk’s share of eligible Opex and inclusion of Maersk’s air freight activities as eligible following the release of the ‘EU Taxo 4’ package during 2023. This means that the reported share of eligible Opex (repair and maintenance) costs in 2023 are not 100% as in 2022 and that Maersk’s revenue, Capex and Opex (repair and maintenance) costs related to air freight have been recategorised to eligible in 2023 from non-eligible in 2022. Opex numbers for 2022 has not been restated. Moreover, we have in 2023 included Maersk warehouses under the ‘7.7 acquisition and ownership of buildings’ criteria. The EU Taxonomy regulation does not have specific criteria for warehousing activities, and hence we do not include revenue from our warehouses in Logistics and Services. However, we can and will retrofit and transition such buildings to be green in line with our SBTi roadmap. Thus we have included Capex and Opex from warehouses as eligible and will screen our investments and renovations in relation to warehouses for taxonomy alignment going forward. For 2023, we consider all the Capex and Opex related to warehouses as eligible, but not aligned under 7.7.
The EU Taxonomy reporting is based on the financial accounts and thus includes data from Martin Bencher Group and Grindrod Logistics, which is not included in the scope of the ESG performance data.
• taxonomy-eligible Capex¹ KPI (additions) = eligible Capex/ total Capex
• taxonomy-eligible Opex¹ KPI (repair and maintenance) = eligible Opex/ total Opex
Maersk’s process for determining taxonomy-eligible activities (the numerator of the taxonomy-eligibility KPIs) has followed a threestep approach:
1. Defining the economic activities that Maersk is engaged in within each of the segments across the Group
2. Assessing whether said activities are covered by the economic activity descriptions included in the EU Taxonomy Climate Delegated Act
3. Allocating revenue, Capex (additions) and Opex (repair and maintenance) according to the company’s overall assessment of whether an economic activity is eligible or not.
Firstly, determination of the share of economic activities in Maersk that are taxonomy-eligible is based on activity codes in the financial consolidation system, which also forms the basis for Maersk’s external financial reporting. As such, activity codes have been defined as an economic activity.
Secondly, based on the descriptions of what is registered on Maersk’s activity codes an assessment has been made of whether these activities are covered by the activity descriptions that are included in the EU Taxonomy Climate Delegated Act.
Thirdly, depending on whether the registrations are related to assets or processes associated with taxonomy-eligible economic activities, the revenue, Capex and Opex registered on these activity codes are assessed to be eligible or non-eligible and allocated accordingly.
• Total Opex related to repair and maintenance of eligible and noneligible assets.
The taxonomy-aligned KPIs have been calculated as:
• taxonomy-aligned revenue KPI = aligned revenue / total revenue
• taxonomy-aligned Capex KPI (additions) = aligned Capex/ total Capex
• taxonomy-aligned Opex KPI (repair and maintenance) = aligned Opex/total Opex
Maersk’s process for determining taxonomy-aligned activities (the numerator of the taxonomy KPIs) has been based on screening the identified eligible activities within each of the segments against the technical screening criteria for climate change mitigation.
For Ocean, revenue from aligned vessels has been prepared by applying an allocation key to total Ocean revenue. The allocation key is based on transport work from aligned vessels out of the total transport work during the year. Capex additions in relation to 1) existing aligned vessels; 2) expenditures for existing vessels undergone retrofitting that meet the technical screening criteria, and 3) milestone payments for ordered methanol vessels incurred during the year. Aligned Opex, is the repair and maintenance expenditures in relation to aligned vessels incurred during the year.
For Terminals, revenue from aligned electrified equipment has been prepared by applying an allocation key to total Terminal revenue. The allocation key is based on the carrying amount of aligned electrified equipment out of the total carrying amount of Terminal equipment. Aligned Capex (additions) is the Capex additions in relation to electrified equipment incurred during the year. Aligned Opex, is the repair and maintenance expenditures in relation to aligned electrified Terminal equipment incurred during the year.
The taxonomy-eligible KPIs have been calculated as:
• taxonomy-eligible revenue KPI = eligible revenue/ total revenue
The denominator for the eligibility KPIs has been defined as:
• Revenue as presented in the Consolidated income statement of the Annual Report 2023.
• Total Capex representing additions including additions from acquired companies as disclosed in Note 3.1 Intangible assets, Note 3.2 Property, plant and equipment and Note 3.3 Right-of-use assets of the Annual Report. Additions related to goodwill, customer relationship, concessions rights and concession leases are excluded from total Capex.
For Logistics & Services, revenue from aligned activities, which includes electrical trucking and rail freight, has been prepared based on the following approaches:
• Trains: Maersk does not currently own or lease trains, which means that there is no related Capex or Opex. The allocation of revenue is based on the share of transportation work from aligned electrical trains out of the total transportation work by train.
• Trucks: The preparation of the revenue, Capex and Opex KPIs is based on the separate accounting that is kept for the electric trucks.
The EU Taxonomy uses a narrow definition of Capex and Opex. Hence when referring to Capex, this only refers to Capex additions, and not all capital expenses, and when referring to Opex, this only refers to research and development, building renovation measures, short-term lease, maintenance and repair, and any other direct expenditures relating to the day-to-day servicing of assets of property, plant and equipment and not all operational expenses. For Maersk Opex is defined as the repair and maintenance expenses in relation to eligible and non-eligible activities. 60 Strategy and governance Progress on ESG Data and assurance Introduction Sustainability Report 2023
1
For Towage and Maritime Services, there are no aligned activities in Svitzer and other maritime services, except for certain activities in Maersk Supply Service (MSS). Revenue from aligned activities in MSS, which include enabling activities relating to Installation, maintenance and repair of renewable offshore wind parks, has been prepared based on incurred revenue from those projects. Aligned Capex (additions) relate to 1) existing service vessels which had undergone retrofitting that meet the technical screening criteria; 2) expenditures incurred in relation to an offshore electrical charging infrastructure project; and 3) milestone payments for an offshore wind turbine installer vessel. Data from MSS is included until the divestment date of 15 May 2023.
In 2023, the aligned revenue is related to Maersk customer contracts and the Capex aditions are related to property, plant and equipment. For more information and contextual information, refer to the Taxonomy tables on pp. 52-54.
Substantial contribution (SC)
We have assessed and documented compliance with the SC criteria relating to the eligible activities in scope for the taxonomy reporting of Maersk. We have screened for SC using the ‘Climate change mitigation’ criteria as the primary screening lens for all eligible activities. Only when we have been able to document compliance with one or more of the SC criteria, we have assessed an activity to be aligned in relation to substantial contribution. Consequently, if an activity fails to meet any of substantial contribution criteria, we have assessed that activity to be eligible, but not aligned and no Do no Significant Harm screening has been performed.
Do no significant harm (DNSH)
We have assessed and documented compliance with the DNSH criteria relating to the eligible activities in scope for for the taxonomy reporting of Maersk. Since we screen for substantial contribution for ‘Climate change mitigation’, we have screened our eligible activities for DNSH compliance with ‘Climate change adaptation’, ‘Sustainable use and protection of water and marine resources’, ‘Transition to a circular economy’, ‘Pollution prevention and control’ and ‘Protection and restoration of biodiversity and ecosystems’. Only when we have been able to document compliance with all applicable DNSH criteria, we have assessed an activity to be aligned. Consequently, if an activity fails to
meet one or more of the DNSH criteria, we have assessed that activity to be eligible, but not aligned.
Minimum safeguards
Maersk, and its subsidiaries, is committed to conducting business in a responsible and upright manner and to respect human rights across our activities, in line with the Maersk Values. We endorse the principles of the UN Guiding Principles on Business and Human Rights (UNGPs) and the OECD Guidelines for Multinational Enterprises. We commit to respect all internationally recognised human rights referenced in the International Bill of Human Rights and the ILO Declaration on Fundamental Principles and Rights at Work. These rights include core labour rights such as the rights of freedom of association and collective bargaining, the rights to not be subjected to forced labour, child labour or discrimination in respect of employment and occupation, and standards on working hours and the safety and health of workers. We implement our commitment to these via our Code of Conduct, and other internal policies and procedures. Maersk’s compliance with the Minimum Safeguards as outlined in the EU Taxonomy regulation, has been performed at a Group level and is based on the following assessment:
Human rights: The company is committed to conducting human rights due diligence (HRDD) as outlined in the UN Guiding Principles (UNGPs) and OECD Guidelines for Multinational Enterprises (MNEs). Please refer to Maersk’s Human Rights Policy here. Maersk continuously identifies and assesses human rights risks via relevant due diligence processes. In 2021 the company conducted a corporate-wide human rights assessment, please refer to the Sustainability Report 2021 and the Human rights chapter in this report for more information. Further, there is no indication that Maersk does not adequately implement HRDD resulting in human rights abuses, as the company has not been finally convicted in court cases on labour law or on human rights. Maersk is committed to engage with stakeholders through the mechanisms stated in the EU Taxonomy regulation, including OECD National Contact Points or the Business and Human Rights Resource Centre (BHRRC) and there are no signals that Maersk does not engage.
Corruption: Maersk has in place an anti-corruption policy and adequate internal controls, ethics and compliance programmes and measures for preventing and detecting bribery. Please refer to the Governance and Business ethics chapters of this report. In addition, none
of Maersk’s senior management, including the senior management of its subsidiaries, has been convicted in court of corruption.
Taxation: Tax is treated as an important topic of oversight, anchored with the highest governing bodies in Maersk, and the company has put in place adequate tax risk management strategies and processes as outlined in OECD MNE Guidelines covering tax. Furthermore, the company has not been found guilty of tax evasion.
Fair competition: The company promotes employee awareness of the importance of compliance with all applicable competition laws and regulations and does train senior management in relation to competition issues. Compliance with competition laws and regulations is a core part of Maersk’s Code of Conduct, which Maersk employees are trained in every year. Moreover, none of Maersk’s senior management members, including the senior management members of its subsidiaries, has been found in breach of competition laws.
Revolving Credit Facility KPI performance
11 Relative CO2 reduction (percentage vs. 2008 baseline)
Relative CO₂ reduction (percentage vs. 2008 baseline) covers container vessels under Maersk’s operation. We report on reduction in carbon intensity using the EEOI (Energy Efficiency Operational Indicator) methodology. EEOI is defined by IMO in MEPC.1/Circ.684 and is calculated as gCO₂/( metric tonnes cargo x Nm). In practice we calculate EEOI on voyage level and aggregate it in the following way:
(g CO₂ voy1 + g CO₂ voy2 + g CO₂ voy3) ((metric tonnes cargo x Nm)voy 1+ (metric tonnes cargo x Nm)voy 2+ (metric tonnes cargo x Nm)voy 3)
The data sources are:
• g CO₂ – based on fuel consumption, from departure voyage 1, to departure voyage 2, multiplied with relevant CO₂ factor (3.114 for HFO, 3.206 for MDO, 0.0 for biofuel).
• Metric tonnes cargo – calculated via draft and displacement tables including ballast water and fuel stock, subtracting lightweight.
• Nm – GPS distance from departure voyage 1, to departure voyage 2.
Relative CO₂ reduction (percentage vs. 2008 baseline) is calculated as this year’s EEOI relative to the EEOI of the 2008 baseline.
61 Strategy and governance Progress on ESG Data and assurance Introduction Sustainability Report 2023
Statement of the Board of Directors and the Executive Board
The Board of Directors and the Executive Board have today discussed and approved the Sustainability Report of A.P Møller - Mærsk A/S for 2023.
The ESG performance data in the Sustainability Report for 2023 has been prepared in accordance with the stated ESG performance data accounting policies.
In our opinion, the Sustainability Report for 2023 gives a fair presentation of A.P. Møller - Mærsk A/S sustainability activities and results of the company’s sustainability efforts in the reporting period as well as a balanced presentation of A.P. Møller - Mærsk A/S environmental, social and governance performance in accordance with the stated ESG performance data accounting policies.
Copenhagen, 8 February 2024
Executive Board
Vincent Clerc
CEO
Patrick Jany CFO
Board of Directors
Robert Mærsk Uggla Chair
Marc Engel Vice Chair
Bernard L. Bot
Marika Fredriksson
Arne Karlsson
Thomas Lindegaard Madsen
Amparo Moraleda
Kasper Rørsted
Julija Voitiekute
62 Strategy and governance Progress on ESG Data and assurance Introduction Sustainability Report 2023
Independent limited assurance report on the ESG performance data
To the stakeholders of A.P. Møller - Mærsk A/S
A.P. Møller - Mærsk A/S engaged us to provide limited assurance on the ESG performance data for the period 1 January - 31 December 2023 included in the 2023 Sustainability Report on pages 48-54 (the “ESG performance data”).
Our conclusion
Based on the procedures we performed and the evidence we obtained, nothing came to our attention that causes us not to believe that the ESG performance data for the period 1 January - 31 December 2023 are prepared, in all material respects, in accordance with the ESG performance data accounting policies developed by A.P. Møller - Mærsk A/S as stated on pages 55-61 (the “ESG performance data accounting policies”).
This conclusion is to be read in the context of what we state in the remainder of our report.
What we are assuring
The scope of our work was limited to assurance over ESG performance data for the period 1 January - 31 December 2023 on pages 48-54 in the 2023 Sustainability Report of A.P. Møller - Mærsk A/S.
Regarding reporting on Art. 8 of the EU Taxonomy Regulation on pages 52-54 in the 2023 Sustainability Report, we only provide limited assurance on whether the included data have been stated in accordance with the EU Taxonomy accounting policies as stated on pages 60-61, and not whether the data are in compliance with the EU regulation.
We express limited assurance in our conclusion.
Professional standards applied and level of assurance
We performed a limited assurance engagement in accordance with International Standard on Assurance Engagements 3000 (Revised) ‘Assurance Engagements other than Audits and Reviews of Historical Financial Information’ and, in respect of the greenhouse gas emissions, in accordance with International Standard on Assurance Engagements 3410 ‘Assurance engagements on greenhouse gas statements’. The quantification of greenhouse gas emissions is subject to inherent uncertainty because of incomplete scientific knowledge used to determine the emissions factors and the values needed to combine emissions of different gases.
A limited assurance engagement is substantially less in scope than a reasonable assurance engagement in relation to both the risk assessment procedures, including an understanding of internal control, and the procedures performed in response to the assessed risks; consequently, the level of assurance obtained in a limited assurance engagement is substantially lower than the assurance that would have been obtained had a reasonable assurance engagement been performed.
Our independence and quality control
We have complied with the independence requirements and other ethical requirements in the International Ethics Standards Board for Accountants’ International Code of Ethics for Professional Accountants (IESBA Code), which is founded on fundamental principles of integrity, objectivity, professional competence and due care, confidentiality and professional behaviour and ethical requirements applicable in Denmark.
PricewaterhouseCoopers applies International Standard on Quality Management 1, ISQM 1, which requires the firm to design, implement and operate a system of quality management including policies or procedures regarding compliance with ethical requirements, professional standards and applicable legal and regulatory requirements.
Our work was carried out by an independent multidisciplinary team with experience in sustainability reporting and assurance.
Understanding reporting and measurement methodologies
The ESG performance data need to be read and understood together with the ESG performance data accounting policies. The ESG performance data accounting policies used for the preparation of the ESG performance data are accounting policies developed by the company, which Management is solely responsible for selecting and applying. The absence of a significant body of established practice on which to draw to evaluate and measure sustainability data allows for different, but acceptable, measurement techniques and can affect comparability between entities and over time.
Work performed
We are required to plan and perform our work in order to consider the risk of material misstatement of the ESG performance data. In doing so and based on our professional judgement, we:
• Performed an assessment of materiality and the selection of topics for the ESG performance data;
• Read and evaluated reporting guidelines and selected internal control procedures regarding the ESG performance data;
• Made inquiries and conducted interviews with management with responsibility for management and reporting of the ESG performance data to assess reporting and consolidation process, use of company-wide systems and controls performed;
• Performed limited substantive testing on a sample basis to underlying documentation and evaluated the appropriateness of quantification methods and compliance with the ESG performance data accounting policies for preparing ESG performance data at corporate head office and in relation to selected reporting sites;
• Performed analytical review and trend explanation of the ESG performance data; and
• Evaluated the obtained evidence.
Statement on other sustainability information mentioned in the report Management is responsible for other sustainability information communicated in the 2023 Sustainability Report. The other sustainability information on pages 2-46 of the 2023 Sustainability Report comprises the sections ‘Introduction’, ‘Strategy and governance’ and ‘Progress on ESG’.
Our conclusion on the ESG performance data on pages 48-54 does not cover the other sustainability information and we do not express an assurance conclusion thereon. In connection with our review of the ESG performance data, we read the other sustainability information in the 2023 Sustainability Report and, in doing so, considered whether the other sustainability information is materially inconsistent with the ESG performance data, our knowledge obtained in the review or otherwise appear to be materially misstated. We have nothing to report in this regard.
Management’s responsibilities
Management of A.P. Møller - Maersk A/S is responsible for:
• Designing, implementing and maintaining internal control over information relevant to the preparation of the ESG performance data in the 2023
Sustainability Report that are free from material misstatement, whether due to fraud or error;
• Establishing objective ESG performance data accounting policies for preparing the ESG performance data;
• Measuring and reporting the information in the ESG performance data based on the ESG performance data accounting policies; and
• The content of the Sustainability Report.
Our responsibility
We are responsible for:
• Planning and performing the engagement to obtain limited assurance about whether the ESG performance data for the period 1 January – 31 December 2023 are prepared, in all material respects, in accordance with the ESG performance data accounting policies;
• Forming an independent conclusion, based on the procedures performed and the evidence obtained; and
• Reporting our conclusion to the stakeholders of A.P. Møller - Mærsk A/S.
Hellerup, 8 February 2024
Lars Baungaard
State Authorised Public Accountant mne23331
Søren Ørjan Jensen
State Authorised Public Accountant mne33226
63
and governance Progress on ESG Data and assurance Introduction Sustainability Report 2023
Strategy
Stay up to date Reporting universe
A.P. Moller - Maersk provides a suite of additional reports and supplementary information to provide a comprehensive and transparent information to all stakeholders, which can be downloaded here:

We value your feedback
We welcome any questions, comments or suggestions you might have to this report and our performance.
Please send your feedback to:
A.P. Moller - Maersk
Esplanaden 50
1098 Copenhagen K
Denmark
Attn: Sustainability
You can also send an email to: sustainability@maersk.com
Editors
Lene Bjørn Serpa
Katrine Juhl Jespersen
Philip Lewin
Theresia Molander
Creative editor
Brian Borup
Maersk engages with prioritised ESG ratings as shown below. We value transparency and feedback, which helps us to improve on the most material ESG aspects.


Photographs
Cover: Drone Rune
p. 4, 5, 11, 17, 32, 42, 44, 47: Ture Andersen
p. 4, 30, 35, 37: A. P. Moller - Maersk
p. 16: Christoph Maderer
p. 18: C&F media, Young Ok Choi and Hyung Jin Lee
p. 25: Concepcion Boo Arias
p. 27: Courtesy of The Panama Canal Authority
p. 38: Chintu Alakhnarayan Yadav
p. 39, 43: Shutterstock
p. 41: Tom Lindboe
p. 46: Rafael Duarte
ESG data and reporting
Frederik Bo Rementorp
Alina Koriakina
Theresia Molander

Design and layout
SPRING Production

Investor
with
and
Corporate website Press
Sustainability Online Engage
us News
Reporting
64
and governance
on
Data and assurance Introduction Sustainability Report 2023
Strategy
Progress
ESG
A.P. Møller - Mærsk A/S Esplanaden 50, DK–1098 Copenhagen K +45 33 63 33 63 Company reg. no. 22756214 www.maersk.com
UNILABS
The CSR Section from Unilabs’ Annual Report for 2023 is enclosed on the next pages.
A.P. MØLLER HOLDING A/S CSR REPORT 2023 72

STATEMENT OF CORPORATE SOCIAL RESPONSIBILITY ACCORDING TO THE DANISH FINANCIAL STATEMENTS ACT, SECTIONS
99A, 99B, AND 99D
Statutory statement on CSR in accordance with section 99a of the Danish Financial Statements Act
Business Model
For the Unilabs business model, refer to the key activities as mentioned above
Corporate Social Responsibility
Unilabs’ mission for a healthier tomorrow underpins our aspiration to help millions of people to maximise their lives by empowering them to manage their health, delivered through socially and environmentally responsible laboratory, imaging and pathology diagnostic services. In 2023, Unilabs began future-proofing for a changing environment with growing sustainability concerns and shifting market and patient preferences.
In the following paragraphs, Unilabs presents a summary of its Corporate Social Responsibility (CSR) activities and ambitions undertaken in 2023, serving as the foundation for the development of an ESG strategy and fulfilling the ESG reporting requirements Unilabs Management is fully committed to continuously work towards reducing environmental footprint from operations, promoting a socially responsible business culture, and ensuring a sustainable growth path for the company.
Risk Assessment and Policies
Environment and Climate Change: Unilabs’ impact on environmental issues and climate change was further assessed through an external Carbon Footprint Assessment, using 2022 data. As an outcome, a Greenhouse Gas Emissions inventory (GHG Inventory) was developed, understanding Unilabs’ emissions divided by scope. Management has assessed that about 6% of emissions were under Unilabs’ operational control (Scope 1 and 2), and 94% are due to the purchase of goods and services (Scope 3).
Emissions directly connected to operations, were mainly arising from own facilities, including laboratories, collection centres, and offices and emissions resulting from the transportation of samples for testing. Further emissions were related to generation of biohazardous waste from laboratories and those associated with pure water utilization from medical devices Unilabs is committed to develop and implement a plan that will reduce the overall footprint over time, aiming for a net-zero impact in the long run. Maintaining a focus on these impacts is critical from a strategic perspective to ensure sustainable growth and deliver low-carbon products and services to customers.
In 2023, two programs were put in place that will drive a significant reduction over time towards a net zero footprint: 1) Fleet Electrification and 2) Renewable Electricity Sourcing.
Our logistics, without adding those emissions from our suppliers, currently accounts for nearly 30% of the GHG emissions under our control, and Management believes that transitioning to a low-carbon fleet model will reduce these externalities. The Unilabs fleet is being converted from vehicles with combustion engines to electricity. In 2023, 10% of the fleet has been transitioned already. Our vision is that, through its natural fleet replacement cycle, where feasible, all Unilabs vehicles supporting logistics will be electric. Unilabs will also engage with third party carriers to move in the same direction.
During the GHG inventory exercise, it stood out that electricity consumption needed to be addressed to lower carbon footprint Management has decided to offset the emissions related to its electricity consumption, either by transitioning its sourcing contracts to Renewable Energy, or by purchasing corresponding Renewable Energy Credits on the voluntary market. Unilabs has already converted more than 15% towards a lower carbon emissions source.
Social and Employee Conditions: Promoting a diverse and respectful environment for employees and partners is a cornerstone of the business, as Unilabs seeks to generate a positive impact in the countries it operates in. To fulfil its aspirations, Unilabs strives to foster an inclusive corporate culture with equal opportunities, sponsoring respect and appreciation for diversity in a setting where every viewpoint counts.
Unilabs takes responsibility for employees’ health by adopting controls to reduce occupational risks at the facilities, thereby mitigating the risk of injuries and cases of illness by:
• Assessing workplace risks and developing action plans to address non-conformities found.
• Providing visibility of injuries and illnesses to the leadership teams, raising awareness of health and safety performance, and systematically addressing learning from events.
It is important to stress that local laws play a key role in health and safety matters, and one of Unilabs’ primary objectives and priorities is to ensure local compliance with each respective country’s applicable legislation. Unilabs has onboarded a dedicated HSESG Head (Health & Safety and ESG) in Q3 2023 and is in the process of harmonizing Health & Safety reporting to monitor progress and impact.
Unilabs continually strives to enhance customer and employee engagement. Key initiatives include:
• Acting upon insights gained from the yearly People Survey to enhance overall engagement across the business.
• Enhancing Unilabs’ culture through activities such as culture workshops, nomination of culture ambassadors, organization of local team events and team-building activities, and the development and execution of onboarding programs
• Upskill Unilabs associates and job satisfaction with improved processes, organization, and tools enabled by the multiyear system implementation initiatives in HR, Procurement, and Finance.
• Continuously improving communication through developing honest two-way communication.
The focus on employee wellbeing and development will continue in the years to come and progress on engagement will be measured through the annual People Survey that is planned to be conducted in the first half of 2024.
Finally on diversity and inclusion, Unilabs is developing a strategy on diversity, equity, and inclusion. Unilabs is proud to have gender parity with 60% women and 40% men in management positions.
Human Rights: Respecting Human Rights and continue to align our business practices to the UN Guiding Principles is important to Unilabs. Management considers the risk in relation to Human Rights low, and therefore to date no Human rights policy has been implemented.
Anti-corruption:, Unilabs has a zero-tolerance towards bribery and corruption. Unilabs has an anti-bribery and anti-corruption policy along with guidelines that outline the company’s standards of behaviour. Unilabs has enhanced its specific practices to manage conflict of interests, gifts, hospitality and entertainment, and is enhancing guidance around e-g- sponsorship and donations, including implementing due diligence checks with business partners and improving record-keeping. The anti-bribery and anticorruption policy aims to inform employees about bribery and corruption to prevent any misconduct. Unilabs has not identified any material risks Unilabs’ future goal is to further develop and monitor awareness-raising activities and training programs, ensuring its policy is fully integrated into its daily business and strategies.
In 2023, key employees and functions completed anti-corruption training to ensure full integration of Unilabs’ policy into its daily business and strategy Unilabs has a whistleblower hotline, which has been operational throughout 2023. No breaches of legislation or Unilabs policies on anti-corruption with material effects on the company have been identified. Unilabs will continue to improve relevant policies and procedures, including updating the code of business conduct for which a speak-up channel is in place. Unilabs issued a procedure on how to handle investigations following a whistleblowing report. Additionally, all employees participated in an online training.
STATUTORY STATEMENT REGARDING UNDERREPRESENTED GENDER IN ACCORDANCE WITH SECTION 99B OF THE DANISH FINANCIAL STATEMENTS
Unilabs sees diversity as a key asset, as outlined in the Code of Business Conduct. Unilabs has a diversity and equal opportunity policy that promotes an equitable, open, and diverse working environment. Below table represents Gender Representation on the Board of Directors:
• Target for Gender Representation on the Board of Directors: During 2023 a female board member was appointed. The Board has set a target to achieve gender parity (Danish definition) by 2026 at the latest.
• Policy for the Underrepresented Gender on Other Management Levels: Unilabs Group Holding ApS has fewer than 50 employees and is thus not required to state and report upon a policy to increase the number of the underrepresented gender in other management levels In 2023 Unilabs Group Holding ApS had 67% Women and 33% Men at other management levels (2022; 100% Men).
STATUTORY STATEMENT ON DATA ETHICS IN ACCORDANCE WITH SECTION 99D OF THE DANISH FINANCIAL STATEMENTS ACT
For Unilabs, data ethics is essentially about maintaining the trust of different stakeholders, including users, patients, consumers, customers, employees, and partners. Currently initiatives are mainly focused on advancing General Data Protection Regulation (GDPR) practices. This represents the starting point of our journey towards comprehensive data ethics practices across all Group entities to be prepared for compliance with evolving data ethics regulations
SIGNIFICANT UNCERTAINTIES RELATING TO RECOGNITION AND MEASUREMENT
There are no significant uncertainties with respect to recognition and measurement in the Annual Report
UNUSUAL EVENTS
There are no unusual events in the financial position on 31 December 2023 of Unilabs and the results of the activities of Unilabs for the financial year for 2023
Board Composition 2022 2023 Women 1 2 Men 5 4 Total 6 6 Underrepresented gender % 17% 33%
FAERCH
The Sustainability chapter from Faerch’s Annual Report for 2023 is enclosed on the next pages.
A.P. MØLLER HOLDING A/S CSR REPORT 2023 76
Laying the path for circularity
At Faerch, we focus on obtaining sustainable value creation. We identify the Sustainable Development Goals as our roadmap to align our company goals to serve the long-term growth of society. We do this by balancing short-term and long-term business priorities.
Our environmental, social and governance (ESG) performance is closely connected to our financial performance which is reflected in our four Ps framework: Planet, People, Principles of Governance and Prosperity.
We work consistently to integrate these four Ps in every aspect of our business and to improve in every dimension to push the bar for sustainable value creation even higher.
The following sections on sustainability includes reporting in accordance with Danish legislation “Danish Financial Statements Act” § 99(a).
Future proofing our business
Previous assessments of materiality have helped us identify and prioritise the sustainability issues that matter to our business and our stakeholders, from customers, consumers, and communities, to owners, suppliers, and employees. We have
assessed the most material impacts to Faerch – both where we impact the planet and society the most as well as where our business is mostly impacted by the world around us. The material risks and opportunities within the areas of ESG have been identified based on universal and industry standards and from interviews with various stakeholders both internally and externally.
We assessed 15 ESG topics as material and through our four Ps framework, we have prioritised programmes to ensure continuous improvements within these areas.
We are currently undergoing a double materiality assessment in preparation for the upcoming requirements of the Corporate Sustainability Reporting Directive (CSRD) coming into force for us in FY2025. This will provide even deeper insights into our impacts, risks, and opportunities, providing much-needed transparency to the market regarding the actual sustainability performance of all companies.
-
-
- Product quality & safety
In 2024, our focus will be on closing any gaps necessary for compliance with the CSRD and establishing the necessary data management system to produce an ESRS-compliant integrated report for 2025. The outcomes of our double materiality assessment will guide us in determining the prioritisation of our efforts.
CORPORATE ANNUAL REPORT 2023 INTRODUCING FAERCH GROUP PERFORMANCE HIGHLIGHTS KEY RISKS SUSTAINABILITY MANAGEMENT CONSOLIDATED STATEMENTS ADDITIONAL INFORMATION 42 136
Environmental PLANET Social PEOPLE Governance PRINCIPLES OF GOVERNANCE Profit PROSPERITY
Climate change
Energy
Impact of product materials
-
-
Water usage
Waste
Biodiversity and ecosystems
-
-
- Human capital development - Diversity, equity and inclusion
- Work safety
- Human & labour rights
- Sustainable procurement - Environmental and socioeconomic compliance
creation -
growth
Investment in new capabilities Race to Zero Support our Planet Unlock the Potential Protect the People Act with Responsibility PROGRAMME PROGRAMME II PROGRAMME III PROGRAMME IV PROGRAMME V
- Business ethics - Data security - Value
Profitable
-

PLANET ENVIRONMENTAL PEOPLE SOCIAL PROSPERITY PROFIT PRINCIPLES OFGOVERNANC E Race to Zero Support our Planet Unlock the Potential Protect the People Act with Responsibility PROGRAMME I PROGRAMME III PROGRAMME V PROGRAMME II PROGRAMME IV The four Ps framework Leading a true circular transition 43 136 CORPORATE ANNUAL REPORT 2023
Sustainability oversight
Governance of sustainability is anchored with the Board of Directors and the Executive Management Team. Ownership and responsibility to drive actions across the various categories are anchored in the business to ensure alignment with priorities and a long-term focus on sustainability. In 2024, we will assign a sponsor from the Executive Management Team for each material category identified in the ongoing double materiality assessment (in preparation forthe CSRD), ensuring the necessary anchoring to enable the necessary progress.
Across categories, a central Steering Committee (SteerCo), representing key corporate functions, ensures direction, coordination, and subject matter expertise.
Underlining our commitment to the integrated sustainable strategy, the Board of Directors has committed to aligning executive remuneration with key ESG targets.
As external expectations on sustainability issues continue to evolve and our efforts progress, we recognise that our priorities will evolve, and our target-setting and reporting will mature.
Direction Policy
Audit Committee
Risk Committee
Strategy Monitoring Reporting Coordination
Group Strategy
The Board of Directors Endorses sustainability as an integrated part of strategy review.
Executive Management Defines an integrated strategy and overseas implementation.
Group Sustainability
Facilitates and coordinates while keeping oversight, guiding and enabling category owners.
Nomination & Remuneration Committee
Category
Planet / Environmental
Responsible Action Plans
People / Social
Category Group owner
Human capital development HR
Diversity, equity and inclusion HR
Employee relations and conditions HR
Work safety HSQE
Product safety and quality Quality
Operations Business
Execution
CAPEX Committee
Group Finance
Principles of Governance
Category Group owner
Business ethics Legal
Sustainable procurement Procurement Data ethics and security IT
CORPORATE ANNUAL REPORT 2023 INTRODUCING FAERCH GROUP PERFORMANCE HIGHLIGHTS KEY RISKS SUSTAINABILITY MANAGEMENT CONSOLIDATED STATEMENTS ADDITIONAL INFORMATION 44 136
Group owner Energy Procurement
change ESG
and ecosystems ESG
Climate
Environment
units and operational levels are responsible for execution and to provide bottom up information for management,
reporting
monitoring and

45 136 CORPORATE ANNUAL REPORT 2023
Race to Zero
We all have an obligation to accelerate climate action. As a fast-growing, global company, the impact of our decarbonisation initiatives become even more effective. Faerch is committed to being a frontrunner within the food packaging industry to reach net zero emissions
as fast as possible.
Our commitments
In 2023, we submitted our Science Based Targets (SBTs) to underline our support to the Paris Agreement. Knowing that our scaling of mechanical recycling is crucial for reducing greenhouse gas emissions in food packaging, it stands at the core of our strategy to achieve net zero emissions. We always strive to be an industry leader in sustainability, which is reflected in our decision to set more ambitious targets than required. Our aim is to achieve net zero emissions across our entire value chain by 2040 at the latest, with a 50% reduction in emissions by 2030 compared to our base year (2022). We expect the SBTi validation process to be completed in Q1 2024.
Our road to net zero
To fulfil our net zero commitment, a complete transition to circular, low carbon input materials is required. This is a path we have been following for quite some time now with recycled PET from pots, tubs and trays from our own Recycling Division, and it aligns seamlessly with our existing business model as an integrated recycler. We have taken the next significant step on this path by establishing an additional recycling line at Cirrec, effectively tripling our recycling capacity.
In addition, we are close to having found the location for our next recycling centre. This facility will enable us to recycle 100,000 tonnes of household waste.
Besides recycled input material, renewable energy is our other must-win battle. In 2024, we will continue our efforts to close even more Power Purchase Agreements (PPA) to reach our target of powering all or sites with renewable energy by 2030. We anticipate signing at least 4-6 PPAs in the upcoming year.
Coverage of signed PPAs to provide renewable energy 23%
The percentage states how much our PPAs will cover out of our current electricity usage (530 GWh in 2023), when all PPA’s are fully operational. Some PPAs are already operational (7.5%), the rest will be from Jan. 2025 at the latest.
Energy efficiency in the Group Platform
To Faerch, the best energy is the energy saved, delivering not only emission reductions but also
cost savings. We will continue our work to use energy efficient technologies and to reduce our energy consumption with our “Power of Faerch” initiative, focusing on energy efficiency. Based on our pilot projects run in 2023 at selected sites in collaboration with external partners, we will evaluate the possibility of extending these solutions to the wider Group, in alignment with our Group Platform mindset. Together with other initiatives, this will allow us to set clear guidelines on how Faerch sites can enhance energy and cost efficiency. It is essential to acknowledge that sites should have the flexibility to choose solutions that best suit their specific needs.
Supplier engagement and transport packaging
Over 63% of our carbon emissions are tied to our purchased goods. In line with our business strategy, we will scale our recycling business to ensure that we are able to provide low carbon input material. In addition, we will work with our suppliers to reach our goals and ambitions. In 2024, we will work further with developing a comprehensive Supplier Engagement Programme. We will assess our suppliers and split them into two groups: High emitters and low emitters. Initially, our focus will be on engaging with high emitters, primarily
CORPORATE ANNUAL REPORT 2023 INTRODUCING FAERCH GROUP PERFORMANCE HIGHLIGHTS KEY RISKS SUSTAINABILITY MANAGEMENT CONSOLIDATED STATEMENTS ADDITIONAL INFORMATION 46 136
ENVIRONMENTAL SPEEDING UP CLIMATE ACTION PEOPLESOCIAL PROSPER TYPROFIT PRINCIPLES OFGOVERNANC E PLANET ENVIRONMENTAL AMBITION
ambition is to take climate action and reach net zero emissions by creating circular loops, to ensure low-carbon rigid food packaging, and prolong shelf-life through high quality materials lowering emissions by minimising food waste. We want our operations to be powered by 100% renewable energy obtained through Power Purchase Agreements and on-site solar panels to provide additional renewable energy to the electricity grid. POLICIES Sustainability Policy Travel Policy TARGETS 2025 · Signed Power Purchase Agreements (PPAs) for all sites 2030 Reduced absolute scope 1, 2 and 3 GHG emissions 50% from a 2022 base year Powered by 100% renewable energy through off-site PPAs and on-site solar panels 2040 Reached net zero value chain GHG emissions from a 2022 base year
Our

47 136 CORPORATE ANNUAL REPORT 2023 GHG emissions across our value chain The GHG emission calculations follow the GHG Protocol reporting standards. Scope 1 emissions comprise of direct CO2e emissions from sources that are owned or controlled by Faerch A/S. Scope 2 emissions are based on consumed electricity, steam, heat and cooling. Of the 15 scope 3 categories in the GHG Protocol, only 10 categories are determined as applicable to Faerch’s business model and activities. The excluded categories are category 10: processing of sold products, category 11: use of sold products, category 13: downstream leased assets, category 14: franchises and category 15: investment. For more information please refer to note 6.4 on page 111-112. 1,278,542 tCO2e TOTAL SCOPE 3 SCOPE 1 1.1% (TOTAL) 85.0% (TOTAL) SCOPE 2 13.9% (TOTAL) SCOPE 3 64.1% 8.6% (ALL) PURCHASED WATER TRANSPORT PURCHASED GOODS AND SERVICES INCL. PRODUCTION SITES, SALES OFFICE ETC. HEAT, STEAM, COOLING AND ELECTRICITY STATIONARY COMBUSTION FUGITIVE EMISSIONS MOBILE COMBUSTION CUSTOMERS TRANSPORT END-OF-LIFE TREATMENT COLLECTION WASTE MANAGEMENT FACILITY RECYCLING SITE END USERS WASTE GENERATED IN OPERATIONS 0.6% 4.4% 0.1% EMPLOYEE COMMUTING BUSINESS TRAVEL LANDFILLED INCENERATION RECYCLING WASTE BALES TRANSPORT 0.7% Capital goods, upstream leased assets, and fuel and energy related activities not included in scope 1-2 account for 6.5%
being our resin suppliers, given the substantial quantities they provide. Our aim is to secure their commitment to support our targets and to encourage them to set their own Science Based Targets with the SBTi. Subsequently, we will proceed to engage with the low emitters, while also sharing our own experience with the SBTi validation process to accelerate their process. We will place special emphasis on our transport packaging, as we believe there is much to be gained from prioritising recycled and reused transport packaging both in terms of reducing emissions and minimising unnecessary packaging waste.
Our roadmap to net zero emissions
SCOPE 1 & 2
Own Operations
All sites powered by 100% renewable energy through PPAs and on-site solar panels
Initiate “Power of Faerch” to ensure continuous energy efficiency and reduction in consumption
Transition to electrical car fleet
Convert all forklift trucks and other equipment from fossil fuels to electrical/renewable fuel
Carbon footprint on products
In 2024, we will continue our efforts to further enhance transparency, addressing the growing customer requests concerning the carbon footprint and other environmental impacts of our products. By helping our customers decarbonise and assisting them in achieving their environmental targets, we will move closer to realising our ambition to transition the industry into a circular environment.
We want to unlock low carbon and circular solutions for our customers. Mono-PET from recycled
material is currently the material of choice being designed for circularity and naturally lower in carbon emissions compared to virgin material. Furthermore, we expect that emissions for recycled PET (rPET) will approach zero in the coming years, driven by greener and improved waste collection, sorting processes and recycling of PET material.
In 2024, we will finish the Life Cycle Assessment (LCA) of the recycled PET material being produced at our recycling plant, Cirrec. The preliminary assessment already indicates significant reductions in the overall environmental
score, particularly in the carbon footprint when compared to virgin material. In 2024, we will focus our efforts on communicating the environmental benefits of rPET from pots, tubs and trays. However, our commitment does not end here. We will persistently strive to further reduce the environmental impact of this rPET material. Furthermore, in planning new recycling facilities, we will integrate the lessons learned, ensuring that each new facility contributes to maximising the environmental benefits of mechanical recycling.
SCOPE 3
Value Chain Focus
Convert to low carbon input material by scaling our recycling business and engaging with suppliers
Begin transition to low carbon transportation using electrical trucks and vans or renewable fuels
Focus on increasing recyclable or reusable external packaging
Waste reduction and segregation for reuse and recycling
Delivering Net Zero
Together with our partners and customers, we will support and further develop a net zero food packaging sector of the future, with a wide array of low carbon and circular products. Active partnerships supporting circularity are essential to lower carbon footprint and to measure and manage the sustainability impacts of our value chain. We will balance any remaining emissions through trusted third party verified climate solutions that benefit society as whole.
CORPORATE ANNUAL REPORT 2023 INTRODUCING FAERCH GROUP PERFORMANCE HIGHLIGHTS KEY RISKS SUSTAINABILITY MANAGEMENT CONSOLIDATED STATEMENTS ADDITIONAL INFORMATION 48 136
2022 BASELINE 50% REDUCTION BY 2040 WE WANT TO REACH net zero 2030 2040
Committed to Science Based Targets initiative (SBTi) Net Zero Standard = Priorities
A step closer to 100% renewable energy consumption
Faerch has set an ambitious target of being 100% powered by renewable energy by 2030. This requires us to constantly focus on optimising energy efficiency. Our renewable energy procurement strategy is centred on signing Power Purchase Agreements (PPAs) and other initiatives such as energy efficiency projects and the installation of on-site solar panels.
In 2022, we signed our first PPA with Heartland for our site in Holstebro, Denmark. This agreement ensures that our site is now powered by renewable energy, sourced from Heartland’s solar park, located only 8 km away from the Danish factory. The solar park has 500.000 solar panels and generates more than 205 GWh. Fastforwarding to 2023, we have continued to advance our commitment to sustainability with the signing of additional PPAs, moving us steadily closer to our target of achieving 100% renewable energy consumption.
2023 progress
In 2023, Faerch signed a 10-year PPA with European Energy in the UK. The agreement is scheduled to commence in 2025 and will ensure a long-term commitment to renewable energy for Faerch. The agreement solidifies a partnership that will further bolster the renewable energy transition and support sustainability goals in
the Western Midlands region in the UK. With the PPA, Faerch will purchase 100% of the electricity generated by European Energy’s Bubney solar farm, located at the county of Shropshire.
In Poland, a 10-year PPA was signed with Better Energy to power operations with renewable energy from two solar parks. Poland’s increasing demand for energy and the country’s efforts to reduce carbon emissions have led to a growing need for renewable energy production. The Polanów and Postomino solar parks, owned and operated by Better Energy, are part of the solution to meet this demand and accelerate the transition to a more sustainable energy system in Poland.
“In Denmark, the UK, and Poland, the 10-year PPAs provide us with a stable and cost-effective source of renewable energy supply, allowing us to reduce our carbon footprint and meet our sustainability targets”, says Thomas Peter Vikkelsø Tranders, Group Director of Risk, Energy and Insurance.
“In 2023, we also signed an on-site solar PPA for Spain, Bunol, and we have several ongoing on-site solar negotiations pending together with PPA negotiations for France, Hungary, the Netherlands, Finland, Italy,
and Spain. When fully implemented, the offsite PPAs will cover 80-100% of our energy consumption with on-site solar panels covering the rest”, he says and continues:
“PPAs offer a stable and attractive price agreement, providing long-term cost certainty at Faerch. They also contribute to making new renewable energy projects financially viable for developers and lenders.”
“In addition to this, however, it is important to mention that Faerch is experiencing challenges with higher balancing and shaping costs in some European markets which may result in postponing certain PPAs until conditions are more reasonable and affordable.”
Faerch Group’s energy consumption is spread across 32 locations in 15 countries, and the annual consumption is reaching over 560 GWh. Faerch’s ambition is to have signed PPAs for all sites no later than the end of 2025 and for all PPAs to be fully implemented 1-2 years later for solar and 2-3 years for wind. This will bring Faerch in line with the overall 1.5°C ambition of the Paris Agreement for the Group’s scope 2 emissions.


CORPORATE ANNUAL REPORT 2023 INTRODUCING FAERCH GROUP PERFORMANCE HIGHLIGHTS KEY RISKS SUSTAINABILITY MANAGEMENT CONSOLIDATED STATEMENTS ADDITIONAL INFORMATION 136 49 CASE
Faerch’s flagship plant expansion paves the way for circular PET trays
Since 1969, Faerch has been a pioneer in the packaging industry, delivering high-quality solutions through investing in technology innovation and automation. We release 23.9 billion plastic items into the market annually, accounting for approximately 20% of the European market. This is a responsibility we take very seriously. And recognizing the limitations of the existing plastic recycling infrastructure, we understand the imperative of responsible resource being reborn. To bridge the gap, we have decided to go ahead and establish a recycling infrastructure ourselves to be sure to get the required recycled feedstock for our own plastic production. Committed to environmental stewardship, Faerch has taken on the role as the driving force in establishing a circular model for PET food packaging. We are on a mission to convert waste into valuable resources by pioneering advancements in recycling technology.
This commitment to circularity is demonstrated by the recent expansion of our flagship recycling plant in Duiven, Netherlands. Over the past five years, and through substantial investments, we have expanded Cirrec, the industry’s first EFSA approved PET recycling line for food packaging at scale. The newly installed tray recycling line in our state-of-the-art facility allows us to triple our recycling capacity to manage a total volume of 60,000 tonnes of pot, tub and tray
feedstock from post-consumer waste. This volume represents the circularity of PET trays in the Benelux market. It solidifies Faerch’s position as the frontrunner in the European PET food packaging recycling landscape and uniquely positions us as the only plastic producer with integrated recycling capacity. Through our process, food packaging can become new food packaging again and again.
With a finite global demand for plastic, redirecting high-quality materials like PET food packaging away from landfills or incineration is crucial. Taking full responsibility, we have invested significantly and will continue to do so, focusing on establishing the necessary recycling infrastructure to ensure that our PET packaging go in a circular loop, where the resources are transformed into new, like-for-like use products, thereby minimising the production of virgin plastics. Faerch remains firmly committed to continuously investing in European recycling infrastructure, steering the industry towards circular food packaging for PET.
Tripling our current capacity is just the start. Our endgame? Recycling at least the same quantity we introduce to the market. And we will continue to invest across Europe to make it happen. The journey has just begun.


CORPORATE ANNUAL REPORT 2023 INTRODUCING FAERCH GROUP PERFORMANCE HIGHLIGHTS KEY RISKS SUSTAINABILITY MANAGEMENT CONSOLIDATED STATEMENTS ADDITIONAL INFORMATION 50 136
CASE

You are invited to join us on April 18th, 2024, for the Grand Opening of Faerch’s Cirrec plant in Duiven, Netherlands.
We have made significant investments to fully scale our pioneer plant Cirrec - the industry’s first PET tray recycling line at scale, and it brings us immense pride to introduce our flagship plant to the broader industry and society. -
CORPORATE ANNUAL REPORT 2023 INTRODUCING FAERCH GROUP PERFORMANCE HIGHLIGHTS KEY RISKS SUSTAINABILITY MANAGEMENT CONSOLIDATED STATEMENTS ADDITIONAL INFORMATION 136 51 ANNOUNCEMENT SAVE THE DATE 18TH APRIL 2024 FAERCH.COM/GRAND-OPENING
for more
information about the event Transforming waste into valuable resources
Our ambition is to support our planet by minimising waste and create circular loops to decouple natural resource use from economic growth, reduce carbon emissions and protect our ecosystems, as no waste should ever end up in our water or nature regardless of material. We want to turn waste into a valuable resource.
Support our Planet
Waste, whether plastic or any other material, should never end up in nature or oceans. We aim to clean up waste streams by transforming tray waste into new trays, creating a circular loop that turns waste into a valuable resource. While we aspire to unlock this potential, we recognise that there is still much work to be done in improving the eco-design of food packaging in the market, refining waste infrastructure and fostering a culture that priorities responsible waste handling globally. ENVIRONMENTAL CIRCULARITY IS KEY
Material choice and design are essential to fully close the loop in food packaging. To transition into a circular economy, we need to see positive changes in product design from producers, waste management infrastructure from governments, and littering behaviour from end-consumers.
Eco-design is fundamental
To lead the transition to a circular economy within rigid food packaging, the availability of postconsumer household waste is crucial. However, this is one of our greatest challenges, as demand is significantly increasing, and plastic packaging collection rates are struggling to keep up. This makes it difficult to source sufficient household waste material of the right quality. However, we are seeing tailwinds from legislative initiatives that prioritise circularity, set to unfold in the upcoming years through taxes and Extended Producer Responsibility (EPR) schemes. These measures will incentivise the use of circular materials when designing packaging products. Coupled with our own efforts to scale recycling, we are securing a sustainable raw material input for the future. To encourage circularity and support the
availability of food packaging waste, it is important that we interact directly with retailers and customers to create closed loops through takeback systems.
Recycling waste streams
With our newly installed recycling line, our recycling business enables recycling of around
60,000 tonnes of PET household waste
The capacity is expected to grow in coming years in accordance with our business plan to scale up tray recycling.
it may not be preferred by the bottle industry. It is important to separate the two industries and products when it comes to design guidelines. In the recycling process, recycling of opaque PET is no more challenging than recycling transparent PET, provided in overall terms that the material is near-infrared (NIR) detectable and monoPET. In Cirrec, we are already recycling opaque PET as we have two output streams - one for coloured opaque PET and another for natural transparent PET. Through this process, the material fully retains its functionality without compromising food safety.
Going forward, we will continue to advocate for circularity in the market and embrace the need for opaque PET in food packaging, even though
If we want to achieve the outlined targets in the proposed Packaging and Packaging Waste Regulation, it is necessary to facilitate recycling of all packaging for PET food contact applications. Meeting these targets is impossible if only natural transparent food packaging is recycled. It is crucial to retain an opaque coloured PET recycling stream, as this type of food packaging has a higher tolerance for recycled content. Given the current levels of “difficult to recycle” materials, such as multi-layer materials in the PET
CORPORATE ANNUAL REPORT 2023 INTRODUCING FAERCH GROUP PERFORMANCE HIGHLIGHTS KEY RISKS SUSTAINABILITY MANAGEMENT CONSOLIDATED STATEMENTS ADDITIONAL INFORMATION 52 136
PEOPLESOCIAL PROSPER TYPROFIT PRINCIPLES OFGOVERNANC E PLANET ENVIRONMENTAL
AMBITION
POLICIES Sustainability Policy
Environmental, Health & Safety Policy TARGETS 2025 All sites to take the Operation Clean Sweep Pledge 2030 All packaging solutions designed for circularity Recycle more plastic than we sell
No production waste is sent for landfilling or incineration
Prevent pollution from production sites into air, water and soil Minimise waste of water through less consumption and more reuse
·
·
·
food packaging waste streams, retaining opaque coloured PET is essential to facilitate the effective outlet of recycled material. Furthermore, it is important to note that PET products requiring heat resistance, such as our CPET products, can only be in opaque PET. If opaque PET is not recognised as the fully circular material it is, we will not be able to have recycled content in these and large amount of valuable resource will be wasted. This not only interferes with our sustainability ambitions but also compels customers to opt for alternatives which can either only be downcycled and then adding more virgin material to the market or potentially higher environmental impact due to the manufacturing of the material.
Striving for less
Not all materials processed in our recycling plant meet the quality standards required for Faerch’s products. Some of them are not even suitable as recycled content in our products as they are not made of PET. The composition of the input waste bales processed in our recycling plant reflect how well household waste is sorted. The current waste stream is challenged by multi-materials that cannot be separated in the recycling process, impeding the circularity of the system.
Upcoming EU regulation will make the future waste streams much cleaner through improved sorting practices, higher demands for eco-design, and a harmonisation in product development. Consequently, this will lead to a substantial reduction in the output waste stream from our recycling business.
However, the regulation may be a long time coming. In the meantime, we will proactively engage in partnerships to secure that everything that can be recycled is recycled. For non-recyclable materials, often called “waste-of-waste”, we will ensure that they are repurposed as alternative fuels instead of being landfilled or simply incinerated. This will substitute fossil fuels and function as a stepping stone to minimise fossil-fuel dependency. For instance at our recycling site Cirrec, the “wasteof-waste” is used by our neighbour AVR to provide us with new energy for our recycling plant.
Environmental management
We want our food packaging operations to adopt circular practices, ensuring no production waste is sent to landfills or incinerated. Our commitment extends to preventing pollution going into air, soil, or water. We also aim to minimise waste of water by reducing water consumption and implementing water reuse whenever possible at our production sites.
The Faerch Circularity Ratio
Looking only at our PET volumes of 9 bn pieces sold, it corresponds to 1/3 of our PET products being truly circular 3 9
3 21
recycling platform
increase the Market Circularity Ratio
3/ 106
CORPORATE ANNUAL REPORT 2023 INTRODUCING FAERCH GROUP PERFORMANCE HIGHLIGHTS KEY RISKS SUSTAINABILITY MANAGEMENT CONSOLIDATED STATEMENTS ADDITIONAL INFORMATION 136 53
Currently, our installed recycling capacity will enable us to have an estimated 3 bn pieces of Faerch’s products being truly circular out of our total 21 bn pieces sold. In Europe, around 106 bn pieces of rigid food packaging are produced annually. We need to increase the Circularity Ratio in the market. This is why we open up our recycling platform for competitors to establish rPET from food packaging as a global commodity. For more information on the ratios, please refer to page 113.
Operation Clean Sweep
In 2019, Faerch joined Operation Clean Sweep, a dedicated programme aimed at preventing any plastic resin loss in resin handling operations. With our acquisitions of PACCOR and MCP USA, we will ensure that all our sites actively participate in and promptly implement this initiative, making sure we take the necessary measures to prevent the loss of plastic pellets, powder, and flakes into the environment.
Waste and water strategy
In 2024, we will outline a waste and water strategy, identifying initiatives for waste and water reduction. Additionally, we will establish new partnerships to ensure that our production waste is recycled.
We want our food packaging operations to adopt circular practices, ensuring no production waste is sent to landfills or incinerated.

CORPORATE ANNUAL REPORT 2023 INTRODUCING FAERCH GROUP PERFORMANCE HIGHLIGHTS KEY RISKS SUSTAINABILITY MANAGEMENT CONSOLIDATED STATEMENTS ADDITIONAL INFORMATION 54 136
Transforming food packaging circularity: An innovative partnership with supermarket giant Tesco
For years, Faerch has been steadfast in its commitment to achieving true circularity in food packaging. Through strategic investments in cutting-edge recycling technology and partnerships with industryleading retailers, Faerch has elevated circularity to new heights. In 2023, Faerch introduced a first-of-its-kind innovation in collaboration with supermarket chain Tesco. Tray 2 Tray by Faerch is a pioneering recycling initiative that establishes a closed loop-model for food packaging by transforming household kerbside-collected trays into food-grade packaging for Tesco’s core chilled ready meal range.
“We are determined to close the loop on our packaging – for it to be fully recyclable and contain recycled content wherever possible. We remain committed to reducing our environmental impact, and helping our customers to do the same, as we work together to protect our planet”, says Adele Kearns, Packaging Development Manager at Tesco.
Through the recycling partnership, Faerch and Tesco have established a circular approach to waste management that not only reduces waste but also conserves resources and minimises environmental impact associated with plastic packaging.
“Collaborating across the industry is essential for driving meaningful change. Since its launch, our tray-to-tray recycling partnership with Tesco has successfully transformed 1,300 tonnes of plastic into new food-grade packaging and we anticipate this positive impact to grow in the future”, says Jesper Emil Jensen, Regional CEO, Faerch UK & Europe North & South.
Collaborating with Tesco is a longstanding commitment. In 2021, the two companies joined forces to address the end-of-life challenges for Tesco’s back-of-store material waste. This resulted in the launch of Back of Store by Faerch, effectively repurposing rigid food packaging materials into new, food grade packaging after use.
“From the outset, our partnership with Tesco has been dedicated to establishing a circular loop for food packaging. By continuously refining our technologies and strengthening our recycling capabilities, we have moved closer to achieving our objective. We have become the first company to achieve largescale recycling of PET food packaging. Our circular recycling model marks a departure from the conventional linear take-makedispose approach, embracing a responsible and resource-conscious method in packaging production. This approach not only ensures
sustainability but also prevents valuable materials from being downcycled into nonfood applications.”, says Jesper Emil Jensen.
Reduce, reuse and recycle
PET food packaging recycling is made possible through Cirrec, a pivotal entity within the Faerch Group. Cirrec’s stateof-the-art recycling process transforms European household waste into raw material for food-safe packaging solutions. In 2023, Faerch invested in a state-of-the-art second tray recycling line, tripling Cirrec recycling capacity.
The environmental implications of the collaboration between Faerch and Tesco are far-reaching. By diverting plastic food trays from traditional disposal methods, the two companies are actively mitigating the climate footprint of their operations, aligning with the global imperative to address plastic pollution and promote a responsible approach to resource management.


CORPORATE ANNUAL REPORT 2023 INTRODUCING FAERCH GROUP PERFORMANCE HIGHLIGHTS KEY RISKS SUSTAINABILITY MANAGEMENT CONSOLIDATED STATEMENTS ADDITIONAL INFORMATION 136 55
CASE
Strengthening our US presence: Site expansion and U.S Plastics Pact membership
In a strategic move aimed at advancing our position as a global leader in sustainable rigid food packaging, Faerch significantly expanded our US production capacity in 2023. The expansion is carefully aligned with Faerch’s vision of providing the global food industry with high-quality food packaging solutions, all the while leading the transition towards a circular economy.
“In 2022, we successfully closed the acquisition of MCP USA, marking our entry into the US market. The expansion of the Portage facility is a strategic step in our long-term plan aimed at accelerating growth in the US. The investment has significantly strengthened the site’s capacity by an impressive 60 percent and stands as an important milestone in our journey to establish a solid US market presence”, says Spencer Johnston, CEO of Faerch North America and France.
The site expansion has included four new thermoformers, air compressors, an additional granulator, and a new production room. According to Operations Manager at the Portage site, Jared Brubaker, the increased capacity introduces new capabilities, reinforcing the company’s product offerings:
“The upgrade fulfils a long-awaited need for capacity at our facility, enabling us to enhance our product offerings. Our previous plant capacity ranged between 180-200 million pieces per year. With the addition of the new lines, we have increased our capacity to add between 100-200 million pieces”.
Looking ahead, we are reinforcing our commitment to sustained growth in the US. The objective is to improve market coverage and secure a position similar to the success in Europe.
“The US market presents great potential for growth. The upgrade of equipment and technology will facilitate the integration of the Portage site into the Faerch thermoforming platform which is a crucial step for us to push material conversion. Looking ahead, we remain committed to ongoing investments in our platforms and sites to strengthen our market position. This approach will enable us to continuously improve our product offerings and support our US customers on their journey towards sustainable food packaging solutions”, says Spencer Johnston.
Faerch joins the U.S. Plastics Pact
For years, Faerch has been committed to taking the lead on circularity in food packaging. With an average use of 57% post-consumer
recycled content in our PET packaging, Faerch leads by example. Through its integrated recycling capacity, food packaging go through a transformative cycle, being recycled back into new food-safe packaging after use. In 2023, Faerch achieved an important milestone in pushing the circular agenda in the US by signing the U.S. Plastics Pacts.
“Addressing plastic waste is a global challenge that requires collaborative efforts at both regional and local levels. No single business can effectively tackle the complexities of plastic waste alone. We need the entire industry to unite in transforming our current packaging system. Through our participation in the U.S. Plastics Pact, Faerch commits to supporting a set of ambitious targets, aiming to establish a system that retains plastic within the economy and out of the environment”, says Olivier Laigre, Head of Group External Affairs at Faerch.
The U.S. Plastics Pact in short
The U.S. Plastics Pact (U.S. Pact) is unifying stakeholders across the entire plastics value chain to rethink the way plastics are designed, used, and reused. The aim is to keep plastics in the economy and out of the environment.


CORPORATE ANNUAL REPORT 2023 INTRODUCING FAERCH GROUP PERFORMANCE HIGHLIGHTS KEY RISKS SUSTAINABILITY MANAGEMENT CONSOLIDATED STATEMENTS ADDITIONAL INFORMATION 56 136 CASE

Arla Foods replaces PP pots for recyclable rPET
In 2023, Faerch worked with European dairy cooperative Arla Foods to move its crème fraiche, skyr and protein 200 ml pots from PP to a fully recyclable container, made of 100% post-consumer recycled PET. The move is estimated to save approximately 67 million pieces of unrecycled plastic, supporting Arla Foods’ global goal of achieving 100% recyclable packaging from 2025, with no fossil-based virgin plastic by 2030.
“To curb plastic waste, we must accelerate the transition towards a circular economy. This involves keeping plastic products at their peak value throughout their lifecycle rather than allowing them to be discarded and downgraded after use. By moving into mono-material rPET, Arla Foods has taken an important step to meet ambitious sustainability goals, and we are proud to part of their journey”, says Jamie Clark, Group Key Account Director Dairy.
The new containers for Arla Foods are designed to be recycled back into food grade material after use, achieving a closed packaging loop.
“For years, polypropylene and polystyrene have been the preferred materials in the dairy market. With growing regulatory pressure, such as the UK Plastic Packaging Tax, and
consumers becoming increasingly aware of the environmental footprint of packaging, we are seeing more and more manufacturers moving towards packaging solutions designed for circularity”, Torben Nygaard Pedersen, Key Account Director says and continues:
“The revamp not only propels Arla Foods closer to achieving their 2030 targets, but also serves as a strategic measure to avoid the implications of plastic taxation. The rPET container is designed for recycling without compromising food safety, consumer convenience or shelf impact”.
The product launch will showcase a great collaborative effort, driving a positive change by rethinking product design. The container features an rPET inlet and an easily detachable cardboard wrap, combining the attractiveness of paper with the practical functionality of plastic. The first stage of the project was launched in December 2023 in Northern Europe and the UK.


CORPORATE ANNUAL REPORT 2023 INTRODUCING FAERCH GROUP PERFORMANCE HIGHLIGHTS KEY RISKS SUSTAINABILITY MANAGEMENT CONSOLIDATED STATEMENTS ADDITIONAL INFORMATION 136 57
CASE
Our ambition is to ensure that everyone can fulfil their potential with integrity and equality. We aim to empower our team through a dynamic learning environment. Our commitment to inclusion involves enhancing diversity training and fostering a workplace where every individual feels valued. We pledge to cultivate a culture of collaboration, innovation, and purpose-driven values with transparent and open communication.
Unlock the Potential
In recent years, our company has experienced rapid growth, marked by the acquisitions of PACCOR and MCP USA, as well as the expansion of our recycling business. The increased size and broader geographical reach of the Group necessitate a re-evaluation of our organisational structure and a recalibration of our approach to steering a larger organisation. With MCP USA and our PACCOR site in Excelsior Springs serving as hubs for growth in the US market, we are gaining momentum in upscaling our Recycling Division. The merger of legacy Faerch and PACCOR structures aims to harness the strengths of both organisations, streamline decision-making, and enhance our focus on circularity, innovation, and cost leadership.
We have made it our mission to provide our people with security and support in challenging times and in the course of the largest acquisition in our history. Our focus remains on the development of our employees by creating and offering opportunities for growth.
The following sections on social includes reporting in accordance with Danish legislation “Danish Financial Statements Act” § 99(b).
Becoming a part of Faerch, becoming ONE group
Rapid growth within a year from approx. 2,500 employees to a company size of now more than 5,400 employees in 19 countries can entail both risks and opportunities. Cultures, values and management principles must be taken into account in an international context. In addition, the main focus is on offering PACCOR employees new perspectives within the Faerch Group, recognising their potential and gradually integrating them into the new teams. To meet the requirements of a global company of this size and its employees, the Talent Acquisition, Compensation and Benefits and People and Organisational Development departments have been strengthened. This will ensure faster and more consistent integration of new talent and new systems in the countries. To this end, we are adapting HR structures and processes, updating platforms and aligning and elevating guidelines to a common Group-wide standard.
We are in process of establishing our new job architecture and title structure to ensure a systematic approach to roles, responsibilities, and job titles. The implementation will create clarity and transparency within the organisation regarding our organisational structure and career path opportunities. At the same time, it
will guarantee alignment and fairness for our employees, ensuring employees with identical roles and responsibilities are treated equally. Finally, our job architecture will be connected to our remuneration policy and reward model. This will help to ensure that we are in sync with market developments, and that we can provide a clear framework for the organisation on how roles, responsibilities and job titles are linked to benefits and salary in Faerch Group.
The People Factor Platform
It is in our DNA to protect what defines us as a company - our culture, our values and our people. We are a people business. It is therefore extremely important that we commit to a uniform standard in the area of work and employee satisfaction across all countries and locations. To this end, we implemented the People Factor Platform in 2022;

INTRODUCING FAERCH GROUP PERFORMANCE HIGHLIGHTS KEY RISKS SUSTAINABILITY MANAGEMENT CONSOLIDATED STATEMENTS ADDITIONAL INFORMATION
SOCIAL A PEOPLE BUSINESS 58 136 CORPORATE ANNUAL REPORT 2023 PLANET ENVIRONMENTAL PEOPLESOCIAL PROSPER TYPROFIT PRINCIPLES OFGOVERNANC E
AMBITION
POLICIES Employee Development Policy Policy for Gender Balance in Management TARGETS 2025 Minimum 27% women on the two management layers below the Board Maintain a minimum of two Board members of the underrepresented gender 2028
Minimum 33% women on the two management layers below the Board
·
a best-practice platform with 51 items aiming to promote a uniform standard across all locations. We want to be and remain the employer of choice.
The focus is on state-of-the-art factories, a safe and pleasant working environment, appropriate and effective onboarding, training, and an open, inclusive culture free from prejudice and discrimination in all areas of the company.
With 19 sites out of 32 having been successfully introduced into the People Factor Platform and an average of 58% of items completed in 2023, we were able to take a major step towards uniform standards for all our employees. Now that all Faerch locations and two PACCOR locations have been initiated, we will continue this positive development in 2024 in close cooperation with local management across the other acquired locations. In view of the integration of many PACCOR colleagues, we will also focus on “Working Environment”, “Being part of the team” and “Communication”.
Succession Planning and Feeding System
Our successful product portfolio is the result of the expertise of skilled people whom we consistently support and nurture. 2023 was therefore dominated by the further development of our feeding system in order to meet the
requirements of the growing organisation, processes and our employees across all locations.
With systematic succession planning, we ensure smooth management changes and develop qualified employees to take on new areas of responsibility or fill critical positions. With an enhanced approach to identifying such positions, linked to the organisation’s strategic objectives, we mitigate Faerch’s business risks associated with the departure of key people from critical positions. We have already integrated the system into our acquired companies to ensure that we incorporate all talent into our feeding system.
Our clear development strategy of good performers and high potentials not only encourages employee engagement, but also provides a cost-effective approach to leadership development. In this way, we promote a culture of innovation and adaptability within the organisation. In Legacy Faerch we achieved 41.2% internal recruitment (male, 62.9% and female 37.1%). As there is no comprehensive data from PACCOR, Group functions that have been filled by PACCOR employees are excluded.
Leadership Development
Leadership is the cornerstone of a sustainable company. Our leaders are the driver of
Fostering a great working environment
“As Chief People Officer of our combined organisations, I am committed to fostering a working environment based on the principles of safety, unwavering support and continuous development of our people. By championing these principles, we will not only attract top talent, but also create an environment where every employee can thrive and contribute their best to the success of our business. Together, we will set new standards for organisational sustainability.”


CORPORATE ANNUAL REPORT 2023 INTRODUCING FAERCH GROUP PERFORMANCE HIGHLIGHTS KEY RISKS SUSTAINABILITY MANAGEMENT CONSOLIDATED STATEMENTS ADDITIONAL INFORMATION 136 59
Karina Kviesgård Hounisen Group CPO
STATEMENT
culture and change. In 2024, we will continue to focus on a common and in-depth understanding of the Faerch Leadership Values across all senior positions and all sites. We will promote a clear leadership vision based on our culture, leadership principles and leadership expectations to not just align but deeply anchor the Faerch Way of Leading. We will also prepare our top managers for the requirements of the newly established organisation in a comprehensive management development programme. We will promote a culture of a global mindset and local responsibility, giving our managers the tools they need to transform into a combined future.
Graduate Programme
Our young talents of today are our specialists and leaders of tomorrow. We are proud of the young talents we have been able to accompany on their way into the professional world through our Future Faerch Generation programme. We will continue to ensure that young talents have access to a career at Faerch through internships and case studies.
People drive our products - embracing Diversity, Equity and Inclusion
At Faerch, we recognise the immense value that a diverse, equitable, and inclusive workplace
brings to our organisation, our employees, and our broader community. We foster a collaborative and supportive environment that promotes equal opportunities and empowers individuals to bring their authentic selves to work, leading to higher engagement and overall success. In 2024, we will facilitate our leadership team to be educated in diversity and bias trainings to recognise discrimination, properly address diverse needs and to adapt to changing circumstances. This involves inclusive and diverse successor planning and recruitment processes.
Gender Balance in Management
A focus area for Faerch is the promotion of gender balance in leadership roles. In 2023, 25% of our executive management positions are held by women. The share of women at the two management levels below the Board of Faerch has decreased from 25% to 20% mainly because the number of males increased (+11), whereas number of females remained the same.
This development is primarily caused by the new organisational structure where Managing Directors in PACCOR are now reporting into an EMT member which was not the case last year.
In the process of fully integrating the PACCOR organisation into our new organisational structure, we have unfortunately not succeeded in effectively implementing our focus to increase the share of female in our two management layers below the Board in 2023, the focus has been on integrating the PACCOR organisation and thereby no further activities has been started to reach the target of minimum composition in 2025. With the new structure now in place, we remain positive that it is possible to increase the share of female representation in these management layers as we now have a better platform for driving this more systematic across the entire organisation.
Looking into gender composition for the entire management group, the share of females increased from 25% to 27% compared to 2022. We will take this achievement to further concentrate on building up a stronger female successor pipeline for leading roles.
As we look ahead, Faerch remains steadfast in our commitment to continuous improvement in the realm of diversity, equity, and inclusion. We are dedicated to expanding our training programmes, refining our recruitment strategies, and implementing data-driven approaches to measure our progress.

CORPORATE ANNUAL REPORT 2023 INTRODUCING FAERCH GROUP PERFORMANCE HIGHLIGHTS KEY RISKS SUSTAINABILITY MANAGEMENT CONSOLIDATED STATEMENTS ADDITIONAL INFORMATION 60 136
PERFORMANCE HIGHLIGHTS 2023
Enhanced approach
new system integrated
With an enhanced approach to identifying critical positions we mitigate Faerch’s business risks associated with the departure of key people from critical positions. We have integrated the new system into our acquired companies to ensure that we incorporate all talent into our feeding system.
Members of the Board - gender composition*
The two management layers below the Board - gender composition**
People Factor Platform - areas completed
58%
We implemented the People Factor Platform in 2022. Since then with 19 sites out of 32 initiated and an average of 58% of areas completed in 2023, we were able to take a major step towards uniform standards for all our employees. We will continue this positive development in 2024 in close cooperation with local management across the other acquired locations.
* The gender composition of shareholder-elected board members in percentage. Equality has been achieved in the top management according to the definition provided by the Danish Business Authority. 6 members were elected on the General Meeting and the remaining 3 members were elected by the employees.
** The gender composition in percentage at the the two management layers below the Board, meaning our Executive Management Team (EMT) and people with personnel responsibilities who report directly to the EMT.
The 8 members of the Executive Management has been elected on the General Meeting.
CORPORATE ANNUAL REPORT 2023 INTRODUCING FAERCH GROUP PERFORMANCE HIGHLIGHTS KEY RISKS SUSTAINABILITY MANAGEMENT CONSOLIDATED STATEMENTS ADDITIONAL INFORMATION 136 61
Minimum composition 2025 Minimum composition 2025 Performance 2023 33% 67% 33% 67% 27% 73% 20% 80%
Performance
2023
From consultant to Senior Product Manager
Meet Michelle Barbesgaard
At Faerch, we are dedicated to nurturing personal and professional growth. Michelle Barbesgaard joined our team in September 2021. Her journey evolved from a consultancy role to Senior Product Manager in Group Product Management. Since joining Faerch, her responsibilities and dedication steadily expanded.
Michelle’s journey to a management position Michelle’s journey at Faerch is marked by key milestones. From Commercial Development to Group Digitalisation, where she played a pivotal role in designing and implementing SAP IBP.
Returning from maternity leave in May 2023, Michelle became Market Insights Manager in Group Strategy & Product Management. In September 2023, she embraced the role of Senior Product Manager, finding fulfilment in multidisciplinary tasks and collaboration across departments.
Faerch has a clear development strategy and Michelle’s journey showcases that the company works systematically to enhance internal recruitment and leadership development. Michelle has shown a commitment to understanding Faerch’s history and operations. Her proactive approach to learning and her effective internal networking skills have been key factors in her professional growth.
“It was a great opportunity for me to challenge myself, expand my professional skills and to take on greater responsibilities. My hope is to contribute to sustaining Faerch’s position as a leader in both product innovation and cost-effectiveness,” says Michelle.

Faerch, being a large international company, perfectly matches my professional growth aspirations. I am inspired by the company’s values, strategic vision, and unwavering commitment to achieve true circularity in food packaging, and I am proud to contribute to this meaningful journey.
MICHELLE BARBESGAARD

CORPORATE ANNUAL REPORT 2023 INTRODUCING FAERCH GROUP PERFORMANCE HIGHLIGHTS KEY RISKS SUSTAINABILITY MANAGEMENT CONSOLIDATED STATEMENTS ADDITIONAL INFORMATION 62 136
PORTRAIT
Faerch provided a dynamic learning environment that not only improved my analytical skills in understanding risk factors and risk management but also elevated my skills within the financial decisionmaking process.
AMANI HASSAN
Kickstarting a career in finance Meet Amani Hassan
Young talents of today are our specialists and leaders of tomorrow. Amani Hassan joined our Future Faerch Generation Programme in August 2023 after graduating with a master’s degree in finance and international business from Aarhus BSS. Amani turned to Faerch to combine learning with hands-on practical work.
A journey of growth and opportunity
In the Graduate Programme, Amani began in the Finance department focusing on treasury tasks. During the Programme, Amani’s role grew to include Environmental, Social, and Governance (ESG) tasks, showcasing how achieving ESG milestones could positively impact Faerch’s investment opportunities. She is now looking to gain an international experience in one of our global business units.
Learning in a supportive environment
Reflecting on her time at Faerch, Amani believes that the experience has empowered her to effectively convey complex financial information during meetings, both in local and international contexts.
“I believe it’s crucial to ask questions and embrace mistakes. It’s part of the learning experience. The supportive environment at Faerch creates a safe space where everyone is ready to guide and assist. The extensive opportunities for self and skill development within the company are a testament to the nurturing culture at Faerch. It is a culture that fosters growth and exploration.”
Talents of today – specialists and leaders of tomorrow
Faerch is evolving at pace, and to achieve our ambition and business targets, we are constantly looking for new talents to join our team. The Future Faerch Generation Programme is designed to attract graduates and to accelerate personal and professional development. From day one, candidates will experience real responsibility and hands-on challenges, while being supported by industry experts in an international business environment.


CORPORATE ANNUAL REPORT 2023 INTRODUCING FAERCH GROUP PERFORMANCE HIGHLIGHTS KEY RISKS SUSTAINABILITY MANAGEMENT CONSOLIDATED STATEMENTS ADDITIONAL INFORMATION 136 63
PORTRAIT
Our ambition is to protect all people in our value chain. Our customers and end-users with products of the highest quality, and by demanding fundamental human and labor rights for the workers in our supply chain. For our own workforce we remain dedicated to promote a culture of safe behavior that reaches beyond compliance. We work systematically to prevent work-related injuries and monitor our health and safety performance through safety reporting and third party management certification.
Protect the People
Our commitment involves transitioning from a reactive to a proactive approach to enhance safety. The primary purpose is to intensify our efforts in identifying and mitigating potential risks associated with unsafe conditions, behaviours, and activities. The proactive stance aims to reduce the likelihood of associated risks, contributing to a safer and more secure working environment.
Fostering a strong safety culture is essential to enhance our safety performance. In this respect, both individual and collective responsibilities are necessary. We focus on implementing engaging safety activities that anticipate and prevent potential risks. Our commitment involves refining safeguards and fostering a safetyoriented culture through consistent iteration and improvement.
Safety as a capacity
Through the acquisitions of PACCOR and MCP USA, our organisation has experienced significant growth, doubling both the number of manufacturing sites and employees. With this expansion, it has become imperative to establish a uniform and standardised safety approach across the entire Group.
Recognising the need for dedicated resources, we took a proactive step at the beginning of the
year by appointing a Group Safety Lead. The Group Safety Lead plays a key role in facilitating continuous and consistent risk assessments and actively promoting and ensuring safety across the organisation.
Since the appointment, specific areas for improvement have been identified and assessed and a Corporate Safety Network structure has been proposed. In 2024, actions will be implemented to translate the identified areas into tangible safety enhancements across our facilities. These actions will involve:
- Cultivating leadership presence and allocating dedicated resources at both Group and individual site levels.
- Establishing a proactive mindset by applying leading indicators.
- Developing and implementing standardised and targeted training programmes.
Empowering our safety organisation
Employee engagement is essential in enhancing our health and safety performance. It is crucial for all employees, including temporary workers and contractors, to be well-informed about safety risks and fully committed to taking appropriate action.
In 2023, we strategically appointed 5 dedicated safety ambassadors who now act as local
advocates, actively promoting safety awareness and adherence to protocol. These ambassadors employ best practices to support our safety personnel across all 32 sites, thereby contributing to strengthening our safety framework. In 2024, we are planning to expand our safety ambassador programme, further enhancing safety performance.
With our expansion, new opportunities unfold. The growth has broadened our competence and capabilities, laying the foundation for improving our overall Group safety performance. By harnessing and exchanging experiences and knowhow across our 32 sites, we have the potential to establish a powerful safety network in which we can proactively address potential hazards, refine safety protocols, and continuously improve and strengthen our measures and guidelines.
Looking ahead, resource allocation will remain an important priority. We will focus on educating our people through the development and implementation of standardised safety training. This initiative aims to ensure that employees across all facilities receive uniform training and information, fostering a consistent safety culture. At the same time, to ensure an effective safety framework, we will focus on strengthening our processes and tools.
INTRODUCING FAERCH GROUP PERFORMANCE HIGHLIGHTS KEY RISKS SUSTAINABILITY MANAGEMENT CONSOLIDATED STATEMENTS ADDITIONAL INFORMATION
SOCIAL SAFETY FOR EVERYONE PLANET ENVIRONMENTAL PEOPLESOCIAL PROSPER TYPROFIT PRINCIPLES OFGOVERNANC E CORPORATE ANNUAL REPORT 2023 64 136
AMBITION
POLICIES
Human
Health Promotion Policy TARGETS 2024 Reduce Lost Time Injury Frequency Rate (LTIFR) to 6.6
sites to be covered by an integrated Safety Management System
Environmental, Health and Safety Policy Sustainability Policy
Rights Policy
All
Risk assessments
We acknowledge the importance of consistently assessing and iterating hazards to identify possible High Potential risks (HiPos) and ensure that such risks are protected by technical safeguards. In 2024, we are planning to strengthen our safety performance by consistently assessing critical risks. This involves conducting thorough audits of existing safeguards and tracking the implementation of improvement plans.
One management system
Our health and safety management system aims to support our ambitions, and it contains policies that defines responsibilities and obligations to ensure systematic approach for protecting the health and safety of our employees.
By 2025, all our sites are to be covered by the health and safety management system. As of 2023, 18 out of 32 sites have been on-boarded to the system. We will continue the process of including the remaining sites to ensure a shared and natural integration of our health and safety, quality, and environment ambitions in the daily work across the group.
Lost Time Injuries
We apply the Lost Time Injury Frequency Rate (LTIFR) as a key metric to evaluate our safety performance. Last year, we set a goal to reduce the rate to 7.5. In 2023, the LTIFR frequency rate declined from 9.4 to 8.5. While we have not yet achieved our set target, we are making progress. The actions proposed for implementation in 2024 are anticipated to drive additional progress. Therefore, our aim for the coming year is to further reduce LTIFR to 6.6, reflecting our continuous commitment to sustain a preventive and systematic approach to safety.
Improving safety reporting
In 2022, we introduced a new incident reporting system, Assure, allowing us to easily report and capture data. The increased amount of data generated through the system has provided us with a comprehensive view of the health and safety performance across the Group. This insight enables us to identify patterns, providing a solid foundation for strengthening our health and safety initiatives and focus across all sites. As we progress into 2024, enhancing health and safety measures remains a key objective for our organisation.
Appointed
8.5 5 safety ambassadors
to promote a strong safety culture
Appointed a dedicated
Group Safety Lead
to oversee and prioritise safety practices
CORPORATE ANNUAL REPORT 2023 INTRODUCING FAERCH GROUP PERFORMANCE HIGHLIGHTS KEY RISKS SUSTAINABILITY MANAGEMENT CONSOLIDATED STATEMENTS ADDITIONAL INFORMATION 136 65
PERFORMANCE HIGHLIGHTS 2023
Time Injury Frequency Rate
Lost
of
The LTIFR is the reported number of accidents with absence per million nominal working hours. For more information please refer to page 114.
We are committed to act as a proper and responsible Group at all times and conduct our activities in a financially, environmentally, and socially responsible way with transparent business practices and high ethical standards. This means imposing strict requirements on ourselves as well as our business partners through internal and external policies, procedures and guidelines. POLICIES
Modern slavery policy
· Anti-corruption policy
Fair competition policy
· Supplier Code of Conduct
Whistleblower policy
· Trade compliance policy
Act with Responsibility
Fair competition and anti-corruption
We fully support international and national anticorruption and fair competition efforts, and we are dedicated to uphold the highest standards of integrity and business ethics among our employees and business partners, with a zerotolerance policy towards any form of corruption and anti-competitive behaviour.
Faerch against prosecution and contribute to a fair and healthy market.
During 2023, Faerch and PACCOR implemented a harmonisation initiative for compliance policies focusing on anti-corruption and fair competition measures.
Data Ethics
Human rights policy
· Procurement policy Gifts policy
· Privacy policy Tax policy
· IPR policy
2024
Alignment of the compliance structures with new acquisitions (PACCOR and MCP USA)
Awareness campaign of whistleblower scheme
2025
Implement procedures to comply with EU’s Corporate Sustainability Reporting Directive and prepare for EU’s Corporate Sustainability Due Diligence
By implementing guidelines, policies, compliance procedures, e-learning courses and conducting on-site trainings for officers and employees, Faerch actively fights inappropriate business conduct.
In 2023, 103 employees were trained on-site in anti-corruption and fair competition. During past years, a total of 501 employees have received on-site training, including most of our officers, directors, managers, sales and procurement personnel. The on-site training typically takes place in smaller groups of 5-15 employees to facilitate productive discussions.
Additionally, over the past years, a total of 663 employees have completed an e-learning training course in anti-corruption law and 575 employees have completed an e-learning training course in competition law. The training enables employees to e.g. execute business negotiations, attend meetings and social events with knowledge and understanding of basic competition and anticorruption law to protect both themselves and
The following section includes reporting on data ethics as per Section 99(d) of the Danish Financial Statements Act.
The responsible use of data is an enabler for Faerch’s business model. In line with our core values we strive to ethically manage and use data, with business relations, employees and others trusting that the we use their data appropriately. To avoid abuse and privacy infringement issues, and to safeguard the Faerch from legal, business and reputational risks, it is vital to manage and control the storage and use of employees’ and business relations’ data ethically correct.
At Faerch, we process personal data in different areas. To support our officers’ and employees’ understanding of personal data and how to deal with such, Group Legal has implemented a GDPR e-learning course. A total of 895 employees have completed the GDPR e-learning course.
Furthermore, Group Legal has several GDPR procedures to ensure basic data subject rights, e.g., the right to access personal data, to rectify personal data, and to erase personal data. Any such requests from data subjects will be handled and answered by Group Legal.
Faerch has e.g. policies as well as technical and organisational measures to ensure i) that personal data is not accidentally or illegally destroyed, lost or changed, ii) that unauthorised persons do not get access to personal data and (iii) that personal data is not processed in breach of GDPR in any other way.
Overall, personal data is deleted when storage of such is no longer needed for the intended and legitimate purposes. In 2024, Group Legal will continue to focus on overseeing and improving Faerch’s compliance programme, including harmonisation of policies and internal guidelines.
Our comprehensive e-learning course in cyberand information security also provides training to employees on how to properly handle data and improve information security. Together with our Least Privilege Access principle where users and devices are only granted the minimum level of access permissions required to perform necessary tasks (mitigating risks such as insider threats, unauthorized access and lateral movement within the network). Additionally, the
INTRODUCING FAERCH GROUP PERFORMANCE HIGHLIGHTS KEY RISKS SUSTAINABILITY MANAGEMENT CONSOLIDATED STATEMENTS ADDITIONAL INFORMATION
PLANET ENVIRONMENTAL PEOPLESOCIAL PROSPER TYPROFIT PRINCIPLES OFGOVERNANC E GOVERNANCE 136 66 CORPORATE ANNUAL REPORT 2023
AMBITION
TARGETS
increased focus and use of AI worldwide caused Faerch to issue guidelines on the use of AI in 2023 so employees are better suited in their use of such services in daily operations.
No formal data ethics policy has been adopted yet due to the strong existing data governance, but it will be included in a formal IT and cybersecurity policy - with accompanying governance measures - that has been under preparation end of 2023 with expected implementation during 2024.
Whistleblower scheme
Faerch’s governance programme is designed to identify and prevent serious offences and criminal acts. However, even the most effective compliance procedures cannot fully protect against every conceivable situation.
Consequently, we have implemented a whistleblower scheme in cooperation with a renowned Danish top-tier law firm enabling employees and business partners to report suspicions or knowledge of unethical and/or criminal conduct (on anonymous basis if desired). The scheme includes whistleblower units on entity level with the purpose of investigating any whistleblower filings. It is ensured that investigators in whistleblower units are – and remain - impartial. If, during the investigations and assessments performed by the law firm
and the first level of the whistleblower unit, it is ascertained that a whistleblower filing should be further dealt with, such filing will be reported to impartial members of management for further assessment and action - constituting level 2 of the whistleblower unit.
The whistleblower scheme was extensively updated in 2023 due to (i) various implementations in the EU member states and (ii) onboarding of the PACCOR entities to Faerch’s whistleblower scheme. The whistleblower scheme is accessible through Faerch’s websites. Employees have been informed of the scheme and where to find it during compliance training and in internal announcements. In 2024, an awareness campaign will be launched.
During 2023, six whistleblower filings have been made. Three of these filings where substantiated and actions were consequently taken in response.
Supplier Code of Conduct and CSDDD
Faerch conducts business in a conscious way and follows the ten principles of the UN Global Compact. To ensure that our suppliers adhere to the same standards as us, Faerch has previously developed a ‘Supplier Code of Conduct’ which reflects these ten principles from the UN Global Compact covering human rights, labour rights, the environment and anti-corruption. The code has been accepted and signed by +500 suppliers.
Each Site Director and Procurement employee of Faerch is responsible for ensuring that new suppliers sign Faerch’s ‘Supplier Code of Conduct’, while also ensuring that all signed Code of Conducts are stored. The “Supplier Code of Conduct” will be updated and harmonised across the Group in 2024.
In addition to the “Supplier Code of Conduct”, PACCOR has implemented a Supplier Onboarding Process with the purpose of obtaining (additional) relevant information for the due diligence of suppliers which will e.g. help to secure fundamental human rights and labour rights and thereby protecting workers in the value chain. The Supplier Onboarding Process has been widely used in 2023, preparing the German entities for the German Supply Chain Act in 2024. Shortly, the Supplier Onboarding Process will be implemented across the Group, thereby preparing us for EU’s Corporate Sustainability Due Diligence Directive (CSDDD).
We recognise our responsibility to continuously improve the quality and effectiveness of human rights, labour rights, environmental and anticorruption due diligence across operations and business relationships.
Other matters
In 2023, additional compliance initiatives have included e.g. the procurement of a monitoring
system for relevant local legislations in selected countries. This measure will help to further systematise local compliance. Further tests of this will be performed during 2024. 0
Reported cases of corruption
2019-2022: 0 cases
Reported cases of unfair competition
Reported cases of gifts over EUR 200
2019-2022: 0 cases
Reported whistleblower cases
0 1
6
CORPORATE ANNUAL REPORT 2023 INTRODUCING FAERCH GROUP PERFORMANCE HIGHLIGHTS KEY RISKS SUSTAINABILITY MANAGEMENT CONSOLIDATED STATEMENTS ADDITIONAL INFORMATION 136 67
2019: 0 cases / 2020: 3 cases / 2021: 1 case / 2022: 3 cases 2019: 0 cases / 2020: 3 cases / 2021: 1 case / 2022: 3 cases PERFORMANCE HIGHLIGHTS 2023
MAERSK PRODUCT TANKERS
The Sustainability chapter from Maersk Product Tanker’s Annual Report for 2023 is enclosed on the next pages.
A.P. MØLLER HOLDING A/S CSR REPORT 2023 103
SUSTAINABILITY
The shipping industry plays a critical role in providing the world with a reliable supply of energy. It is an efficient and dependable mode of transportation that enables people and economies to thrive.
The industry, by its very nature, is global with multiple stakeholders in its supply chain. Its impact on people and the planet comes with a responsibility to consider and promote the integration of economic, social and environmental activities into core business practices.
Maersk Product Tankers’ business model is focused on the ownership of tanker vessels and the safe, reliable transportation of energy products globally through the partnership with Maersk Tankers as commercial and corporate manager and Synergy Group as technical manager.
As values-led companies, Maersk Tankers and Maersk Product Tankers are committed to the United Nations Global Compact (UNGC) principles on human rights, labour, anti-corruption, and the environment. The health and safety of employees, as well as the safety of vessels and cargoes, continue to be of the highest priority. Both Maersk Tankers and Synergy Group are members of various partnerships that are actively seeking to ensure safe and sustainable shipping. This includes being a committed United Nations Global Compact signatory and member of Getting to Zero Coalition, the Maritime Anti-Corruption Network, and the Singapore Shipping Association.
Maersk Product Tankers depends and relies on the policies, actions and results of Maersk Tankers andSynergy Group. However, this does not diminish the importance of sustainability to Maersk Product Tankers. The various sustainability areas – climate, social and employee responsibility, human rights and anti-corruption – are in
the following addressed with references to policies, ongoing work and results within both Maersk Product Tankers and the partner organisations.
CLIMATE
Addressing climate change remains a priority for Maersk Product Tankers. As a significant player in global trade and a contributor to worldwide CO2 emissions, the shipping industry faces a continuous challenge to decarbonise and evolve sustainably.
This year, we have maintained our robust commitment to reducing emissions and enhancing operational efficiency. In 2023, Maersk Product Tankers’ fleet emissions have shown a notable decrease, now 31% lower than in 2008 (29.8 % in 2022), as measured on the Energy Efficiency Operational Indicator (EEOI). The EEOI is an industry-wide measure of CO2 emissions per unit of cargo, expressed as g/tonne-mile.
This result was achieved by trading the vessels as part of Maersk Tankers’ large-scale set-up, a change in the fleet composition due to the sale of older vessels, and by investing further in the fuel efficiency of our vessels.
In our pursuit to cut emissions, we ensure our vessels maintain their fuel efficiency and optimise performance. As part of this, a total of 13 vessels dry docked in 2023. Based on the vessels’ voyage profile, premium hull coatings were applied to further enhance hull performance and improve fuel efficiency.
The collaboration between Maersk Product Tankers and its partners, including Njord, has been instrumental in driving fuel efficiency performance and sharing technical expertise. Together, we have
applied 20 different technologies and 300 installations across the fleet, significantly enhancing efficiency.
Additionally, our use of the ZeroNorth digital platform across our entire fleet has been crucial in ensuring vessels sail at optimal speeds, further cutting fuel consumption.
Through Maersk Tankers, we are also committed to transparency in reporting our vessels' emissions, adhering to the Sea Cargo Charter's guidelines. This transparency is vital for demonstrating our progress and commitment to stakeholders.
We remain dedicated to leveraging our expertise in vessel management and technical know-how to make significant strides in reducing CO2 emissions and contributing to a more sustainable shipping industry.
SAFETY
Protecting the safety and welfare of our seafarers remains our top priority. In 2023, three cases of personal injury were recorded on board MPT vessels, compared to four cases recorded in the previous year 2022. In 2023 we had a Total Recorded Case Frequency (TRCF) of 0.37 and a Lost Time Incident Frequency (LTIF) of 0.25.
Two significant events in 2023 were a Lost Time Incident (LTI) due to a severe head injury of a crew member while working onboard; and the tragic occurrence of a missing crew member at sea. In both cases Maersk Product Tankers, along with our technical managers have provided full support to the family members of the crew members, in accordance with the company Core Values. Lessons learnt from safety incidents are thoroughly analysed and shared within the Maersk Product Tankers fleet.
MAERSK PRODUCT TANKERS A/S MANAGEMENT REVIEW 9
There were no overboard spills during the year and we have been working closely with our TechnicalManagers, to strengthen our zeroharm commitment to the environment.
The marine industry is evolving and to keep up with the changing risk profile of the tanker industry, an updated SIRE programme (SIRE 2.0) is expected to be launched later in 2024. One of the main areas how SIRE 2.0 will incorporate human factors is how physical, psychological and social factors affect human interaction with equipment, processes, and other people. Our technical managers have been focusing on training personnel onboard and ashore in preparing for SIRE 2.0 inspections.
We retain our steadfast commitment to safety, and we keep our ambition of running zero-incident operations.
RESPONSIBLE BUSINESS
Conducting business in a responsible manner is imperative for Maersk Product Tankers. We remain steadfast in our commitment to eliminating corruption and ensuring compliance to sanctions, and laws and regulations, as well as safeguarding human rights.
To ensure the fleet is trading in compliance with sanctions, we are working with Maersk Tankers’ sanctions team of legal experts. They are monitoring geopolitical developments, so we can respond quickly when sanctions are introduced or changed. The industry has seen 12 new sanctions packages introduced by the EU (the latest in January 2024) in the wake of Russia’s invasion of Ukraine. To ensure compliance in our operations, the team is following procedures and usingscreeningtools.In2023, as aresult of thework, thefleet traded in compliance with these complex sanctions landscape.
We are taking measures to eliminate corruption, which undermines social and economic development in society and destabilises business. We take a zero-tolerance stand on corruption of any kind. Maersk Tankers is a member of the Maritime Anti-Corruption Network (MACN); the company works with anti-corruption
organisations; its code of conduct for third parties references its stance and expectations on anti-corruption and bribery; and its employees undertake mandatory anti-corruption training. Synergy Group has continued to ensure robust enforcement of its strict anticorruption policy, including zero-tolerance to facilitation payments.
As a company that operates globally, we have a large network of suppliers. We work with our strategic partners to ensure suppliers conduct business responsibly in accordance with international and own company standards. Maersk Tankers has, for example, in its Third-Party Code of Conduct set out minimum requirements for the Maersk Tankers business and all direct counterparties, including but not limited to customers, partners, suppliers, and all parties acting on behalf of Maersk Tankers in connection with vessels managed by Maersk Tankers. Maersk Tankers require that all counterparties operate in accordance with responsible business principles detailed in the Code of Conduct and in full compliance with all applicable laws and regulations. The Code of Conduct deals with business ethics, health and safety, environment, working conditions and employment practices, including human rights, and diversity, equity and inclusion.
Maersk Tankers progressed thework in 2023. Contracts withstrategic suppliers include a reference to the Third Party Code of Conduct or to the suppliers’ own equivalent if this is, as a minimum, on a par with the company’s standards. Together with Maersk Tankers and Synergy Group, we will continue the work to make our supply chain more sustainable, which includes asking suppliers to meet social and environmental requirements and ensuring procurement contracts reflect environmental concerns.
Maersk Product Tankers has nominated Synergy Denmark (part of Synergy Group) as the ISM (International Safety Management) manager for MPT fleet. In line with their responsibility to fulfil the safety management requirements of the ISM code, they also pay attention to the areas of risks and responsibility in ensuring human rights of seafarers as part of everyday business. Risks identified are addressed by ensuring compliance with the Maritime Labour
Convention and standards included in their policies related code of conduct and contractual obligations.
We have an unwavering commitment to sustainability and in close collaboration with our partner organisations we will continue to work to create a positive impact for society and the planet.
You can read about Maersk Tankers’ sustainability work at:
https://maersktankers.com/strategy/sustainability
DIVERSITY, EQUITY AND INCLUSION
We are committed to diversity, equity, and inclusion and believe in the value it brings as a catalyst for innovation which the shipping industry needs in finding new solutions to complex challenges such as climate change.
The dedicated work of Maersk Tankers, our commercial and corporate manager as well as strategic partner, in this area over the years is and has been important to us.
In accordance with the guidelines from the Danish Business Authority, there is equal representation in the Board of Directors of Maersk Product Tankers. There are no employees in Maersk Product Tankers and therefore, no gender targets have been set in the company for other management levels.
Management Level
MAERSK PRODUCT TANKERS A/S MANAGEMENT REVIEW 10
Number of members Share of females Board of directors 4 (of which 3 males and 1 females) 25% Other management levels 3 33%
DATA ETHICS
Most of Maersk Product Tankers’ data is being stored by Maersk Tankers, and we rely on the company’s data ethics to safeguard our business.
Data ethics is an area that has been developed in Maersk Tankers through introducing processes, raising awareness and training throughout the organisation. One example is the IT awareness programme rolled out to the company’s all employees.
Data ethics principles aim to ensure that data is handled in a correct and responsible way. Maersk Tankers continually monitors and updates its data ethics policy and guidelines to protect individuals’ privacy, and to safeguard the company from legal, business, and reputational risk.
MAERSK PRODUCT TANKERS A/S MANAGEMENT REVIEW 11
KK WIND SOLUTIONS
The Sustainability Report for 2023 is enclosed on the next pages.
A.P. MØLLER HOLDING A/S CSR REPORT 2023 107

We Connect to Transform Electric Dreams for a Sustainable Future
Report
ESG
2023

Table of contents Report introduction ��������������������������������������������������������������������������� 3 Our business 4 Key partner in the just green transition 5 Our history 6 CEO statement ������������������������������������������������������������������������������������� 7 Key figures ����������������������������������������������������������������������������������������������� 8 Business model ������������������������������������������������������������������������������������ 9 Double Materiality Assessment��������������������������������������������� 10 Sustainability governance ���������������������������������������������������������12 Our sustainability strategy 13 Stakeholder engagement 14 Environment ������������������������������������������������������������������������������������� 16 Our approach to environmental topics ���������������������������� 17 Climate change mitigation and adaptation �������������������18 Pollution prevention 21 Circular economy 22 Social ������������������������������������������������������������������������������������������������������� 24 Our approach to human rights ���������������������������������������������� 25 Own workforce ����������������������������������������������������������������������������������26 Workers in the value chain ��������������������������������������������������������28 Governance 30 Our approach to business conduct ������������������������������������ 31 Memberships and ratings ����������������������������������������������������������32 Sustainability data 34 Accounting principles 35 ESG data overview 39 Notes for ESG data overview ������������������������������������������������� 40 SASB data overview ���������������������������������������������������������������������� 42 Sustainable Development Goals ����������������������������������������� 43 2 KK Wind Solutions | ESG report 2023

Report introduction
We are excited to present this new ESG Report that initiates our effort to becoming aligned with the coming Corporate Sustainability Reporting Directive (CSRD)�
This report is the consolidated ESG Report for KK Wind Solutions Holding A/S (CVR: 39 06 70 48) and is created with the same scope as our consolidated financial report.
This report is our mandatory annual statutory sustainability reporting in accordance with the Danish Financial Statement Act §99a and §99d
According to the Danish Financial Statement Act reporting according to §99b is done in the Annual Report � To secure transparency group numbers and targets are included in the ESG Report as well�
Important to note that we have not used the exemption articles on disclosure of information prejudicial to our commercial position, as we highly value and embrace transparency as a key fundamental in sustainable reporting
The reporting period covers 01 January to 31 December 2023� This report is published April 2024�
The report has been reviewed by PwC as part of their audit of the annual report
No limited assurance has been conducted for this report or its indicators �
The report is made with inspiration from the new European Sustainability Reporting Standards (ESRS) Accounting Principles for all data reported in the ESG data overview on page 39 are available in the section “Accounting Principles” on page 35
To further ensure transparency and to work towards creating an international report with focus on financial risks, we have, this year included selected indicators from the SASB Sustainability Accounting Standard for Electrical & Electronic Equipment �
Out of the 77 SASB Sustainability Accounting Standards, the SASB Sustainability Accounting Standard for Electrical & Electronic Equipment has been found to be the one standard to best cover the activities of KK Wind Solutions On page 42 a selection of the indicators have been reported to give you, as reader a transparent view of relevant indicators linked to our financial ESG risks.
We have started our implementation of the EU Taxonomy reporting and included early numbers for eligible turnover at page 17� Full EU Taxonomy repointing will be part of our future CSRD aligned reporting�
Our business | Environment | Social | Governance | Sustainability data | 3 KK Wind Solutions | ESG report 2023

Our
Our business | Environment | Social | Governance | Sustainability data | 4 KK Wind Solutions | ESG report 2023
business
Key partner in the just green transition
We are highly concerned about the emergency state on six out of nine planetary boundaries – the boundaries we need to operate within to ensure that humanity can continue to develop and thrive for generations to come�
Crossing boundaries increases the risk of generating large-scale abrupt or irreversible environmental changes � Drastic changes will not necessarily happen overnight, but together the boundaries mark a critical threshold for increasing risks to people and the ecosystems we are part of
We need this to change
Boundaries are interrelated processes within the complex biophysical Earth system This means that a global focus on climate change alone is not sufficient for increased sustainability Instead, understanding the interplay of boundaries, especially climate and loss of biodiversity, is key in science and practice�
KK Wind Solutions is a key partner in the green just transition when it comes to mitigating greenhouse gas (GHG) emissions � Since we started, 40 years ago, we have enabled more than 130 GW of installed wind turbine capacity of which more than 6 GW was enabled during 2023 With a capacity factor of 35%, 400 TWh of renewable energy was enabled in 2023 by our decades of dedication and development � This way we helped save 0�4 billion tonnes of CO2 emissions in 2023 as most of our installations are replacing coal powered electricity We bring a
mindset of a green just transition to ensure equity is accounted for in the transition to a low-carbon and environmentally sustainable economy�
Planetary boundaries 2023

Credit: Azote for Stockholm Resilience Centre, Stockholm University Based on Richardson et al. 2023, Steffen et al. 2015, and Rockström et al. 2009
The KK expertise in converter technology is key in transforming wind into electricity with high efficiency. Our sensor systems transform vibrations, temperatures, and other data into wind turbine maintenance plans Our service team transforms the wind turbine from a machine to a stable renewable energy source that brings light to millions of households around the world�
We also use our experience in wind to enable other renewable industries The power conversion- and
battery storage systems are not only core within the current business in wind, but are also an inherent part of almost all systems within renewable energy and electrification in general. Due to the strong synergies with the wind industry and in order to make a greater impact, we have in 2023 started delivering our products to the Power-to-X (PtX) market, expanding our collaborations with current customers, but also with new industry players
To stay a strong partner and player in the green energy transition, we have, thus, defined four promises that are explicitly addressed to our customers:
We listen to understand your needs �
We are easy to work with
We inspire you to innovate your business �
We deliver a sustainable solution
At the heart of our sustainability strategy lies the mantra “we connect to transform”, seeking to serve as a lighthouse and positioning us as a key partner in facilitating the green just transition towards renewable energy�
We are important for sustainability and sustainability is important for us �
Climate change CO2 concentration Radiative forcing Novel entities Biosphere integrity Genetic Functional Land-system change Fresh water change Fresh water use (blue water) Green water Biogeochemical flows P N Ocean acidification Atmospheric aerosol loading Stratospheric ozone depletion Increasing risk
Our business | Environment | Social | Governance | Sustainability data | 5 KK Wind Solutions | ESG report 2023
Our history
We keep innovating and leading the way as we have been doing since the development of the first control system more than 40 years ago�
A lot has happened since 1978, when our founders, Kai and Knud, developed the control systems for one of the first grid-connected turbines in the world, the 22 kW “Christian Riisager” turbine, and until today, a
global leading systems supplier to the top-tier wind Original Equipment Manufacturers (OEMs), globally�
In the early days of wind energy, KK Wind Solutions was a pioneer in the development of control systems for wind turbines This innovation played a key role in our early growth, as well as the growth of the wind industry
As the wind industry has grown, KK Wind Solutions has continued to innovate, developing new and

1978
Our founders develop one of the first electrical control systems for a wind turbine, the 22kW Riisager.
1990 We partner with Bonus Energy, later to become Siemens Wind Power, becoming sole supplier of control systems.

2003
New production facilities in Szczecin, Poland.
1985
We launch the industry’s first SCADA system.

1981
kk-electronic is established and a factory is built in Herning, Denmark.


2002
We launch a new control system, WTC3, which becomes a key product.

1991
The world’s first offshore wind farm is built at Vindeby, Denmark, equipped with our control and surveillance systems.
2008
2014
To better represent what we do kk-electronic is renamed KK Wind Solutions. An office and distribution centre is also opened in Kansas, USA.
New headquarters and production facilities in Ikast, Denmark.


2017-18
New production facilities in Bangalore, India. New office in Madrid, Spain and Shanghai, China.
2016
We enter into large customer partnerships and become a systems supplier.

2019
A.P. Moller Holding steps in as new owner.

more advanced electrical systems � These are now used in wind turbines all over the world, as well as in other industrial applications, and we are constantly working to improve our products and services to meet the evolving needs of our customers �
2020
We acquire Gram & Juhl and advance our capabilities within Turbine Condition Monitoring (TCM ®).


2021
We establish a new production facilities in Taichung, Taiwan.
2022
We acquire ConverterTec’s R&D department and IP portfolio and strengthen our offerings within power conversion.


2023
We signed an agreement to acquire Nissens Cooling Solutions.
2023
We acquire the Converters & Control business from Vestas – acquiring production facilities in Hammel (DK), Chennai (IN) and Tianjin (CH).

2021
We acquire PCH Engineering and advance with vibration monitors.

1982 1985 1990 1995 2000 2003 2005 2006 2007 2008 2009 2010 2011 2012 2013 2014 2015 2016 2017 2018 2019 2020 2021 2022 2023 Revenue (bDKK) 0 1 2 3 4
6
5
Our business | Environment | Social | Governance | Sustainability data | 6 KK Wind Solutions | ESG report 2023
“ We are committed to working in partnership with our stakeholders, fostering a collective effort to create a more sustainable world for all�”

CEO statement
What mark will you leave on creating a better planet for the generations to come? We all need to do more and reflect on the marks we want to leave.
As we continue our commitment to sustainability, we are not merely embarking on a journey; we are forging a path that will leave a lasting mark on the world we inhabit � We recognise that sustainability is not a fleeting trend but a fundamental imperative, a responsibility we must uphold to safeguard the wellbeing of our planet and the communities we serve� We are an important player in the green just transition and we are dedicated to this societal task �
Our purpose – to deliver positive climate impact – is not just a tagline; it is the driving force behind our ambitions � We understand that sustainability is not an afterthought but an intrinsic element of our success � By prioritising sustainability, we empower our people to thrive, fostering an environment where innovation and growth flourish organically.
Our active involvement in the renewable energy sector naturally positions us as a catalyst for change� The products and services we deliver, push the boundaries of innovation, enabling us to install more renewable energy capacity while reducing reliance on fossil fuels, thereby generating a positive climate impact �
Achieving the green energy transition demands more than incremental progress; it calls for a transformative approach that permeates every aspect of our value chain� We must not only invest in groundbreaking technologies but also scrutinise our entire operations, ensuring that we conduct our business in a manner that aligns with sustainability principles �
We continue our long-time commitment to the principles of the UN Global Compact, a key framework that operates with ten globally accepted principles within human rights, labour, environment, and anticorruption
This report serves as a testament to our dedication to continuous improvement � It showcases our achievements in addressing sustainability challenges and unveils our ambitious goals for the future�
We are committed to working in partnership with our stakeholders, fostering a collective effort to create a more sustainable world for all Together, we can leave an enduring mark on the planet, ensuring a brighter future for generations to come
Our business | Environment | Social | Governance | Sustainability data | 7 KK Wind Solutions | ESG report 2023
Key figures
16 KK Wind Solutions sites
Safety first: LTFR 0.9
2,400+ employees
Net-zero 2030 GHG emission target (scope 1+2)
Turnover: 5.5 bDKK
More than 43,000 wind turbines are equipped with our solutions
Helped save up to 0.4 billion tonnes of CO2 in 2023
KKWS installed in > 130 GW wind turbines
20%
females in Board of Directors
700 direct suppliers
Our business | Environment | Social | Governance | Sustainability data | 8 KK Wind Solutions | ESG report 2023
Business model
We reduce complexity for our customers by offering innovative engineering solutions that are delivered on time and with the highest quality standard�
KK Wind Solutions has been increasing the value provided to key customers in the last decade, by moving up the value chain, from mainly delivering Build-to-Print (BtP), to now having a large share of Build-to-Spec (BtS) and design projects � We constantly challenge ourselves to innovate and develop our own IP products, which benefits both us and our customers, and helps reduce the costs and improve the competitiveness of the renewable industry�
Our solutions include a wide range of products and services, from development to installation and maintenance. This enables KK Wind Solutions to offer customers a single source for all their electrical, wind turbine, and renewable energy system needs � As wind turbines keep growing in size and power output, it becomes increasingly important to develop modular and standardised solutions that are easy to transport and install� KK Wind Solutions is addressing this need by focusing on five key product offerings: Advanced control systems, Monitoring & Prognostics solutions, Energy Storage systems, Power Conversion and Integrated Systems � In 2024 we have diversified our business further by adding a central product offering – cooling.
Our Service Business
Our products are vital for a turbine to work well, while our Services help to extend their life span�
As the fleet of turbines that is installed is getting older, and both onshore and offshore turbines are increasing in energy density and size, the demand for digital solutions and service agreements becomes essential for both Original Equipment Manufacturers (OEMs) and Utilities �
Our flexible and globally mobile workforce, which consists of highly skilled technicians who take a proactive approach to turbine operations and maintenance, can support the entire turbine lifetime from prototype testing, pre-commissioning and High
Voltage services for installation, to predictive maintenance, supply and repair of spare parts, retrofit and upgrade solutions
Strong global presence
While our products and services are crucial for the transition to green energy, there are other factors that affect our business performance. That is why we aim to have a regional manufacturing presence that allows us to be close to our customers and offer them the support they need�
A global presence with operations in Europe, Asia and the Americas enables us to serve our customers around the world�


Our footprint


Our business | Environment | Social | Governance | Sustainability data | 9 KK Wind Solutions | ESG report 2023
Double Materiality Assessment – risk, opportunities and impacts
Sustainability covers a broad set of areas within Environment, Social and Governance� It is key to understanding what is material to focus our effort and optimise our OPPORTUNITIES by understanding our RISKS and IMPACTS�
KK Wind Solutions is a key player in the green just transition and we care deeply about our environment and the planet We see and internalise the fact that six out of nine planetary boundaries have already been crossed and that the way of doing business will change rapidly in the next decade We have left the stable predictable era and entered the time of human impact where uncertainty is growing day by day Weather patterns are changing rapidly all over the planet at a speed where a single generation can feel and see the change� We are in an environmental emergency and we must act �
We see a great opportunity for delivering the solutions of the future needed in the green just transition� At the same time, the transition risk of regulation, carbon taxes, etc needed to transform our societies will also require massive changes at KK Wind Solutions, calling for resources and competences that we are only beginning to understand the importance of
Acting quickly is crucial as science tells us that the window of opportunity is only open for a short period and may already close this decade
In the last years we have made good progress on understanding what is mature for KK Wind Solutions when it comes to sustainability� We are in the process of understanding our impact on the Sustainable Development Goals (SDGs) - where we can reduce the negative impacts of our operations and where we can create positive impact and influence society at large�
Please see SDG section at page 43 for more info At the same time we have also mapped the most important topics in respect of financial risks and opportunities and the importance to our stakeholders
Top three areas are linked to:
The green just transition: Enabling and scaling renewable clean energy and making the fossil choice less attractive�
Safety and talent: Keeping employees in our own operations and in the value chain safe is a key fundamental for our industry� Developing and attracting the best talent is of high importance as technology and business savings are key components of the green just transition� Responsible value chain: Understanding and acting on our environmental and social footprint is of very high importance to us and our customers, and we are committed to engaging the value chain to understand and learn how to reduce our carbon footprint
All this work will be the starting point for running a CRSD aligned double materiality assessment process in 2024, to set the way forward and inform the requirements for us to align with the coming EU regulation currently being transferred into Danish regulation�
1 2 3 Our business | Environment | Social | Governance | Sustainability data | 10 KK Wind Solutions | ESG report 2023
Double Materiality Assessment – a high-level overview
Material topics and sub-topics
1 The green just transition
Climate change�
Enabling clean energy
Resource efficiency and emissions.
2 Safety and talent
Safety, health & wellbeing
Employee retention & development �
Talent attraction & access to workforce�
Diversity and inclusion
3 Responsible value chain
Product innovation and R&D�
Responsible supply chain
Green products demand by customers �
Material scarcity�
Code of conduct �
Local content and customer requirements
Circular economy�
Impact & importance to stakeholders Impact on the business Low Medium High 1 2 3 Our business | Environment | Social | Governance | Sustainability data | 11 KK Wind Solutions | ESG report 2023
Sustainability governance
In 2023 KK Wind Solutions took important steps to setup a sustainability governance better placed to harvest opportunities coming from the green just transition�
To improve the likelihood of changing sustainability risks and impacts into opportunities, it is important to create simple, scalable, and agile governance�
Since 2019, KK Wind Solutions has been guiding its sustainability efforts through the cross-functional sustainability committee linking in key parts of the organisation and reporting directly to the Executive Management Team
We have seen very good progress and employee engagement linked to the important work performed in the committee until its work was completed at the end of 2023�
Times have changed and a new governance was needed to ensure that sustainability is integrated with the purpose of guiding KK Wind Solutions in improving product performance and affordability by becoming more sustainable Our new aluminium 3D printed eco-busbar is a good example of this integration mindset (Read more in our 2022 Sustainability Report)
Harvesting more sustainable opportunities requires that the Executive Management takes the full responsibility for the sustainable business transformation and to do so, they have created a Group Sustainability
function as part of the People and Culture organisation�
Group Sustainability is now led by the Senior Director of Sustainability, is focused on three major tasks to support the Executive Management in successfully transforming the business:
• Setting, agreeing and updating the sustainable business transformation strategy�
• Supporting the Executive Management track owners in deploying the strategy based on the agreed roadmap�
• Reporting and communicating on progress
Board of Directors
Executive Management
Sustainable Transformation Tracks as integrated part of the “Must Win Project” for sustainability
A “Must Win Project” for sustainability has been created to ensure a smooth implementation of the new setup and to support the trade owners in deploying the roadmap� The Senior Director, Sustainability, is leading this “Must Win Project”�
The Board of Director is heavily engaged in the sustainability agenda to ensure that the management of KK Wind Solutions delivers on its commitments Among others the Board of Directors was engaged in the sustainability journey on March 9 th 2023
Group Sustainability lead by the Senior Director, Sustainability
Our business | Environment | Social | Governance | Sustainability data | 12 KK Wind Solutions | ESG report 2023

Our sustainability strategy
Our business strategy is per default integrating sustainability in its core� We must now focus our efforts and secure the sustainable business transformation�
Competitive sustainability is a strategic theme and belief making it clear that sustainability is not a choice; it is the core of competitive products and solutions � By integrating sustainability as a core design element we want to improve performance and value of our products �
When it comes to reducing impact, design is key, and we need to find our way of securing that design contributes with opportunities when it comes to lowering the GHG emissions
The sustainable business transformation of KK Wind Solutions will not be easy and will require us to focus our efforts. To double down on the sustainability strategy and to prepare for CSRD compliance, we will perform a CSRD compliant double materiality assessment (DMA) in 2024 to guide and give focus for our future sustainability effort.
We have with this report taken the first steps in preparing for coming reporting criteria, however, we know that the journey is long and that we have just begun to really understand the massive change we are facing as a business and as humans �
We keep optimistic and see lots of opportunities in the change to come, and our sustainability strategy will help us create more societal value as we serve our stakeholders needs
At the heart of our sustainability strategy lies the mantra “we connect to transform”, seeking to serve as a lighthouse and positioning us as a key partner in facilitating the green just transition towards renewable energy�
We are important for sustainability and sustainability is important to us
Our business | Environment | Social | Governance | Sustainability data | 13 KK Wind Solutions | ESG report 2023
Stakeholder engagement
We are working to become a more responsible business, mindful of the impact we have on our stakeholders and the environment �
While we acknowledge that sustainability has not always been the centre of our discussions and decision-making, we are taking steps to ensure our products, services and operations create value for all stakeholders and the planet �
The sustainability mindset
Sustainability is not yet a priority in all aspects of our operations as this is a new business mindset that we are still learning to adopt � Because of our business type, some of our functions have been more aware of sustainability in decision making, while others have been more focused on meeting customer demands and price pressure� We need to be competitive to stay in business and to reduce the cost of renewable energy� However we also see that we can do more to support the industry goals by doing business in a more environmentally friendly way, by considering more sustainable options in our decision making across all functions �
We want to drive an integration mindset, but we are at the beginning of the maturity ladder, having a more “License-to-Operate” mindset, focused on compliance, versus bringing sustainability in as a driving force for our decisions and actions �
Mindset towards sustainability
”Integration” mindset 1 2 3
License to Operate mindset
• “Sustainability is a must”
• “Price to pay”
Key stakeholders
”Add-on” sustainability mindset
• Work on operations and products becoming more sustainable
• Highlight sustainability in value propositions
We highly value the perspectives of our stakeholders and have for years been focusing on employees, customers and suppliers� We acknowledge that stakeholders outside our industry e�g�, politicians, media, and investors also influence our business and we are committed to continued engagement as we expand�
When it comes to employees, we see them as core to our business, which is why they are central to our decision-making processes� We actively consider how choices will impact not only current employees but also attract and inspire future talent� Building a thriving company culture is key, and we believe sustainability can be a driving force that motivates existing employees and attracts new ones seeking impactful careers�
• Sustainability IN Strategy – it enables your core differentation.
• Focus is not on selling sustainability
When it comes to customers, we are very attentive and always strive to meet their needs and exceed their expectations �
When it comes to suppliers, we are in need for their support to help solve the big sustainability dilemmas on the investments required to drive the sustainable business transformation
New objectives
We are sure that sustainability can enhance our competitiveness and we will strive to make this a factor in our decision-making� We are committed to turn compliance into competitive advantage by use of the integrating mindset �
Source: IMD: Goutam Challagalla and Fredric Dalsace
Our business | Environment | Social | Governance | Sustainability data | 14 KK Wind Solutions | ESG report 2023

How we engage with schools and universities
Green Power Denmark reports that the green transition requires an average of 45,000 extra full-time workers per year from 2023 to 2030, and about 19,000 of them should be skilled workers � As such, schools and universities have a vital role in this transition and need help from specialised businesses like KK Wind Solutions to develop the courses and skills for the future� We, therefore, engage and aim to collaborate with more educational institutions in the future�
Besides the universities we collaborate with for interns, knowledge sharing, and research, we are also interested in partnering with local schools that can use some of the products we discard for educational purposes For instance, in 2023 we have been supplying electrical components to students at Herningsholm technical school, so they can use them for learning
“Success hinges on collaboration � When we join forces and pool resources, our collective achievements surpass what we could accomplish individually� Our collaboration with KK exemplifies this principle. Through the donation of components, companies such as KK play a pivotal role in advancing the education and nurturing the growth of future engineers �” says Søren Ellemann Hansen, Teacher at Herningsholm �
Source: Mere arbejdskraft til den grønne omstilling (greenpowerdenmark dk)
Our business | Environment | Social | Governance | Sustainability data | 15 KK Wind Solutions | ESG report 2023
Our business | Environment | Social | Governance | Sustainability data | 16 KK Wind Solutions | ESG report 2023
Environment
Our approach to environmental topics
We are all heading towards a 3�3 degree temperature increase over pre-industrial level in 2100� According to science this will be catastrophic for life on planet Earth�
This climate emergency is the starting point for our approach to environmental topics � In this light, the renewable energy industry is second to none when it comes to producing low emission electricity�
However, renewables won’t do it on its own – we need to act in partnership� Based on the EN-ROADS simulator you can experience for yourself the massive effort the world is calling for.1
For our operations the Quality, Health, Safety and Environment (QHSE) policy guides our effort and makes it clear that compliance with ISO 9001 and ISO 14001 is a key starting point for minimising our environmental impact when delivering high quality products that support the green just transition
We have adopted a “Vision Zero” approach to avoid environmental harm� To reduce our impact we prefer the use of environment-friendly materials and have implemented appropriate waste management system�
Climate emergency – An EN-ROADS scenario1
Play out your own at https://en-roads �climateinteractive org/
Paris agreement
1. https://en-roads climateinteractive org/
of CO2 per MWh Wind 11 Gas
Coal
us-breathe-easier Preliminary EU taxonomy reporting: Eligible turnover for 2023 Code kDKK % Enabling activities for manufacture of renewable energy technologies 3�1 5,038,436 92% Installation, maintenance, and repair of renewable energy technologies 7 6 447,618 8% Total 5,486,054 100% 2000 0,0 0,5 1,0 1,5 2,0 2,5 3,0 3,5 2020 2040 2060 2080 2100 4. Deforestation stopped and afforestation started 3. Renewable energy, electrification, and energy efficiency. 2. High reduction of methane and other gasses 1. Very high carbon tax (250USD) - 0.9 - 0.4 - 0.3
Kilograms
465
980 Source: https://www energy gov/eere/wind/articles/how-wind-can-help-
- 0.2 3�3
Impact of electricity production Temperature change °C An area we could influence. Our key focus Our business | Environment | Social | Governance | Sustainability data | 17 KK Wind Solutions | ESG report 2023
GHG
Climate change mitigation and adaptation
Action is desperately needed to address the climate emergency that we all face� The call is now to act on both climate change mitigation and adaptation at the same time�
The Task Force on Climate-related Financial Disclosures (TCFD), established in 2015, has clear recommendations on climate change mitigation, adaptation and scenario planning As time passes, these recommendations only become more and more relevant
Based on the positive impact of our products, it is only natural for us to take our starting point in acting on climate mitigation in own operations and in our supply chain
A net-zero 2030 Greenhouse Gas (GHG) emission target has been set
The market based scope 1 and 2 emissions have increased since 2019 due to M&A activities Availability of historic data has been a challenge in the M&A process and, unfortunately, we have not been able to recalculate our 2019 baseline
A large effort is being given to purchase of renewable energy certificates (RECs) or similar, bringing down the emissions from purchased electricity We know more effort is needed to ensure 24/7 green electricity and we will investigate how we can secure a true green electricity at our facilities �
Where the scope 2 emissions have been reduced by above mentioned effort, we still see scope 1 emissions increasing from 2019 to now around 1,500 tonnes of CO2e emissions in 2023 This is primarily linked to gas use and includes M&A added emissions
3 2 2019 2023 2030 ktonnes 1 0,0 4 Mainly M&A activity Our business | Environment | Social | Governance | Sustainability data | 18 KK Wind Solutions | ESG report 2023

Building on our effort to reduce scope 1 and 2 emissions, we have continued mapping and understanding our scope 3 Already in 2020 we made an assessment of our impact in the 15 different categories that are listed in Greenhouse Gas Protocol’s Corporate Value Chain (Scope 3) Accounting and Reporting Standard Above 90% of our scope 3 emissions are linked to category 1: Purchased goods and services, and we have, therefore, chosen to only focus on this category in our corporate reporting and effort to reduce.
A supplier engagement program has been started to better understand the emissions and ensure that our supplier is seen as a source of innovations that can help our sustainable business transformation�
As the climate emergency develops, it unfortunately becomes more clear that we will face the consequences of climate change for decades The chronic and acute physical climate risks, therefore, need real attention
Based on this, it is planned to include climate risks in our supplier engagement setup, to better understand the risks and to enable us to evaluate potential needed climate adaptation work � As guided by TCFD, we plan to set targets and build plans for both climate mitigation and adaptation�
2023 2020 Scope 1 GHG emissions tonnes 1,491 663 Scope 2 GHG emissions (market-based) tonnes 1,867 771 Scope 3 GHG emissions tonnes 216,391 105,340 Total GHG emissions tonnes 219,749 106,774 Revenue kDKK 5,486,054 2 579 690 Emission intensity (total GHG pr net revenue) Tonnes/ kDKK 0,040 0,041 Our business | Environment | Social | Governance | Sustainability data | 19 KK Wind Solutions | ESG report 2023
GHG emissions across our value chain
Scope 3: 98%
Scope 2: 1%
Scope 1: 1%


Total tonnes of CO2e in 2023: 219,749 Raw materials Steel / cobber / plastic etc
goods
services
manufacturing
KKWS’
Heat & electricity
Factory Offshore wind park Ships / Ports Rotor Nacelle Tower Wind Turbine Generator (WTG) KK Wind Solutions: Our business | Environment | Social | Governance | Sustainability data | 20 KK Wind Solutions | ESG report 2023
Purchased
&
Component
at
16 sites
Onshore wind park

Pollution prevention
Material chemistry is a key component in enabling the Circular Economy and the development of products with improved environmental performance�
As part of our ISO 14001 certified environmental management system and governed by the QHSE policy, we have committed to avoiding environmental harm by protecting the environment �
At KK Wind Solutions this work includes pollution prevention at our own sites � The factories operated are mainly used for the final component manufacturing of our many products within the electro-mechanical industry, and none of our current 16 production sites operate within environmental permits as the pollution potential is seen as low�
As part of our environmental management system, we have implemented the precautionary principle, and based on this, we evaluate potential pollution to air, water and soil� We are in dialogue with relevant authorities when we find potential pollution issues to ensure needed investigations are handled openly and transparently and with the aim of cleaning-up if we have caused some pollution�
To some extent, our products designed for the business to business market contain substances of very high concern (SVHCs)�
Articles containing SVHCs on the Candidate List in a concentration above 0 1% weight by weight (w/w) placed on the EU market need to be reported to ECHA
This reporting requirement has now helped us create an overview of used SCIP (Substances of Concern In articles as such or in complex objects (Products)) components and which of our products they are used in� This is a great starting point for further evaluation and prioritisation around needed R&D effort to find alternatives or in other ways reduce the use of SVHCs �
For compliance with RoHS and REACH we ensure supplier documentation for compliance and keep own designs compliant as well
Our business | Environment | Social | Governance | Sustainability data | 21 KK Wind Solutions | ESG report 2023

Circular economy
Design is key to enable the circular economy because products can be optimised for reusability and recyclability and used materials can be sourced from recycled content � However, for now, waste management is central in our effort to improve.
A high focus is given to avoidance of waste at all production facilities in KK Wind Solutions Waste is cost and environmental impact without value creation and we have therefore linked this to our high focus on quality and cost of poor quality� The focus on minimising waste and cost of poor quality is aiming to securing a low level of internal scrap
With 0�2% scrap measured in 2023, we overperformed on our target and lowered our waste-torevenue ratio from 0�436 kg of waste per 1,000 DKK in revenue in 2022 to 0 349 kg of waste per 1,000 DKK in revenue in 2023
We are working on lowering the percentage of waste not recovered and have in 2023 reached a level of 12% waste not recovered This waste is split between hazardous waste and non-hazardous waste not recovered Of the total waste only 6% of our waste is categorised as hazardous waste�
At the same time our direct use of rare earth elements like neodymium, samarium or other rare earth magnets materials is very low as we generally do not produce generators or similar products
Prototyping new products for our customers is an integrated and important part of our work and engagement with our customers The prototyping helps us and the customers to develop and optimise the right solutions But building prototypes also comes with waste that we are working on minimising� Here, copper and cable waste represent above 10% of our total waste�
Our business | Environment | Social | Governance | Sustainability data | 22 KK Wind Solutions | ESG report 2023
Digitalisation supports waste reduction efforts
We have been experimenting at our facility in Ikast to find ways to reduce waste. One of these experiments was to use the ProPanel software to design a full panel, which can help us minimise cable waste in the prototyping process � The software allows us to create a full panel for e�g� , a Light Backup Unit (LBU) in 3D with all the wires, so we can get a list of wires that are close to the right lengths, instead of using wires in standard lengths of 1 or 2 meters and then discarding the excess �
Below is the success criteria used to verify if the software could help reduce waste:

Testing showed good results and saves above 90% in the best cases �
Our goal for 2024 is to keep working on reducing waste in prototyping, so that we can keep lowering our waste to revenue ratio and the amount of waste that is not recycled�
Criteria How to measure? Frequency measurement
will reduce the wire- and cable waste by minimum 20% for prototype builds
lengths from
with assumed 1m and 2m standard cut for prototype build Once
to measure?
Conclusion
wirelist is generated in ProPanel Yes
can reduce waste by
Our business | Environment | Social | Governance | Sustainability data | 23 KK Wind Solutions | ESG report 2023
ProPanel
Compared wirelist
ProPanel
When
Succeeded
for Mock-up After
(1m and 2m wires) ProPanel
94% (97m)

Social
Our business | Environment | Social | Governance | Sustainability data | 24 KK Wind Solutions | ESG report 2023
Our approach to human rights
As a member of UN Global Compact (UNGC) since 2010, we value human rights and labour rights very highly� In the coming years we plan to conduct a company-wide human rights impact assessment to guide our focus and prepare for upcoming EU regulation�
The respect for human rights and labour rights is a fundamental starting point for our social sustainability effort.
At KK Wind Solutions we recognise our responsibility to respect human rights and understand the importance of disclosing the necessary steps we take to live up to our human rights obligations
We recognise that regulation is being implemented in e�g� , Norway and Germany to further enforce the importance of human rights and in the coming years we will work on further straightening and systemising our human rights work �
Human rights and labour rights will be part of our Double Materiality Assessment (DMA) being conducted in 2024 to clarify the overall risks, opportunities and impacts (please also see section: “Our sustainability strategy” at page 13)� It is planned as a next step to conduct a company-wide human rights impact assessment to identified risks, and actionable recommendations and to gain detailed knowledge on our overall human rights awareness �
This assessment is to provide a human rights risk profile, including salient human rights risks and to give a status on the efficiency of management systems to address the risks seen
We are currently supporting different initiatives that work on providing better living conditions for humans and animals �
Our support to the benefit of planet and people
Our support for SOS Children’s Villages, which began in 1984, has been ongoing for nearly 40 years through our sustained donations �

In 2023, we were happy to back the WILD Nature Foundation, by supporting one of their big events “Verdens Vilde Liv” that concentrated on biodiversity and climate change�
Our business | Environment | Social | Governance | Sustainability data | 25 KK Wind Solutions | ESG report 2023
Own workforce
Our success depends on our people�
We ensure safety first and invest in learning and development �
We are pleased to have a varied and skilled team of people who are committed to deliver creative solutions to the renewable energy industry� Because of our innovative nature and always being on the lookout for new ways to solve problems, we call ourselves “Green Power Wizards”�
Our workforce has a breakdown of approximately 65% males and 35% females We recognise that the industry has evolved to include more women and we aim to increase their representation in the next years We value having a more even gender split, as this contributes to the diversity of thought and makes KK Wind Solutions a more welcoming and inclusive workplace Therefore, we have created a Diversity and Inclusion policy, with a number of actions These actions were started in 2023 and involve a more inclusive way of hiring talent, mentorship and career support programs, cultural sensitivity, leadership engagement, and setting and reporting goals
We will continue our implementation in the coming years � Our targets are to reach 40% of underrepresented gender on the Board by the end of 2024 and 20% of underrepresented gender in the Senior Management by the end of 2027�
Safety First
KK Wind Solutions prioritises the safety and wellbeing of all our employees � We always put “Safety First” in everything we do and decide�
In 2023, we continued to work on embedding the Vision Zero approach and mindset into the organisation�
We are certified according to the standards of ISO 45001:2018 Occupational health and safety management systems, which demonstrates our dedication to constantly apply and enhance how we handle health and safety�
Progress
In the past year, we have lowered our lost-time frequency rate (LTFR) – which is the number of work accidents per one million working hours – from 2,9 in 2021 to 0 9 in 2023 Also, we made progress in the Total Recordable Incidents Rate (TRIR) – which is the number of recordable injuries and illnesses per one million hours worked – from 86 incidents or a ratio of 7 6 in 2022 to 47 incidents or ratio of 4 in 2023 The absence rate has also improved In 2023, blue-collar worker absence declined from 5 5% to 4 1% and the white-collar worker absences declined from 2 6% to 2 2%
More preventive measures
One major measure we took in 2023 was to make First Aid and CPR tests mandatory for all employees �
We also did more Safety Walks � In 2023, we did 2067 walks, which was more than the previous year when we did 514 walks � A Safety Walk is a proactive open conversation with one or more employees about Health, Safety & Wellbeing, that helps to create and sustain a strong safety culture� We have furthered psychological safety� We had already set up guidelines for managers to handle stress situations, and we now also keep track of the sick days due to stress � In addition, we arranged Global Mental Breaks, online daily 15-minute breaks for breathing and office exercises. We also had some knowledge-sharing sessions on this topic � For 2024, wellbeing is still a priority, which is why we have launched a dedicated project, to ensure consistent wellbeing initiatives across our sites and the development of a structured program that covers physical, mental, and emotional health�
Our business | Environment | Social | Governance | Sustainability data | 26 KK Wind Solutions | ESG report 2023
Learning & development
We provide various development and training opportunities to help our employees grow both personally and professionally� Our annual Personal Development Dialogues (PDD) process has been a key focus area, to which we made continuous improvements, now focusing more on behavioural aspects as well as when evaluating performance, to be able to offer our people the most suitable career development opportunities � We also strive to make our job positions appealing to our employees, so that they see clear paths for career growth within the company, they feel more motivated and involved in their work and attain higher job satisfaction and a sense of meaning� Our people are the core of everything we do, and we are committed to supporting their growth and development while also working towards a more sustainable future

Our business | Environment | Social | Governance | Sustainability data | 27 KK Wind Solutions | ESG report 2023
Workers in the value chain
KK Wind Solutions is dedicated to adhering to the principles of the UNGC to uphold core values concerning human rights, labour standards, the environment, and anti-corruption� We expect our suppliers and sub-suppliers to likewise follow these principles�
Here is a summary of how we address the ten principles with our suppliers
Labour and Human Rights
Suppliers must respect the rights of their employees and ensure fair and non-discriminatory treatment, freedom of association, minimum age requirements, reasonable working hours and wages, and no use of forced or bonded labour
Health and Safety
Suppliers must ensure safe and healthy working conditions, following the ISO 45001 standard and the local laws and regulations �
Environment, Sustainability and Compliance
Suppliers must stay updated on environmental laws and comply through training, awareness, operational control, and monitoring They should systematically strive to prevent environmental harm, continually improve by reducing material use, emissions, waste, and pollution, and promote environmentally friendly technologies and solutions
Business Ethics
Suppliers must refrain from bribery, corruption, or illegal influence, and avoid offering or accepting improper gifts or payments � They must include anti-corruption clauses in contracts with agents and consultants �
Progress
We work with a large number of suppliers, around 1500 indirect and 700 direct � All new suppliers have to go through a rigorous assessment process before we approve them� The suppliers with the highest spent have also passed an assessment � The supplier assessment process is one of the key tools we use to monitor supplier compliance�
We follow up on our suppliers and do regular re-audits to make sure they meet our standards For suppliers with a high quality risk, we carry out audits every three years and for suppliers with a low quality risk, we carry out audits every five years. We will not accept or work with any supplier that does not follow our Code of Conduct or that ignores health and safety aspects
New objectives
In 2024, KK Wind Solutions will continue to reinforce, assess, and ensure compliance with human and labour rights, health and safety, and environmental impacts of suppliers �
We are also in the process of merging and aligning the code of conduct with our recently acquired businesses, adding all new suppliers to the assessment process, compliance and code of conduct to have the same process for all suppliers �
Conflict minerals
As a company in the renewable energy industry that values sustainability, KK Wind Solutions regularly checks that its suppliers do not use conflict minerals. These minerals, such as gold, tantalum, tungsten, and tin, have been linked to funding violence in the Democratic Republic of Congo and its neighbouring countries (DRC region)� KK Wind Solutions follows the U� S � Dodd-Frank Act and other related laws to avoid using these minerals in the supply chain and supports the Conflict-Free Smelter Program (CFSP), a voluntary initiative aimed at identifying and verifying smelters and refiners of conflict minerals that source responsibly�
Our business | Environment | Social | Governance | Sustainability data | 28 KK Wind Solutions | ESG report 2023

Our business | Environment | Social | Governance | Sustainability data | 29 KK Wind Solutions | ESG report 2023

Governance
Our business | Environment | Social | Governance | Sustainability data | 30 KK Wind Solutions | ESG report 2023

Our approach to business conduct
Our rapid growth also brings a need for more awareness on our business conduct � We have based on this stated plans to include Fraud and Bribery in our Enterprise Risk Management (ERM) mapping�
The Enterprise Risk Management (ERM) setup helps evaluating the business risks seen and over time it develops corrective actions to mitigate the risks As part of our rapid growth, we have now added Fraud and Bribery to the list of risks and started developing mitigation plans

Our Whistleblowing platform is already part of the mitigation and the platform can be accessed both internally and externally� If you want to report issues or risks seen, please use the QR code�
We are pleased to conclude 2023 without any incidents of corruption or bribery and thereby not having any convictions linked to anti-corruption and anti-bribery laws and thereby no fines have been received related to this
Approach to data ethics
KK Wind Solutions is not using advanced technologies such as artificial intelligence or machine learning The group handles normal data related to customers and employees in accordance with the GDPR legislation, the privacy policy and procedures for classification and management of documents and data With the limited data processing, it is the group’s assessment that it does not need to have a data ethics policy We will continuously monitor the need for such a policy
As part of our 2024 focus on business conduct, we will reevaluate the employee training programs on anti-bribery and anti-corruption as well as an anti-competitive behaviour�
As we grow we will also start to ensure better processes around our lobby activities to ensure transparency and open books on how we try to push for a quicker response to the climate emergency we all are facing
Our business | Environment | Social | Governance | Sustainability data | 31 KK Wind Solutions | ESG report 2023
Memberships and ratings
We seek to join memberships that align with our business principles and vision on climate, take pride in the ratings that validate our efforts, and are enthusiastic to help people and organisation that stand for good causes�
Memberships:

APQP4Wind is a method for Advanced Product Quality Planning in the global wind industry, with the goal to enhance the collaboration between manufacturers and suppliers and to ensure that parties at all levels talk on equal terms about quality assurance processes KK Wind Solutions joined in 2018, being part of the board of directors together with representatives from GE Renewable Energy, LM Wind Power, Siemens Gamesa Renewable Energy, Vestas Wind Systems and GreenPower Denmark
Dansk Industri (DI) is the biggest business and employers’ organisation in Denmark, with a membership of 20,000 companies from sectors such as manufacturing, trade, and service industries � DI supports its mem -
bers both domestically and internationally, providing services, advice, networks, and representation on issues such as collective bargaining, industryspecific advice, global competitiveness, and political representation� KK Wind Solution has been part of DI since 2008, belonging to a community of powerful companies working for a strong society�
Green Power Denmark membership empowers companies to influence policy, gain exclusive insights, network strategically, access expert advice, and contribute to Denmark’s green future, solidifying their industry position� KK Wind Solutions has been a proud member of Green Power Denmark for more than 20 years �

Engineer the Future is a technological alliance of tech companies, educational institutions, and organisations, with the aim of promoting Danish engineers and technology experts and creating a foundation for future knowledge workers and specialists in technological development � KK Wind Solutions joined Engineer the Future in 2020 Via this partnership, we aim to inspire a new generation of Green Power Wizards and support the longevity of industries that depend on strong engineering capabilities �
Ratings:
EcoVadis assesses companies’ sustainability across environment, labour, ethics, and supply chains, providing ratings to showcase improvement and drive responsible business practices The standards are getting higher every year, so achieving a good score keeps being challenging� In 2023 KK Wind Solutions has achieved a score above 50/100� This result puts our company in the top 50 percent of companies that EcoVadis assessed�
DI - Dansk Industri - Wikipedia, den frie encyklopædi
Our business | Environment | Social | Governance | Sustainability data | 32 KK Wind Solutions | ESG report 2023


KK Wind Solutions is a long-standing partisipant of the UN Global Compact and we appreciate this initiative�
We adhere to the ten principles that the UN Global Compact established, which include topics such as human rights, labour rights, environment, and anti-corruption, demonstrating our dedication to sustainability
KK Wind Solutions | ESG report 2023 Our business | Environment | Social | Governance | Sustainability data | 33

Sustainability data
Our business | Environment | Social | Governance | Sustainability data | 34 KK Wind Solutions | ESG report 2023
Accounting principles
The below description of accounting policies refers to the ESG (Environment, Social, and Governance) indicators presented on page 39�
All KK Wind Solutions Holding A/S (CVR 39 06 70 48) wholly owned subsidiaries are covered by the report � Newly established and acquired companies are included from the time of being in KK Wind Solutions Holding’s control, and companies are excluded from the reporting from the time of leaving KK Wind Solutions Holding’s control�
Environment
Total energy consumption
According to the European Sustainability Reporting Standards (ESRS) E1-5, we report the total fossil and renewable energy consumption disaggregated by energy type for the reporting period in megawatt hours (MWh)� The consumption is based on monthly reported consumption data with link to invoices � All locations have been included in the reporting� Activities in KK Wind Solutions are evaluated to be included in NACE Section C – Manufacturing and based on the E1-5 guidance categorised as “high climate impact sector”� Based on this, the energy intensity based on net revenue is reported with reconciliation to the annual report �
Gross Scopes 1, 2, 3, and total GHG emissions
According to the European Sustainability Reporting Standards (ESRS) E1-6, we report the total GHG emissions in metric tonnes and with reference to the Greenhouse Gas Protocol, calculated based on both the location-based and the market-based approach Gross scope 1 and 2 emissions are reported in CO2e based on the monthly energy reporting transformed into CO2e according the Greenhouse Gas Protocol
Scope 3 emissions are calculated based on Greenhouse Gas Protocol Corporate Value Chain (Scope 3) standard and include category 1: Purchased goods and services as this is evaluated to count for more than 90% of our scope 3 emissions � The calculation is based on weight of our different purchase categories in combination with extrapolation and use of estimates �
Total waste generated
According to the European Sustainability Reporting Standards (ESRS) E5-5, we report the total amount of solid waste in tonnes, split by hazardous waste and non-hazardous waste as reported internally on a monthly basis and with reference to invoices from the external waste handlers
Hazardous waste includes batteries, chemicals, combustion waste, electronic waste, mixed hazardous packaging and solvents and detergents � Nonhazardous waste include bio waste, metals mix, non-hazardous packaging, paper, plastic and wood�
The waste is reported on recovery operation types, waste treatment types according to the standard and the total amount and percentage of non-recycled waste are reported as well�
Our business | Environment | Social | Governance | Sustainability data | 35 KK Wind Solutions | ESG report 2023

Social
Total number of employees
According to the European Sustainability Reporting Standards (ESRS) S1-6, we report employee characteristics, including total number of employees by head count at end of the reporting period, broken down by gender, countries for operations with more than 50 employees in the country, permanent employees, temporary employees, and non-guaranteed hours employees The number of permanent, temporary and non-guaranteed hours employees is calculated on a country level and consolidated into the group number as presented
Share of underrepresented gender in Board of Directors
According to the Danish Financial Statements Act §99b, we report the share of underrepresented gender in our Board of Directors defined as the Board of Directors for KK Group A/S (CVR: 66821110) at the end of the reporting period� Information has been sourced from the Central Business Register (CVR) and employee-elected members have been excluded from the calculation�
Share of underrepresented gender in Senior Management
According to the Danish Financial Statements Act §99b, we report the share of underrepresented
gender in senior management based on headcount at the end of the reporting period� Senior management is defined with reference to the guidance in “Targets and policy for the gender composition of management and for reporting on this” published by the Danish Business Authority and includes top management – referred to as the Executive Management team – and their direct reports, where these reports manage reports in the same legal entity�
Employees covered by Health and Safety management systems
According to the European Sustainability Reporting Standards (ESRS) S1-14, we report the percentage of employees in own workforce covered by the health and safety management system� The number is calculated based on headcount at the end of the reporting period�
Fatalities linked to work related injuries or illness
According to the European Sustainability Reporting Standards (ESRS) S1-14, we report the number of work related fatalities in our own workforce� The numbers reported are based on fatalities reported via the health and safety management system during the reporting period�
Total number of recordable work-related accidents
According to the European Sustainability Reporting Standards (ESRS) S1-14, we report the total record -
Our business | Environment | Social | Governance | Sustainability data | 36 KK Wind Solutions | ESG report 2023
able work-related accidents, which include fatalities, lost time incidents, restricted work-related accidents with less than one day of absence The numbers reported are based on incidents reported via the health and safety management system during the reporting period�
Total rate of recordable work-related accidents per million working hours
According to the European Sustainability Reporting Standards (ESRS) S1-14, we report the total rate of recordable work-related accidents per million working hours� The working hours are calculated based on hours registered in the system for hourly-paid employees and standard working hours for salaried employees excluding holidays, sick leave, maternity leave etc�
Total rate of lost time recordable work-related accidents per million working hours
The total rate of lost time recordable work-related accidents is given as an additional datapoint linked to the European Sustainability Reporting Standards (ESRS) S1-14 reporting requirements� The number focuses on lost time recordable work-related accidents that are defined as accidents that have caused at least one working day of absence after the day of the injury� The number of working hours is calculated in the same way as for the total rate of recordable work-related accidents per million working hours�
Total number of recordable work-related illness
According to the European Sustainability Reporting Standards (ESRS) S1-14, we report the number of recordable work-related illnesses according to the ILO list of Occupational Diseases The numbers reported are based on illnesses reported via the health and safety management system during the reporting period
Total employee turnover (headcount)
According to the European Sustainability Reporting Standards (ESRS) S1-6, we report the total number of employees who have left the company during the reporting period This number includes all employees and is calculated based on the total number of retirements, voluntary or involuntary resignations etc
Total rate of employee turnover
According to the European Sustainability Reporting Standards (ESRS) S1-6, we report the total rate of employee turnover based on the total employee turnover (headcount) compared to the average number of employees on the payroll during the year
Governance
Incidents of corruption or bribery
According to the European Sustainability Reporting Standards (ESRS) G1-4, we report the number of incidents of corruption or bribery discovered by our legal department in the reporting period� Incidents are counted when they lead to legal action against employees or other parties involved in the incident �
Number of convictions related to anti-corruption and anti-bribery laws
According to the European Sustainability Reporting Standards (ESRS) G1-4, we report the number of convictions related to anti-corruption and anti-bribery laws in the reporting period�
Amount of fines related to anti-corruption and anti-bribery laws
According to the European Sustainability Reporting Standards (ESRS) G1-4, we report the amount of fines from convictions related to anti-corruption and anti-bribery laws in the reporting period�
Our business | Environment | Social | Governance | Sustainability data | 37 KK Wind Solutions | ESG report 2023

Our business | Environment | Social | Governance | Sustainability data | 38 KK Wind Solutions | ESG report 2023
ESG data overview
Year Targets ESRS alignment Note 2023 2022 2021 2023 2024 2027 2030 1 Environment a Total energy consumption � MWh 1 17,645 7,261 N/A E1-5 b Gross GHG, Scope 1� tonnes 1,491 935 N/A E1-6 c Scope 1 GHG emissions from regulated emission trading schemes � % 0 0 N/A Net-zero E1-6 d Gross GHG, Scope 2, location-based � tonnes 5,759 2,646 N/A E1-6 e Gross GHG, Scope 2, market-based � tonnes 1,867 79 N/A E1-6 f Gross GHG, Scope 3� tonnes 2 216,391 N/A N/A Net-zero E1-6 g Total GHG emissions, location-based tonnes 2 223,641 N/A N/A E1-6 h Total GHG emissions, market-based � tonnes 2 219,749 N/A N/A E1-6 Total waste generated � tonnes 3 1,914 1,125 N/A E5-5 2 Social a Total number of employees (headcount) Number 4 2,476 N/A N/A S1-6 b Total number of members in Board of Directors Number 5 N/A N/A S1-9 c Share of underrepresented gender in Board of Directors % 20 N/A N/A 40% S1-9 d Total number of employees in Senior Management Number 42 N/A N/A S1-9 e Share of underrepresented gender in Senior Management % 4 12 N/A N/A 20% S1-9 f Employees covered by Health and Safety management systems % 100 100 100 S-14 g Fatalities linked to work related injuries or illness Number 0 0 0 S-14 h Total number of recordable work-related accidents (TRIR) Number 47 86 43 S-14 Total rate of recordable work-related accidents per million working hours (TRIR) Rate 4 0 7 6 7 9 6 3 5 S-14 Total rate of lost-time work-related accidents per million working hours (LTFR) Rate 0 9 1 3 2 9 1 1 S-14 k Total number of recordable work-related illness Number 0 0 0 S-14 Total employee turnover (headcount) Number 420 N/A N/A S1-6 m Total rate of employee turnover % 17 N/A N/A S1-6 3 Governance a Incidents of corruption or bribery Number 0 N/A N/A G1-4 b Number of convictions related to anti-corruption and anti-bribery laws Number 0 N/A N/A G1-4 c Amount of fines related to anti-corruption and anti-bribery laws. kDKK 0 N/A N/A G1-4 Our business | Environment | Social | Governance | Sustainability data | 39 KK Wind Solutions | ESG report 2023
2
1
Note:
as a high climate impact sector
Notes:
1 According to disclosure requirement E1-7 we can state that we have not been involved in GHG removals and GHG mitigation projects
2 According to disclosure requirement E1-8 we can state that we currently do not have a internal carbon prising mechanism
*) According to SBTi we have focused our reporting effort on the top 90% of our scope 3
Note 1: Total Energy Consumption, MWh Year 2023 1 Fossil energy consumption a Fuel from coal MWh 0 b Fuel from crude oil MWh 0 c Fuel for Natural gas � MWh 5,380 d Purchased electricity and heat � MWh 5,711 e Total fossil energy consumption. MWh 11,091 f Share of fossil sources in total energy consumption % 63
Notes
Renewable energy consumption a Fuel from renewable sources MWh 0 b Purchased electricity and heat � MWh 6,554 c Self-generated renewable energy� MWh 0 d Total renewable energy consumption. MWh 6,554 e Share of renewable sources in total energy consumption % 37 3 Total Energy consumption a Total Energy consumption MWh 17,645 b Revenue from financial statement. 1.000 DKK 5,486,054 c Energy intensity. MWh pr. kDKK turnover 0,003
All of KK
Note 2: Scope 3 GHG emissions split on main categories Year 2023 2020 1 Main scope 3 categories *) a Category 1: Purchased goods and services Kt 216,391 105,340 b Total scope 3 GHG emissions Kt 216,391 105,340 c Total GHG emissions, location-based tonnes 223,641 108,570 d Total GHG emissions, market-based tonnes 219,749 106,774 2 Emission intesity a Revenue from financial statement. kDKK 5,486,054 2,579,690 b GHG emission intensity, location-based � tonnes GHG pr kDKK turnover 0,041 0,042 c GHG emissions intensity, market-based tonnes GHG pr kDKK turnover 0,040 0,041
Wind Solutions revenue is seen included in NACE section C and therefore in relation to this reporting seen
Our business | Environment | Social | Governance | Sustainability data | 40 KK Wind Solutions | ESG report 2023
Note 4: Number of employees Year 2023 Female Male Total 1 By country a China Number 64 154 218 b Denmark Number 168 453 621 c India Number 71 318 389 d Poland Number 554 644 1,198 e Others (Germany,Spain,Taiwan,USA) Number 8 42 50 f Total number of employees Number 865 1,611 2,476 2 By employee type a Permanent employees Number 865 1,611 2,476 b Temporary employees Number 0 0 0 c non-guaranteed hours employees Number 0 0 0 d Total number of employees Number 865 1,611 2,476 3 By employee age a Employees < 30 years old Number 160 391 547 b Employees 30 < 50 years old Number 521 941 1464 c Employees > 50 years old Number 184 279 465 d Total number of employees 865 1,611 2,476 Note 3: Total waste generated Year 2023 1 Total waste generated Kt 1,914 a of which is hazardous Kt 109 b of which is prepared for reuse Kt 0 c of which is recycled Kt 1,673 d of which is recovered in other ways Kt 6 2 Total hazardous waste not recovered Kt 54 a of which is sent for incineration Kt 50 b of whidh is sent for ladfill Kt 4 3 Total non-hazardous waste not recovered Kt 181 a of which is sent for incineration Kt 180 b of whidh is sent for ladfill Kt 1 4 Total waste not recovered Kt 235 a Total percentage of waste not recovered % 12 Our business | Environment | Social | Governance | Sustainability data | 41 KK Wind Solutions | ESG report 2023
SASB data overview
Year 2023 1 Energy Management a Total energy consumed � GJ 63,522 b Percentage grid electricity % 66 c Percentage renewable % 37 2 Hazardous Waste Management a Amount of hazardous waste generated tonnes 109 b Percentage recycled % 88 3 Business Ethics a Total amount of monetray losses as a result of legal proceedings associated wiht bribery or corruption 1 000 DKK 0 b Total amount of monetary losses as a result of legal proceedings associated with anti-competitive behaviour regulations 1 000 DKK 0 Our business | Environment | Social | Governance | Sustainability data | 42 KK Wind Solutions | ESG report 2023
Sustainable Development Goals – our selected goals

Where we can influence society at large

Our offerings play a crucial role in the shift towards green energy, contributing to offering citizens cost-effective and green energy options. We will focus on increasing energy efficiency, electrification, and advancing clean energy technologies, solutions, and services.
Where we can create positive impacts

Our products are central to efficient renewable energy generation and placed in 43,000 wind turbines around the globe helping to save around 0.4 billion tons of CO2 in 2023.
Where we can reduce the negative impact of our operations


We seek to become a company that operates with responsibility and consideration for the environment throughout all aspects of our supply chain and understand the importance of mitigating any adverse effects on people and the environment.
We recognise the significance of promoting equal opportunities for all, enhancing diversity, and eradicating all forms of discrimination. We will focus on equality from multiple aspects, not just limited to addressing specific inequalities.
Our business | Environment | Social | Governance | Sustainability data | 43 KK Wind Solutions | ESG report 2023

About KK Wind Solutions
Building on more than 40 years of experience in electro-mechanical systems for wind, KK Wind Solutions’ capabilities span development of state-of-the-art technologies, high quality lean manufacturing, cost-efficient supply chain solutions and flexible service of wind turbines.
©2024
KK WIND SOLUTIONS A/S. ALL RIGHTS RESERVED. CONTENT MAY NOT BE REPRODUCED WITHOUT WRITTEN PERMISSION FROM KK WIND SOLUTIONS A/S. 04/2024-EN
NISSENS COOLING SOLUTIONS
The CSR Section from Nissens Cooling Solutions’ Annual Report for 2023 is enclosed on the next pages.
A.P. MØLLER HOLDING A/S CSR REPORT 2023 152
Business model & Nissens Cooling Solutions’ approach to sustainability
Corporate social responsibility
This report constitutes the company’s statutory reporting cf, § 99a and 99b according to the Danish companies act.
Being a global production company, the Nissens Cooling Solutions Group is committed to offering a contribution to a limitation of the Group’s environmental and climate footprint, just as it is the Group’s obligation to consider the health and safety standards applicable for its employees.
The reported measures in this report contain data for 12 months ranging from January 1st 2023 to December 31st 2023 and is the third set of reported figures for the company on a stand-alone basis. Nissens Cooling Solutions will continue to adhere to UN Global Compact and will continue to develop the focus and initiatives linked to social responsibility and sustainability.
Human rights
Nissens Cooling Solutions is committed to supporting and respecting the internationally proclaimed human rights. In the future, the Company continues its efforts within the area
Area Risk Actions in 2023 Results 2023
Code of Conduct Adverse human rights, negative environmental impact, and corruption issues in own organizations and external supply chain.
We continue to specify our expectations to our employees across Nissens Cooling Solutions’ global organization and to our suppliers in our Code of Conduct. As part of hiring new employees they are all presented to our Code of Conduct and sign that they have read and understood the content.
Data privacy Not handling personal and sensitive personal data and information in compliance with legal regulations and internal guidelines. We have set-up initiatives and procedures to further strengthen our processes on management of sensitive personal data and information.
All of Nissens Cooling Solutions’ employees are made acquainted with the Code of Conduct, and a large number of our suppliers receive our Code of Conduct in the course of formalizing our business interaction.
Our target for 2023 was to secure that all managerial staff at top three levels at Nissens Cooling Solutions receive and sign our Data Privacy Policy and procedures to secure compliance. This target is reached. No event of breach of data privacy has been recorded in 2023.
1 NCS International Holding ApS | Annual report | CSR section | 2023
Social & Labor Conditions
Corporate social responsibility
The experience, competence and well-being of Nissens Cooling Solutions’ employees are vital elements in our ability to develop the business and succeed with our strategic plans and objectives. Across the Nissens Cooling Solutions Group, there is a commitment to supporting a safe and healthy work environment, the risk management of work-related accidents and injuries is a focus area. In the future, the Company expects to continue our efforts within the area.
Area Risk Actions in 2023 Results 2023
Employee development & satisfaction
Fluctuating employee turnover levels.
Gender balance
It is outlined in Nissens Cooling Solutions’ policy on gender and cultural diversity that we work to ensure that regardless of gender, race, and religion, all employees must be treated equally, in order to ensure that everyone has equal opportunities for employment.
Employee safety, health and well-being
Employees getting injured at work.
In 2023 the workers committee (SU) has established sub-committees working on employee turn-over, closer monitoring of absence and planning of competence development, also supported by competence-base salary-adjustments.
Our health and safety focus is supported by regular, ongoing measurement and follow-up on e.g. the development of injury rates.
High sickness absence impacting negatively on daily operations and planned outputs.
We measure and follow up on our sickness absence on both blue-collar and white-collar employees on a monthly basis and take necessary actions to support our employees and limit as well as prevent absence due to sickness.
In our policy on gender and cultural diversity, we have defined a target of a minimum share of female managers on all management levels.
These initiatives are still on early stages but will continue during 2024.
For 2023, our LTIR (Lost Time Injury Rate) on blue-collar & white-collar employees in China, Slovakia, the Czech Republic and Denmark combined is 0,9/ 200.000 WH.
Weighted average for our short-term sickness absence rate for blue-collar and white-collar employees measured across our main sites in 2023 was 2.7% compared to a level of 3.1% in 2022.
End of 2023, the female representation in Nissens Cooling Solutions’ Group Management amounts to 24%.
2 NCS International Holding ApS | Annual report | CSR section | 2023
Diversity in other managerial positions Risk of discriminating based on gender, race, religion, ethnicity when hiring new employees.
31-12-2023 5 20 40 2026 31-12-2023 25 24 40 2026 Board of Directors – Total members – Share of underrepresented gender (%) – Target (%) – Target year Leadership positions – Total members – Share of underrepresented gender (%) – Target (%) – Target year
Climate
Corporate social responsibility
Nissens Cooling Solutions strives to minimize the risk of having an unnecessary detrimental impact on the climate through the optimization of our energy consumption and a reduction of the Group’s CO2 emissions. The Group’s ambition and approach are outlined in its environmental and energy policies. This applies to all of Nissens Cooling Solutions’ locations and define the work within environment and climate in Nissens Cooling Solutions’ production sites.
A large effort is being given to purchase of renewable energy certificates (RECs) or similar, bringing down the emissions from purchased electricity.
In addition Nissens Cooling Solutions has carried out climate accounting for scope 1 and 2 for 2021 and 2022 and has created a scope 1 and 2 reduction road map, showing a 42% reduction towards 2030 (compliant to Science Based Targets).
In the future, the Company expects to continue our efforts within the area.
Area Risk Actions in 2023 Results 2023
Energy consumption Limitation of energy consumption impact. In 2023, we have investigated the ability to fully replace gas with electricity in our brazing furnaces.
CO2 emissions – scope 1 and 2
Limitation of climate impact through production optimization.
In 2023, we have replaced gas with electricity and finalized climate accounting scope 1 & 2 and created a reduction road map.
Test results have proofed that gas can be fully avoided in our batch CAB furnaces. So far it is implemented on one furnace to see the long term wear and tear effect.
Gas replaced by electricity in one furnace. As electricity is CO2e neutral utilizing green certificates this is giving reductions in our scope 1.
Climate accounting shows a 46% drop in scope 1 & 2 emission from 2020 to 2022 (Marked based –reduction mainly driven by green certificates).
3 NCS International Holding ApS | Annual report | CSR section | 2023
Anticorruption Environment
Corporate social responsibility
Nissens Cooling Solutions strives to minimize the environmental footprint of our production through a continuous focus on resource optimization throughout the Group’s production facilities. The environmental management system is certified according to ISO14001 standards, and the Group is working in a structured manner with our environmental awareness and sustainability for years. In the future, the Company expects to continue our efforts within the area.
Area Risk Actions in 2023
Waste Excessive waste through production. We continuously work with optimizing our process waste. We have strengthened focus on NTI (New Technology Introduction) with a clear objective to reduce material consumption. Consequently the waste will be reduced as well.
Results 2023
Building on known cooler technologies we have successfully downgauged the tube plate material with 34%. Overall this give a material reduction on cooler level on ca. 15%.
The “down-gauge” technology is being implemented in both new designs as well as in cost outs in existing designs, and the solution is expected to really kick-off during 2024.
The Nissens Cooling Solutions Group is committed to upholding a high degree of business ethics in all the markets in which the Group operates, and Nissens Cooling Solutions works against corruption in all of its forms. The Group’s expectations regarding anti-corruption are specified in a Code of Conduct, which all of Nissens Cooling Solutions’ employees must comply with. In the future, the Company will continue our efforts within the area.
Area Risk Actions in 2023
Corruption Employees engaging in activities of corruption.
Our Code of Conduct is distributed to our employees during their onboarding in the company.
Whistleblower access is available for named or anonymous reporting of breaches of laws and regulations as well as non-compliances with Nissens Cooling Solutions’ policies.
Results 2023
We have not identified any non-compliance or breaches with our Code of Conduct in the reporting year.
No reports on incidents nor confirmed incidents are registered in our whistleblower system in 2023.
4 NCS International Holding ApS | Annual report | CSR section | 2023
MAERSK SUPPLY SERVICE
The Sustainability chapter from Maersk Supply Service’s Annual Report for 2023 is enclosed on the next pages.
A.P. MØLLER HOLDING A/S CSR REPORT 2023 157
Acting with constant care is embedded in the culture of Maersk Supply Service, and its values act as a guide towards a safe, compliant and healthy work environment, offshore as well as onshore. A safe working environment for its employees, partners and clients remains the focus for all projects and operations. The company maintains a high level of quality and ensures compliance throughout its organisation, and is committed to conducting business in a sustainable, ethical and conscientious manner.
Maersk Supply Service is also committed to its vision, “Actively taking part in solving the energy challenges of tomorrow”, by leveraging its assets and expertise to help drive the UN Sustainable Development Goals. No one individual, company or organisation can solve the climate crisis alone – the scale is global, and it will require a collective effort to devise a global solution. Through partnerships, cooperative action, and taking responsibility for its own impact, Maersk Supply Service continues to drive improvements to its ESG performance.
The Corporate Sustainability Reporting Directive (CSRD) and European Sustainability Reporting Standards (ESRS) require that companies adapt their reporting to comply with rules and regulation set out over the coming years. Maersk Supply Service is in scope from 2025 and is actively preparing to adapt to the requirements and to provide transparency on the impact on society and the environment from its operations.
Environmental
Maersk Supply Service continued to effect positive environmental developments during 2023. The company tracks its decarbonisation efforts against the Carbon Intensity Indicator metric. In 2023, the Carbon Intensity Indicator was 73.3 (g/kWh) – a reduction from the 2022 figure of 76.0 (g/kWh).
From the 2018 baseline, Maersk Supply Service has reduced its carbon intensity by 21%. This progress has been made by focusing on emissions-conscious behaviours, closer collaboration with customers, and technical upgrades to the fleet. Maersk Supply Service is committed to continue its progress on reducing emissions. The target for the company is to have reduced its carbon intensity by 40% in 2028, from a 2018 baseline.
Social Safety
Safety is part of everything Maersk Supply Service does. Every hour of every day the company operates under conditions that are potentially dangerous if not managed correctly. Maersk Supply Service believes that safety is a leadership matter, and everyone is responsible for taking care of each other.
In 2023, Maersk Supply Service improved its safety performance compared to 2022. While two Lost-TimeIncidents were reported – the same level as 2022 – the Total Recordable Case frequency significantly improved throughout the year, starting at 2.01 and ending at 0.77 by December due to less recordable cases (five in 2023 vs. 11 in 2022) and an increased activity level.
A total of five High Potential cases were seen during 2023. These cases are incidents causing no loss or damage but, under different circumstances, would have resulted in an incident. Out of the five incidents, one High Potential case was directly related to Maersk Supply Service. The remaining four were client incidents onboard Maersk Supply Service vessels. The total of five High Potential cases onboard Maersk Supply Service vessels signifies a decrease compared to 2022 where 11 High Potential cases, all Maersk Supply Service related, were recorded onboard Maersk Supply Service vessels. Maersk Supply Service tracks High Potential cases and other relevant safety metrics as a mean to continue to improve safety onboard our vessel on a proactive manner.
ESG
Page l 1dd
Diversity and inclusion
Addressing the challenges within the shipping industry revolves around navigating the green transition. It is imperative for the sector to pioneer and implement solutions that mitigate the environmental impact of marine services, requiring a culture of innovation. Diversity stands out as a pivotal driver for innovation and flourishes in various dimensions within Maersk Supply Service’s operations – encompassing nationality, educational background, and other facets.
Maersk Supply Service embodies this diversity ethos with a team of over 1,400 individuals representing 37 different nationalities. Despite these strides, we acknowledge the ongoing need for improvements, particularly in enhancing gender diversity within an industry that is still male dominated.
Maersk Supply Service is a signatory of Danish Shipping’s More Women in Shipping and has adopted the goals in the charter such as increasing its number of women, ensuring equal opportunities, and implementing concrete measure to increase women in the company.
On the basis of its Diversity & Inclusion (D&I) strategy, Maersk Supply Service continues its D&I journey with focus on increasing female leadership. The main focus and activities, during 2023, have been around the recruitment process as well as strengthening internal processes and awareness.
Management level
Board of directors
Other management levels
Some of the D&I initiatives and actions during 2023 within Maersk Supply Service was:
● A DEI week across the organization, onshore and offshore. Hosting and facilitating D&I activities (lunches, townhalls, information sharing).
● Ensuring a D&I focus within the recruitment process incl. gender neutral job ads, diverse candidate slates and training of leaders.
● Planning and facilitating psychological work safety workshops across all locations, onshore and offshore, to ensure an open space to talk about well-being, psychological work safety, work culture and inclusion.
● Setting a deliberate target of not becoming less diverse as an organization, despite having to make more than 100+ onshore employees and leaders redundant during 2023. This target was achieved at both overall organisational level and at leadership level (senior leadership and across all leadership positions).
In addition to above, the Senior Management Team in Maersk Supply Service, now consist of 6 positions, where one of the roles have been filled by a female during 2023. Increasing the female representation in the senior management to 17%.
Within Maersk Supply Service, the female leadership percentage has been stable for the last three years at around 30%. This is for female leaders below the Senior Management level. The target remains unchanged from previous years (30%).
Given that the organisation went through a lot of organisational change in 2023, including a company ownership change and 2 significant re-organisations incl. redundancies, our focus was primarily on the wellbeing of the people during a period of significant uncertainty and high level of change.
Underrepresented gender
40 % 17 %
Number of members 5 6 Page l 2dd
As we enter 2024, the company has embarked on a strategic approach, engaging leaders to foster the necessary cultural shift. As part of this, the D&I strategy and targets will be reviewed during 2024. This is to ensure that this is aligned up against the Maersk Supply Service, Together Towards’28 strategy which is currently being rolled out. It is also a recognition of the need to have a continued focus on D&I.
Maersk Supply Service achieved its 2023 target of equal gender representation on its Board of Directors, in accordance with section 99b of the Danish Financial Statements Act. The target remains unchanged at 40% underrepresented gender for the Board of Directors.
Governance
Corporate social responsibility
Concerning compliance with section 99a of the Danish Financial Statements Act, reference is made to the parent company A.P. Møller Holding A/S' (CVR number 25679288) separate sustainability report on the website: https://apmoller.com/reports/
Data ethics
Data ethics is an area that has been developed through introducing processes, raising awareness and training throughout the organisation. One example is the IT awareness programme rolled out to Maersk Supply Services +1,400 employees.
Our data ethics principles aim to ensure that data is handled in a correct and responsible way. Maersk Supply Service continually monitor and update the data ethics policy and guidelines to protect individual’s privacy, and to safeguard the company from legal, business, and reputational risk.
Page l 3dd
MAERSK TANKERS
The Sustainability chapter from Maersk Tanker’s Annual Report for 2023 is enclosed on the next pages.
A.P. MØLLER HOLDING A/S CSR REPORT 2023 161
Sustainability
The shipping industry plays a critical role in providing the world with a reliable supply of energy. It is an efficient and dependable mode of transportation that enables people and economies to thrive.
The industry, by its very nature, is global with multiple stakeholders in its supply chain. Its impact on people and the planet comes with a responsibility to consider and promote the integration of economic, social and environmental activities into core business practices.
Maersk Tankers’ business model is focused on the commercial management of tanker vessels on behalf of shipowners. As a values-led company that is guided by its purpose, we are committed to the United Nations Global Compact (UNGC) principles on human rights, labour, anti-corruption and the environment. We use our voice to urge stakeholders to focus on important issues like climate change, the fair treatment of workers, and diversity, equity and inclusion. The health and safety of employees, as well as the safety of the vessels and cargoes, continue to be of the highest priority.
Climate
Tackling climate change is a pressing issue. Shipping transports about 90% of world trade and accounts for nearly 3% of the world’s CO2 emissions. While there is substantial work ahead of the industry to decarbonise, it is encouraging to see the industry increasingly mobilising and taking action to reduce its environmental impact.
As the manager of a sizeable fleet, we are committed to the United Nations Sustainable Development Goal 13 that seeks to combat climate change and its impact. In action, this means we are investing, developing and deploying solutions that help shipowners cut vessel emissions.
In 2023, Maersk Tankers has taken a number of steps towards this goal. Central to our strategy this year has been the implementation of the European Union Emission Trading Scheme (ETS) regulations. We engaged proactively with our pool partners to manage the introduction of EU Allowances (EUAs) effectively This includes commercial, reporting and compliance related aspects of the regulation.
In addition, in the area of fuel optimisation, we have achieved significant results cutting 9,197 MT of fuel in 2023 and total accumulated fuel savings of 95,519 MT with 2017 baseline, furthering our record of environmental stewardship. Our pursuit of innovative solutions has led us to utilize Robotic UWS technology equipped with brushless (waterjet) systems, enabling better cleaning and no paint degradation, demonstrating our commitment to pioneering new methods for reducing emissions and improving operational efficiency.
Overall, our initiatives in 2023 have been focused on not just adhering to existing regulations but also proactively preparing for future challenges. Our concerted efforts reflect a blend of operational efficiency, regulatory adherence, and environmental responsibility. As we continue to embrace technology and innovation, we remain committed to driving positive, sustainable change within the shipping industry.
Responsible business
Conducting business in a responsible manner is imperative for Maersk Tankers. We remain steadfast in our commitment to eliminating corruption and ensuring compliance to sanctions, and laws and regulations, as well as safeguarding human rights. Without human rights, an individual possesses neither freedom nor dignity.
We employ legal experts to monitor geopolitical developments, so we can respond quickly when sanctions are introduced or changed. The industry has seen 12 new sanctions packages introduced by the EU (the latest in January 2024) in the wake of Russia’s invasion of Ukraine. We work to ensure compliance in our operations by following procedures and using screening tools. In 2023, as a result of our work, we ensured that the fleet traded in compliance with theses complex sanctions landscape.
Page | 1
We are committed to providing a safe, healthy, and supportive work environment that promotes the physical, mental, and emotional wellbeing of our employees.
We believe that employee wellbeing is essential to the success of our business, and we are dedicated to fostering a culture of wellbeing that supports our employees in achieving their full potential.
That is why we, among other things, offer flexible working opportunities allowing employees to better balance the commitments of work and private life, a balanced set of social activities focused on physical and mental health driven by local employee committees, and a holistic development approach for employees to proactively voice and work on how they contribute, grow, and thrive.
We will continue to take measures and support our employees in addition to the policies and systems already in place as outlined in the employee handbooks.
We manage health and safety related risk for external personnel through compliance of our policies in the Third-Party Code of Conduct. Maersk Tanker’s Third-Party Code of Conduct states the material risks and requires our counterparties to provide a safe, secure, and healthy working environment for their workforce.
From the procurement side, Responsible Procurement (RP) is about mitigating the inherent risk of doing business. Visibility into complex supply chains can be limited, meaning that illegal or ethically questionable practices may result in negative consequences for our business. By placing a focus on ethical, social, and environmental considerations in our supply chain, we expect our suppliers to make continuous improvements towards sustainable business conduct.
The RP programme objective is to continuously improve social and environmental impacts in our supply chain by:
• integrating sustainability into the purchasing processes
• managing risks and opportunities related to sustainability in our supply chain, and
• measuring and increasing compliance with MT social and environmental standards
• We continuously work to improve our supply chain sustainability by creating awareness, transparency, and commitment of our stakeholders across locations where we procure.
We are committed to continue to work on the above-mentioned RP programmes initiatives in 2024
Our commitment to RP is set out in Maersk Tankers’ Third-Party Code of Conduct and in our Sustainability Policy (Governance Framework). The programme and the Code reflect our commitment to the United Nations Global Compact (UNGC) principles for business sustainability and international standards, such the core labour conventions of the International Labour Organisation and the UN Declaration of Human Rights and our own principles of Conduct. It addresses anti-corruption, respect for human rights, safe and decent labour practices, and environmental protection.
As part of the Responsible procurement programme, we screen all contracted suppliers and categorize them into low and highrisk categories on an ongoing basis. All supplier contracts should include the Code of Conduct and an RP clause. Additionally, in 2023 we also conducted compliance audits on high-risk suppliers with the help of third-party auditors.
We have strict policies to ensure that we do not engage in corruption of any kind. We are a member of the Maritime AntiCorruption Network (MACN), which works towards eliminating corruption and enabling fair trade, and we strictly adhere to our Zero Facilitation Payment Policy. Our stance and expectations on anti-corruption and bribery are also stressed in our ThirdParty Code of Conduct. We will proceed with our work in this important area, taking our part in driving positive change in shipping.
There have been zero bribery cases in 2023 in line with our ambitions.
We will continue our work on eliminating corruption as a member of MACN and following our Zero Facilitation Payment Policy in 2024 as it enables to achieve our anti-corruption objectives.
Page | 2
We have an unwavering commitment to sustainability and will continue to work to create a positive impact for society and the planet.
You can read about our sustainability work at:
https://maersktankers.com/strategy/sustainability
Diversity, equity, and inclusion
We are committed to creating a diverse, equitable, and inclusive workplace where everyone regardless of their gender, ethnicity, experience, religion, sexual orientation, disability, and age feels valued, respected, and can thrive.
At Maersk Tankers, we employ a workforce of various nationalities, ages, cultures, and experiences in an effort to mirror the diverse and global world we operate in.
In 2023, we continued building on the strong foundation from previous years, focusing primarily on strengthening inclusive leadership capabilities and broadening perceptions of allyship.
In accordance with the guidelines from the Danish Business Authority, there is equal representation in the Board of Directors and other management levels of Maersk Tankers.
We will continue to take measures to further strengthen diversity, equity, and inclusion across all levels of the company.
Data Ethics
Data ethics is an area that has been developed through introducing processes, raising awareness and training throughout the organisation. One example is the IT awareness programme rolled out to Maersk Tankers’ all employees.
Our data ethics principles aim to ensure that data is handled in a correct and responsible way. We continually monitor and update our data ethics policy and guidelines to protect individual’s privacy, and to safeguard the company from legal, business, and reputational risk.
Page | 3
Management Level Number of members Share of underrepresented gender Board of directors 6 (50/50 gender representation) 50% Other management levels 11 (share of underrepresented gender is 5 out of 11) 45%
A.P. MOLLER CAPITAL
The ESG Report for 2023 is enclosed on the next pages.
A.P. MØLLER HOLDING A/S CSR REPORT 2023 165
ENVIRONMENTAL, SOCIAL, AND GOVERNANCE REPORT 2023


WE ARE GUIDED BY OUR FIVE CORE VALUES
CONSTANT CARE
Take care of today, actively prepare for tomorrow
HUMBLENESS
Listen, learn, share, give space to others
UPRIGHTNESS
Our word is our bond
OUR EMPLOYEES
The right environment for the right people
OUR NAME
The sum of our values, passionately striving higher
Case studies 2 A·P·MOLLER CAPITAL ESG REPORT 2023 Environmental impact About Sustainability Social impact

Case studies 3 A·P·MOLLER CAPITAL ESG REPORT 2023 Environmental impact About Sustainability Social impact Message from our CEO 5 About A.P. Moller Capital 6 Overview of our investments 7 Impact highlights 8 Sustainability in our investment process 10 Our goals and challenges 12 Portfolio KPIs 13 Social impact 15 Environmental impact 18 TABLE OF CONTENTS Case studies 21 Case Study 1: Vector Logistics 22 Case Study 2: Mass Céréales Al Maghreb 23 Case Study 3: Cabeolica 24 Case Study 4: Eranove 25 Case Study 5: Impala Energy Holdings 26 Case Study 6: Arise Ports & Logistics 27
information contained herein is subject to the disclaimer provided at the end of this document.
The
ABBREVIATIONS
AIF I Africa Infrastructure Fund I K/S
BDN Blue Dot Network
BESS Battery Energy Storage Systems
CAPEX Capital expenditures
CNG Compressed natural gas
CO2-eq CO2-equivalent
EHS Environmental, Health and Safety
EMIF II A.P. Møller Capital - Emerging Markets Infrastructure Fund II K/SI
ESAP Environmental and Social Action Plan
ESDD Environmental and Social Due Diligence
ESG Environmental, Social and Governance
GHG Greenhouse Gas
HFO Heavy fuel oil
IEA International Energy Agency
JIM Joint Impact Model
OECD Organisation for Economic Co-operation and Development
PPP Public Private Partnerships
SBT Science-based targets
SHA Shareholders agreement
VCM Voluntary Carbon Market
Case studies Environmental impact About Sustainability Social impact
4 A·P·MOLLER CAPITAL ESG REPORT 2023
MESSAGE FROM OUR CEO
This time last year, I talked about the uncertain macro-economic outlook, declining growth, and the multiple challenges impacting the world simultaneously. In many ways, in 2023, these predictions have indeed transpired and will become the conditions we must face in the years ahead. Our job is to navigate this environment successfully to find opportunities and manage risks.
Shifting demographics, growing middle classes, major global urbanisation, geopolitical reconfiguring, and the green transition are providing opportunities for investment in critical infrastructure within transport, logistics and energy. At A.P. Moller Capital, we have continued our focus on tackling global warming, addressing the issue of food poverty, and reducing supply chain disruptions, thereby generating value for our investors. It is with this ambition in mind that we launched our second fund in 2022: A.P. Møller Capital - Emerging Markets Infrastructure Fund II K/S (EMIF II), an Article 9 fund focused on critical infrastructure in the transport and energy sectors in select high-growth markets in Africa, and South and Southeast Asia.
At the heart of EMIF II is our belief that mobilising private capital in emerging markets is central to delivering on the UN Sustainable Development Goals, and on global climate goals, at the necessary scale. In 2023, we invested in the first two assets of the EMIF II portfolio: Hassan Allam Utilities Logistics, in a joint venture with Hassan Allam Utilities in Egypt, and Vector Logistics, South Africa’s leading frozen infrastructure logistics operator. For both assets, we are working with qualified third parties to establish science-based targets that will inform their decarbonisation strategy and put our investments in a trajectory aligned with The Paris Agreement. We also signed a Joint Development Agreement for Sand Cat in December 2023 to develop the port infrastructure for a new large scale green ammonia value chain to be constructed in Guelmim, Morocco.
Environmental and social impact
In addition to our work on reducing the carbon emissions of our portfolio, we have continued to make environmental and social impact in the communities in which we operate. The total contribution
supported by our funds to the GDP in the countries in which we operate is estimated at USD 1,332m, with 156,000 direct, supply chain and induced jobs supported, and 6.3 TWh of electricity provided. Since the contribution of our funds to the national GDP and employment is essential to our own measure of success, we use the Joint Impact Model to estimate these numbers. This is the most consistent and rigorous model available. Our numbers are verified by Steward Redqueen, as a qualified third-party, to make sure we are capturing our impact accurately and consistently. For EMIF II, we have set explicit environmental and social targets showcasing our increased ambition and commitment to the environment and the communities in which we are present.
Health and safety performance
Despite our contributions to our environmental and social targets, I am deeply saddened to report that we have had eight fatalities in Africa Infrastructure Fund I (AIF I). Five people lost their lives in separate incidents at Eranove, and three more fatalities occurred at Arise Ports & Logistics, KEG Holdings, and Impala Energy Holdings, respectively. In each of these cases, investigations have been undertaken to identify the root cause of the incidents. Furthermore, under the direction of our Head of ESG, we are redoubling our efforts to eliminate fatal and life-altering injuries, and are striving for as few lost time injuries as possible across our portfolio. This includes reviewing the health, safety and security processes of all our portfolio companies, benchmarking these against international best practices, and identifying gaps in performance. As part of this effort, we identified road safety as a particular focus area, and established specific programs and procedures to address this issue at the relevant companies. These efforts, among others, included installing remote monitoring software to monitor for traffic violations and mechanical speed limiting devices.
In the coming year, we will take further steps to enhance the health and safety performance of our portfolio companies. I will circle back to this issue in 2024, since, for me personally, the health and safety of the workers and communities in and around our portfolio companies is of the upmost importance.
The year ahead
I am looking forward to the year ahead, and with good reason. Over the last few years, I have witnessed an extraordinary increase in CAPEX going into ESG initiatives. The level of awareness on ESG-related issues is growing to the point where companies no longer present it as a ‘value-add’, but rather as core to how they do business. While challenges remain, particularly in our markets, which are set to experience some of the worst impacts of climate change while also grappling with risk-shy investors to access the large sums of money needed for climate solutions, I am optimistic that fund managers like A.P. Moller Capital are leading the way. This is particularly true in markets where policymakers have yet to catch up with the reality of our collective challenges. Ambitious ESG strategies and collaboration among investors are essential to a green transition, and we at A.P. Moller Capital are committed to play our part.
Kim Fejfer Managing Partner and CEO

Case studies Environmental impact About Sustainability Social impact 5 A·P·MOLLER CAPITAL ESG REPORT 2023
ABOUT
A.P. Moller Capital is a fund manager committed to investing in critical infrastructure investments within the transport and energy sectors in select growth markets where the infrastructure gaps are most significant.
As part of the A.P. Moller Group's overall purpose of 'Nyttig virksomhed', A.P. Moller Capital has made it it's mission to focus on 'doing well while doing good'. Our industrial heritage, global network of local partners, and private equity competence enables access to efficient execution of unique investment opportunities.
A.P. Moller Capital currently manages two funds. Our first fund, AIF I, was launched in 2017 and focuses on African infrastructure investments. During 2022, AIF I was fully invested. The fund’s portfolio now includes eight portfolio companies and 16 infrastructure assets across nine African countries. Our second fund, the EMIF II was launched in 2022. We continue to focus on critical infrastructure and the energy sectors, while expanding our footprint in emerging markets to include Africa, and South and Southeast Asia.
In 2023, A.P. Moller Capital onboarded its first two investments in EMIF II. The first investment was made in Hassan Allam Utilities Logistics, a value-adding warehousing and logistics platform in Egypt, together with the joint venture partner Hassan Allam Utilities. The initial set of assets include CACC Cargolinx the leading independent air cargo handling facility in Cairo, and East Cairo Logistics Park, a grade-A warehousing and logistics park. Both assets operate under long term concessions and leases, and provide high-quality logistics solutions to their customers.
A second investment was made in Vector Logistics, South Africa’s leading frozen logistics operator, which is operational in South Africa, Zambia, Botswana, and Namibia. The company operates 26 cold storage warehouses and provides critical food infrastructure solutions to its customers.
For a comprehensive overview of our portfolio, please refer to the summary of our investments on the next page. On the final pages of this report you can also find case studies about A.P. Moller Capital's portfolio companies Vector Logistics, Mass Céréales Al Maghreb, Cabeólica, Eranove, Impala Energy Holdings and Arise Ports & Logistics
2 FUNDS
OUR VALUE PROPOSITION
• A.P. Moller Capital is an infrastructure fund manager focusing on critical infrastructure investments within transportation and energy.

• We focus on-growth markets where the infrastructure funding gap is most significant and where we benefit from macroeconomic tailwinds driven by demographics, nearshoring trends, and trade patterns.
• Our investments are aimed at tackling, e.g., food poverty, supply chain disruptions, global warming, and the need to decarbonise hard-to-abate sectors.
• We have an active ownership focus, and integrate environmental, social and governance (ESG) considerations throughout the investment cycle, from due diligence to exit.
• We have an experienced team that couples industrial heritage with private equity competence.
40+ EMPLOYEES 3 OFFICES

About Case studies Environmental impact 6 Sustainability Social impact A·P·MOLLER CAPITAL ESG REPORT 2023
OVERVIEW OF OUR INVESTMENTS
AIF I | Assets under management (AUM): USD 1 bn
CONTRIBUTION TO THE SDGS


CABEOLICA
LUMIKA RENEWABLES SOUTH AFRICA
CAPTIVE POWER
EAST AFRICA INFRASTRUCTURE PLATFORM KENYA THERMAL POWER
IMPALA ENERGY HOLDINGS NIGERIA
CAPTIVE POWER (FLARED GAS)
ERANOVE IVORY COAST | TOGO THERMAL POWER, HYDROPOWER, AND WATER DISTRIBUTION
EMIF II | Assets under management (AUM): USD 0.9 bn
CONTRIBUTION TO THE SDGS


About Case studies Environmental impact 7 Sustainability Social impact A·P·MOLLER CAPITAL ESG REPORT 2023
INVESTMENT ASSET LOCATION DESCRIPTION ARISE PORTS & LOGISTICS IVORY COAST | GABON MINERAL AND GENERAL CARGO PORT TERMINALS
CÉRÉALES AL MAGHREB MOROCCO GRAIN TERMINALS
HOLDINGS KENYA LPG IMPORT AND DISTRIBUTION
MASS
KEG
CABO VERDE WIND POWER
SOLAR
INVESTMENT ASSET LOCATION DESCRIPTION HASSAN ALLAM UTILITIES LOGISTICS EGYPT WAREHOUSING & LOGISTICS VECTOR LOGISTICS SOUTH AFRICA | ZAMBIA | BOTSWANA | NAMIBIA WAREHOUSING & LOGISTICS

2023 IMPACT HIGHLIGHTS
A.P. Moller Capital is committed to supporting jobs, providing energy and contributing to economic development in the countries where we invest. Once again, our portfolio had a substantial socio-economic impact across 10 African countries and saw an increase across all impact indicators in 2023.
Having invested in two additional companies as part of EMIF II, the number of direct jobs within our portfolio increased to 16,053. Of those, 21% are female. The portfolio supported an additional estimated 140,000 jobs indirectly through the supply chains and induced spending of salaries, resulting in an estimated total supported employment of 156,000 jobs. The total supported contribution to the gross domestic product (GDP), including direct and indirect impacts, reached an estimated USD 1,332m in 2023. In addition, our power assets provided 6.3 TWh of electricity for the equivalent amount of 16m people. For a comprehensive overview of our impact measurement methodology and social impact in 2023, please refer to the chapter on social impact.
About Case studies Environmental impact Sustainability Social impact
2023 IMPACT HIGHLIGHTS DIRECT JOBS 16,053 ESTIMATED TOTAL SUPPORTED JOBS 156,000 SHARE OF FEMALE TOTAL EMPLOYMENT SUPPORTED 21% ESTIMATED TOTAL SUPPORTED GDP CONTRIBUTION (IN USD)
ELECTRICITY PROVIDED 6.3
8 A·P·MOLLER CAPITAL ESG REPORT 2023
1,332 m
TWh
IN THIS SECTION
SUSTAINABILTY IN OUR INVESTMENT PROCESS
OUR GOALS AND CHALLENGES
SUSTAINABILITY


Case studies Sustainability Environmental impact About Social impact
SUSTAINABILITY IN OUR INVESTMENT PROCESS
At A.P. Moller Capital, we prioritise the maintenance of high ESG standards to increase sustainability in our investment process. We do so as both a means to mitigate risks in emerging markets and as an opportunity for value creation. Consequently, ESG considerations are an integral part of our investment process, enabling us to maximise A.P. Moller Capital’s contribution to sustainable development, and effectively mitigate environmental and social risks, and adverse impacts.
A.P. Moller Capital’s Ethical Policy is the foundation that sets out the fund manager’s Responsible Investment Framework for considering ESG impact and risk throughout the investment process. This is done from the moment a potential investment opportunity is identified, and through our active management of the investment up until exit. Our investment process is aligned with international standards, including the IFC Performance Standards on Environmental and Social Sustainability, the World Bank Group Environmental, Health and Safety Guidelines, the Organisation for Economic Co-operation and Development (OECD) Guidelines for Multinational Enterprises, and the UN Guiding Principles on Business and Human Rights. For a more comprehensive overview of our investment process, and examples illustrating our value creation approach to portfolio management, please refer to the next page.
To achieve our objective and manage ESG risks, while at the same time generate value, A.P. Moller Capital has established an ESG governance framework that looks to integrate ESG considerations throughout the investment process. The framework clearly outlines the ESG roles and responsibilities across our funds including our Investment, Legal and Management teams. This is done in a way that guarantees adherence to our framework at all stages of the investment process. The accompanying figure to the right of this page illustrates the roles of the different functions in incorporating ESG considerations across the investment cycle.
How we create value by integrating ESG into the investment cycle
ESG Governance structure
BOARD OF DIRECTORS is responsible for ensuring compliance with our Ethical Policy.
THE INVESTMENT COMMITTEE evaluates ESDD ndings and ensures that ESG considerations are taken into account in each phase of the pre-investment process.
PROCESS
THE INVESTMENT TEAM is responsible for integrating ESG in accordance with internal policies and procedures, with the support of internal ESG specialists and third-party advisers.
THE ESG TEAM is responsible for implementing the Environmental and Social Management System (ESMS), providing capacity building, and supporting the Investment Team during due diligence and portfolio management.
THE RISK & COMPLIANCE FUNCTIONS provide support to the ESG and investment teams, ensuring compliance with risk procedures and internal policies.
THE RISK & ESG COMMITTEE (RESG)
oversees and monitors Risk and ESG compliance across the organisation. The Committee meets quarterly to discuss general RESG matters, and during the pre-investment process to discuss speci c RESG issues in relation to individual prospective investments.
Case studies Sustainability Environmental impact About Social impact
VALUE CREATION SCREENING ESDD EXIT GOVERNANCE
INVESTMENT AGREEMENT PORTFOLIO MANAGEMENT THE INVESTMENT
RESPONSIBLE INVESTMENT FRAMEWORK
10 A·P·MOLLER CAPITAL ESG REPORT 2023
ESG in the investment process
SCREENING
At the very early stages of the investment cycle, our team determines whether a potential investment will meet A.P. Moller Capital’s ESG requirements. This is done by screening against A.P. Moller Capital’s Exclusion List and investment strategy; outlining the socio-economic impacts and contributions towards our social and environmental targets; and conducting a preliminary assessment of the key environmental and social risks, including a tentative environmental and social risk categorisation.
ENVIRONMENTAL AND SOCIAL DUE DILIGENCE
Once projects have passed the initial screening stage, an Environmental and Social Due Diligence (ESDD) is conducted. This is done against the requirements of the IFC Performance Standards and associated Environmental, Health and Safety (EHS) Guidelines, including any other industry-specific guidelines. The ESDD is a key part of the pre-investment decision-making process and plays a vital role in ensuring that risks are properly managed, and potential value-adding opportunities are identified. It is also at this stage that an Environmental and Social Action Plan (ESAP) is established to ensure the investments’ alignment to A.P. Moller Capital’s ESG requirements.
INVESTMENT AGREEMENT
By the time A.P. Moller Capital is ready to sign an investment agreement, we take steps to formalise commitments from the portfolio company to meet applicable ESG requirements, including what was agreed upon in the ESAP. We do so by incorporating the ESG requirements into the shareholders’ agreement (SHA). This includes outlining how ESG-related matters will be handled during our active ownership, and the requirement that there will be qualified senior staff within the portfolio company responsible for overseeing ESG performance.
PORTFOLIO COMPANY MANAGEMENT
Once companies have been integrated into our portfolio, A.P. Moller Capital, with the support of nominated board representatives, closely monitors their ESG performance and addresses any gaps identified during the pre-investment phase. Company-specific key performance indicators (KPIs) are monitored at our quarterly performance reviews. A.P. Moller Capital also conducts a periodic gap assessment of portfolio companies’ policies against our own Portfolio Governance Manual, which outlines the sustainable and ethical policies that are to be adopted and implemented by our portfolio companies
EXIT
When we decide to exit an investment, we aim to maximise the contribution of good ESG performance to our return on investment (ROI), and to attract buyers for whom good ESG performance is a priority. We provide prospective buyers with historical ESG data and answer questions regarding ESG performance. Nearing the end of the investment term, we conduct an exit assessment which shows to what extent business improvements have been achieved and mitigates post-exit reputational risks.
PORTFOLIO COMPANY MANAGEMENT
Using our active ownership approach to improve ESG performance
Post investment, A.P. Moller Capital appoints a portfolio company board member responsible for overseeing ESG performance. Our aim is to maximise long-term value through active engagement with our companies. Impala Energy Holdings, where in 2022 efforts were made to enhance road safety through various pilot projects, is a good example. The pilot projects included implementing a track and trace system to monitor traffic violations and introducing incentive schemes to encourage safe driving behaviour. In 2023, based on the results of the pilot phase, Impala Energy Holdings expanded the initiatives across the organisation. Currently, the tracking system covers 50% of the company’s fleet, with plans to extend it to 67% over the course of this year. The initial findings are promising, as no significant road incidents have occurred between October and December 2023. Continued monitoring will further evaluate the effectiveness of diverse initiatives and enable further improvements.


PORTFOLIO COMPANY MANAGEMENT
Improving ESG reporting through partnerships
In 2023, A.P. Moller Capital partnered with the ESG management software provider KEY ESG to set up a platform for improving data quality and establishing a comprehensive and streamlined reporting framework across our entire portfolio. The platform facilitates adherence to relevant ESG frameworks and regulations (e.g., the Sustainable Finance Disclosure Regulation), while also enabling the collection of tailored metrics specific to our requirements.
The platform includes carbon accounting software which is aligned to the Greenhouse Gas (GHG) Protocol methodology and incorporates conversion factors from globally verified sources, such as the Department for Environment, Food & Rural Affairs (DEFRA) and the International Energy Agency (IEA). Dashboards within the platform facilitate the identification of significant quarter-on-quarter variances and maintain an audit trail for understanding underlying submissions by portfolio companies.
This platform also allows our portfolio companies to leverage educational resources on ESG, streamline collaboration, analyse performance, identify risks and opportunities, and communicate results with internal and external stakeholders efficiently. As our reporting environment evolves, we anticipate to further enhance the quality of our sustainability disclosures.
Case studies Sustainability 11 A·P·MOLLER CAPITAL ESG REPORT 2023 Environmental impact About Social impact
1 2 3 4 5
OUR GOALS AND CHALLENGES
At A.P. Moller Capital, we believe that the sustainability of our investments is central to achieving positive development outcomes and sound business practices, thereby improving the long-term potential of our investments. We measure the collective contribution of our portfolio companies, for AIF I and EMIF II, to the UN Sustainable Development Goals (SDGs), specifically SDG 7, 8, 9 and 13.
For EMIF II, we have set precise sustainability targets. These include the commitment to reduce scope 1 and 2 emissions of all investments, other than those in the renewable energy sector, by a minimum of 25% during EMIF II ownership compared to the year of investment.1 This is aligned with our intention to minimise the climate impact of our portfolio, and with our goal of being a net zero fund. We work with the portfolio companies in EMIF II to set science-based targets (SBTs) and establish comprehensive decarbonisation plans. In 2023, we engaged third-party consultants to support our first two investments. We did so by verifying the scope 1, 2 and 3 emission baselines, setting SBTs and providing recommendations for decarbonisation.
A.P. Moller Capital is committed to facilitating the purchasing of carbon offset credits for any residual emissions in EMIF II. We do so with the utmost care and pursuant to guidance from good international industry practices, such as the Integrity Council for the Voluntary Carbon Market’s Core Carbon Principles, the Voluntary Carbon Markets Integrity Initiative, and the Oxford Principles for Net Zero Aligned Carbon Offsetting. We focus exclusively on nature-based credits, because we believe that the Voluntary Carbon Market (VCM) can play a role in supporting faster and more ambitious climate action. We conduct extensive due diligence on forest reforestation projects and engage reputable third parties
to advise us on the quality of the credits. Though our purchasing of carbon credits is done entirely as part of our net zero pledge and the result of residual emissions, we aim to comply with this commitment while supporting the right projects with the highest impact potential.
One of our biggest sustainability challenges is implementing ESG best practices in countries in which national legislation does not mirror international standards. An additional challenge is to meet EU Regulatory requirements regarding gathering and disclosing of asset-specific data. Over the last year, as highlighted on the previous page, we have focused on efficient and accurate data collection by rolling out KEY ESG, an ESG management software, across our portfolio companies. This new software helps our assets to collect, analyse and manage ESG data, and has been tailored to our specific needs and includes data requirements from our investors. The ESG management software was tailored in consultation with our portfolio companies and accompanied by numerous capacity building sessions. The information gathered is available for use by our portfolio companies and many have employed it for their own separate reporting.
Sound ESG performance in emerging markets is a trajectory that takes time. It requires a careful balancing act on our part between ensuring alignment with our commitments and allowing time for a company to transition to good ESG performance during our ownership. This is simultaneously our most significant challenge and our most meaningful goal. In the next chapter, we will look into the ESG indicators that we monitor across our funds.

Case studies Sustainability 12 A·P·MOLLER CAPITAL ESG REPORT 2023 Environmental impact About Social impact
1. The reduction target may be an absolute or a physical intensity target, using whichever specific business metric is most applicable for the given company.
PORTFOLIO KPIs
PORTFOLIO KPI s

Social impact Environmental impact About Sustainability Case studies
IN THIS SECTION
PORTFOLIO KPIs
Fund-level ESG disclosures
At A.P Moller Capital, we collect ESG data on a quarterly basis to manage and monitor ESG risks within our portfolio companies, track positive impacts, and fulfil regulatory reporting obligations. The ESG indicators monitored across our funds are highlighted on the right-hand side of this page. As we closed our first two investments in EMIF II in 2023, we will only be able to discuss variances in the data for the first time in next year’s report. A.P. Moller Capital holds quarterly performance meetings to discuss the ESG performance of our portfolio companies.
All mandatory indicators required under the EU SFDR (e.g., Principal Adverse Impact Indicators) are collected and will be reported separately in accordance with the applicable regulatory timelines.
Health and Safety
As mentioned by our CEO at the beginning of this report, we are saddened to report that eight fatalities have occurred across our portfolio companies in AIF I during 2023. Out of the eight fatalities, three occurred at Eranove’s subsidiary CIE, and an additional two at its subsidiary SODECI. In an immediate response to these fatalities, Eranove, with the guidance from A.P. Moller Capital, has prioritised a range of actions. These include the introduction of a zero-fatality policy, which was approved by the board of Eranove in October 2023, and a full review of the effectiveness of CIE’s and SODECI’s Health and Safety policies and procedures by an external auditor. Additionally, an Operations Manager has been appointed who will be responsible for leading the Health and Safety agenda across all Eranove subsidiaries.
The three other fatalities occurred in separate incidents at KEG Holdings, Arise Ports & Logistics and Impala Energy Holdings. Investigations into the root causes of all fatalities have been conducted and corrective actions are being implemented across all companies.
Under the direction of our Head of ESG, we have launched a portfolio-wide initiative to reinforce workplace Health and Safety measures and strive for zero fatalities. This initiative, which is expected to be completed by the end of Q2 2024, will aim at enhancing the effectiveness of the management systems, and strengthening accountability by ensuring adequate resources and governance frameworks are in place across all portfolio companies.
In the following two chapters of this report, we will further go into the details of, and the methodology used to measure our social and environmental impact.
Social impact 14 A·P·MOLLER CAPITAL ESG REPORT 2023 Environmental impact About Sustainability Case studies
EMIF II AIF I ESG INDICATORS - FUND LEVEL ENERGY FY2023 FY2022 DIFFERENCE FY2023 FY2022 DIFFERENCE CONSUMPTION GWh 14,457 12,968 11% 144 n/a n/a OF WHICH: ELECTRICITY GWh 376 350 7% 51 n/a n/a OF WHICH: FUELS GWh 14,081 12,618 12% 93 n/a n/a PRODUCTION GWh 6,334 5,693 11% 2 n/a n/a OF WHICH: NON-RENEWABLE GWh 4,471 4,071 10% 0 n/a n/a OF WHICH: RENEWABLE GWh 1,863 1,621 15% 2 n/a n/a GHG EMISSIONS SCOPE 1+2 KT CO2E 2,870 2,575 11% 66 n/a n/a SAFETY ACCIDENT PREVENTION POLICY % 100% 100% 0% 100% n/a n/a FATALITIES NUMBER 8 3 167% 0 n/a n/a LOST TIME INJURIES (LTIS) NUMBER 125 156 -20% 93 n/a n/a JOBS TOTAL NUMBER OF EMPLOYEES2 NUMBER 12,489 13,098 -5% 5,265 n/a n/a DIRECT EMPLOYEES NUMBER 10,931 10,727 2% 5,122 n/a n/a FEMALE EMPLOYEES % 21% 20% 5% 27% n/a n/a TAXES TOTAL PAID M USD 95 128 -26% 26 n/a n/a ANTI-CORRUPTION POLICY IN PLACE % 100% 100% 0% 100% n/a n/a INCIDENTS NUMBER 0 4 -100% 0 n/a n/a INSUFFICIENT ACTIONS TAKEN NUMBER 0 0 0% 0 n/a n/a COURT CONVICTIONS NUMBER 0 0 0% 0 n/a n/a 2. The total number of employees includes direct employees and third-party hires.
IN THIS SECTION
SOCIAL IMPACT
SOCIAL IMPACT ACROSS OUR PORTFOLIO IN 2023
SOCIAL IMPACT

Social impact Environmental impact About Sustainability Case studies
OUR SOCIAL IMPACT
Impact measurement methodology
We are committed to contributing to the creation of decent jobs and wider economic development in the countries where we invest. Substantiating our contribution in these areas is essential to be able to determine the scale of our social impact. We use the Joint Impact Model (JIM) to measure and communicate our social impact in a consistent and comparable way. This web-based tool harmonises impact measurement for financial institutions and is co-developed and widely endorsed by development finance institutions. The JIM estimates the contribution of our portfolio companies to employment, value added (GDP), and GHG emissions3 at portfolio level by tracing revenues throughout the economy. A combination of client data and sector- and country-level macroeconomic statistics from internationally recognised sources (e.g., ILO, World Bank, GTAP) is used to achieve this.
The JIM quantifies the direct, indirect, and induced impacts of A.P. Moller Capital's portfolio companies. Direct impacts are generated at company level through their own operations. Indirect impacts refer to supply chain impacts, i.e., the portfolio company’s suppliers and subsuppliers. Induced impacts are associated with the spending of wages earned by employees of the portfolio company in the economy. For our investments in port infrastructure, we also estimate the number of jobs created and the contribution to the GDP, resulting from enhanced economic activity by facilitating trade.
A challenge when implementing the JIM in our markets, is the level of detail and quality of the data required to run the model. This is why we have made a consolidated effort to improve the availability and quality of our data using an ESG data management software, which in turn also improves the accuracy of the model. As in previous years, all of our results are verified by Steward Redqueen as an independent third party.
In the fall of 2023, the JIM methodology was updated with the introduction of JIM 3.1, which replaces the previous version JIM 2.0. Since this year marks a transitional period, and to ensure an accurate comparison with last year’s results, our 2023 impact results and assessments are based on JIM 2.0. This enables an analysis of how actual shifts in the performance of A.P. Moller Capital’s portfolio have influenced contribution to GDP, employment, and scope 3 emissions, while excluding changes attributed to methodological updates. Nonetheless, we have also compiled 2023 results using the new methodology, which will serve as our new baseline for next year’s report.
The results of our social impact across our portfolio in 2023, including our contribution to the creation of jobs and to the GDP, are discussed on the following pages.
Electricity provision in 2023
A specific contribution of A.P. Moller Capital to wider economic development is providing electricity to millions of people via our portfolio companies. In 2023, the power assets in our portfolio provided 6.3 TWh of electricity to the estimated equivalent of 16 million people in Cabo Verde, Togo, Ivory Coast, South Africa, and Kenya. Eranove's Kekeli power plant in Togo, successfully operated for an entire year, while the Atinkou facility in Ivory Coast commenced operations in 2023. Of the electricity generated, 29% originated from renewable sources. The green energy was produced by the Cabeolica wind parks on the Cabo Verde Islands, Eranove’s hydropower plants in Ivory Coast, and the rooftop solar installations of Lumika Renewables in South Africa.
4.
Social impact 16 A·P·MOLLER CAPITAL ESG REPORT 2023 Environmental impact About Sustainability Case studies
3. A.P. Moller Capital uses the JIM for estimating our portfolio’s scope 3 emissions. Scope 1 and 2 emissions are calculated using activity-level data from A.P. Moller Capital’s portfolio companies. Both are discussed in the section on environmental impact.
The estimated taxes based on the JIM exceed the taxes displayed in the Portfolio KPIs because the estimate includes additional employee income taxes.
Total jobs supported formal/informal 16/11 95/93 45/43 156/147 Direct Supply chain Induced Tota Total jobs supported by gender Women Men Formal Informal Employment 2023 (000) /Employment 2022 (000) 39% 61% 42% 58% A I F I SU P P O R T E D USD 1,332M VA LU E A DD E D Value added 2023 (USD m) / Value added 2022 (USD m) Direct Supply Chain 551/475 Wages 389 162 432/367 Taxes* 216 216 349/340 Savings 287 62 Our portfolio supported 156,000 local jobs Our portfolio supported USD 1,332m in GDP contribution Wages Savings Taxes4
SOCIAL IMPACT ACROSS OUR PORTFOLIO IN 2023
Contribution to jobs
By the end of 2023, the portfolio companies of A.P. Moller Capital directly employed a total of 16,053 people, marking a significant increase of 50% compared to 2022. To a large extent, this increase is the result of our acquisition of Vector Logistics, which has 4,872 employees. Besides direct employment, our portfolio companies also support a much larger number of jobs via their local suppliers.
For 2023, the JIM estimates that the procurement of inputs from local suppliers supported 95,000 jobs in the supply chains of A.P. Moller Capital’s portfolio companies. This number reflects a 4% increase compared to the previous year. A further estimated 45,000 jobs, what the JIM refers to as induced impact, were supported through the re-spending of salaries by employees and workers in the supply chain. This represents a 9% increase compared to 2022.
The proportion of female employment within the total supported workforce (including direct, supply chain, and induced) is estimated at 39%. Additionally, for every formal job, there were an estimated 1.37 informal jobs in the supply chains of portfolio companies. This percentage has decreased compared to 2022, primarily influenced by reduced activity in the construction sector, which traditionally has a close association with informal labour.
Finally, we assessed the enabled impact of our port infrastructure investments in Gabon and Ivory Coast based on handled volumes per cargo type. For 2023, the JIM estimates that these investments supported 278,000 jobs, marking a 4% increase from 2022. Port infrastructure plays a crucial role in facilitating the flow of goods within and between economies, thereby fostering trade and enhancing overall economic activity.
Contribution to the GDP
During 2023, our portfolio companies contributed USD 440m directly to GDP through the payment of salaries to their employees, payments of taxes to governments, and savings. This represents a 6% increase compared to last year.
The supply chains of our portfolio companies supported a contribution of USD 891m to GDP, which is an increase of 20% compared to last year, due to significantly higher payments to suppliers. A.P. Moller Capital’s port infrastructure investments enabled a contribution of USD 1,665m in GDP, marking an increase of 3%.
A.P. Moller Capital's portfolio supported 156,000 jobs and USD 1,332m in GDP
*Displaying estimated socioeconomic impacts equivalent to a 100% ownership share of the portfolio. Not taking into account the attribution to ownership of AIF I and EMIF II in the portfolio companies.
DIRECT IMPACT
CONFIDENCE LEVEL OF THE ESTIMATES
Social impact 17 A·P·MOLLER CAPITAL ESG REPORT 2023 Environmental impact About Sustainability Case studies ESG REPORT FOR
IMPACT
SUPPLY CHAIN
JOBS GDP IN USD
Re-spending of salaries Purchasing goods and services Handling cargo for customers IMPACT ENABLED BY PORTS Re-spending of salaries 16k (+40%) 483m (+17%) 45k (+9%) 278k (+4%) 1,665m (+3%) 95k (+4%) 891m (+20%) HIGH MEDIUM LOW
INDUCED IMPACT
IN THIS SECTION
ENVIRONMENTAL IMPACT
CLIMATE RISK MANAGEMENT
ENVIRONMENTAL IMPACT

Environmental impact About Sustainability Social impact Case studies
OUR ENVIRONMENTAL IMPACT
Carbon accounting methodology
Besides substantiating our social impact, A.P. Moller Capital is also strongly committed to measuring and reporting our environmental impact. Therefore, in 2023, we enhanced our carbon accounting methodology by adopting a third-party carbon accounting software. This led to improved accuracy in measuring and managing GHG emissions. The software integrates client-entered activity data with industry-approved conversion factors, aligning with the guidelines of the GHG Protocol for calculating scope 1 and 2 emissions.
Consequently, we have restated 2022 scope 1 and 2 emissions for AIF I using our updated methodology. While scope 1 emissions remained relatively unchanged, there has been a reduction in scope 2 emissions. This reduction primarily stems from the use of a new database of emissions factors from the IEA, which is globally acknowledged for its credibility and endorsed by the GHG Protocol as a dependable third-party data source. This enhancement has provided us with more precise data compared to previous reporting periods, enabling us to zoom in more closely on our individual portfolio companies.
Portfolio companies’ GHG emissions in 2023
When we look at AIF I, in 2023, scope 1 emissions increased by 13%. This rise is primarily driven by an increase in emissions from Eranove, which accounts for 90% of the portfolio’s scope 1 emissions. The increase in emissions is predominantly attributed to the Eranove subsidiary Atinkou. The construction of the 390 MW gasfired, combined-cycle power plant (CCPP) in Ivory Coast was completed, and the site became operational during Q2 2023. Atinkou operates an F-class gas turbine, making it the most fuel-efficient
Climate metrics (tCO2-eq)
one on the African continent. It will contribute to meeting base load requirements in Ivory Coast and the wider region and replace more inefficient plants. Additionally, emissions rose at the Kekeli CCPP in Togo, which commenced operations at the end of 2022, and has now completed a full year of operations. The plant plays a key role in fulfilling Togo’s electricity demand and will replace an older, less efficient generator.
In 2023, scope 2 emissions have been reduced by 8%. The main reason for this is the introduction of energy efficiency measures at SODECI, the water distribution company of the Ivory Coast. This decrease predominantly stems from the optimisation of energy consumption in boreholes. SODECI’s action plan for optimising energy consumption involves conducting energy and hydrogeological diagnostic audits for each borehole, as well as identifying and executing optimisation measures such as replacing electric pump units and regenerating boreholes.
Using the JIM, scope 3 emissions have been estimated based on the sector and size of our respective investments. The methodology used in the JIM includes scope 3 emissions related to the investment’s local and international supply chain and does not cover downstream emissions.
Our efforts in realising more efficient, less polluting electricity generation, such as illustrated by Atinkou’s CCPP in Ivory Coast, is further substantiated by our investments in renewable energy, as will be explained on the following pages. As this is our first year for calculating GHG emissions for EMIF II, we will report back next year against the baseline we have established.

Increasing renewable energy capacity
To further substantiate our investments in renewable energy, in 2021, as part of AIF I, we acquired Lumika Renewables. The company offers solar PV solutions to clients in South Africa through its main subsidiary, Terra Firma Solutions. With a focus on addressing the country's heavy reliance on coal and the frequent power cuts, Lumika Renewables brings much-needed renewable energy to the region. By 2023, the company has successfully expanded its total capacity to 275 MW. A notable highlight of the year was the installation of 5 MW of roof-mounted solar panels and 6 MW of batteries at the headquarters of South Africa's largest mobile operator, MTN. This project marks a significant step towards improving MTN's energy stability, sustainability, and cost-efficiency.
Environmental impact 19 A·P·MOLLER CAPITAL ESG REPORT 2023 About Sustainability Social impact Case studies
AIF I EMIF II 2023 2022 Variance 2023 SCOPE 1 2,683,912 2,381,501 13% 25,886 SCOPE 2 119,574 130,602 -8% 40,281 SCOPE 3 917,343 697,000 32% 297,057
Climate risk management
In line with the Task Force on Climate-Related Financial Disclosures (TCFD), we recognise the importance of climate change as a potential driver of financial risks for the companies in which we invest and for our investors. Therefore, climate risk assessment is an integral part of our investment process, from pre-investment due diligence through to ownership, and ultimately to exit.
Understanding that climate risks evolve over time, in 2023, A.P. Moller Capital signed up to Climanomics, a third-party provider that models estimated financial losses arising from both transition and physical climate risks, in line with the TCFD recommendations. When assessing climate change risks, we consider appropriate timeframes, taking into account our typical investment holding period of five to eight years. While climate-related risks may not significantly affect assets during our ownership, they could impact exit risks and consequently exit prices from a buyer’s perspective. Consequently, we assess climate change risks for the 2020 and 2030 decadal periods using various emission pathway scenarios.
Currently, the overall financial risk to our portfolio is considered low. Going forward, we will continue to track the development of climate risks for each portfolio company and take appropriate action in instances in which a material risk is identified.
A.P. Moller Capital’s GHG emissions in 2023
Our commitment to enhancing decarbonisation extends beyond our portfolio companies to our own operations. In 2023, as can be seen on the figure below, the total carbon footprint of our activities as a fund manager is estimated at 1,284 t CO2-eq, which is in line with 2022 levels. Business travel – which is crucial for engaging with portfolio companies and sourcing deals – makes up around 91% of our carbon footprint.
Scope 1: 0 tCO2-eq (Not applicable)
Scope 2: 110 tCO2-eq (Of ce energy consumption)
Scope 3: 1,174 tCO2-eq (Air travel)

Environmental impact 20 A·P·MOLLER CAPITAL ESG REPORT 2023 About Sustainability Social impact Case studies
9% 91%
VECTOR LOGISTICS
ARISE PORTS & LOGISTICS IN
MASS CÉRÉALES AL MAGHREB
CABEOLICA
ERANOVE
IMPALA ENERGY HOLDINGS

CASE STUDIES
Case studies Environmental impact About Sustainability Social impact
THIS SECTION

CASE STUDY:
VECTOR LOGISTICS
Frozen logistics solutions in an unstable power system
Vector Logistics is one of the largest multi-temperature logistics companies in Southern Africa and a provider of critical food infrastructure solutions to its customers. The company has a network of 26 warehouses and an efficient and safe cold chain for food products throughout Southern Africa.
The temperature-controlled supply chain extends the shelf life of products and diminishes food waste. Vector Logistics has contributed to accelerating food waste recycling and recovery over the past four years by repurposing food waste into compost, animal feed, or biodiesel. Crucial for the cold chain is an uninterrupted supply of electrical power. Because of the frequent power outages in South Africa (load shedding), Vector Logistics is required to use back-up diesel power generators which cause substantial CO2 emissions. In addition, South Africa heavily relies on coal plants, which makes its power system one of the most CO2-intensive in the world.
The CO2-intensiveness of the frozen logistics sector must be reduced as much as possible. It is important to note, however, that the embodied emissions of food tend to be at least ten times higher than those of the associated transport and cooling. The prevention of food waste is therefore not only important for food security, but also from a climate point of view; taking steps in the prevention of food waste often prevents more in emissions than what is generated by transporting and cooling it.
Towards a net zero South Africa
Vector Logistics has taken steps to reduce the environmental impact of he cold chain, including the optimisation of transportation routes and improving energy efficiency. With the support of A.P. Moller Capital, Vector Logistics is developing its ESG strategy which focuses on reducing carbon emissions. In line with South Africa’s decarbonisation policy, the company put a five-year plan in place to reduce its emissions by at least 25% per pallet of goods. This goal will mainly be achieved by shifting its energy sources away from fossil fuels towards renewables like solar power, as well as by exploring alternative forms of transportation such as hydrogen and electric vehicles.
A.P. Moller Capital will continue to work with Vector Logistics to streamline its carbon initiatives, and to set SBTs that are aligned with The Paris Agreement. Vector Logistics is one of two portfolio companies with which A.P. Moller Capital is working to set SBTs, as part of the EMIF II sustainable investment framework.
A just transition to net zero requires the above-mentioned decarbonisation initiatives, as well as the creation of jobs that provide income for households. An impact study of Vector Logistics operations is planned in 2024 to examine the full extent of its socio-economic impact and decarbonisation potential.

Impact overview
13,997
JOBS SUPPORTED
240m
GDP SUPPORTED (IN USD)
60,069 tCO2 -eq
GHG EMISSIONS (SCOPE 1 AND 2)
CONTRIBUTION TO SDGs


Case studies 22 Environmental impact About Sustainability Social impact

MASS CÉRÉALES AL MAGHREB
Towards a harmonised certifications landscape in infrastructure investing
Research by the OECD shows that a sizeable investment gap, of between USD 2.5 and USD 3.5tn, exists for required infrastructure projects to achieve sustainable growth and economic resilience worldwide. High quality investments are needed to maximise the economic, social, environmental and developmental impact of projects. The aim of certifications and labels is to make it easier for investors to identify projects with these qualities, but the current range of certifications is often limited to niche applications and does not encompass all aspects of a project’s performance. The need for better certifications is greatest in emerging markets; a survey of private sector and civil society actors showed overwhelming agreement that a credible and trusted certification regime would increase private sector participation in infrastructure projects (97%) and improve appetite for investment in low and middle-income countries (92%)5 .
In 2023, the OECD launched the Blue Dot Network (BDN) pilot to help facilitate capital flows to high-quality infrastructure projects. This voluntary private-sector-focused certification scheme serves as an umbrella seal of approval for infrastructure investments, by combining and streamlining the best-in-class infrastructure certifications and standards already in place. Through the pilot, the OECD’s Trust in Business initiative has been testing the framework on infrastructure projects around the world. The pilot phase allows the OECD to refine the framework and ensure that it covers the right sectors, and is fit for purpose with projects of different sizes and delivery models.
Appraising Mass Céréales Al Maghreb's ESG and impact performance
As part of its commitment to contribute to the strategic dialogue around ESG in infrastructure, and in the hopes of elevating the performance of its portfolio company, A.P. Moller Capital and portfolio company Mass Céréales Al Maghreb applied to participate in the BDN pilot. The company was selected alongside a few others out of about 30 proposals. A.P. Moller Capital recognises that this strategic dialogue often happens without the people doing the projects, and hopes to help bridge that gap through its participation. A.P. Moller Capital and Mass Céréales Al Maghreb's joint participation also contributed to testing the applicability and quality of the framework.
Mass Céréales Al Maghreb is the concessionaire and operator of two cereal product handling terminals in the ports of Casablanca and Jorf Lasfar in Morocco. The company serves as a facilitator of food security by enabling an efficient and reliable cereal supply chain in the Maghreb region. The OECD selected Mass Céréales Al Maghreb for the pilot programme because of A.P. Moller Capital’s track record in prioritising ESG performance in its investments, as well as Mass Céréales Al Maghreb's contribution to the UN SDGs and local Moroccan development strategy. Mass Céréales al Maghreb's Blue Dot Certification is currently under review by the OECD, with a decision expected in 2024.
5. OECD (2021), Towards a global certification framework for quality infrastructure investment: Private sector and civil society perspectives on the Blue Dot NetworkHighlights.

Impact overview
1,261
SUPPORTED
31m
SUPPORTED (IN USD)
6,470 tCO2 -eq
Case studies 23 Environmental impact About Sustainability Social impact
CASE STUDY:
JOBS
GDP
GHG
CONTRIBUTION
SDGs
EMISSIONS (SCOPE 1 AND 2)
TO

CASE STUDY:
CABEÓLICA
Impact overview4
Wind energy on the Green Cape
Cabeólica is a wind power company in Cabo Verde, that was established to address the small island nation’s heavy reliance on imported fossil fuels for electricity production. Cabeólica’s wind farms, which are found on the four islands of Santiago, São Vicente, Sal, and Boa Vista, were the first Public Private Partnerships (PPPs) to deliver commercial scale wind power in sub-Saharan Africa. The renewable energy capacity of the four wind farms is 25.5 MW, meeting roughly 18% of Cabo Verde’s demand for electricity. By doing so, they reduce greenhouse gas emissions, decrease reliance on expensive and volatile import fuels, and enhance energy security for the island nation.
Harnessing the impact of more wind power
Cabeólica is planning a 13 MW expansion to its wind farm on Santiago island, as well as Battery Energy Storage Systems (BESS) on Santiago and Sal islands. The project is expected to displace 55GWh generated by heavy fuel oil (HFO) and gas oil annually and increase the penetration rate of renewable energy in the country from about 18% to 30% by 2025. In turn, this supports local economic growth and environmental outcomes. The project is pending final approval from the government.
When it comes to economic impact, the expansion project aims to lower the average cost of electricity generation in the grid by 15%. This will be done by replacing expensive diesel generation and, possibly, enhancing supply reliability. A third-party socioeconomic impact analysis, commissioned by Cabeólica, found that this is expected to generate a total of 1,561 jobs in the Cabo Verdean economy (equivalent to 0.75% of total employment in the country)6 Moreover, the project would reduce Cabo Verde’s dependence on imported fossil fuels, thereby saving costs on foreign currency and resulting in a reduction of the country’s balance of payments deficit by 2.4%.
When it comes to environmental impact, the expansion project is expected to significantly reduce air pollution on the islands of Santiago and Sal, in alignment with Cabo Verde’s commitment to sustainable development and environmental protection. This would improve public health outcomes as pollution from fossil fuels is linked to respiratory disease. Moreover, the expansion is set to help preserve the islands’ biodiversity by reducing the impact of fossil fuel combustion. The project is likewise expected to lead to a substantial reduction in carbon emissions. According to the study, the carbon emissions trajectory of Cabo Verde is expected to result in the avoidance of 849 Mt of CO2 between 2023 and 2044. This translates to a 13% decrease in emissions in 2044 relative to the prevailing scenario.


Case studies 24 Environmental impact About Sustainability Social impact Impact overview 137 4.2m 79 tCO2 -eq JOBS SUPPORTED GDP SUPPORTED (IN USD) GHG EMISSIONS (SCOPE 1 AND 2) CONTRIBUTION TO SDGs
6. A.P. Moller Capital does not report on the power enabled impacts of its portfolio companies. Therefore, ECA’s estimate for jobs generated by the expansion is greater than the 137 estimated for Cabeólica in the impact overview. With power enabled impacts included, however, the JIM estimates 2,328 jobs supported by Cabeólica.
24

CASE STUDY:
ERANOVE
Impact overview7
Essential services for all
Eranove has provided electricity and drinking water to Africa for over 60 years. Eranove’s commitment to strong PPPs, and its longstanding expertise in project design and development, make it a powerful agent in pursuing the provision of essential services in Africa.
Balancing decarbonisation with social impact
Unlike other utilities around the world, African utilities like Eranove must balance two competing policy priorities; to meet the growing needs for power and water services on one hand, and to reduce its carbon footprint in line with The Paris Agreement on the other. This requires trade-offs between the transition to net zero and economic growth to ensure that people are not left behind. With over 550 million people without access to electricity8 , Africa faces a particular challenge to ensure energy and water security. This challenge increases daily with Africa’s economic and demographic growth. Measures to ensure energy and water security need to be taken without losing sight of the need to tackle climate change, even if the African continent represents less than 4% of worldwide GHG emissions. By the nature of its services, Eranove embodies this challenge as the largest contributor to A.P. Moller Capital’s portfolio emissions.
Since 2015, Eranove has made progress in implementing groupwide triennial policies to help mitigate climate change. The group is committed to reducing the relative emissions intensity of its thermal
power plants (grams CO2-eq/kWh produced) by at least 25% between 2015 and 2025. One way it intends to do this, is by increasing the thermal efficiency of both new power plants that are being developed and of existing power plants, but the latter is an increasingly difficult endeavour. Increasing efficiency is key, as electricity production represented most of Eranove's emissions in 2023 and natural gas consumption remains its primary source of production. Although GHG emissions and revenues have increased side by side, Eranove has reduced its relative emissions of electricity production by 23% between 2015-2022.
Moreover, Eranove has also committed to a gross emissions reduction target of up to 25% for the 2019-2030 period. By doing so, it aims to tackle emissions related to its drinking water infrastructure, the energy consumption at its tertiary sites, and its vehicle fleet. The group will also continue the development of renewable energy assets, such as hydroelectric, solar, and biomass projects. In preparation for the long run, Eranove’s two new subsidiaries (Atinkou and Kekeli) operate the latest generations of low-GHG-emission thermal power plants. Taken into account with their design is the possibility to transition to the use of green hydrogen intake; a strong signal to encourage the development of this technology for power generation in Africa. In this way, the utility future proofs its capital for a transition to renewable energy, while continuing to serve the growing energy demand in the region with natural gas.
7. While Eranove operates across a range of African countries, its home base of Ivory Coast has been used as a point of reference for impact overview data. 8. World Bank, 2019.

Impact overview 7
89,661
JOBS SUPPORTED
760m
GDP SUPPORTED (IN USD)
2,529,675 tCO2 -eq
CONTRIBUTION TO SDGs
Case studies Environmental impact About Sustainability Social impact
25
GHG EMISSIONS (SCOPE 1 AND 2)
CASE
IMPALA

9
Natural gas for Nigeria
Impala Energy Holdings is an A.P. Moller Capital portfolio company based in Nigeria. The company provides small-to-medium-scale power and energy solutions to deliver clean, reliable, and costeffective power and thermal energy to its commercial and industrial clients in Sub-Saharan Africa. Driven by the cost and environmental benefits of natural gas, when compared to local alternatives such as propane, butane and diesel, Impala Energy Holdings focuses on gas-fired and gas-renewable hybrid power. The portfolio company has been a pioneer in the uptake of the more sustainable compressed natural gas (CNG) in the region, in part by promoting adoption through its supply chain.
Decarbonising the fleet
In its latest initiative, Impala Energy Holdings is promoting the use of CNG to its trucking service providers. The company is currently overseeing the transition of its contracted fleet of trucks from diesel and other fuels to CNG. A recent procurement deal of 30 trucks brings the total number of CNG-powered trucks used by contractors to 43. By the end of 2024, the company aims for all vehicles under its remit to run on CNG, a more sustainable alternative to diesel.
While the company's revenues have increased by 59% year on year, the company’s direct emissions increased by just 45%. These figures suggest a partial decoupling between revenue and emissions growth. Some of this decoupling comes from the transition from diesel to CNG-powered trucks. In the first six months of 2023, Impala Energy Holdings saved an estimated 34 tonnes of CO2e by replacing diesel in its trucks with CNG.

Case studies 26 Environmental impact About Sustainability Social impact
10.6m
tCO2 -eq JOBS SUPPORTED CONTRIBUTION TO SDGs
Impact overview 9 1,312
3,441
STUDY:
overview
9. In the calculation of Impala energy Holdings GDP impact with the Joint Impact Model (JIM), a negative net income figure of about USD 20m was excluded. This was because the result was due to financial expenses (incurred due to unfavourable foreign exchange rates) and unrelated to operating losses. Impala energy Holding reported a positive EBITDA figure for the year, which was included in the model.
ENERGY HOLDINGS Impact
GDP SUPPORTED (IN USD) GHG EMISSIONS (SCOPE 1 AND 2)

Reducing the carbon footprint of ports in Gabon Arise Ports & Logistics manages several African ports, including New Owendo International Port in Gabon. Conscious of the carbon emissions intensity of the port sector, the company is a trusted partner of the Gabonese government in planning and implementing several carbon reduction initiatives. These include the introduction of LED lighting to save energy, mangrove restoration, and the operationalisation of barge transport to move containers as an alternative to more carbon-intensive trucking.
Crane electrification at the New Owendo International Port
Their most recent carbon reduction initiative involves the electrification of its harbour cranes at the New Owendo International Port The conversion process from diesel to grid electricity was completed in 2023, after some delays due to the COVID-19 pandemic. All four cranes have now been fully converted to electric power sources, and they are the first moveable electrified cranes in the region. The resulting reduction in emissions of 70%10, in 2023, came just shy of the 78% target Arise Ports & Logistics set out for the year. The remaining emissions result from the fact that when the cranes are moved, the proprietary cables are often not long enough to service them in their new locations. This means that the machines must temporarily revert to running on diesel. In the coming years, Arise Ports & Logistics targets a further 10-15% reduction in fuel consumption at the port.

5,687
Case studies 27 Environmental impact About Sustainability Social impact Impact overview
180m
tCO2 -eq JOBS SUPPORTED CONTRIBUTION TO SDGs CASE STUDY: ARISE PORTS & LOGISTICS 10. These figures are self-reported by Arise Ports & Logistics.
48,888
0 5,000 10,000 15,000 20,000 25,000 Jan Feb Mar Apr May Jun Jul Aug Sep Oct Nov Dec Liters NOIP CRANE FUEL CONSUMPTION 2022 2023 0 5,000 10,000 15,000 20,000 25,000 Jan Feb Mar Apr May Jun Jul Aug Sep Oct Liters NOIP CRANE FUEL CONSUMPTION 2022 2023
GDP SUPPORTED (IN USD) GHG EMISSIONS (SCOPE 1 AND 2)
New Owendo International Port Crane Fuel Consumption
DISCLAIMER
A.P. Møller Capital P/S (“A.P. Moller Capital”) is a limited liability partnership with registered office at Lyngby Hovedgade 85, 2800 Kgs Lyngby, Denmark. A.P. Moller Capital is authorised by the Danish Financial Supervisory Authority as a manager of alternative investment funds. A.P. Møller Capital P/S (DIFC Branch) is regulated by the Dubai Financial Services Authority to provide advice and arrange deals in investments, with registered office at Al Fattan Currency House Tower 2, 15th Floor, Units 1502-1503, P.O. Box 507271, Dubai International Financial Centre (“DIFC”), Dubai, United Arab Emirates. A.P. Moller Capital (Singapore) Pte. Ltd., a private limited company and fully owned subsidiary of A.P. Moller Capital P/S, is exempt from licensing to provide advice on investments to its shareholder, with registered office at #14-04 Marina Bay Financial Centre, Singapore 018981, Singapore.
A.P. Møller Capital P/S, its branch , subsidiary, affiliates, and related entities, their respective members, directors, officers and employees (hereafter “A.P. Moller Capital Group”) accept no responsibility, obligation or duty of care for any loss or damage whether direct or indirect and however caused, that you may suffer or incur in connection with or as a result of your use of, or reliance on, any information contained or referred to in this report. The information contained or referred to within this report is provided on the basis and subject to the explanations, qualifications, assumptions and warnings set out in this disclaimer.
The information contained or referred to in this report has not been verified by the A.P. Moller Capital Group and may be incomplete or condensed. No member of the A.P. Moller Group:
(i) makes any representation, warranty, undertaking or other assurance, expressed or implied, as to the fairness, adequacy, accuracy, completeness or correctness of any information or referred to or contained in (or omitted from) this report, or the reasonableness of any assumptions used or the validity of any such information; or
(ii) assumes any obligation, responsibility, liability or duty of care for the fairness, adequacy, accuracy, completeness or correctness of any information obtained from (or not provided by) any third party. In particular, no representation or warranty is made that any projection, forecast, calculation, forward-looking statement, assumption or estimate contained in this report should or will be achieved or materialize. There is a substantial likelihood that at least some, if not all, of the forward-looking statements included in this report will prove to be inaccurate, possibly to a significant degree. In considering any performance data contained herein, each recipient of this report should bear in mind that past performance is not indicative of future results, and there can be no assurance
that any future fund managed or sponsored by A.P. Moller Capital will achieve comparable results. Nothing contained herein should be deemed to be a prediction or projection of future performance of any alternative investment fund managed by A.P. Moller Capital (“Fund”).
Certain information contained in this report is based on or derived from information provided by independent third-party sources considered by A.P. Moller Capital Group to be reliable. They do not necessarily reflect the opinions of A.P. Moller Capital Group. A.P. Moller Capital Group cannot guarantee the accuracy of such information and has not independently verified the assumptions on which such information is based. A.P. Moller Capital Group has no obligation to update, modify or amend this report or other media, or to otherwise notify a recipient thereof, in the event that any matter stated herein, or any opinion, projection, forecast or estimate set forth herein, changes or subsequently becomes inaccurate. A.P. Moller Capital Group disclaims any responsibility for any errors or omissions in such information, including the financial calculations, projections, and forecasts in this report. Recipients acknowledge that circum- stances may change and the contents of this report may become outdated as a result.
This report contains proprietary and confidential information about A.P. Moller Capital Group, the Funds, and their respective affiliates and/or portfolio investments and is furnished in confidence solely to the Limited Partners of the Funds for the specific purpose of reporting on ESG matters. Any reproduction, distribution or disclosure of any information contained or referred to in this report, without the prior written consent of A.P. Moller Capital, is strictly prohibited.
By attending any delivery of this report or by accepting a copy of this report, you will be deemed to have represented, warranted and undertaken that: (i) you have read and agreed to comply with and be legally bound by the contents of this disclaimer; (ii) you will treat and safeguard as strictly private and confidential all in- formation contained or referred to in this report and will preserve its confidentiality; and (iii) without the prior written consent of A.P. Moller Capital, you shall not copy, distribute, make available or otherwise disclose any information in this report to any other party.
Case studies 28 A·P·MOLLER CAPITAL ESG REPORT 2023 Environmental impact About Sustainability Social impact
