


Federal
State
Justice 40 Initiative: 40% of the benefits from federal investments to go to disadvantaged communities
Terms: Disadvantaged, Underserved, Vulnerable, Marginalized
Health Outcomes
Community Driven
Environmental Metrics (e.g. stormwater volume or nutrient load reduction
Climate Mitigation Potential (e.g. flooding, temperature)
Project Success
Housing Affordability
Implementation
Feasibility
Components and relationships contributing to potential success of a nature-based solution project
(WORKING DIAGRAM)
Starting point can be online viewing platforms for disadvantaged or at-risk communities
May use GIS data for more specific analyses or to examine specific attributes (e.g. housing)
Most appropriate data sources and attributes depend on goals and potential funder (state or federal)
Additional best available local data is a key addition to any of these sources
Sample of available attributes
Expected agricultural loss rate (Natural Hazards Risk Index)
Greater than or equal to the 90th percentile for expected building loss rate and is low income?
Expected building loss rate (Natural Hazards Risk Index) (percentile)
Expected building loss rate (Natural Hazards Risk Index)
Greater than or equal to the 90th percentile for expected population loss rate and is low income?
Expected population loss rate (Natural Hazards Risk Index) (percentile)
Expected population loss rate (Natural Hazards Risk Index)
Share of properties at risk of flood in 30 years (percentile)
Share of properties at risk of flood in 30 years
Greater than or equal to the 90th percentile for share of properties at risk of flood in 30 years
Greater than or equal to the 90th percentile for share of properties at risk of flood in 30 years and is
Share of properties at risk of fire in 30 years (percentile)
Share of properties at risk of fire in 30 years
Greater than or equal to the 90th percentile for share of properties at risk of fire in 30 years
Greater than or equal to the 90th percentile for share of properties at risk of fire in 30 years and is lo
Greater than or equal to the 90th percentile for energy burden and is low income?
E bd (til)

• Designated in 2021
• More info: https://files.floridados.gov/media/705056/redi -eligible-communities-list-november_5_2021sl.pdf
Climate and Economic Justice Screening Tool (CEJST)
• Specific areas designated as “disadvantaged”
• Map: Areas designated as disadvantaged

• More info: https://screeningtool.geoplatform.gov/en/dow
nloads
• Multiple “disadvantaged” designations
• Map: Housing-disadvantaged areas
• More info: https://www.whitehouse.gov/environmentaljus tice/justice40/

• Multiple disadvantaged designations
• Map: Legacy pollution-disadvantaged areas

• More info:
https://www.whitehouse.gov/environmentaljus tice/justice40/
• Multiple disadvantaged designations
• Map: Workforce-disadvantaged areas
• More info: https://www.whitehouse.gov/environmentaljus tice/justice40/

• Multiple disadvantaged designations
• Map: Climate change-disadvantaged areas
• More info: https://www.whitehouse.gov/environmentaljus tice/justice40/

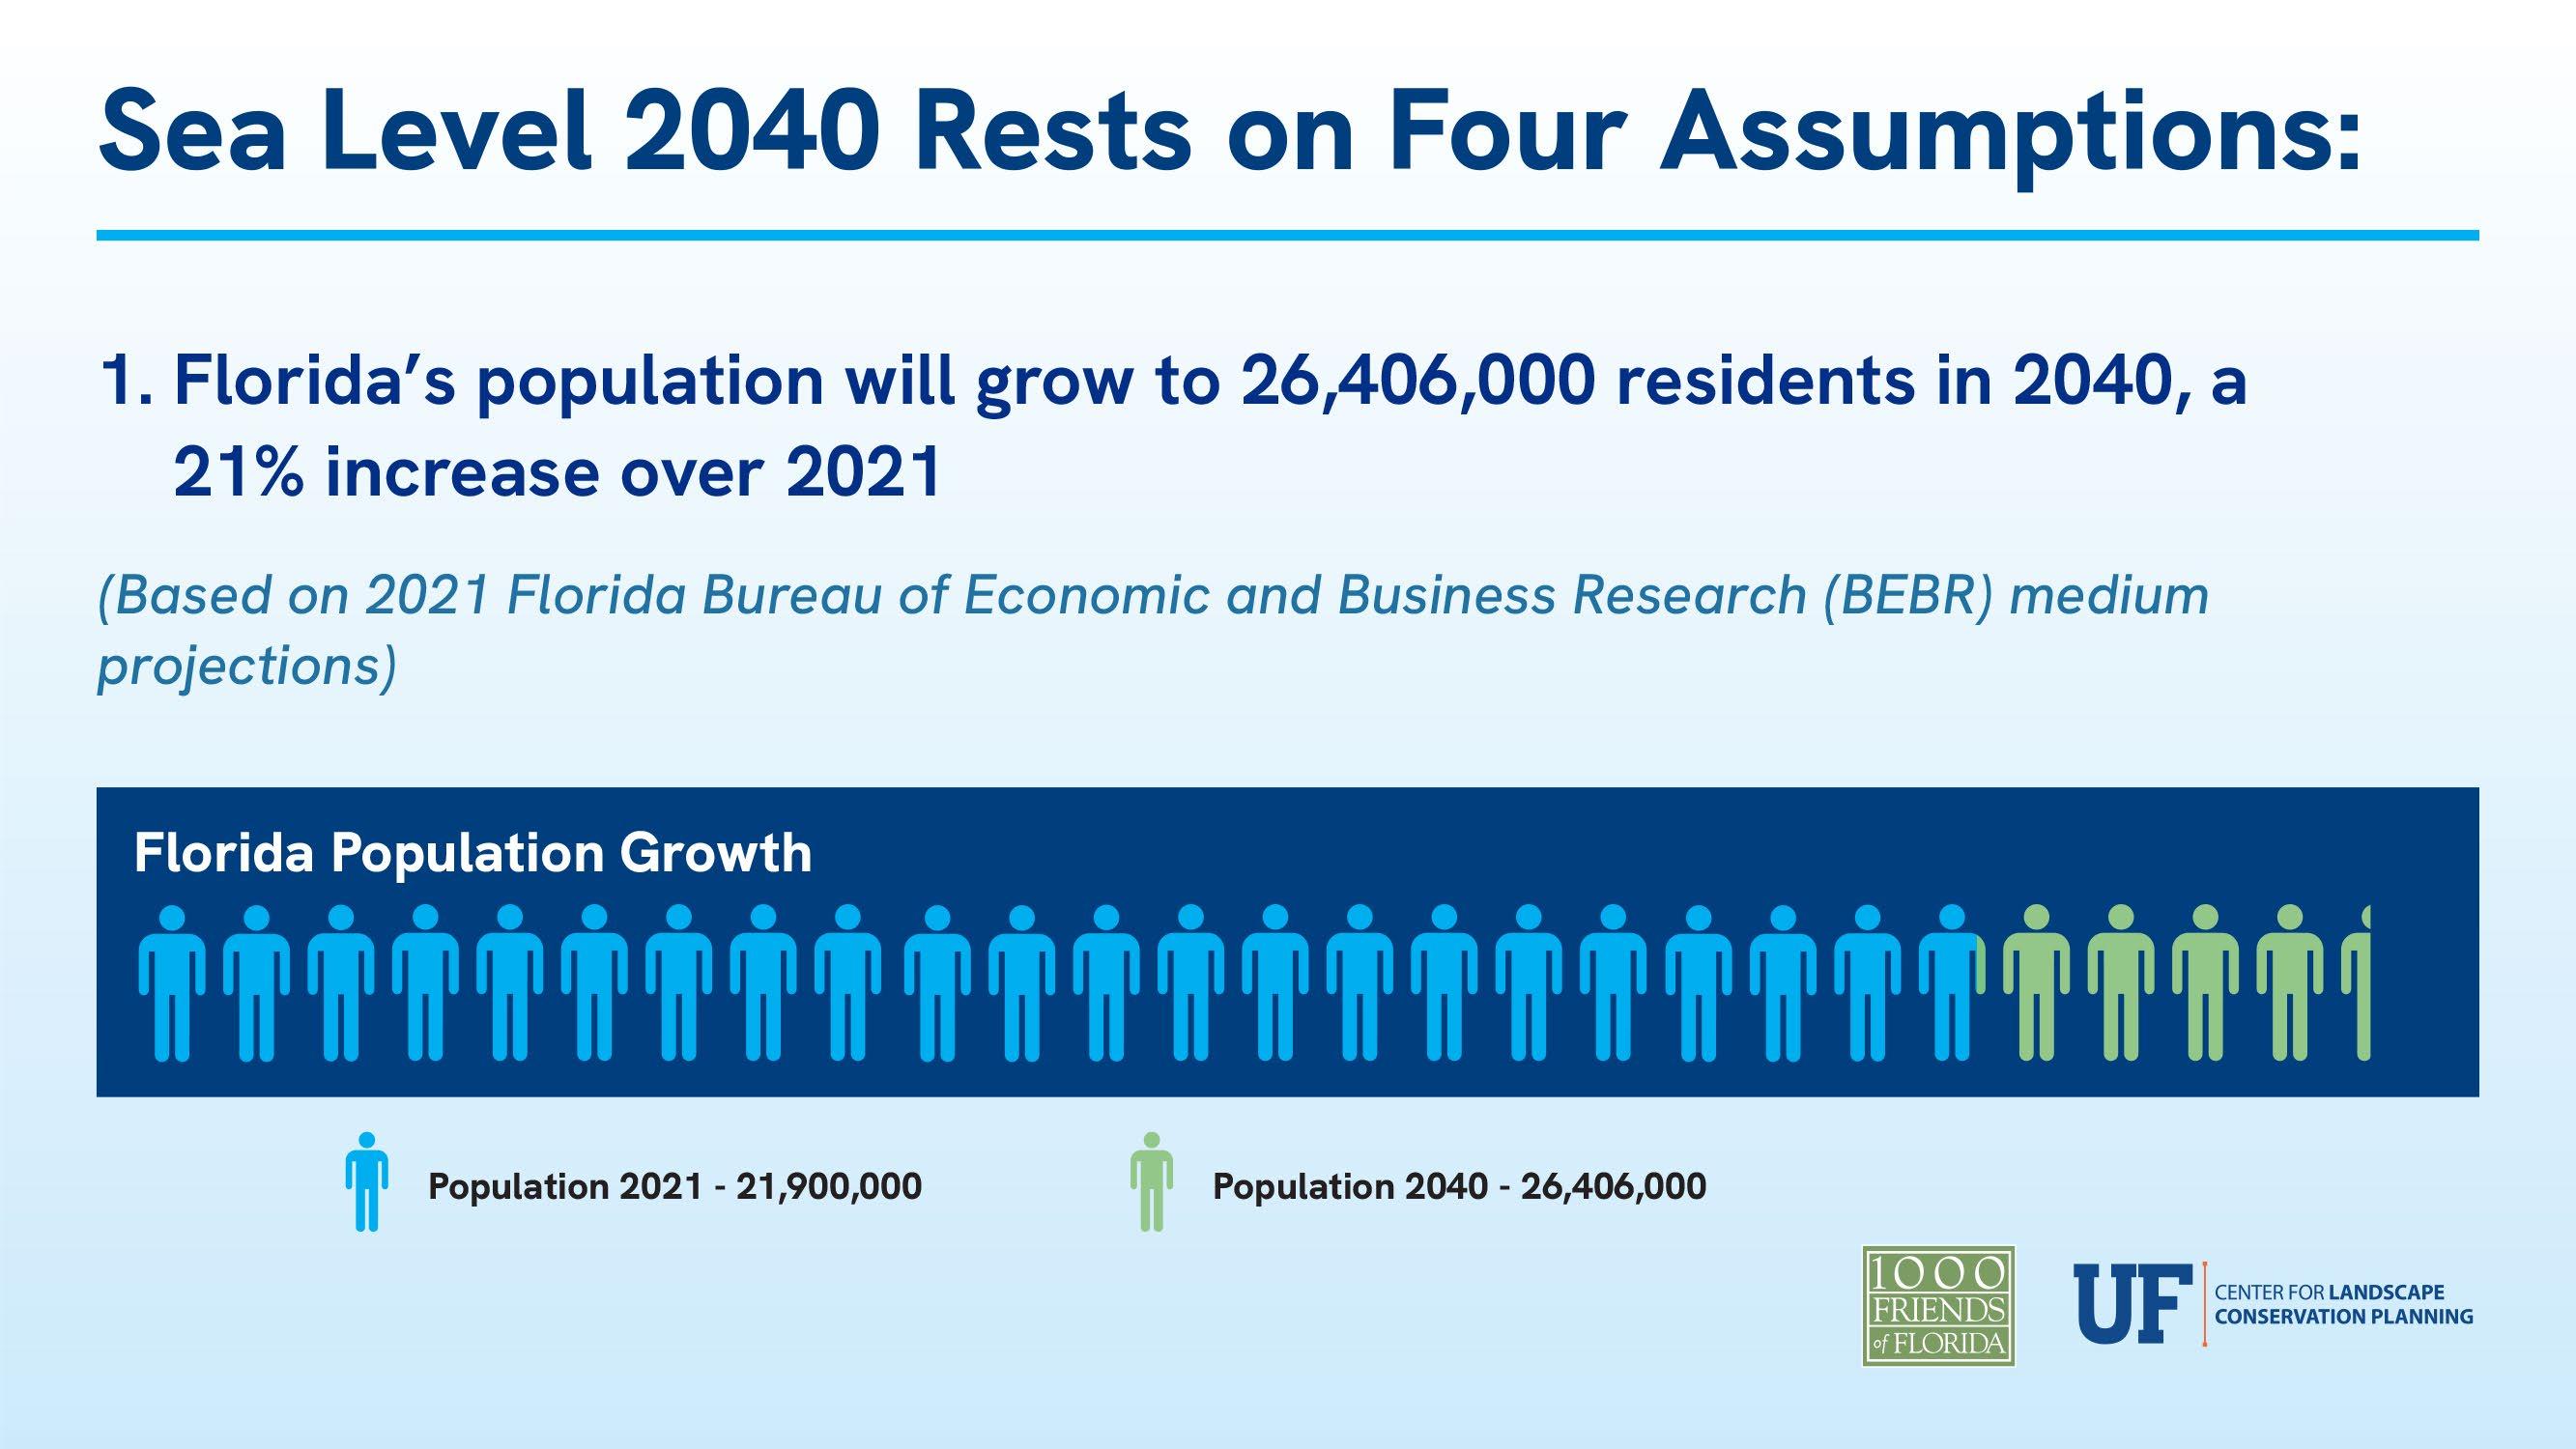
Census tracts defined as disadvantaged within areas of projected future development (2040)
• FL census tracts designated disadvantaged by WHCEQ and projected to be impacted by new development by 2040:

1,335
• 2020 population in FL census tracts designated disadvantaged by WHCEQ and projected to be impacted by new development by 2040: 6,347,088
Community and citizen driven planning and implementation
Systems based approach to project and plan development including environmental, health, housing, social/workforce, and economic factors
Comprehensive evaluation of potential direct and indirect impacts from plans, policies, and development projects
Disadvantaged community data
State of Florida Rural Areas of Opportunity and Fiscally Constrained Counties: https://files.floridados.gov/media/705056/redi-eligiblecommunities-list-november_5_2021-sl.pdf
Climate and Economic Justice Screening Tool (CJEST): https://screeningtool.geoplatform.gov/en/
US EPA: https://ejscreen.epa.gov/mapper/
US DOT: https://www.transportation.gov/grants/dotnavigator/federal-tools-determine-disadvantaged-community-status
Areas of Persistent Poverty: Areas of Persistent Poverty & Historically
Disadvantaged Communities | US Department of Transportation
Shimberg Center Affordable Housing Flood Risk: https://shimbergcenter-spatial-data-ufl.hub.arcgis.com/pages/flood-risk
NOAA Sea Level Rise Social Vulnerability Index: https://coast.noaa.gov/digitalcoast/tools/slr.html
CDC Social Vulnerability Index: CDC/ATSDR Social Vulnerability Index
FEMA National Risk Index: National Risk Index | FEMA.gov
1000 Friends of Florida
Vivian Young, Communications Director
Email: vyoung@1000fof.org
https://1000fof.org/
University of Florida Center for Landscape Conservation Planning
Michael Volk, Associate Director
Email: mikevolk@ufl.edu
Center: http://conservation.dcp.ufl.edu/
Florida Resilient Cities: https://dcp.ufl.edu/frc