ABOUT EDA

The Electricity Distributors Association (EDA) represents Ontario’s local hydro utilities, otherwise known as local distribution companies, the part of our electricity system closest to customers. Committed to sustainability, publicly and privately owned utilities deliver electricity to 5.4 million residential, commercial, industrial, and institutional customers – powering every community in the province. The sector owns more than $30 billion in electricity system infrastructure and invests more than $2.5 billion annually in the electricity grid – that is the Power of Local Hydro
TABLE OF FIGURES
LIST OF ACRONYMS
ACM Advanced Capital Module
AMI Advanced Metering Infrastructure
ADMS Advanced Distribution Management System*
BCA Benefit-Cost Analysis
CDM Conservation and Demand Management*
CIR Custom Incentive Rate-Setting
COS Cost-of-Service
CPI Consumer Price Index
DER Distributed Energy Resource*
DERMS Distribution Energy Resource Management* System
DOE Department of Energy (USA)
DR Demand Response*
DSO Distribution System Operator*
DSP Distribution System Plan
EAC Electricity Advisory Committee
EETP Electrification and Energy Transition Panel
EHRC Electricity Human Resources Canada
ESG Environmental, Social, and Governance*
EV Electric Vehicle
FERC Federal Energy Regulatory Commission
FIT Feed-in Tariff
* Defined in Glossary of Terms
GIS Geographic Information System
ICM Incremental Capital Module
IESO Independent Electricity System Operator*
IRM Incentive Rate-Setting Mechanism
ITC Investment Tax Credit
IT Information Technology
LBNL Lawrence Berkeley National Laboratory
LDC Local Distribution Company*
MDGR Modern Distribution Grid Report
NRCAN Natural Resources Canada
NWA Non-Wires Alternative*
OEB Ontario Energy Board*
OMS Outage management System
OT Operational Technology
P2D Pathways to Decarbonization
SAIDI System Average Interruption Duration Index
SAIFI System Average Interruption Frequency Index
SCADA Supervisory Control and Data Acquisition
TOU Time-of-Use
TWh Terawatt hour
TW Terawatt
VPP Virtual Power Plant
GLOSSARY OF TERMS
ADMS: Advanced Distribution Management System – a software platform that integrates numerous utility systems, including DERMS, and provides automated outage restoration and optimization of distribution grid performance
CDM: Conservation and Demand Management – programs or initiatives that address electricity system needs by helping or incentivizing customers to reduce their electricity consumption
DER: Distributed Energy Resource – an electricity supply source or controllable load that is connected to a distribution system, often through a connection on the customer-side of an ownership demarcation point, such as solar photovoltaic, battery energy storage, or DR
DERMS: Distribution Energy Resource Management System – a technology platform that manages DERs and that can be used to provide aggregated ancillary services to the grid from those DERs
DR: Demand Response – the process or action whereby a customer reduces energy use during times when the electricity system is experiencing high demand and in response to a dispatch signal from a utility or system operator
DSO: Distribution System Operator – a future distribution utility prepared and designed for a high-penetration DER future, including new capabilities and functions, e.g., DER forecasting, DER operations and dispatch, facilitation of local markets for distribution services, and transmission and distribution coordination
ESG: Environmental, Social, and Governance – standards that can be used to measure an organization’s environmental and/or social impact
IESO: Independent Electricity System Operator – the organization that is responsible for operating and maintaining the reliability of Ontario’s power system, administering the province’s electricity market, procuring electricity on behalf of the province’s electricity consumers, and various other responsibilities set out in law
LDC: Local Distribution Company – A utility that owns and/or operates a distribution system that delivers electricity to consumers
NWA: Non-Wires Alternative – a general term for any electrical grid investment that is intended to avoid, reduce, or defer traditional (i.e., “poles and wires”) infrastructure investments in electricity transmission and/or distribution systems
OEB: Ontario Energy Board – a Crown agency that regulates Ontario’s electricity and natural gas utilities, including protecting customers’ interest with respect to the price, reliability, and quality of electricity and natural gas service
ACKNOWLEDGEMENTS
The Electricity Distributors Association (EDA) is the trusted and vital source for advocacy, insight and information for Ontario’s local electricity distributors, the municipally and privately owned companies that safely and reliably deliver electricity to millions of Ontario homes, businesses and public institutions. We provide analysis, networking opportunities, and a collective voice on issues vital to our members’ business success.
We commissioned Power Advisory LLC, along with project partners at Elenchus Research Associates and the Centre for Urban Energy (CUE) at Toronto Metropolitan University to research and produce this report in coordination with our board steering committee.

Power Advisory is an energy sector management consulting firm focused on the North American electricity markets with expertise in wholesale market design and market products. Their consulting services are provided by seasoned energy sector professionals, offering a wide breadth and significant depth of industry knowledge. This experience and knowledge, combined with a detailed understanding of market fundamentals, yield the strategic insights that provide clients with market advice that achieves desired outcomes while mitigating project risk and delivering value to customers. Since their founding in 2007, Power Advisory has provided high quality and customized consulting services to clients across the sector, including the EDA. Power Advisory offers a well-balanced team of economists, engineers and policy experts with experience working with Ontario’s agencies, regulators, industry and decisionmakers. They serve a wide range of clients including distributors, transmitters, generators, regulators, system operators and investors.


Elenchus Research Associates is a recognized leader in the development and design of rates for regulated utilities, the design of regulatory mechanisms (including incentive regulation), regulatory compliance and strategy. Its clients include five Canadian regulators as well as regulated utilities and a wide range of stakeholders across Canada. Elenchus assists clients in all aspects of regulatory proceedings, policy development and strategic planning. Over the past 30 years, Elenchus has also been retained by dozens of stakeholders for energy regulation proceedings in Ontario, British Columbia, Alberta, Manitoba, Quebec, New Brunswick, Nova Scotia and Newfoundland. Elenchus has extensive experience working with the full range of interested parties, including customer groups and regulators, making Elenchus ideally suited to anticipating the concerns of stakeholders.
CUE is an academic-industry partnership established in 2010 that is exploring, developing and commercializing sustainable, innovative, costeffective and practical clean energy solutions and technologies. CUE brings together industry and government partners, and top researchers from across Canada and around the world to undertake a collaborative, multidisciplinary approach to the study of urban energy. CUE combines engineering, science, environmental issues, and infrastructure management to tackle immediate challenges such as the development of clean energy technologies; the advancement of smart grid technologies; the integration of energy storage, electric vehicles and renewables; energy conservation and demand management; alternative local energy generation; carbon footprint reduction; and net-zero buildings and infrastructure.
EXECUTIVE SUMMARY
Ontario’s local distribution companies (LDCs) are pivotal in enabling Ontario’s low-carbon economy, navigating challenges posed by climate action policies, electrification trends, and evolving customer demands. With Ontario’s economy growing and the demand for housing intensifying, LDCs must innovate to effectively meet accelerating electricity needs and changing customer preferences. Projected electricity consumption in Ontario is expected to rise significantly, from 144 TWh in 2023 to 245 TWh in 2050. This rapid growth demands urgent attention to adopt new strategies and ensure LDCs can make the necessary investments in grid enhancements to expand the capacity and capability of the distribution system.
Electricity reliability and affordability remain paramount, though customers now expect additional value from their service. While Ontario customers are not a uniform, monolithic group, all customers assume that LDCs will be there to support their changing electricity needs, such as swift electric vehicle (EV) charger installations and other upgrades to increase electrical load. Furthermore, LDCs are more frequently interacting with businesses that seek utility partners to achieve their energy management and sustainability goals. In parallel, LDCs must also prepare to respond to increased climate changeinduced extreme weather events.
Recognizing the essential role of LDCs in the energy transition, we (the EDA), in collaboration with industry experts, outline a vision for the role of Ontario’s LDCs as they enable economic development, housing growth, and electrification. This report identifies urgent and practical steps that LDCs, in partnership with the Government of Ontario and its agencies, must take in the near term to be grid ready and to achieve the benefits of this transition. It underscores the need for clear policy direction and regulatory frameworks to support LDCs in making necessary investments with a continued focus on affordability and enabling customer choice. The paper also addresses workforce needs and emphasizes the essential role of human capital in enabling technological advancements.
Rising electricity demands will require LDCs to update their investment plans to enhance the capacity and capabilities of distribution system infrastructure. To address the growing peak demand, LDCs must allocate additional funds towards new infrastructure and the ongoing renewal of existing assets. Historically, annual LDC spending on gross capital additions has averaged around $2.5 billion across Ontario. By projecting future energy demands on the distribution system, we estimate that annual spending on gross capital additions may need to double by the mid-2040s under a net-zero scenario and increase by approximately 130% from current levels by 2050. Even with more moderate electrification assumptions, annual gross capital additions by all Ontario LDCs could increase by nearly 45% by 2050. Cumulatively, Ontario’s LDCs are projected to spend approximately $103 billion on gross capital additions from 2024 to 2050 with moderate electrification assumptions, and could spend up to $120 billion on gross capital additions from 2024 to 2050 under a net-zero scenario (see Section 4). Given the magnitude of potential investment required and the affordability imperative, we make recommendations regarding funding approaches to lessen the impact on ratepayers (see Section 7).
LDCs play a crucial role in enabling the integration of customer-driven distributed energy resources (DERs) and enhancing grid reliability through investments in enabling technologies. With the increasing connection of DERs, coordination with the Independent Electricity System Operator’s (IESO) wholesale market becomes essential, involving communication of distribution constraints and real-time outages affecting DER availability. By adopting the functions of a Distribution System Operator (DSO), LDCs can further facilitate the co-optimization of DER operations and dispatch, which is crucial for their integration into the wholesale market, particularly considering DERs may operate as IESO market participants, impacting LDC planning and realtime operations.
Notably, we estimate that DERs could offset distribution-level spending of between $200 million and $800 million annually by 2030 (see
Section 5), with higher achievable savings if the barriers to achieving the full economic potential of DERs were addressed. Furthermore, we describe the many benefits that investments in grid-enabling technologies can bring to Ontario, including:
• Improved grid reliability and resilience
• Reduced greenhouse gas emissions
• Improved safety and cybersecurity
• Enabled electrification and integration of DERs
• Avoided energy costs (i.e., electricity supply costs)
• Avoided capacity costs (i.e., electricity transmission and distribution infrastructure costs)
• Enhancing economic competitiveness
This report outlines the challenges utilities encounter when assessing necessary grid-enabling investments. While performance metrics exist, broader system and societal benefits are often difficult to quantify monetarily, unlike costs and their subsequent rate impacts, which are more straightforward. Drawing on insights from other jurisdictions, we assert that certain grid-enabling investments are non-discretionary based on established need and policy priorities and that these non-discretionary investments should be assessed on a best-fit and reasonable cost basis rather than through benefit-cost analysis (BCA). However, for discretionary investments aimed at evaluating multiple potential options and reducing system costs, BCA should be utilized to evaluate cost-effectiveness.
To advance grid modernization and energy transition objectives, the report recommends specific policy and regulatory enablers that can be developed and implemented in the near-term, including the establishment of clear evaluation frameworks, performance metrics, and filing requirements for grid modernization investments. It calls for mechanisms to support LDCs in implementing grid modernization technologies and enhancing climate resilience, recognizing the urgent need for LDCs to prepare for increasing policy-driven and customer-driven demands on the distribution system.
We propose the following policy enablers, including:
• Developing, together with the Ministry of Energy and the Ontario Energy Board (OEB), a clear and shared
definition of electrification and grid modernization objectives for Ontario.
• Providing firm and clear direction regarding the need for foundational grid modernization investments.
• Clarifying the role of the OEB in advancing grid modernization.
• Defining clear criteria/path for adopting lessons learned from grid modernization pilots and moving to system-wide deployment.
• Supporting recommendations to address quantity, quality, and partnership aspects of the electricity sector workforce.
• Considering alternative funding approaches and reviewing current funding policies to support the required investments for the transition of the energy sector in Ontario.
From a regulatory perspective, we outline the following enablers:
• Aligned with policy directives, the OEB should take the lead in finalizing a comprehensive evaluation framework, encompassing performance metrics and filing guidelines for grid modernization investments.
• Exploration of regulatory measures to bolster grid modernization efforts, such as reducing thresholds for grid modernization investments to streamline approval processes and enhance cost recovery, allowing greater access to funds in an Incentive Rate-Setting Mechanism (IRM) term, mandating Distribution System Plans (DSPs) to incorporate a dedicated grid modernization segment, tracking progress in alignment with regulatory recommendation, and allowing the capitalization of digital technologies crucial for grid modernization to facilitate their implementation, amongst other recommendations.
Ultimately, the report highlights the urgency of action to ensure LDCs are equipped to meet the evolving needs of Ontario’s energy landscape and contribute to a sustainable and economically prosperous future for all Ontarians. We are encouraged by the progress made to date in Ontario and looks forward to being a supportive partner in enabling the energy transition, where LDCs play a pivotal role in empowering communities across the province in meeting their economic, environmental, and societal goals.
1. INTRODUCTION AND BACKGROUND
Ontario’s local distribution companies (LDCs) are at the forefront of the energy transition and the clean energy economy. Climate action and electrification policies, as well as changing customer preferences, are having a profound impact on Ontario’s electricity grid. Ontario’s economy is growing and electrifying, creating new opportunities for LDCs to support customers and putting new pressures on LDCs to innovate.
With the rising penetration of distributed generation from renewable sources, the direction of energy flows within the grid is becoming less predictable, often characterized by a reversal of power flow, even from distribution to transmission grids, requiring the deployment of new digital technologies.
International Energy Agency, Electricity Grids and Secure Energy Transitions (October 2023)
The pace of Ontario’s projected electricity growth is unprecedented. Ontario’s annual electricity consumption is forecast to increase from 144 TWh in 2023 to 245 TWh in 2050.1 Decarbonizing Ontario’s electricity supply could require the addition of 69 GW of non-emitting supply and 5 GW in demand reductions from energy conservation.2 In the near term, beginning around 2030, Ontario will require approximately 5 TWh of new energy. 3
Meeting Ontario’s electricity needs is going to require a coordinated approach across Ontario’s electricity sector and the integration of new enabling technology to modernize the electricity grid. While much of Ontario’s electricity needs will be satisfied by largescale investments in the bulk system, distributed energy resources (DERs), including renewable sources, energy storage, energy efficiency, and demand response (DR), are expected to play an important role in meeting electricity demands. Indeed, it is estimated that DERs could cost-
effectively satisfy 1.3 to 4.3 GW of peak summer demand by 2032.4
[S]ignificant infrastructure investment is needed to not only meet greenhouse gas emissions reduction targets, but to ensure a reliable, equitable and affordable energy system for Ontarians.
Climate Risk Institute. Ontario Provincial Climate Change Impact Assessment: Technical Report.
Although electricity reliability and affordability are table stakes, customers now expect additional value from their electrical service. For example, residential customers expect to connect new electric vehicle (EV) chargers expeditiously upon purchase, and businesses are seeking more options for renewable energy supply to meet their environmental, social, and governance (ESG) mandates. Ontario’s electricity grid needs to keep pace with economic development, housing development, and electrification. As electricity demand grows and increased volumes of DERs are connected, significant investments in distribution services are needed. LDCs require new tools, technologies, and processes to reliably operate an increasingly complex grid.
The strong link between the electricity distribution system and broader provincial objectives has been highlighted by the Ontario Energy Board’s (OEB) recent announcement that it is undertaking a policy review of electricity distribution system expansion for housing development, following the Minister of Energy’s Letter of Direction dated Nov. 29, 2023, requesting the OEB to “review its electricity distribution system expansion connection horizon and revenue horizon direction to ensure that the balance of growth and ratepayer costs remain appropriate ”56
1 IESO, Annual Planning Outlook (APO), March 2024, p. 30: https://www.ieso.ca/-/media/Files/IESO/Document-Library/planning-forecasts/apo/ Mar2024/2024-Annual-Planning-Outlook.pdf
2 IESO, Pathways to Decarbonization, December 2022, p. 2: https://www.ieso.ca/-/media/Files/IESO/Document-Library/gas-phase-out/Pathways-toDecarbonization.ashx
3 IESO, Evaluating Procurement Options for Supply Adequacy, Resource Adequacy Update to the Minister of Energy, December 2023, p. 4: https:// ieso.ca/-/media/Files/IESO/Document-Library/resource-eligibility/Evaluating-Procurement-Options-For-Supply-Adequacy.ashx
4 Dunsky Energy + Climate Advisors, Ontario’s Distributed Energy Resources (DER) Potential Study Volume I: Results & Recommendations, September 28, 2022, p. 16: https://www.ieso.ca/-/media/Files/IESO/Document-Library/engage/derps/derps-20220930-final-report-volume-1.ashx
5 OEB, Engagement on Electricity Distribution System Expansion for Housing Development, March 13, 2024: https://www.rds.oeb.ca/CMWebDrawer/ Record/843877/File/document
6 Minister of Energy, Letter of Direction, November 29, 2023: https://www.oeb.ca/sites/default/files/letter-of-direction-from-the-Minister-ofEnergy-20231129.pdf

In parallel, Ontario’s electricity grid requires investments to provide increased resilience because of climate changeinduced extreme weather. The electricity system is vulnerable to extreme heat, extreme precipitation, storms, wildfires, and other events that can damage, destroy, and shorten the lifespan of electricity infrastructure leading to electricity service failures, disruptions, outages, brownouts, blackouts, and reductions in efficiency 7
These events can have serious economic consequences for Ontario’s industries and businesses, not to mention health and safety impacts, particularly for vulnerable populations.
What becomes clear to us and our members from looking at the combination of the energy transition and climate change is that Ontario’s electricity system and LDCs will be called upon to play an increasingly central role as the backbone of not only serving Ontario’s energy needs, but also delivering its overall economic, environmental, and societal benefits.
LDCs will continue to be responsive to government policy direction, economic development, climate risks, and residential housing growth, as well as customer trends towards greater electrification (e.g., EVs, heat pumps, etc.) and DERs (e.g., solar, storage, etc.) – all while meeting ever-increasing affordability, performance, and reliability expectations To meet these challenges, we believe that LDCs must continue to transform and evolve to manage their systems more actively, using tools as varied as demand side management, wireless networks, and

Modernizing the electricity grid to maintain reliability, affordability, and sustainability, and to enable customer choice
weather forecasts and modelling. LDCs are responsible for facilitating DER connections, managing the balance of electricity flows on their system, and more actively engaging and understanding their customers’ preferences and trends.
On July 10, 2023, the Government of Ontario published Powering Ontario’s Growth, which sets out the government’s plans for the province’s energy system. It includes plans for new zero-emissions electricity generation, long-duration storage, and transmission lines, and tasks the Independent Electricity System Operator (IESO) with several resource acquisition and system planning initiatives. The report highlights the essential role of the electricity sector in enabling a clean energy economy. A summary of recent policy developments influencing Ontario’s LDCs is provided in Appendix A
Energy and economic development have always been tightly linked. Access to reliable and affordable energy has been a key component of economic growth. Now too, the energy transition is seen as key to facilitating economic development, job creation, and attracting capital investment. Access to affordable, reliable, and clean energy is now seen as central to economic competitiveness, and Ontario’s “world-class clean electricity grid” as a “competitive advantage to drive investment and create jobs.”8
The ongoing changes in Ontario’s energy use and production landscape present a significant opportunity for LDCs to assist in meeting various governments’ climate-
7 Climate Risk Institute. Ontario Provincial Climate Change Impact Assessment: Technical Report. Report prepared by the Climate Risk Institute, Dillon Consulting, ESSA Technologies Ltd., Kennedy Consulting and Seton Stiebert for the Ontario Ministry of Environment, Conservation and Parks. January 2023, p. 403: https://www.ontario.ca/page/ontario-provincial-climate-change-impact-assessment
8 Ontario Newsroom, New Ontario Clean Energy Registry Will Make Province Even More Attractive for Investment, January 2022: https://news. ontario.ca/en/release/1001486/new-ontario-clean-energy-registry-will-make-province-even-more-attractive-for-investment
Figure 1. Impacts of Energy Transition on Electricity Sector
1. INTRODUCTION AND BACKGROUND
related, economic, and housing policies and targets, advance grid modernization, and ‘unlock’ capabilities of DERs to help meet Ontario’s electricity supply needs and economic growth. In fact, electrification and fuelswitching policies related to the energy transition are making the affordable, reliable, and resilient services of LDCs and the electric system in general more important than ever before for maintaining and enhancing provincial economic competitiveness and attracting capital investment.
We engaged Power Advisory LLC, along with partners at Elenchus Research Associates and Toronto Metropolitan
University, to support the development of this paper. Here we outline our vision of the role of Ontario’s LDCs as the economy transitions to a low carbon future and demonstrates how Ontario’s LDCs will continue to contribute to the prosperity of Ontario and the communities they serve. Further, this paper identifies practical and urgently needed actions that Ontario’s LDCs must take in the near term, working together with the Government of Ontario and its agencies, to unlock these opportunities and ensure Ontarians benefit from the energy transition.
2. ONTARIO’S LDCS IN THE ENERGY TRANSITION
Ontario’s LDCs are responsible for ensuring the safe, reliable, and affordable delivery of electricity to their customers. LDCs engage in the planning, investment, construction, and maintenance of distribution assets designed to meet the peak demand of customers within their service territory and address various other needs, such as having the capacity available to connect new homes and new businesses. While LDCs are responsible for customer metering installations and have access to customer metering data, additional visibility into day-today grid conditions has not, until now, been a necessity. This is due to the relatively low level of DERs connected and relatively predictable customer electricity usage patterns.
Over the last two decades, Ontario’s LDCs have consistently and continuously modernized their systems in response to government policy initiatives, regulatory requirements, and evolving customer preferences. Ontario’s LDCs successfully demonstrated leadership and a spirit of collaboration through such initiatives as:
• Implementing the smart meter rollout, implementation of time-of-use (TOU) pricing (including recent Ultra-
Low Overnight pricing), tiered pricing and systems integration with the Smart Metering Entity
• Implementing Green Button and providing data access to customers
• Connecting DERs through various programs, such as net metering, microFIT, and Feed-in Tariff (FIT) initiatives
• Delivering conservation and demand management (CDM) programs that delivered bill savings to residential and business customers as well as energy and capacity savings to the system
• Facilitating and implementing the government’s efforts to use electricity infrastructure for Ontario’s Broadband and Cellular Action Plan
• Undertaking innovative, forward-looking pilots assessing different LDC models/functions as well as facilitating electrification and the energy transition, such as Alectra’s York Region Non-Wires Alternative (NWA) Demonstrations, Essex Powerlines’ Distribution System Operator (DSO) Pilot-Powershare Project, Hydro One’s Vehicle-to-Home Project; and Hydro Ottawa’s Electric Vehicles Everywhere Project.
roles…
Emerging LDC Requirements
• Asset Ownership
• Asset Management
• Network Reliability
• Customer Metering, Billing, Settlement
• CDM / DERs
• Prepare for Electrification
• DERs as NWAs
• Enhanced DER Connections
• DER Rate Design
• Enhanced Load Forecasting
• Enabling Electrification
• Enhanced Customer Programs and Support
• Fully Support Electrification
• DSO Functions (e.g., DER Forecasting, DER Operation and Dispatch, Local Markets, T-D Coordination, etc.)
• Enhanced Data Management and Information Platforms
• Customer Choice (e.g., rate options, supply options, etc.)
• Climate Resilience
Figure 2. LDC Roles and Functions Emerging in the Energy Transition
Ontario’s LDCs are ready, willing and able to take on new challenges to prepare for the future and assist with broader government policy objectives and goals.
New Services to Customers
As the energy landscape undergoes a transformation towards the clean energy economy, LDCs will play an essential role in facilitating this transition by offering a suite of innovative services to customers. Ontario’s LDCs have a strong history of supporting customer programs and services through the delivery of CDM programs.
We recognize that Ontario’s electricity customers are not a monolithic, uniform group. Customers have diverse needs and preferences, and it is essential that LDCs engage with their unique communities and customers as they develop investment plans. However, broad electricity sector trends impacting the province cannot be ignored, such as a shift away from the use of fossil fuels, integration of new technologies, and desire for affordable, safe, and reliable electricity services.
One key area where LDCs can lead is in supporting electrification initiatives that enable customer adoption of EVs and heat pumps.9 This includes facilitating the connection of EV charging infrastructure to the grid, expanding access to charging infrastructure within an LDC’s service territory, and providing programs that remove barriers to heat pump installation.
To meet both customers’ preferences and Ontario’s emerging needs for non-emitting generation, LDCs can play a crucial role in enabling the integration of DERs. This involves streamlining the process for customers to connect their renewable supply to the distribution network, as well as implementing smart grid technologies to manage the variability of renewable generation and provide flexible hosting capacity where technically feasible. LDCs can also offer a range of programs to support customer choice in the adoption of renewable energy supply, such as green choice/green tariff programs.
LDCs can empower customers by offering greater choice through innovative rate design (e.g., interruptible rates, EV rates, etc.) and energy management solutions. By providing flexible pricing options, such as new TOU rates
The Green Choice program offers a new, simplified process for large-scale energy customers to procure renewable electricity. This program was designed to help governments, public institutions, corporate and industrial electricity customers in Nova Scotia to achieve their greenhouse gas emissions reductions targets. The new renewable energy projects procured through the Green Choice Program will generate renewable electricity for which participants can subscribe up to 120% of their annual electricity consumption.
Nova Scotia, Department of Natural Resources and Renewables, Green Choice Program Participant Guide (December 2023)
or DR programs, LDCs can incentivize customers to shift their energy usage to off-peak hours, thereby reducing strain on the grid and lowering overall energy costs. Moreover, by offering energy management tools and services, LDCs can empower customers to make informed decisions about their energy consumption and optimize their consumption or use of renewable resources.
Furthermore, LDCs can promote affordability initiatives and energy conservation efforts. These opportunities include implementing energy efficiency programs such as home energy audits and rebates to help customers reduce their energy bills and minimize their environmental impact. Additionally, LDCs can collaborate with community organizations and government agencies to provide financial assistance to low-income households for energy efficiency upgrades and weatherization measures.
As LDCs integrate new technologies and enhance their capabilities, they can leverage advanced analytics and data-driven insights to enhance their services and improve customer engagement. By providing access to real-time energy usage data and personalized recommendations, LDCs can empower customers to make smarter energy choices and optimize their energy consumption. Moreover, by investing in smart grid technologies and predictive analytics, LDCs can improve grid reliability and resilience, thereby reducing the frequency and duration of power outages and enhancing overall system performance. This is imperative for LDCs as regulators often lean on the system average interruption frequency
9 Natural Resources Canada describes heat pumps as electricity-driven devices that extract heat from a low temperature place (a source) and deliver it to a higher temperature place (a sink). The two commonly used sources are air-source and ground-source. Hybrid models also exist where heat pumps can be both electrically driven or natural-gas driven: https://natural-resources.canada.ca/energy-efficiency/energy-star-canada/about/ energy-star-announcements/publications/heating-and-cooling-heat-pump/6817#b

Bulk Transmission System


and duration (SAIFI and SAIDI) indicators to measure distribution system performance.
In terms of the types of programs that LDCs can offer, there are many examples from other jurisdictions from which Ontario can learn, as well as the experience of Ontario LDCs themselves:
• Customer-facing websites, online tools, calculators, and hosting capacity maps to inform customer decisions concerning connecting EV charging infrastructure, installing heat pumps, installing solar, etc.
• Enabling enhanced reliability and resilience service offerings, such as microgrids/islanding capabilities, to customers and communities, which are being piloted by utilities in Ontario and the United States.
• Green-choice programs or green tariffs are offered in multiple jurisdictions across North America, including Nova Scotia, Michigan, Colorado, Georgia, and Nevada.
• EV make-ready programs that support customer connection of EV charging infrastructure by offsetting connection costs are offered in multiple jurisdictions, for example in Massachusetts and New York.
• EV fleet advisory services are offered in multiple jurisdictions, including Illinois and Massachusetts.
• EV rates (i.e., delivery rates) are offered in multiple jurisdictions including Quebec, British Columbia, California, New York, and Massachusetts.
• Managed EV charging programs to mitigate system demand and infrastructure impacts of EV charging, as found, for example, in Connecticut and New York.
• Flexible (curtailable) connection arrangements allowing DERs to connect to feeders that may face technical capacity constraints (rather than waiting and/or paying for needed upgrades prior to connecting) in exchange for giving the distributor the ability to curtail output when system conditions warrant, as found, for example, in the United Kingdom and countries in the European Union.
• Load control programs and interruptible rates, which allow the LDC to either directly control or curtail a customer’s load (often air conditioners or electric water heaters) to help manage demand on the distribution system, or offer customers a reduced rate in exchange for the LDC having the right to call for curtailment of supply under specific circumstances. Load control
Figure 3. Increasing complexity and two-way flows in the distribution system
programs are common in many jurisdictions and have recently been reintroduced in Ontario via the IESO’s “Peak Perks” program. Interruptible rates are currently being piloted in Ontario’s electricity sector (having been common for many years in the natural gas sector) and are also available in other jurisdictions such as Quebec.
Further case studies are described in Appendix F
By embracing innovation and adopting a customer-centric approach across the sector, LDCs can not only drive economic development and foster social equity, but also play a vital role in accelerating the transition towards a cleaner, more resilient energy system.
Evolving LDC Roles & Responsibilities
With increases in DERs and electrification, there are pressures for LDCs to adapt, modernize, and change. LDCs will continue to be responsible for the safe, reliable, and affordable delivery of electricity to customers. However, the landscape is evolving with increasing customer connection requests for DERs, including solar, storage, and EVs, and the emergence of new energy service providers, such as DER aggregators, as illustrated in Figure 3
With advancements in technology and reduced costs of DERs and other technologies, LDCs are positioned to leverage DERs and NWAs as distribution system assets. This offers the potential of offsetting or deferring the need for traditional distribution assets and even mitigating the need for upstream transmission investments. This shift introduces heightened complexity to distribution system planning (as well as the bulk system), requiring serious consideration of customer DERs and NWAs, including storage, DR, CDM, and EV smart charging, among other opportunities.
Moreover, the day-to-day operations of distribution systems have become more intricate, demanding investments in grid visibility and controls to effectively coordinate the operations of NWAs. Despite these changes, LDCs maintain their status as non-dispatchable loads in the IESO’s wholesale market. Yet, forecasting LDC demand at “nodes” presents growing challenges for the IESO, driven by the increasing uptake of DERs and EVs for customer use, as well as DERs utilized by LDCs for NWAs. The inherent unpredictability of nodal demand on a day-to-day and minute-to-minute basis, compounded by
embedded DERs not visible to the IESO, adds complexity to the IESO’s forecasting process.
As LDCs engage in the procurement of DERs, it becomes imperative for these resources to be considered and accounted for in the IESO’s power system plans and broader procurement initiatives. This underscores the evolving role of LDCs in an energy landscape that is increasingly being shaped by the integration of decentralized and renewable energy resources and more active customers/users of the distribution system.
New Roles & Responsibilities
Amidst the significant and broad electrification across the sector and uptake of DERs, LDCs must continue their essential role of delivering electricity to customers. However, in addition to this core responsibility, LDCs will need to take on a much more active engagement in facilitating and controlling the operations and location of DERs in an efficient way. This will require undertaking tasks such as forecasting, communication, and dispatch management while navigating grid constraints. The administration of “local markets” stands out as a key function that can be performed by LDCs, and may consist of various platforms for procurements, programs, and price signals tailored to a spectrum of distribution services.
The increasing complexity of day-to-day and minute-tominute operation of the distribution system necessitates investments in grid visibility, monitoring and control, automation, communications, telemetry, and related technologies. This infrastructure is critical for effectively coordinating and dispatching DERs in response to dynamic conditions. Going forward, LDCs will play a more pivotal role in enabling efficient investments and operations by leveraging data management, information platforms, and responsive price signals.
These new functions are often described as “DSO functions”. As a DSO, LDCs would have multiple options to actively coordinate with the IESO’s wholesale market, such as communicating distribution constraints and real-time outages that impact DER availability. Co-optimization of DER operations and dispatch, facilitated by collaboration with the IESO, enables the integration of DERs into the wholesale market. Two-way operability coordination with the IESO is especially necessary recognizing that LDCs need to account for DERs operating as IESO market participants, which will impact LDC planning and real-time operations.
4.
from Extreme Weather Events in Ontario
Despite the growing imperative for LDCs to evolve and adapt to the changing energy landscape, several barriers and challenges impede progress towards realizing new roles and responsibilities as Ontario undergoes deeper electrification of our economy. For instance, there is policy uncertainty regarding a shared understanding of the expected roles and accountabilities of LDCs, including but not limited to the possibility of some undertaking DSO functions. A lack of coordination in the energy sector hinders the development of a cohesive approach to DER integration (and electrification more broadly), one which would recognize the value of DERs to the customer, distribution system, and bulk system. Moreover, there is a lack of guidance to LDCs regarding grid-enabling investments that would unlock new capabilities while optimizing and maximizing the existing distribution grid to provide overall ratepayer value. We observe that there is a need for greater clarity on the division of responsibilities and coordination among stakeholders to advance toward new LDC roles effectively. These challenges underscore the pressing need for proactive policy and regulatory interventions to address these barriers and empower LDCs to embrace their evolving roles in shaping the future of the energy sector.
Climate Resilience
While LDCs are preparing for changes to the distribution network resulting from changing customer needs and technology adoption, they also need to prepare for extreme weather events that are increasing in frequency and magnitude due to climate change. In northern climates such as Ontario, the scale of climate change is likely more pronounced in some ways than global averages. Accounting for extreme weather in electricity planning is a best practice. Extreme weather can impact electricity demand, supply, transmission, and distribution, leading to greater uncertainty and prolonged outages.
The Government of Ontario released its first Climate Change Impact Assessment10 in 2023. The report indicated that there was a high risk to electrical power generation and a medium risk to electrical transmission, control, and distribution, with a projection of medium to high risk expected in the 2050s. For electricity distribution, winter precipitation, extreme winds, and extreme heat are the greatest drivers of risk. Winter precipitation can cause significant equipment damage to distribution infrastructure. The build-up of snow on nearby tree branches and extreme winds may interfere with the lines and cause contacts or outages. Extreme heat can reduce the carrying capacity of distribution lines and damage substations and transformers.
10 Climate Risk Institute. Ontario Provincial Climate Change Impact Assessment: Technical Report. Report prepared by the Climate Risk Institute, Dillon Consulting, ESSA Technologies Ltd., Kennedy Consulting and Seton Stiebert for the Ontario Ministry of Environment, Conservation and Parks. January 2023: https://www.ontario.ca/page/ontario-provincial-climate-change-impact-assessment
Number of Customer Interruptions
Number of Customer Hours of Interruptions
Figure
Electrical Interruptions
The OEB keeps records of electrical interruption incidents by LDC as shown in Figure 4 11 In 2015, there were approximately 570,000 customer interruptions with a sudden increase to approximately 1.6 million customer interruptions in 2018 due to extreme weather events, and then declining to 2015 levels in 2021. However, the greatest record for interruption was in 2022. In May 2022, Hydro One cited a record-breaking 1,90012 broken poles and nearly 652,000 customers interruptions due to a derecho windstorm. A derecho is a widespread, long-lived, straightline windstorm that is associated with a fast-moving group of severe thunderstorms known as a mesoscale convective system. Derechos can cause hurricane and tornadic-level winds, heavy rains, and flash floods. In Ottawa, the airport and water treatment plant lost grid power for more than 24 hours. In a letter to Ottawa Mayor Jim Watson, Hydro Ottawa described the damage dealt to its power distribution system as “beyond comprehension” and more severe than the 2018 tornadoes or the 1998 ice-storm, which impacted much of northeastern North America.
The challenge ahead is determining what adaptation and resilience steps must be taken to address the risk that climate change has on the distribution system. It requires being informed and mindful of the interconnectedness of electricity infrastructure on the five key systems stipulated by Canada’s National Adaptation Strategy, namely: disaster resilience, health and well-being (including considerations of equity), nature and biodiversity, infrastructure, and economy and workers. LDCs will need to evaluate alternative metrics and analytical techniques to
make investment decisions because current approaches rely on historical data and often do not consider long time horizons.
Ontario’s LDCs are already updating their load forecasting methodologies and equipment specifications based on anticipated climate change. The increasing risk of distribution equipment outages due to extreme weather also highlights the potential reliability and resilience benefits of new technologies. For example, advanced sensing and control technologies can enable fault location, isolation, and service restoration (FLISR) software, ultimately reducing the impact and duration of outages. LDCs should be able to take proactive steps to adapt to climate change and make their grids more resilient in the face of changing environmental conditions. One of these steps involves grid hardening, which is crucial to ensure the reliability and security of the power supply. Grid hardening to mitigate against climate change includes strengthening and upgrading the physical components of the grid, such as distribution lines, transformers, and substations. Reinforcing these elements makes the grid more robust and less susceptible to damage from severe weather events, natural disasters, or physical attacks. Some LDCs have already proposed such investments in rate applications to the regulator, and while some investments have been approved, others have been turned down. A shared understanding between LDCs and the OEB as to the importance of system hardening will be essential going forward given likeliness of more extreme weather events.
11 Ontario Energy Board, Natural Gas and Electricity Utility Yearbooks, September 29, 2022, System Reliability Microsoft Excel File: https://www.oeb. ca/ontarios-energy-sector/performance-assessment/natural-gas-and-electricity-utility-yearbooks#elec
12 Hydro One, Hydro One Restores Power to More Than 652,000 Customers Following Saturday’s Devastating Storm, May 26, 2022: https://hydroone. mediaroom.com/2022-05-26-Hydro-One-restores-power-to-more-than-652,000-customers-following-Saturdays-devastating-storm
3. THE NEED FOR ACTION
As the pace of growth and electrification accelerates, there is an urgent need to ensure a strong foundation for the clean energy economy. It is crucial to be proactive in safeguarding the system against potential disruptions and proactively address barriers to growth. LDCs need to work alongside governments and communities to establish a strong framework for the future, enabling collaborative efforts to address emerging needs and opportunities in the energy sector.
Inaction may lead to significant challenges for Ontarians in the future. The following presents anecdotal examples to illustrate the potential magnitude and significance of inaction.
• Potential for higher costs relative to a businessas-usual scenario: Maintaining the status quo risks perpetuating outdated infrastructure, leading to higher costs for consumers compared to investing in innovative strategies to optimize the use of existing infrastructure and resources. Failure to upgrade the grid may result in increased operational inefficiencies and maintenance costs, which could ultimately be passed on to customers through higher electricity rates.
For example, Eversource, located in Massachusetts, implemented a Volt/VAR optimization (VVO) grid modernization program starting in 2018 to deploy new equipment and software to adjust power flows to reduce line losses. The company has reported that feeders where VVO has been installed have seen a 2% reduction in energy use and 1.8% reduction in peak demand.13
In Ontario, PUC Distribution estimates that its Sault Smart Grid project, using a VVO, will result in a 2.7% reduction in energy consumption and deliver a net present value of benefits to customers of $12.51 million.14
• Lost opportunity to maximize the value of distributed resources to support resource adequacy: Without proactive investment in grid enhancements, Ontario may not realize the potential benefits of DERs as offsets to the need for bulk system supply. Ontario’s electricity outlook projects a need for significantly
more resources, so it is an opportune time to ensure the benefits from existing and new DERs are optimized and integrated into provincial procurement plans. DERs are expected to play an increasing role in the supply mix, due to ease of permitting and integration into existing sites. The IESO has already secured distributed energy storage resources as part of its Expedited LongTerm (E-LT) procurement and is expected to procure more distributed energy storage as part of the LongTerm 1 (LT1) RFP. Further, the IESO has stated a need to enable the participation of DERs in the energy-focused Long-Term 2 (LT2) RFP. The E-LT procurement resulted in costs of approximately $881/MW-business day for storage resources and $1,093.22/MW-business day for non-storage resources (i.e., gas-fired generation).
Ontario is tracking to spend just under $300 million per year on E-LT awarded capacity with a further $550 million per year possible from LT1 (results of which are expected sometime in the first half of 2024). Resource adequacy and real-time market efficiencies require that DERs awarded through the procurements have complete access to the IESO-Administered Markets. This requires grid modernization and enhanced integration between distribution network operation and the IESO-Controlled Grid.
• Lack of data protection/cybersecurity investments could compromise customer privacy and grid security: Inadequate measures to protect customer data and secure critical infrastructure from cyber threats pose significant risks, especially as more electricity infrastructure (both in front of and behind the meter) is automated and moved to digital technologies. Maintaining outdated systems and a lack of skilled cybersecurity professionals may leave the grid vulnerable to cyberattacks, potentially compromising customer privacy and disrupting essential services as well as the economy. For example, in 2023, estimates indicate that the global average cost of a data breach was $6 million, with the cost of a breach for the Canadian energy sector amounting to $9.37 million on average.15 The International Energy Agency has noted
13 Eversource, Electricity Sector Modernization Plan, January 2024, p. 445: https://www.eversource.com/content/docs/default-source/defaultdocument-library/eversource-esmp%20.pdf
14 PUC Distribution Inc., 2022 Incentive Rate-Making Application (EB-2021-0054), November 24, 2021, p. 10: https://ssmpuc.com/UploadedFiles/files/ PUC_2022_IRM%20Rate%20Application_20211124.pdf
15 IBM, Cost of a Data Breach Report 2023, July 2023: https://canada.newsroom.ibm.com/2023-IBM-Cost-of-a-Data-Breach-Report-Canadianbusinesses-are-being-hit-hard
that “there is increasing evidence that cyberattacks on utilities have been growing rapidly since 2018.”16
As a result, both the cyber and physical layers of existing systems could be affected by cybersecurity incidents, including but not limited to unauthorized interference with smart meters or other measurement devices, computer and telecommunication failures, attempts to gain unauthorized access to data, ransomware, or other destructive software. Although utilities can estimate the direct costs of cybersecurity concerns through a systematic approach including asset inventory, technology investments, and quantitative risk analysis, it is challenging to ensure that all indirect costs are quantified, e.g., loss of productivity, customer confidence, and investor trust.
Ultimately, it is estimated that revenue losses due to exposure to cyberattacks can be large for the energy sector. Depending on the scale of the company, the financial exposure of future utilities may result in, on average, up to 3.55% of their gross revenue being compromised, and up to 30.77% of estimated operating income.17 In 2022, the average cost of the most expensive email attack that surveyed energy utilities had experienced in the preceding 12 months was $1,316,000 (US dollars).18
• Grid capacity constraints and lack of a supportive policy environment foreclosing economic development opportunities: Failure to enact a supportive policy environment that encourages investment in grid expansion and capacity upgrades can constrain economic growth and development opportunities. Insufficient grid capacity may limit the ability to connect new businesses, industries, and residential developments, hindering economic prosperity and job creation.
The expansion of the electricity grid can contribute to economic development by meeting the growing
energy needs of businesses and industries, fostering innovation, attracting investments, and creating job opportunities. However, Ontario’s current approach has been to only build out the electricity system (largely focused on the bulk system) once the development project is firmly in place and commitments have been made. This approach is conservative and does not facilitate the practical realities of attracting economic growth. As building an electricity system may require significant time, industries will move to jurisdictions where the supply of power is reliable and readily available, where the connection process is quick and seamless, and, increasingly, where investors can achieve their ESG mandates (e.g., net-zero supply chains). This signals a need for a more proactive approach to capacity expansion, versus the current approach which could be considered a reactive one.
For example, the Windsor-Essex area is actively trying to attract new industry. However, transmission congestion in the area prevents connecting new generation, which in turn is needed to ensure adequate supply of electricity for the large new loads the region is seeking to attract. While the provincial government has taken steps to streamline approvals for a new transmission line, it will still be some years before the line is built. The IESO’s most recent Windsor-Essex Scoping Assessment Outcome Report specifically notes the role of economic development as a driver of electricity demand in the region. The provincial government also streamlined the process for two new transmission lines in northeastern Ontario to “support the production of clean steel [i.e., electric arc furnace] at Algoma Steel in Sault Ste. Marie, as well as economic growth, critical mineral development and new housing in northeast and eastern Ontario.”19 Further, the government has a plan to build 1.5 million new homes over the next 10 years,20 which will all need to be connected to LDCs’ systems.
16 International Energy Agency, Cybersecurity – is the power system lagging behind?, August 2023: https://www.iea.org/commentaries/cybersecurityis-the-power-system-lagging-behind
17 ThreatConnect, Risk quantification report: healthcare, manufacturing & utilities, 2023: https://threatconnect.com/resource/threatconnect-riskquantification-report-healthcare-manufacturing-utilities/
18 Barracuda, 2023 email security trends: the prevalence, impact, and cost of email-based cyberattacks on organizations around the world, February 2023: https://assets.barracuda.com/assets/docs/dms/2023-email-security-trends.pdf
19 Ontario, Province Powering Growth in Northeast and Eastern Ontario, October 23, 2023: https://news.ontario.ca/en/release/1003690/provincepowering-growth-in-northeast-and-eastern-ontario
20 Ontario, More Homes, Built Faster, October 2022: https://www.ontario.ca/page/more-homes-built-faster
Ontario’s economy is rapidly growing, with major investments such as Volkswagen in St. Thomas21 , Stellantis and LG Energy Solutions in Windsor22, and Umicore Rechargeable Battery Materials Canada Inc. in Loyalist Township.23 Collectively, these investments represent billions of dollars in economic development and thousands of new jobs. Further, the province is pursuing a strategy of Strategic Investment and Procurement Agreements24 with U.S. states to promote trade, investment, and economic development, resulting in the signing of economic cooperation Memoranda of Understanding with Indiana25 , Michigan26, and Nevada27 within the last twelve months.
That said, it is well documented that connection capacity challenges are thwarting the efforts of investors. For example, in Leamington, greenhouses have struggled to find a path forward given the length of time it takes to expand grid capacity. LDCs can be part of the solution through the delivery of local programs that can unlock grid capacity and alleviate the connection backlog. The IESO’s Local Conservation Initiatives, offered in conjunction with Ontario’s LDCs is an example of how LDCs can work together to remove connection barriers.
Further, some of Ontario’s largest trading partners in the United States have enacted policies to facilitate and implement the modernization of their electric grids. In 2020, the Federal Energy Regulatory Commission (FERC) issued Order No. 2222 to remove barriers to the participation of DERs in wholesale electricity markets, allowing DERs to provide energy to the market and
receive compensation.28 This order will have the effect of increasing the value of DERs in applicable markets and attracting capital investment, as well as requiring utilities to make the grid modernization investments necessary for successful implementation.
Ontario’s electricity system and LDCs need to keep pace with our biggest trading partners to stay competitive and attractive for capital investment and economic growth.
• Failure to achieve government emissions, electrification, and climate goals: Without proactive measures to modernize the grid and facilitate the integration of renewable energy sources, it may be challenging to meet emissions reduction targets, electrification, and climate resilience. Delayed action could impede progress towards a sustainable and lowcarbon energy future and, by extension, discourage investment by businesses seeking clean energy supply to meet their ESG mandates.
A recent report issued by the Government of Canada focusing on the perspectives of Ontario29 stated that “Climate change is one of the greatest challenges of our time. Rising atmospheric concentrations of greenhouse gases are altering the earth’s climate, driving increases in global average temperatures and variability and extremes of weather. These changes are causing unprecedented impacts, transforming ecosystem structure and function, damaging infrastructure, disrupting business operations, and imposing harm to human health and well-being. Physical climate impacts
21 Ontario Newsroom, Volkswagen’s New Electric Vehicle Battery Plant Will Create Thousands of New Jobs, April 21, 2023: https://news.ontario.ca/en/ release/1002955/volkswagens-new-electric-vehicle-battery-plant-will-create-thousands-of-new-jobs
22 Ontario Newsroom, Major Investments Secure Automotive Manufacturing Futures for Windsor and Brampton, May 2, 2022: https://news.ontario.ca/ en/release/1002141/major-investments-secure-automotive-manufacturing-futures-for-windsor-and-brampton
23 Ontario Newsroom, Governments of Canada and Ontario Finalize Agreement with Umicore Rechargeable Battery Materials Canada Inc. for New Plant in Loyalist Township, October 16, 2023: https://news.ontario.ca/en/release/1003655/governments-of-canada-and-ontario-finalize-agreementwith-umicore-rechargeable-battery-materials-canada-inc-for-new-plant-in-loyalist-township
24 Ontario, Ontario Moves Forward with New Strategy for U.S. Trade, February 7, 2020: https://news.ontario.ca/en/release/55696/ontario-movesforward-with-new-strategy-for-us-trade
25 Ontario, Ontario and Indiana Sign Agreement to Boost Trade and Investment, January 23, 2024: https://news.ontario.ca/en/release/1004095/ontarioand-indiana-sign-agreement-to-boost-trade-and-investment
26 Ontario, Ontario and Michigan Strengthen Economic Ties, July 25, 2023: https://news.ontario.ca/en/release/1003318/ontario-and-michiganstrengthen-economic-ties
27 Ontario, Ontario and Nevade Strengthen Economic Ties, September 27, 2023: https://news.ontario.ca/en/release/1003556/ontario-and-nevadastrengthen-economic-ties
28 FERC, FERC Order No. 2222 Explainer: Facilitating Participation in Electricity Markets by Distributed Energy Resources, July 2023: https://www.ferc. gov/ferc-order-no-2222-explainer-facilitating-participation-electricity-markets-distributed-energy
29 Douglas, A.G. and Pearson, D. Ontario; Chapter 4 in Canada in a Changing Climate: Regional Perspectives Report, (ed.) F.J. Warren, N. Lulham, D.L. Dupuis and D.S. Lemmen; Government of Canada, Ottawa, Ontario, 2022
3. THE NEED FOR ACTION
and risks to human, natural and built systems in Ontario are driven by average annual warming temperature and extreme heat, drought, changes to intensity and frequency of precipitation and other climate variables. Avoiding or reducing the worst impacts of humaninduced climate change requires action on parallel fronts: rapid and deep reductions in greenhouse gas emissions and proactive and planned measures to adapt to current and imminent future changes. While there are adaptation efforts underway to address these impacts, the rapid pace of climate change requires large-scale, accelerated action in all facets of our society and economy.”
One of the primary motivations behind electrification and DER integration is the desire to reduce carbon emissions and costs. However, this presents a significant challenge for LDCs as they must enhance their operations significantly to reliably manage a more complex grid. Without adequate grid modernization, LDCs may struggle to integrate DERs beyond a certain threshold, thereby limiting the extent of electrification and carbon reduction achievable.
In Ontario, for example, consider the benefits of an LDC modernizing its system to facilitate customer uptake of EVs. Estimates indicate that the average driver in the province can save between $1,500-$2,500 per year on fuel and maintenance costs compared to a fossil fuel car.30 Also, recent studies have reported on the health benefits of electric vehicles on air quality. For example, researchers at the University of Toronto modelled the impact of converting all cars and SUVs in the Greater Toronto and Hamilton Area (GTHA) into EVs, predicting that it would result in 313 fewer deaths per year with an estimated social benefit of $2.4 billion.31 More generally, failure to reduce emissions
will result in billions of dollars in healthcare costs for Ontario associated with climate impacts of heat-related productivity losses, heat-related deaths and groundlevel ozone-related illnesses and deaths.32
• Further, as noted above, several of Ontario’s largest trading partners in the United States have enacted policies to facilitate and implement the modernization of their electric grids. In many instances, these policies are part of broader government initiatives related to reducing emissions and achieving a net-zero economy. This further underscores the need for Ontario to keep pace with our biggest trading partners to stay competitive and attractive for capital investment and economic growth.
• Customer expectations and satisfaction with electricity service not met: Inadequate investment in grid modernization may result in subpar electricity service quality and reliability, failing to meet the expectations and satisfaction of customers. Outdated infrastructure may lead to increased downtime, slower response times to outages, and limited access to innovative services, diminishing overall customer experience.
We acknowledge Ontario’s LDCs are ready to lead the advancement of the clean energy economy by championing customer electrification and the widespread adoption of clean energy solutions. With their readiness to navigate the challenges of a dynamic and multifaceted electricity system, LDCs will continue to be at the forefront of innovation and progress. As the next section of this report outlines, LDC investments in distribution system infrastructure and enabling technologies in the near term are required to support a cost-effective and reliable energy transition.
30 Ontario, Low carbon vehicles and electric vehicles, October 2023: https://www.ontario.ca/page/low-carbon-vehicles-and-electric-vehicles
31 University of Toronto, U of T researchers model the health benefits of electric cars, find ‘large improvement in air quality’, June 8, 2020: https://www. utoronto.ca/news/u-t-researchers-model-health-benefits-electric-cars-find-large-improvement-air-quality
32 Climate Institute for Climate Choices, The Health Cost of Climate Change, June 2021: https://climatechoices.ca/wp-content/uploads/2021/06/ ClimateChoices_Health-report_Final_June2021.pdf
4. INVESTMENTS TO ENABLE THE ENERGY TRANSITION
Many investments are required to expand the distribution system and enable LDCs to meet objectives related to the energy transition, customer choice, resilience to climate change, and delivering affordable, reliable, and safe electric service. The analysis in this paper focuses largely on investments made in the distribution system. These utility-facing investments are required to enable customer-driven investments (i.e., behind-the-meter), such as allowing for two-way flows and enabling the connection and operations of DERs.
Distribution Grid Expansion Investment Requirements
Increasing electricity demands will require LDCs to update their investment plans to increase the capacity of distribution system infrastructure. After years of steady or declining demand, Ontario is now entering a period of growth driven by population and housing expansion, with 1.5 million new housing starts required by the government by 2031, an increase in energy-intensive industries, and electrification. Additional grid capacity is also required to enable wide-scale electrification of the economy under a net-zero scenario. For example, the IESO’s Pathways
to Decarbonization (P2D) report shows the impact of rapid electrification of transportation and space heating required for a net-zero economy by 2050.33 The report noted that a decarbonized electricity sector by 2050 would require “a system more than double the size it is today at an estimated cost of around $400 billion.”34
That said, the P2D report focuses only on bulk system impacts, and explicitly states that it “does not consider the impact on local distribution systems.”35 As a result, it does not consider investment costs required for distribution grid expansion to connect and accommodate new load. To prepare for increasing peak demand, LDCs must invest more in new infrastructure and ongoing renewal of existing infrastructure.
Figure 5 presents an estimate of gross capital investment by Ontario’s LDCs using the demand forecasts based on the IESO’s P2D Report (“Net-Zero Scenario”) and the IESO’s 2024 APO (“Reference Scenario”). While both scenarios assume electrification, the IESO’s P2D report projects significant uptake in air and ground source heat pumps and EVs, driving demand growth, particularly in the winter season. There is a consistent historical relationship
33 IESO, Pathways to Decarbonization, December 2022, https://www.ieso.ca/-/media/Files/IESO/Document-Library/gas-phase-out/Pathways-toDecarbonization.pdf
34 Ibid.
35 Ibid.
Figure 5. Gross Annual Capital Additions by Ontario LDCs, Historical and Forecast
between LDC peak demand and capital investment,36 as published by the OEB, 37 which can be used to estimate future distribution costs. See Appendix C for the methodology and scenario assumptions.
In both the Net-Zero Scenario and Reference Scenario, investment needs to increase from current levels to manage demand growth. The results show that the annual gross capital additions by all Ontario LDCs could double under the Net-Zero Scenario from current levels by the mid-2040s and increase by approximately 130% from current levels by 2050. Even under the Reference Scenario, with more moderate electrification assumptions, annual gross capital additions by all Ontario LDCs could increase by nearly 45% by 2050. Cumulatively, Ontario’s LDCs are projected to spend approximately $103 billion on gross capital additions from 2024 to 2050 (Reference Scenario) and could spend up to $120 billion on gross capital additions from 2024 to 2050 under a Net-Zero Scenario.
Distribution Grid Modernization and Enhancements
Grid modernization is not an end unto itself. As depicted in Figure 6, LDC investments in grid enhancement are guided by the objectives of the LDC and the evolving conditions on the grid to which the LDC must respond. Technology can augment an LDC’s capabilities and enable it to offer new or improved services to customers.
The distribution system is designed to deliver electricity on demand and maintain a reliable last-mile supply. Future enhancements should prioritize meeting this objective amidst deep electrification and increased DER integration. Today and in the future, various metrics can measure progress toward this goal, including cost-ofservice, reliability, resilience, and carbon emissions per unit of energy. For instance, LDCs often report SAIFI (System Average Interruption Frequency Index) and SAIDI (System Average Interruption Duration Index) metrics to gauge the frequency and duration of outages. Grid modernization efforts should align with this objective of providing reliable and affordable power, adhering to established standards for services.
LDCs are motivated to consider the development of grid modernization plans for a variety of reasons. As shown in Figure 7, the main drivers are meeting customer and stakeholder expectations, responding to a changing climate, enabling clean energy goals of customers and governments, responding to technological advancement, and social equity considerations. Grid modernization enables LDCs to respond to a range of customer preferences that are rooted in enabling the energy transition. It can also be driven in response to the realities of a changing climate and the need to focus on climate resilience as Ontario is confronted with more extreme weather. LDCs need to be prepared to adopt new or emerging technologies to safeguard aging infrastructure and integrate DERs that may be providing benefits to the local grid, customers, or bulk system. Grid modernization plans also enhance social equity, particularly through program designs that benefit customers who might be disproportionally burdened by the costs of the energy transition, by promoting fair and inclusive access to new services and opportunities and fostering community empowerment.
The main technologies that work together to enable new LDC functions are illustrated in Figure 8 Sensing and monitoring technologies offer the LDC real-time data on
36 Gross capital expenditures by LDCs include: System Access investments such as customer connections, modifications, or system modifications for infrastructure development; System Renewal investments such as distribution asset replacements and refurbishments; System Service investments which enhance system capacity, safety, and reliability; and General Plant investments such as land, vehicles, and computer hardware and software.
37 Ontario Energy Board, Natural Gas and Electricity Utility Yearbooks: https://www.oeb.ca/ontarios-energy-sector/performance-assessment/naturalgas-and-electricity-utility-yearbooks#elec
Drivers for Grid Enhancements
Enhanced LDC Capabilities Enabled Services
Figure 6. Framework for Grid Enhancement Needs
Drivers for Grid Enhancements
Sensors and Monitoring
• AMI
• Grid Sensors
• Advanced SCADA
• Modernized Protection Relays
Customer & Stakeholder Expectations
Changing Climate
• Service Reliability
• Economic Development
• Electrification
• Affordability
• Customer Choice
• Climate Resilience
• Emissions Reduction Plans
Clean Energy Goals
Technological Advancement
Social Equity
• Renewable Energy Integration
• Storage Integration
• Energy Efficiency
• Safety
• DER Integration
• Cybersecurity
• Social Acceptance
• Enabling Energy Transition
Technology Enablers
Information Technology
• Advanced Communication Networks
• Edge and Cloud Computing
• GIS
• EMS
• DERMS
• Cybersecurity Solutions
• Artificial Intelligence
Operational Technology
• Power Electronics
• Smart Inverters
• Remote-Controlled Switches
• Remote Terminal Units
• DMS
• ADMS
• Generation
• Energy Storage
• EVs
Figure 7. Drivers for Grid Enhancements
Figure 8. Technology Enablers
grid conditions. Information Technology (IT) processes and analyzes data gathered by sensors and monitoring technologies, encompassing digital infrastructure, communication systems, and software applications. Operational Technology (OT) translates insights into actionable steps for LDCs, concentrating on the physical devices and control systems that actively oversee and manage the grid’s operational processes, including DERs. The technologies chosen by LDCs should be considered in the context of the goals they are trying to achieve and the specific conditions they are responding to within their service territory (e.g., number of EV and DER connection requests, etc.).
A description of how foundational technologies enable LDCs to provide services to customers and the grid is provided in Appendix E. Additional case studies of grid modernization plans and frameworks are provided in Appendix F
The enhanced functionalities of the LDC that are enabled by technological investments are illustrated in Figure 9 and include the ability of the LDC to contribute to the overall efficiency, reliability, and adaptability of the system. There is some overlap among these functionalities, which highlights that improvements in one area often have positive effects on others. For example, grid visualization and analytics – components of system visibility – are essential for supporting initiatives within system flexibility.
• Non-Wires Alternatives
• Voltage Optimization
• Proactive Maintenance
• Integrated Planning
• System and DER Models
• Load and DER Forecasting
• Situational Awareness
• Data Visualization
• Hosting Capacity Maps
• Real-Time Reporting
• System Automation
• Load Management
• DER-Enhanced Operation
• Dynamic Resource Allocation
• Virtualization
Moreover, automated devices can dynamically adjust grid operations, reroute power, or isolate faulty components to minimize downtime and enhance both system availability and flexibility. Other investments, such as NWAs, can reduce the need for expansion of existing infrastructure (e.g., managed EV charging can mitigate the need to upgrade existing equipment).
With enhanced functionalities, LDCs are enabled to offer new services and supports that have value to customers and the broader electricity grid, as shown in Figure 10 This includes the ability to provide customized insights and tools to help customers manage their usage, or options to participate in new electricity rate designs. In addition, LDCs can leverage the new investments to offer demandside management services which could reduce customer costs, including serving as NWAs.
An illustrative grid investment roadmap is provided below for explanatory purposes, demonstrating how an LDC may plan to deploy new technologies and enabled services.
The figure outlines a roadmap for LDCs to embrace technological advancement and enhance operational efficiency for the next 10 years. The timeline ends in 2035 to highlight the alignment between LDC initiatives and the broader national objectives for the decarbonization of the electricity sector. Activities are categorized into three key areas: system adequacy, core planning and operation, and markets and customer platforms, reflecting the
Figure 9. LDC Functionalities Enhanced by Technology Adoption
Customer Engagement
Enabled Services
Demand-Side Management
Customer Support
modernization of existing systems and the adaptation to emerging trends.
In the first section of the roadmap, broader terms were intentionally used to encompass the wide range of technologies and solutions that may be required for each LDC to achieve each specific goal. For example, the transition between legacy metering systems to next generation advance metering infrastructure (i.e. AMI 2.0) depends on the current maturity level of deployed technologies, but the overall goals of improving the visibility of the system and the integration of meter data into core operational processes are shared across LDCs. Likewise, the integration of management systems into existing operational platforms and workflows considers Advanced Distribution Management Systems (ADMS), Distributed Energy Resource Management Systems (DERMS), and Outage Management Systems (OMS) as examples of solutions that may be employed depending on their current state of development and adaptability to the LDC’s needs.
The roadmap is a living representation of grid modernization efforts that require adaptation as new technologies mature and industry best practices evolve. However, it conveys the strategic steps needed by LDCs
• Customer Energy Usage Dashboard
• Customized Insights and Supports
• Outage Reporting and Tracking App
• Electricity Rate Options
• Demand Response Programs
• Energy Efficiency Programs
• Renewable Energy Programs
• Grid-Interactive Solutions
• Smart Charging Programs
• Virtual Power Plants
• Microgrid Enablement Programs
• Low-Income Assistance Programs
• Community Energy Campaigns
• Education and Outreach Programs
to effectively navigate the complexities of the energy transition and of technology adoption in the energy sector.
Each of the main sections of the figure can be described as follows:
• System Adequacy – This group deals with the technologies to modernize existing infrastructure in the face of evolving requirements. Increasing the visibility of the system, as well as the connectivity of existing resources and the integration of advanced management systems can be seen as priorities in this first stage of grid modernization.
• Core Planning and Operation – This group unites applications of emerging technologies to foster collaboration and coordination among different operational procedures. The development of robust system models and forecasting algorithms is paramount for the realization of the value added by DERs and NWA projects and the optimized planning and operation.
• Markets and Customer Platforms – This group emphasizes the role of demand-side resources and DR programs, as well as the improvement/enablement of the corresponding market mechanisms, to unlock the full potential of decentralized resources and transform the customer experience.
Figure 10. Services Enabled by Enhanced LDC Functionalities
4. INVESTMENTS TO ENABLE THE ENERGY TRANSITION
Today
Roll out the transition from AMI 1.0 to AMI 2.0
Upgrade of Existing Communication Infrastructure
Year 5
Expansion of AMI 2.0 to Cover the Majority of Service Areas
Optimization of Communication Networks to Support Data Scalability
Year 10
Completion of AMI 2.0 Deployment
System
Adequacy Technologies to further modernize existing resources
Implementation of Monitoring Devices for Critical Grid Assets
Integration of Monitoring Systems with Centralized Control Platforms
Integration of Management Systems Into Existing Operational Platforms and Workflows
Training and workforce development
Microgrid Enablement
Core Planning & Operation Markets & Customer Platforms
Increase collaboration and coordination between systems Enable emerging resources’ potential
Development and validation of Comprehensive System Models
Load & DER Models and Forecasting Algorithms
Identification and Evaluation of NWA Opportunities
Assessment of DemandSide Resources
Integration Into Planning and Operational Workflows
Analytics and AI to Improve Control Room Situational Awareness
Implementation of Trial NWA Projects
Expansion of NWAs Based on Performance Evaluation and Cost-Effectiveness
DER-Enhanced Operation and Optimization
Load Management and Demand Response
Implementation of Demand-side Management Programs
Refinement of Existing Market Pricing Structures
Development of Customer Data Sharing Platforms
Figure 12 outlines the average grid modernization cost per customer, derived from recent investment plans and regulatory filings by utilities across the United States.38 The costs encapsulated herein, which are incremental to necessary investments of ongoing grid renewal, span a broad spectrum of modernization efforts, including AMI, grid automation, integration of distributed energy generation, and enhanced cybersecurity measures. Notably, the variance in cost per customer across different utilities underscores the influence of regional factors, the existing grid infrastructure’s maturity, and the strategic focus areas of each utility’s modernization roadmap. Of note, Southern California Edison (SCE) invested significantly less per customer than other utilities, particularly in customer empowerment, automation, and reliability. While measures of grid reliability (such as outage events and duration) are similar to those for San Diego Gas & Electric (SDG&E), SCE consistently reports
Expansion of Demand-Side Resource Integration
Implementation of Dynamic Pricing to Incentivize Resource Utilization
Integration of Data with Utility Systems and Customer Engagement Channels
Enhance Customer Participation Models
the highest number of customer smart meter complaints compared to the two other California utilities. A summary of the jurisdictional scan of grid modernization spending by North American utilities is provided in Appendix D
Ultimately, the biggest challenge associated with grid modernization and energy transition investments is not that the investments are necessary or what investments need to be made; instead, the challenge is how to best sequence and pace the investments to mitigate potential rate fluctuations while also enabling more advanced functions and services in the future in a timely manner.
With clear grid modernization and energy transition objectives from the government and the OEB, Ontario LDCs’ ability to make investments becomes more certain as specific investments can be tied to objectives in a transparent and logical manner for the regulator,
38 Where available, these figures are based on reported annual grid modernization capital and operational expenditures over the initial investment period. This period is often shorter than the entirety of the Benefit Cost Analysis (BCA) study period, as the majority of costs are incurred in the near term and benefits are derived in later years. If annual data is not reported, total program costs are annualized for the reported investment period, where available. ‘Customer’ refers to a single electric distribution service account. All figures are reported in 2023 CAD.
Figure 11. Illustrative Grid Modernization Investment Roadmap for LDCs
customers, and other stakeholders to understand and assess.
This concept of pacing electric utility transformation and modernization investments is best illustrated by research carried out by the Lawrence Berkeley National Laboratory (LBNL) and published in the paper Distribution System Evolution.39 The paper presents a three-stage framework for steering the evolution of the distribution system. It delineates how these stages correspond to necessary changes in the distribution system and the potential for DER service transactions at specific thresholds of DER adoption (See Appendix B).
Most, if not all, of Ontario’s LDCs are in various levels of early DER adoption (i.e., Stage 1 of the evolution illustrated in Appendix B). However, it is possible that some LDCs in areas with growing population, strong economic growth, and local governments/shareholders with strong climate change and net-zero plans will be approaching significant levels of DER adoption in the next five years. The LBNL model is not meant to suggest that there should or will be a “one-size-fits-all” infrastructure sequencing and pacing plan for all LDCs in Ontario. Ontario is served by nearly 60 LDCs of a diverse and varied range of characteristics; some of the more significant differences among LDCs are rural versus urban, ownership (municipal, private, mixed), size
of customer base, diversity of customer base (residential, multi-residential, commercial, industrial), and other factors (population growth rates, weather, income levels, current state of grid modernization, rate of DER penetration, etc.). All these factors (and more) will influence the specific investments of Ontario’s LDCs.
A tangible example is evident in New Zealand, where the Electricity Networks Association introduced the Network Transformation Roadmap in 2019 for the country’s electricity distribution enterprises. This roadmap aims to strategically position distributors to address consumers’ evolving distribution service requirements effectively and efficiently. It provides guidance for distributors to plan and enhance their networks and operations in a manner that ensures flexibility during times of disruptive change. The two-year progress review40 identified several issues highlighting the fact that the sequencing of enabling investments for a distribution utility depends very much on local circumstances. Some of the findings of the review that are relevant to Ontario’s circumstances are the following:
• Most small-mid size electricity distributors identified resource requirements to run ADMS and systems in general as an issue; this included Supervisory Control and Data Acquisition (SCADA) systems, asset management systems, geographic information systems
39 Martini, P., & Schwartz, L, Distribution System Evolution, Lawrence Berkeley National Laboratory, January 9, 2024: https://escholarship.org/uc/ item/1g0940d5
40 ENA, Network Transformation Roadmap: Progress Report, prepared by Dr. Allan Miller, June 2021, p. 12: https://www.ena.org.nz/resources/ publications/document/947
Unitil (MA) Ngrid (MA) PG&E (CA) SDG&E (CA) SCE (CA) First Energy (OH) Rhode Island Energy (RI)
Annual Grid Modernization Investment Per Customer (2023$CAD) Number of Customers
Figure 12. Recent U.S. Utility Grid Modernization Costs per Customer
(GIS), work management systems, and financial management systems.
• Almost all electricity distributors indicated the challenge of forecasting the future and the impact that uncertainty in policy and regulation had on developing plans.
• Rural and urban distributors in areas with high solar capacity factors and comparatively higher-income consumers are likely to experience higher photovoltaic solar uptake. Therefore, photovoltaic standards and network understanding will be a priority.41
• Urban distributors are more likely to experience high EV uptake and concentration, making supplying energy to EVs and managing capacity with existing low-voltage networks a priority.
• Distributors with networks supplying remote areas are more likely to need to consider microgrids.
• Distributors in areas with significant population and/ or industry growth face pressure to provide network services and may look for NWAs to manage expansion while they reinforce transmission and/or subtransmission capacity. By contrast, distributors in areas with static or declining population and/or industry will likely not need NWAs as they have excess capacity.
In Ontario, LDCs of all sizes are prepared to implement adaptive strategies tailored to their respective capacities and needs. Larger LDCs may have scale and resources to drive innovation internally while smaller LDCs have agility. However, all LDCs can and do leverage partnerships effectively. For example, organizations such as the GridSmartCity Cooperative allow LDCs to achieve efficiencies through bulk purchasing power.42 Similarly, the Ontario Mutual Assistance Program, was developed by LDCs to serve as a “single point of contact for utilities to request & offer mutual assistance resources when damaging events occur within a member’s service territory.”43
Adaptive strategies include:
1. Collaborative Services: Engaging in shared services agreements with other LDCs to tap into specialized resources essential for grid modernization endeavors. By pooling resources and expertise, LDCs can access advanced technologies and knowledge that might be outside their existing individual capabilities.
2. Regional Partnerships: Establishing consortia or alliances with neighbouring LDCs to collectively invest in and undertake grid modernization initiatives. This approach enables LDCs to share costs, risks, and benefits associated with infrastructure upgrades and technological advancements, fostering synergistic collaboration and regional development.
3. Vendor Collaborations: Building strategic partnerships with technology and service providers for turnkey solutions for grid modernization projects. By collaborating with experienced vendors, LDCs can streamline the implementation process, from initial installations to ongoing maintenance and support services, ensuring efficient project delivery and optimized performance.
These adaptive strategies underscore the dynamic landscape of Ontario’s energy sector, where LDCs of all sizes are actively embracing innovation and collaboration to meet the evolving demands of their customers and communities.
Workforce Skills & Capabilities
In the face of the volume of technology investments required as part of grid modernization, it is easy to lose sight of the essential human capital enabler for these technologies and the services the technologies make possible. Electricity Human Resources Canada (EHRC) has forecast the need for 28,000 new electricity sector
41 Solar installed capacity retrieved from IESO’s Active Generation Contract List calculated per person across Ontario cities/towns has a moderate positive correlation with average median total income and a high positive correlation with size of average solar generation (larger capacity sizes indicate higher capacity factors of that region). The relevant datasets are listed here: IESO, Active Contracted Generation List , December 31, 2023: https://www.ieso.ca/-/media/Files/IESO/Document-Library/power-data/supply/IESO-Active-Contracted-Generation-List.xlsx , Statistics Canada. Table 98-10-0077-01 Economic family total income group by economic family structure: Canada, provinces and territories, census metropolitan areas and census agglomerations with parts, November 15, 2023: https://www150.statcan.gc.ca/t1/tbl1/en/tv.action?pid=9810007701 , Statistics Canada. Table 17-10-0135-01 Population estimates, July 1, by census metropolitan area and census agglomeration, 2016 boundaries, January 11, 2023: https://www150.statcan.gc.ca/t1/tbl1/en/tv.action?pid=1710013501
42 See GridSmartCity for details: https://www.gridsmartcity.com/about-us/cooperative/
43 See Electricity Canada for further details about the Ontario Mutual Assistance Program: https://www.electricity.ca/programs/onmag/
Human Skills
• Analytical reasoning
• Collaboration
• Critical thinking
• Creativity
• Communication
• etc.
Breadth of knowledge, skills, and capabilities
Role-based technical skills related to:
• Customer ecosystem
• Virtual power plant (VPP)
• Planning and engineering
• Sensing, measurement and automation
• Telecommunications
• Physical grid infrastructure
• Cybersecurity
Figure
13. Workforce Skills of LDCs in the Energy Transition
Source: Electric Power Research Institute (2023), p. 7.
employees (equal to 25% of the current sector labour force) by 2028.44
To be able to effectively discharge the new capabilities, a utility will require commensurate expansion and upskilling of its labour force, requiring new staff in new roles, retraining existing staff for new roles, as well as further developing existing skills and capabilities. This will further put pressure on utilities to attract and retain talent. For example, there will be a significant need to invest in the workforce to build knowledge, skills, and processes to take on DSO and new utility functions, such as long-term and real-time planning functions (e.g., forecasting, managing and dispatching load) as well as expertise in automation, field intelligence, and data management.
How utilities approach customer engagement and customer service will need to change significantly, for example, educating and informing customers about why grid modernization investments are being made, dealing with more sophisticated and complicated customer connection requests, and educating and assisting
Business Enabling Capabilities
• Business process reengineering
• Project management
• Digital design
• Communicating data
• Analyzing data
• Managing data
• etc.
Tools and technologies to manage the grid:
• ADMS
• Advanced Data Acquisition, Management and Analytics
• Distribution Automation Equipment
• Other Digital Equipment
customers with understanding potential local and/or wholesale energy market opportunities.
The need for workforce renewal as part of the modernization of utilities has been evident in the UK. For example, Western Power Distribution’s DSO Strategy45 states “To enable many of these functions, both the Distribution Network Operator and DSO will need to improve skills and expand resourcing levels, as new roles and activities are taken on. To do this, existing staff will be trained as these competencies need developing and new skills will be brought into the business where immediate experience is needed.”
Further, Western Power Distribution’s Workforce Resilience Strategy46 states “Having a DSO function sets real challenges for our leaders and our workforce. Building smart, efficient energy systems through flexibility and digitalisation, coupled with the need for an increasingly sophisticated approach to cyber security […] we will need to further extend our IT capabilities to meet the business requirement and commitments for DSO, digitisation, data collection, cyber security and Network and
44 Electricity Human Resources Canada, Electricity in Demand: Labour Market Insights 2023-2028, October 2023: https://ehrc.ca/labour-marketintelligence/electricity-in-demand-labour-market-insights-2023-2028/
45 Western Power Distribution, DSO Strategy RIIO-ED2, December 2021, p.16: https://www.nationalgrid.co.uk/downloads-view-reciteme/515245
46 Western Power Distribution, Workforce Resilience Strategy, December 2021, p.25: https://yourpowerfuture.nationalgrid.co.uk/downloadsview/41898
Information Systems compliance. To meet these business requirements and their associated IT challenges we will require a growth in existing IT services and roles as well as creating several new IT roles such as technical and data architects.”
Similarly, in November 2023, Northern Powergrid “launched twenty new roles within its DSO unit47 – ranging from Commercial Manager, Local System Planning Engineer, Operational Technology Engineers to an Analyst, Data Specialist, Customer Service Manager.”
Overall, a recent 2023 white paper by the Electric Power Research Institute “Workforce Skills of the Future: A Grid Modernization Case Study,” illustrated the breadth and depth of skills, knowledge, capabilities, and technical expertise needed by utilities in order to successfully perform as a modernized utility, noting that “there is (1) the need for ubiquitous foundational skill development that is aimed at enabling grid modernization and (2) specific technical skill development at the role level.”48
Similarly, a 2022 report from the USA’s Department of Energy (DOE) stated that the utility of the future will need workers and engineers in the following areas49:
• System architects
• Data scientists (for data management and analytics)
• Modeling and simulation experts
• IT/OT cybersecurity specialists
• Communications engineers
• Digital control engineers
Overall, LDCs require significant amounts of new hardware, software, and human capital to meet all the demands of the energy transition and electrification of a significant proportion of the economy. By making these necessary investments, LDCs will enable a feasible path to a clean energy economy and unlock economic and social benefits for Ontario.
47 Northern Powergrid. Northern Powergrid Marks Green Careers Week with Recruitment Drive for DSO Unit, November 2023: https://www. northernpowergrid.com/news/northern-powergrid-marks-green-careers-week-with-recruitment-drive-for-dso-unit
48 Electric Power Research Institute, Workforce Skills of the Future: A Grid Modernization Case Study, May 2023, p. 6: https://www.epri.com/research/ products/000000003002027475
49 DOE, 2020 Smart Grid System Report, January 2022, p. viii: https://www.energy.gov/sites/default/files/2022-05/2020%20Smart%20Grid%20 System%20Report_0.pdf
5. BENEFITS OF GRID-ENABLING INVESTMENTS
As shown in Figure 5, under a net-zero scenario Ontario’s LDCs may need to double their spending gross capital additions by mid-2040s, assuming the current dynamic between dollars invested by LDCs and the peak demand served by LDCs is maintained. As LDCs in Ontario continue modernizing their grids in response to the energy transition and electrification, there will be benefits that will accrue to ratepayers, which can apply downward pressure to the total capital expenditure by LDCs.
For some grid modernization investments, the benefits are readily quantifiable, such as enabling measures that lead to a peak demand reduction, in MW, which may lead to deferred or avoided investments for LDCs. Since these peak demand reduction benefits can be converted to a dollar amount based on the current value of otherwise serving the additional capacity, these benefits are considered quantifiable. For other grid modernization investments, quantifying the benefits in relation to the costs of a specific measure can be more elusive. For example, certain grid modernization measures may lead to reliability improvements, yet utilities may struggle to convert the specific benefit to either a peak demand benefit or dollar amount, which negatively impacts the benefit-cost analysis (BCA) and leaves some benefits purely qualitative. Some utilities may also choose to quantify benefits in different ways, leading to differences in the potential benefits.
The grid modernization benefits discussed in this section have been categorized as grid enhancements (considered more difficult to quantify) and DER-related avoided costs (considered more readily quantifiable). While grid modernization and DERs offer numerous potential benefits, this report focuses solely on quantifying one aspect—the avoided costs associated with DERs. This serves to illustrate the potential magnitude of potential benefits in this specific area.
Evaluating the Benefits of Grid-Enabling Investments
A challenge encountered in evaluating the benefits of new technology investments is that many benefits are not easily quantifiable, making it difficult to get a clear understanding of total benefits in relation to total costs. In other cases, it is difficult to determine benefits when
some customers benefit more than others, and/or how to incorporate and evaluate benefits that accrue to society more broadly. Governments, regulators, and utilities are struggling to develop evaluation frameworks to make the complex trade-offs involved with decarbonization policies and goals, direct investment costs, macroeconomic and societal benefits, and the diffuse, delayed, and interdependent benefits that can result.
For example, in January 2024, National Grid submitted its Electric Sector Modernization Plan to the Massachusetts Department of Public Utilities detailing the investments needed in the local electric distribution system over the next five years.50 As part of the plan, National Grid was required, by state law, to identify customer benefits in eight categories, including impact on ratepayers.
Of the non-rate impact related benefit categories, National Grid was able to quantify and monetize the following:
• Reduced greenhouse gas emissions and air pollutants; and
• Grid reliability and resilience.
In addition, National Grid quantified and monetized the economic benefits of its plan, including direct and indirect job creation and economic development impact.
However, even the benefits quantified above represented only a partial monetization of the benefits. As a result, a description of the qualitative benefits of the categories was also provided,51 such as:
• Safety: investments in increased worker safety, improved protection of IT and physical assets.
• Grid Reliability and Resilience (incremental to quantified benefits): investments in early fault detection and active power restoration services.
• Facilitation of the Electrification of Buildings & Transportation: investments to support EV and electric heat adoption.
• Integration of Distributed Energy Resources: investments in DERMS, offering flexible connections.
• Avoided Renewable Energy Curtailment: increasing system flexibility through investments in platforms and
50 National Grid, Future Grid Plan, January 2024: https://www.nationalgridus.com/media/pdfs/our-company/massachusetts-grid-modernization/ future-grid-full-plan.pdf 51 Ibid, pp. 379-382.
5. BENEFITS OF GRID-ENABLING INVESTMENT
Exhibit 7.11: Benefits span eight primary categories outlined in the 2022 Climate Act
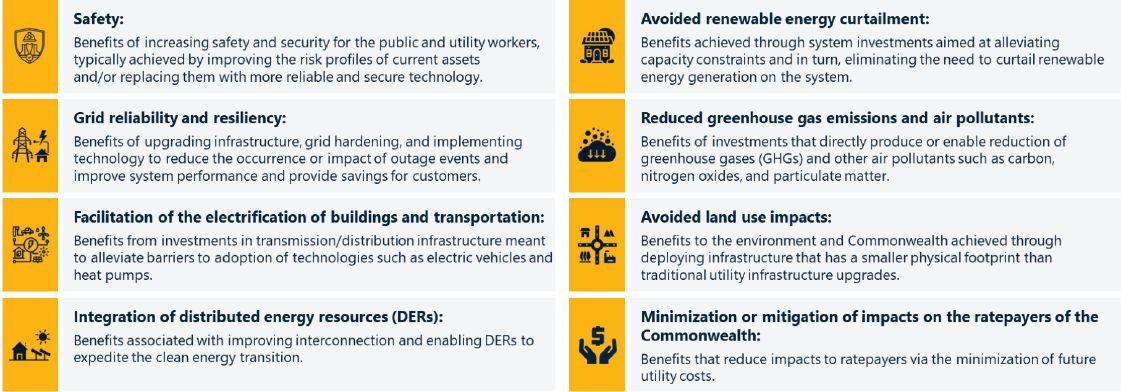
14. Categorization of Customer Benefits Related to Grid Modernization
Source: National Grid (2024), p. 372.
7.1.4 Net Benefits Analysis
customer programs designed to optimize grid services and avoid system constraints by aligning energy consumption with intermittent generation.
• Avoided Land Use Impacts: using NWAs to defer feeder expansion projects and upgrading/ rebuilding existing substations rather than greenfield development.
The Company’s proposed ESMP investments meet the requirements of the Climate Act and deliver benefits that will support long-term value for customers and enable the delivery of the public policy priorities of the Commonwealth. The Company completed a comprehensive net benefits assessment to capture the quantitative and qualitative benefits that customers will realize through delivery of its proposed ESMP investments. For a detailed summary of inputs, assumptions, and workpapers of the net benefits analysis, please refer to Exhibit NG-Net Benefits-3 Net Benefits Analysis Report and Exhibit NG-Net Benefits-4 Net Benefits Model Workpapers
A related issue to benefits being difficult to quantify is that regulators may not have the mandate or capability to incorporate broader benefits into their evaluation of utility investment plans in the absence of clear government policy direction (e.g., in the example above, Massachusetts law requires electric utilities to submit grid modernization plans to the state regulator and requires specific benefits be included in the plan).54
Currently, there is no clear policy or regulatory framework for the OEB to consider, make trade-offs, and/or balance these customer savings and societal benefits against the costs of an LDC’s investment plan.
The Company forecasts the proposed ESMP investments will yield an estimated $821 million (present value) in quantified net benefits from investments completed in 2025 through 2029. In addition, the Company’s proposed ESMP investments will help facilitate the achievement of the Commonwealth’s
There are other hard-to-quantify and/or -monetize benefits such as customer service, choice, and satisfaction, as well as improved power quality, upstream electric system benefits, and proactive investments in capacity and technology that ensure the grid is ready to connect new businesses and attract economic development.52 However, efforts are being made to improve the ability to monetize the value of attributes such as improved reliability through initiatives like the Interruption Cost Estimate Calculator developed by LBNL and Resource Innovations to assist utilities and regulators in the United States with estimating the costs of service interruptions and/or the value of benefits from reliability improvements.53
Potential
Avoided Costs at the Distribution Level from DER Integration in Ontario
Grid modernization investments unlock the ability for LDCs to utilize DERs connected to their system to defer or avoid capital expenditure as well as improve reliability. Recent studies by the IESO have identified the types and amounts of DERs that could contribute to Ontario’s system needs within a ten-year timeframe (between 2023
52 See National Grid (January 2024); Woolf, Tim, Havumaki, Ben, Bhandari, Divita, Whited, Melissa, and Schwartz, Lisa C. Benefit-Cost Analysis for Utility-Facing Grid Modernization Investments: Trends, Challenges, and Considerations, Lawrence Berkeley National Lab, United States, 2021: https://emp.lbl.gov/publications/benefit-cost-analysis-utility-facing
53 The Interruption Cost Estimate Calculator: https://icecalculator.com/home
54 The General Court of the Commonwealth of Massachusetts, An Act Driving Clean Energy and Offshore Wind, 2022: https://malegislature.gov/ Laws/SessionLaws/Acts/2022/Chapter179
Figure
Range of Cumulative DER Benefits
and 2032).55 DER potential was quantified in terms of peak demand savings, which can be monetized by considering the total dollars spent by LDCs (on capital additions) as compared to the total MW of peak demand served.
The potential gross distribution-level avoided costs realized by fully enabling DERs in Ontario range from $200 million (achievable potential) to $800 million (economic potential) annually56 by 2030 given the 2024 APO demand forecast. Benefits by 2030 are similar for the IESO’s P2D demand forecast. It should be noted that these are gross benefits and have not considered additional costs borne by LDCs to fully enable cost-effective DERs.57
The range of gross reduction from avoided capital expenditure by LDCs due to DERs is shown in Figure 15 as both an annual gross benefit and a cumulative gross benefit. In total, the potential for cumulative gross avoided costs could exceed $4 billion by 2030.
Range of Annual DER Benefits
The forecast potential range in gross avoided costs from DERs in Ontario is significant. The gap between the achievable and economic DER potential was addressed in the IESO’s DER Potential Study58:
“The gap between achievable and economic potentials relates to a range of factors, including DER adoption and diffusion, market barriers, DR program participation limits and the limited financial attractiveness of some DERs to specific customers. This gap can be narrowed through actions such as improving DER compensation for services like capacity and [Transmission and Distribution] benefits, securing DERs more directly through programs or procurements, and by enhancing opportunities for DERs to participate in wholesale markets.”
Further description of the methodology used to calculate these benefits is provided in Appendix C
55 Ontario’s Distributed Energy Resources (DER) Potential Study Volume I: Results & Recommendations, September 28, 2022: https://www.ieso.ca/-/ media/Files/IESO/Document-Library/engage/derps/derps-20220930-final-report-volume-1.pdf
56 As further discussed in Appendix D, achievable potential reflects what is likely in Ontario given current market conditions, and economic potential is what is cost-effective given the benefits.
57 The IESO’s DER Potential Study (September 28, 2022) did not consider LDC-specific costs required to enable DERs.
58 Ontario’s Distributed Energy Resources (DER) Potential Study Volume I: Results & Recommendations, September 28, 2022, p. ES-2: https://www.ieso. ca/-/media/Files/IESO/Document-Library/engage/derps/derps-20220930-final-report-volume-1.pdf
Figure 15. Range of Potential Gross Avoided Costs from Using DERs in Lieu of Traditional Distribution Infrastructure
Developing Grid Modernization Plans
The challenge associated with evaluating the costs and benefits of grid modernization plans is evidenced in Power Advisory’s jurisdictional scan completed for this report. Power Advisory reviewed 24 reports across 15 states and based on available quantified cost and benefit data, 12 reports across nine states were included in the analysis (see Appendix D).
Grid modernization investments vary widely among utilities and states, with differing project scopes. Some projects have customer enrollment or geographic area limits within a service territory, while others do not. Of the utilities analyzed, six showed positive benefit-cost ratios (accounting for total benefits and costs across all measures) while six were unable to quantify sufficient benefits. Challenges exist for some utilities in justifying grid modernization investments, exemplified by Ohio’s rejection of FirstEnergy’s GridMod Phase 1 Cost-Benefit Analysis.
It is important to note that benefit-cost ratios may not capture all benefits, and qualitative benefits should also be considered. Positive benefit-cost ratios as referenced in other jurisdictions may not necessarily translate to cost-efficient investments in Ontario due to unique LDC circumstances. Data on grid modernization measures were often limited, primarily to cost data, and frequently submitted to regulatory bodies in redacted or confidential files. Assessing measure-level information was hindered by this practice.
The applicability of US data to Ontario is complicated by the current phase of grid modernization, with various stages of investment among LDCs. For example, while some US utilities have recently implemented smart meters to enable TOU rates, such rates have been in place in Ontario for some time.
A key finding from the jurisdictional scan is that many jurisdictions are currently assessing and mandating grid modernization plans. However, the challenge lies in quantifying the numerous benefits associated with these plans in monetary terms. As a result, utilities, public utility commissions, and other stakeholders often struggle to reach a consensus on how to justify and evaluate such investment plans, including prioritization, timing, costeffectiveness, and cost allocation.
Specifically, broader system and societal benefits pose a significant challenge in terms of monetary quantification,
despite the existence of performance metrics. These benefits encompass aspects such as resilience, safety, customer flexibility, market opportunities, choice (such as the integration of DERs), customer satisfaction, improved power quality, economic development, and equity. Additionally, some investments are intertwined with others or are essential for future functionality, even if they may not be utilized for several years. An additional factor that is difficult to quantify is the speed with which DERs can be implemented, relative to the long lead times needed for conventional large, centralized generation resources. This qualitative value, and the need to consider it, becomes all the more salient in times of tightening supply.
In contrast, costs, and their subsequent rate impacts, are comparatively easy to quantify and monetize. These challenges underscore the necessity for clear articulation of government and regulatory policies regarding the objectives and expected outcomes of grid modernization investments. Clear policies that prioritize or mandate specific grid modernization investments, as well as that guide the OEB in evaluating LDCs’ investment plans, can provide valuable guidance in navigating these complexities.
With clearly defined objectives and outcomes, regulatory bodies can develop filing guidelines that outline how investments will be evaluated and assessed. This includes specifying the type of economic analysis and cost-effectiveness tests to be conducted, as well as expectations regarding the quantification and monetization of both costs and benefits. Such clarity and guidance can facilitate more informed decision-making and ensure that grid modernization investments align with broader policy objectives and stakeholder interests.
New Framework for Cost-Effectiveness Testing
The method of evaluating an investment should be contingent upon the investment driver. This approach has been developed by the US DOE, and adapted for the Ontario context in this paper, as illustrated in Figure 16, below.
In some cases, the government or regulator may mandate certain investments as non-discretionary, such as Ontario’s smart meter–TOU policy mandate or compliance with safety and reliability standards. Here, the need is established, and costs should be assessed on a best-fit or reasonable cost basis rather than through BCA.
Cost-Effectiveness Methods for Typical Grid Projects
Non-discretionary LDC investments to meet minimum standards or government mandates
Discretionary investments that may be evaluated against multiple potential solutions for service delivery
Customer-specific investments that are not socialized to all customers
Source: Adapted from DOE, Modern Distribution Grid, Volume 4: Strategy and Implementation Planning Guidebook, Version 1.0, June 2020, p. 114.
However, for discretionary investments aimed at reducing system costs by avoiding, reducing, or deferring expenses (e.g., minimizing line losses, operational and maintenance costs, or postponing infrastructure expansion/upgrades), BCA should be utilized.
It is essential to identify specific core or foundational grid modernization investments that merit special
attention. This could include investments in sensing and measurement technologies, data management systems, GIS, ADMS, DER and load forecasting, as well as investments enabling participation in IESO markets (i.e., IESO’s resource adequacy procurements). These investments form the backbone of grid modernization efforts and warrant focused consideration in planning and evaluation processes.
Figure 16. Cost-Effectiveness Methods for Grid-Enhancement Investments
6. A FOUNDATIONAL POLICY FRAMEWORK
How can Ontario get to a policy and regulatory framework that allows the sector to move forward in a logical and prudent way? When clear objectives are established, Ontario’s LDCs, regulators, customers, and other stakeholders can better assess what capabilities, functions, and investments are needed to achieve desired outcomes. The absence of a shared understanding will cost Ontario the environmental, reliability, and economic benefits of grid modernization.
It is a daunting task. However, Ontario does not need to invent a framework from scratch.
Much foundational work has already been, and continues to be, undertaken on what and how local utilities need to evolve to meet future energy system needs. Most significantly, the USA’s DOE has a four-volume Modern Distribution Grid Report (MDGR).59 The DOE worked with “state regulators, the utility industry, energy services
companies, and technology developers to determine the functional requirements for a modern distribution grid that provides enhanced safety, reliability, resilience and operational efficiency, and integrates and utilizes [DERs].”
The four-volume series identifies in detail the many objectives, capabilities, and functions related to planning, operations, and markets that distribution grids should evolve towards as part of modernizing (including the cost-effectiveness methods illustrated in Figure 16 in the previous section). The reports highlight the important need for holistic, integrated distribution system planning (including workforce planning) and analysis to achieve “a logical sequence of deploying grid modernization investments.”60
As shown in the table and figures below, as part of the MDGR, the DOE undertook a review of the grid modernization policy of eleven jurisdictions (10 states and Figure 6: Normalized State Objectives
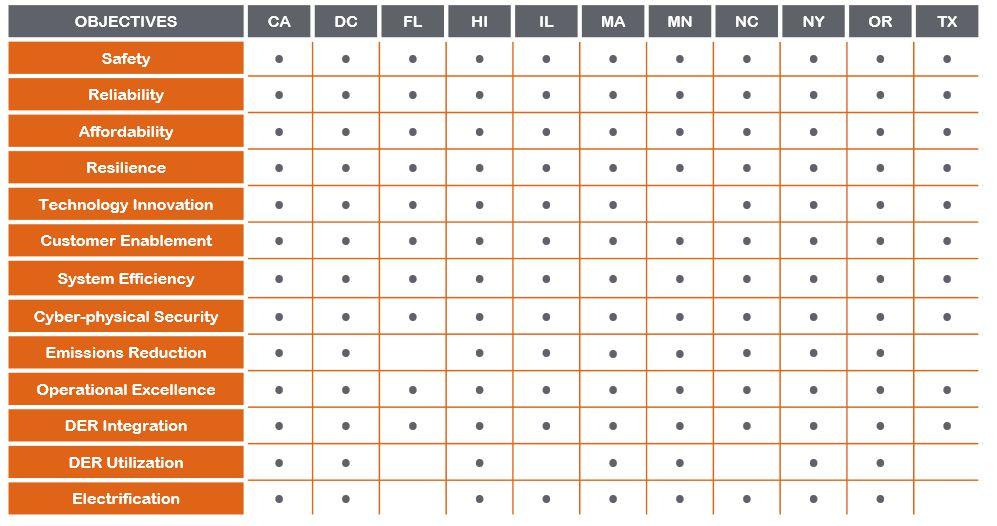
Source: DOE, Modern Distribution Grid, Volume 1: Objective Driven Functionality, Version 2.0, November 2017, p. 21.
In sum, the industry’s long-term goals of delivering safe, reliable, and affordable service and achieving a high degree of customer satisfaction are reflected in these objectives. The objectives that are explicitly linked to new challenges build upon and support these priority areas. For example, the strong interest in DER integration supports customer enablement and emissions reduction. While the grid will need to be able to interconnect new customer-selected technologies without a loss of safety, reliability, or resilience In addition, more states are looking at microgrids and local generation to facilitate reliability and resiliency. The interest in system efficiency reflects
59 DOE, Modern Distribution Grid Report: https://gridarchitecture.pnnl.gov/modern-grid-distribution-project.aspx
60 DOE, Modern Distribution Grid, Volume 4: Strategy and Implementation Planning Guidebook, Version 1.0, June 2020, p. 16: https://gridarchitecture. pnnl.gov/media/Modern-Distribution-Grid_Volume_IV_v1_0_draft.pdf
Figure 17. Grid Modernization Objectives by State
The next step in the process is to identify the capabilities needed to accomplish the objectives within the defined grid modernization scope. A capability is the ability to execute a specific course of action This extends the consideration of “what” is needed to a higher level of specificity. In simple terms, a capability is the ability to execute a specific course of action. This step involves identifying the needed changes or enhancements to existing capabilities or new capabilities and associated functions, as illustrated in Figure 25
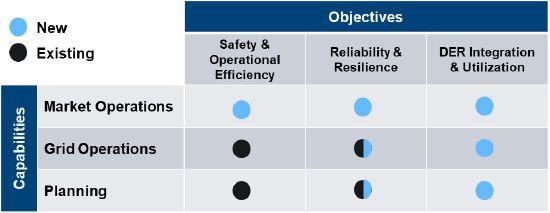
Figure 18. Grid Modernization: New and Existing Capabilities
Grid modernization may involve many new capabilities and functions over a period of time, driven by the specific grid modernization objectives discussed above and by the overall integrated distribution planning processes (discussed in Chapter 2). For example, objectives related to reliability and resilience will inform specific planning criteria xiii that will then be used to identify gaps and related mitigation measures. Improving the performance of the worst-performing feeders is an example of a measure relating to a reliability objective. In some cases, an objective could be tied to a state goal. For example, one fostering the electrification of transportation (perhaps including tax credits offers or other incentives for electric vehicle); such an objective would inform distribution system forecasts that would change the net loading on a distribution system. These objectives will inform requirements and needed additional capabilities for planning, grid system operations, and markets operations. Within each grid functional area (i.e., planning, grid operations, and market operations), specific capabilities may be required to meet the stated objectives for that jurisdiction or utility. Each capability
Source: DOE, Modern Distribution Grid, Volume 4: Strategy and Implementation Planning Guidebook, Version 1.0, June 2020, p. 49.
the District of Columbia), identifying a standardized set of grid modernization objectives (i.e., a desired outcome).61 As the figure below indicates, there is a high degree of alignment and overlap among the jurisdictions regarding objectives. These objectives align with the evolving and incremental roles and responsibilities related to the future of the distribution system, such as capturing DER utilization, integration, and enabling electrification through advanced capabilities related to system planning, system operations, and market operations.

The objectives noted above are typically set by the state legislature, executive order, and/or the state regulator. The MDGR illustrates how objectives drive the capabilities (ability to execute an action), functions (processes to enable a capability), and investments that utilities need to undertake to achieve the desired policy outcomes. As shown below, the MDGR maps policy objectives to new capabilities as well as a detailed mapping of the capabilities to functional areas of the utility.
Additionally, in 2021, the DOE was mandated to “initiate the development of voluntary model pathways for modernizing the electric grid […] Voluntary model policy pathways will provide a wide range of policymakers with targeted resources that facilitate a rational transition to a decarbonized, resilient electric grid while ensuring safe, reliable power and equitable and just outcomes,”62
producing two reports utilizing its Electricity Advisory Committee (EAC).

The EAC stated that a key challenge is that “Regulators, utilities, and technology developers do not have a shared understanding of requirements and the steps needed for grid modernization and infrastructure investments. This lack of shared understanding impedes our ability to achieve decarbonization and resilience goals.”
63
A key finding of the EAC was that:
A distribution network that better enables [DERs] and energy storage utilization; evolving business, industry, and market structures; convergence with transportation and building infrastructures; and electrification is needed. This includes a distribution network that supports the interoperability and the efficient addition of centralized and decentralized assets.
64
xiii Planning criteria are system design and operating parameters established to ensure safe and reliable system operation under normal, transient, and extreme contingency conditions Such criteria often define requirements for the management of current (thermal limits), voltage, and frequency, as well as service quality to customers An example of a high-level planning criterion, that would then guide more detailed engineering requirements, is: neither end-use customer load nor interconnected customer generation shall cause any power quality related issues to the utility grid or any utility end-use customer.
The EAC made a series of recommendations to the DOE across six areas. In order of priority, the areas of recommendations were related to coordination, transmission planning, distribution system planning, resilience, flexibility, and advanced technology capabilities. Some of the recommendations most relevant to this paper and Ontario are:
• Develop and vet operational coordination framework guidelines that consider the roles and responsibilities of all participants and system requirements under all situations, recognizing that participants may have different roles and responsibilities depending on jurisdictional differences.
• Develop a process that provides an avenue for industry leaders, regulators, and policymakers to ascertain where critical conversations are occurring on topics to prevent duplication of efforts across the industry.
• Consider and educate industry leaders on the effect that the transition to a zero-carbon economy across all interdependent sectors of the economy will have,
61 DOE, Modern Distribution Grid, Volume 1: Objective Driven Functionality, Version 2.0, November 2017, pp. 16-21: https://gridarchitecture.pnnl.gov/ media/Modern-Distribution-Grid_Volume_I_v2_0.pdf
62 U.S. Department of Energy, Electricity Advisory Committee, Section 8008 Voluntary Model Pathways for Modernizing the Electric Grid: Expanded Recommendations, February 2023: https://www.energy.gov/sites/default/files/2023-02/EAC%208008%20Pathways%20-%20Expanded%20 Recommendations.pdf
63 Ibid, p. 15.
64 Ibid., p. 2.
Figure 25 Grid Modernization Capabilities & Functions Matrix
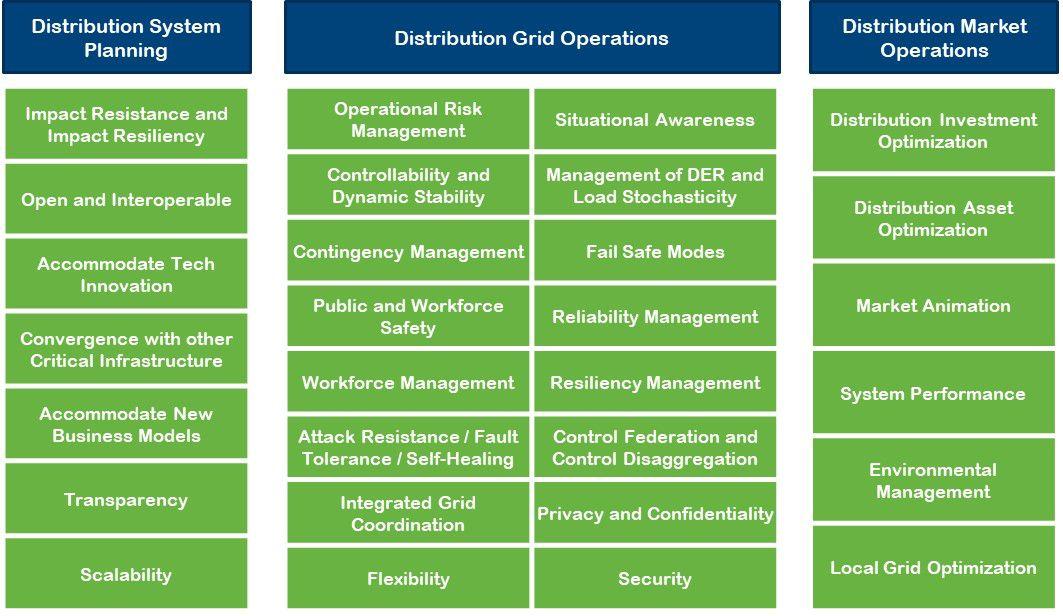
Figure 19. Grid Modernization Capabilities
3.4.2 Functions
Source: DOE, Modern Distribution Grid, Volume 4: Strategy and Implementation Planning Guidebook, Version 1.0, June 2020, p. 50.
resulting in increased electric grid demand and utilization.
• Develop a shared understanding of strategies for building distribution systems to meet the demands.
Capabilities inform what functions are needed. A function defines a business process, behavior, or operational result of a process. It is essential that any grid modernization planning identify required changes/enhancements to existing functions as well as to new functions, which include business processes, people, and enabling technologies. In implementation planning, these functions are unpacked through a systems engineering approach to detail the types of activities, processes, information, and interfaces needed. Identifying functions within the context of needed capabilities to meet objectives is a key reference point for any strategic or implementation planning.
• Establish formal methods for defining and incorporating resilience into integrated planning processes that can balance priorities across several objectives.
• Increase efforts to educate regulators and address interoperability gaps/standards. This also includes providing technical assistance, where required, as well as educating utilities (and their regulators) on how advanced technologies have been used reliably in the United States and abroad.
A highly simplified set of functional categories is provided in Figure 27 (planning functions), Figure 28. Distribution Grid Operations Functions (grid operations functions), and Figure 29. Distribution Market Operations Functions (market operations functions) below. xv
• Review and develop gap analyses across the industry and educate key decision makers on metrics and necessary actions needed to ensure reliability, resource adequacy, stability, and recovery for a future utilizing more intermittent and other resources (e.g., demandside resources, microgrids). Develop a common language and business case for needed operational assets.
xiv The updated list of capabilities in Figure 25 is refined from the original in Volume I, Version 1.1. Workforce management has been added, as many aspects of a modern grid require the implementation of 21st century workforce management systems and workforce tools to operate safely and efficiently.
The analysis, thought leadership, examples, and recommendations developed by the DOE and its EAC have deeply influenced, grounded, and shaped many of the policy and regulatory enablers we believe are needed in Ontario, especially the need for coordination and collaboration to reach a shared understanding of policy objectives, goals, and outcomes that can be translated into a clear regulatory regime (e.g., cost-effectiveness tests) that can be operationalized by LDCs. By leveraging this existing (and ongoing) work, Ontario can move forward with prudent, customer-oriented grid modernization expeditiously.
xv This list consolidates the prior list of functions and sub-functional elements from Volume I, Version 1.1. In practice, the functional decomposition proved to be unnecessarily complicated for strategic planning purposes. This revised list, organized by functional area, also includes new functions based on industry and regulatory staff feedback.

Figure 26 Updated Capabilities Categories
7. POLICY AND REGULATORY ENABLERS
Ontario has a significant opportunity to advance the clean energy economy and achieve significant benefits for Ontarians. The time for action is now, given the projected growth and pressures on LDCs and Ontario’s electricity system that are expected in the near term. Not acting, but instead maintaining the status quo, would not only erode the potential benefits for Ontario’s economy and electricity customers, but would come at a significant cost.
Investments in grid enhancements and modernization are necessary to empower LDCs to introduce new programs and services for their customers while effectively managing the increasing uptake of electricity connections from customers and DERs. As the pace of change accelerates to meet evolving customer needs, it becomes imperative to reassess the existing policy and regulatory framework to streamline processes, prioritize electricity affordability, and ensure transparency in the regulatory process for customers and other stakeholders.
Considering Ontario’s current regulatory and policy landscape, we have identified several key policy and regulatory enablers of these initiatives that can be implemented in the near-term and require sector-wide collaboration and coordination. These enablers are crucial for fostering a coordinated and collaborative environment conducive to innovation, efficiency, and adaptation within the electricity sector. They aim to facilitate the seamless integration of emerging technologies, promote consumer choice and participation, ensure the continued affordability, safety, reliability, and resilience of the grid, and uphold transparency in the regulatory process to empower customers.
Policy Enablers
We propose to work collaboratively with the Government of Ontario, OEB, and IESO, as applicable, with respect to implementing the following policy enablers:
1. In the very near term, the Ministry of Energy and OEB lead a time-limited (i.e., no longer than 6-months) collaborative exercise with LDCs, the IESO, customers, competitive services providers, and other stakeholders to develop a clear and shared definition of what electrification and grid modernization is for
Ontario, what it is meant to achieve, which parties are responsible for planning and making these investments, and how to prioritize grid modernization capabilities, functionalities and investments, including those needed to enable DERs to participate and provide services to the bulk system and wholesale market. The grid modernization objectives of the jurisdictions reviewed in Section 2 as well as Ontario’s 2010 Smart Grid Directive65 can serve as a strong basis for the development of new electrification and grid modernization objectives and policies for Ontario.
2. Firm and clear direction from the Ministry of Energy to the OEB, IESO, and industry with respect to establishing and declaring the need for foundational grid modernization investments – similar to the policy direction provided to LDCs with respect to smart meters, TOU, and Green Button implementation as well as recent actions the Ministry has taken to declare priority transmission projects.66
3. Shortly after the completion of (1) and (2), the Ministry of Energy should provide the OEB additional clarity on its role in advancing grid modernization to enable LDCs to move forward with achieving grid modernization and electrification objectives and their associated foundational investments. This could occur through letters of direction, regulation, and/or amendments to the OEB Act (including Section 71 of the Act, which restricts LDC business activities, and which could, for example, be amended to explicitly allow for LDCs’ ownership and operation of DERs such as EV charging infrastructure and load control devices, as well as to remove the 10 MW limit for LDC ownership of renewable generation facilities).
Similarly, the Ministry of Energy should provide the IESO additional clarity regarding its role in advancing grid modernization as it relates to LDCs achieving grid modernization and electrification objectives, such as enabling DER participation in the wholesale market.
4. The Ministry of Energy and OEB to define clear criteria/ path for moving beyond successful grid modernization pilots to system-wide deployment (i.e., access to sustained government (federal and/or provincial) funding or rate base eligibility for next adopters).
65 OEB, Minister Directive Smart Grid, November 23, 2010: https://www.oeb.ca/oeb/_Documents/Documents/Minister_directive_smart_grid_20101123. pdf
66 Ontario, Supporting Critical Transmission Infrastructure in Northeast and Eastern Ontario, October 31, 2023: https://ero.ontario.ca/notice/0197336#decision-details
5. With respect to customer protection, the Ministry of Energy and OEB, working with LDCs, customers, and energy service providers, should examine and consider what new customer protection requirements will be required in evolving energy markets where new competitive market offerings of energy services and products may emerge. Alternatively, depending on the potential future development of local energy markets, customer protection may need to take the form of fairness with respect to access to services, market participation, and/or connection.
6. With respect to workforce needs, we support the recommendations made by EHRC in its 2023 Electricity in Demand: Labour Market Insights67 report, which set out an action plan to develop a comprehensive human resource strategy to address quantity, quality, and partnership aspects of the electricity sector workforce. Two of these recommendations are:
a. Dedicate immigration streams to skill-related shortages in the sector aligned to labour market projections.
b. Enhance collaboration between industry and academia to foster research, development and innovation. Work with technology-specific third parties/agencies to develop new programs that meet industry needs.
7. Following completion of (1) through (3) the Ministry of Energy and OEB should review and evaluate which aspects of the OEB’s Affiliate Relationships Code may need to change given the policy direction and other changes related to visions and objectives of grid modernization, the evolution of electricity and energy markets, as well as any new functions and capabilities required of LDCs.
8. Following completion of (1) through (3) the Ministry of Energy, OEB, and IESO should review and continue exploring changes related to expanded distribution services, such as continuing to investigate and evolve new LDC service delivery models (e.g., DSOs), including the development and implementation of operational coordination protocols between LDCs and the IESO.
9. Following completion of (1) through (3) the Ministry of Energy, OEB, and IESO should review and continue exploring changes related to allowing LDCs to take a
larger and more autonomous role in CDM offerings to customers as part of the new post-2024 CDM Framework.
10. Providing appropriate funding for the investments required for the successful transition of the energy sector in Ontario will be crucial. Changes to the traditional rate funding approach may need to be considered as well as other, new funding approaches.
a. The investments required for enhancements, for other aspects of meeting climate change objectives (e.g. electrification of transportation), and for regular asset maintenance and replacement, will require significant expenditure by LDCs. Part of these expenditures may be able to be funded by provincial and federal initiatives, primarily tied to climate change objectives. However, other sources of funding will need to be considered, over and above the traditional methods available to LDCs through the OEB’s rate application process.
b. As LDCs make investments they will rely on traditional approaches to financing projects –primarily borrowed funds. As these investments become significant, the additional borrowing will raise the debt-equity ratios of these utilities. The increased debt portion in the capital structure may stray outside the deemed structures as directed by the OEB. As part of a consultation on cost of capital and capital structure, the OEB will need to consider the impact of the increased debt that LDCs will have on their balance sheets. In addition, the government may need to consider other funding approaches as part of future policy direction.
c. Currently there is a 10% cap on private equity investment in distribution utilities in Ontario before a transfer tax is triggered.68 Raising this level to 49% would allow for additional equity to be injected into the LDC for the type of investments noted above. In addition, equity injection would help balance the debt increases. An increase in the level of private equity would reduce the provincial government’s transfer tax revenue that it otherwise would have earned (though it should be noted that such revenue is rarely actually realized by Ontario, given the extremely limited number of transactions that actually trigger this tax at
67 EHRC, Electricity in Demand: Labour Market Insights, 2023: https://ehrc.ca/wp-content/uploads/2023/11/EHRC_LMIReport-EN_Digital_v4.pdf
68 See s. 149 of Income Tax Act, s. 94 of the Electricity Act and O. Reg. 124/99.
present). While the increase in private equity would reduce municipal shareholder ownership interest in their LDC, municipalities would still retain majority ownership and the injection of private capital could help grow the business operations, and thereby increase shareholder dividends in the longer term. We suggest that this change should be given due consideration.
Regulatory Enablers
We propose to work with the OEB with respect to implementing the following regulatory enablers:
As soon as possible after completing policy recommendations (1) through (3), and in any case no more than six months after, OEB should lead and finalize the development of a clear and integrated evaluation framework, performance metrics, and filing requirement guidelines for grid modernization investments. This framework must include a clear identification of the grid modernization investments identified as foundational and/ or policy mandate-driven that would be subject to best-fit, reasonable costs evaluation (see Figure 16)
11. Consistent with the goals and objectives established by grid modernization and electrification policy enablers (1) through (3) and its statutory objectives, the OEB should consider mechanisms and/or accounting changes to support LDCs in prudently implementing grid modernization technologies to best serve their customers’ future energy needs, and in consideration of all energy costs, such as:
a. An expanded Advanced Capital Module (ACM) / Incremental Capital Module (ICM) framework and reduced thresholds for grid modernization investments. Grid modernization investments identified in regulatory recommendation (1) should have a lower hurdle for approval and greater certainty as to cost recovery. A consequence of not making this change is that more LDCs may choose to file Custom Incentive Rate-Setting (CIR) applications to address required grid modernization investments.
b. Allow greater access to funds in an Incentive Rate-Setting Mechanism (IRM) term. In addition to expanding the ACM and ICM framework as discussed in part a, the OEB should consider establishing a generic deferral account and collaborate with the distribution sector on a list of eligible prudently incurred grid modernization expenses and investments, or an agreed upon set of criteria to optimize the effectiveness of these investments. Allowing LDCs to recognize and recover the costs associated with grid modernization investments either within 5-year rate periods, or with their rebasing application, will allow LDCs to be more agile in their decision making.
c. Require Distribution System Plans (DSPs) to have a specific grid modernization section that addresses the progress made against the roadmap identified in regulatory recommendation (1), covering 10 future years of information69.
d. Allow capitalization of digital technologies in circumstances where these investments are key to grid modernization, but which might otherwise be classified as operating expenses (i.e., avoid trade-offs between OPEX and CAPEX, like cloud computing)
e. Review its rate mitigation policy with the objective of providing utilities and the OEB with a range of approaches and supporting tools to help mitigate the effects of rate and/or bill impacts, such as phasing in costs over a reasonable period of time, deferral and variance accounts, and rate adders. For example, the OEB previously made funding adders available for smart meter costs and in relation to connection of renewable generation and smart grid development.
12. Regarding climate resilience, the OEB should consider:
a. Supporting capacity-building for LDCs to conduct climate change vulnerability assessments of impacts to energy infrastructure and to support effective climate resilience efforts as well as adaptation planning and implementation as
69 Note: there have been recent changes to the filing guidance to LDCs that have remove requirements for submission of grid modernization plans as part of their applications. The suggestion is to revisit this in context with the broader recommendations of this OEB report: https://www.oeb.ca/ sites/default/files/Chapter-5A-Filing-Requirements-2023-20211216-tracked.pdf
recommended by the Electrification and Energy Transition Panel.
70
b. Modify the Z-factor treatment of climate-relatedevent expenses. System resilience will be a key aspect of future system investments. LDCs have proven to be excellent at restoring service after severe weather events. In many cases, LDCs had to incur added costs to ensure the safe and quick restoration of power to their customers. Storm restoration costs are generally not included in base revenue requirements. LDCs should have more assurance that they will be able to recover the costs required to ensure a safe and reliable distribution system following these events. More frequent climate-related events may cause material
costs in a year on an aggregate basis, but LDCs can recover costs only for events that, individually, meet a materiality threshold. The OEB should consider easing the Z-factor requirement that the costs must be caused by a single event. Current Z-factor requirements have been a barrier to some LDCs recovering their prudently incurred costs from ratepayers and create uncertainty as to whether the LDC will be able to recover those costs. Some LDCs have been successful in Z-factor claims based on the current requirements. However, OEB decisions on Z-factor applications have often reduced cost recovery to a level below the costs incurred by LDCs. This has led to some LDCs foregoing making Z-factor claims for prudently incurred recovery and resilience costs.
70 EETP, Ontario’s Clean Energy Opportunity Report, January 2024, p. 122: https://www.ontario.ca/document/ontarios-clean-energy-opportunityreport-electrification-and-energy-transition-panel
8. THE PATH FORWARD
The preceding sections of this report have explored many aspects and characteristics of a modern electricity distributor and grid modernization, drawing on the experience in Ontario, other jurisdictions, and recent studies. We believe a clear, practical, and achievable path is available for Ontario to establish a prudent framework to allow LDCs to modernize in the best interests of their customers, communities, and Ontario’s economy. The ability of LDCs to leverage their existing customer relationships, expertise, and knowledge of Ontario’s energy system makes LDCs the critical enablers of Ontario’s energy transition journey. An essential foundational element of this path starts with leadership from the provincial government in the form of clear and consistent policymaking, and flows down to the OEB’s mandate and objectives, regulatory policies, and frameworks (illustrated in Figure 20)
With clear policies in place, Ontario’s LDCs, working with customers, can design, plan, and implement prudentlyscoped and -paced grid modernization plans that best reflect their unique characteristics and needs, such as rural/urban setting, size of customer base, diversity of customer base (residential, multi-residential, commercial, industrial), customer preferences, and other factors (population growth rates, weather, income levels, current state of grid modernization, rate of DER penetration, etc.).
Revisiting the regulatory framework now is urgently required and also presents Ontario with an opportunity to unlock numerous benefits for customers while aligning with key policy priorities. Affordable energy is paramount for Ontario, and the province requires an unprecedented expansion of the electricity grid to accommodate the demands associated with new housing infrastructure and facilitate the connection of businesses stemming from economic development in the clean energy sector and decarbonized supply chains. This expansion is not limited to large new customers but encompasses the entire local supply chain. Additionally, these changes are expected to enable LDCs to maintain reliable services despite increased complexity due to the growing adoption of EVs, solar energy, and energy storage solutions. This paper has demonstrated quantifiable benefits of $200 million to $800 million per year, with a potential for cumulative gross benefits of $4 billion by 2030. Unlocking these potential savings requires LDCs to move forward with DER-enabling
investments and to consider DERs within their investment plans in the near term.
Moving forward, it is crucial to acknowledge the unique characteristics of Ontario’s electricity market. Significant changes are not only occurring locally within the distribution system between customers and LDCs, but also on a wider scale within the electricity sector. For example, the IESO’s market renewal program will implement a day-ahead market and locational marginal prices, laying the foundation for future market designs to facilitate the integration of energy storage and DERs.
The IESO’s objectives and actions will also need to be aligned with this new policy direction as it relates to enabling DER participation in the wholesale market, which is currently being explored through the IESO’s collaborative Transmission-Distribution Coordination Working Group. These actions would be similar to those required in the United States related to FERC Order No. 2222, such as working with DERs and LDCs to “address several technical and operational issues related to the integration of DERs into the wholesale markets.”71
With nearly 60 LDCs operating in Ontario, the regulatory framework required to unlock DER integration and coordination with the IESO, as well as the potential adoption of DSO functions, necessitates strong coordination and collaboration among Ontario’s LDCs, the OEB, the IESO, and the government. However, there are clear benefits to such collaboration, including improvements in reliability and resilience. We acknowledge the need for continued engagement with the Ministry of Energy, OEB, and IESO on the evolution of LDCs to DSOs, including the need for ongoing engagement on required DSO functions, coordination protocols, and assessing the need for market rule changes, legislative changes, and regulatory changes, including remuneration frameworks.
Ontario’s current supply and demand outlook, which includes both retirement of existing generation and an increase in electricity supply needs, means that DERs are well-suited to contribute to the province’s future supply needs. Building from a strong foundation, Ontario already has a significant amount of DERs integrated into its system from past programs such as the microFIT/FIT programs,
71 GridWise Alliance, Grid Investments to Support FERC Order 2222, January 2024, p. 7: https://gridwise.org/grid-investments-t0-support-fercorder-2222/
net metering regulation, and Industrial Conservation Initiative. LDCs can lead the way in offering new DER services that customers are seeking, such as EV smart charging programs or local DR initiatives, and they can collaborate directly with industry service providers. This presents a promising avenue for LDCs to enhance their role in the evolving energy landscape while delivering valuable benefits to customers and stakeholders alike.
Based on the analysis conducted in this report, the following recommendations focus on near-term activities that should be completed in the next year:
• Establish a proceeding to develop a shared definition of what electrification and grid modernization are meant to achieve, and prioritize capabilities, functionalities, and investments.
• Establish a view of foundational grid modernization investments.
• Clarify the role of the OEB in advancing electrification and grid modernization and encourage the OEB to consider regulatory mechanisms for the prudent implementation of grid modernization plans and climate resilience.
When implementing the recommended changes, we emphasize the essential requirement for robust engagement with customers and communities, recognizing their pivotal role in shaping Ontario’s clean energy economy. Prioritizing initiatives to engage customers about their needs and preferences supports prudent planning and decision-making regarding grid modernization, electrification, and sustainability.
Additionally, municipal outreach is essential as LDC initiatives should align with local objectives, including economic development, housing, and environmental goals. Collaboration with local governments optimizes and coordinates infrastructure development and leverages local expertise. Engaging stakeholders at all levels ensures a customer-centric transition to a clean energy economy.
The actions outlined in this report are intended to provide a transparent and streamlined approach to decision-making and eliminating barriers to investment decisions needed to advance the energy transition. We are encouraged by the progress made to date in Ontario and looks forward to being a supportive partner in enabling the energy transition, where LDCs play a pivotal role in empowering communities across the province in meeting their economic, environmental, and societal goals.
Determine Grid Modernization Visions & Objectives
• Identify policy context and expected outcomes (e.g., electrification, DER integration, resilience, reliability, affordability, economic growth, customer choice, cybersecurity)
Determine the Functions and Capabilities Needed to Achieve Vision & Objectives
• Identify current state of system and gaps to close in order to achieve vision, objectives, and outcomes
Determine Investments Needed to Enable Functions and Capabilities
• Identify hardware, software, workforce needs
Categorize Grid Modernization Investments
• Identify foundational and policy mandated investments (e.g., sensing and situational awareness)
• Identify discretionary investments (e.g., non-wires procurement)
• Prioritize investments
Determine Evaluation & Performance Metrics for Grid Modernization Investments and Plans
• Establish economic evaluation methods:
• Foundational-policy mandated investments: reasonable-cost/best-fit
• Net benefits: BCA with clear expectations on quantification/monetization requirements and accounting for non-monetized costs & benefits
• Establish performance metrics
Figure 20. Recommended Path to Enabling Grid Modernization Investments
APPENDIX A. POLICY DEVELOPMENTS IN THE PAST 2 YEARS
In recent years, there have been many policy developments impacting Ontario’s LDCs. These advancements further support the rationale for enabling LDC investments to support the transition to the clean energy economy.
Table A-1: List of Mechanisms and Announcements of Policy Developments in Past 2 years
Ontario Government’s Fall Economic Statement (Nov 2023)
Minister of Energy’s Letter of Direction to OEB (Nov 2023)
Public Consultation (July 2023)
Provincial Climate Change Impact Assessment Report (August 2023)
OEB Guidance
Framework for Energy Information Report (Jan 2023)
Phase One Benefit-Cost Analysis (BCA) Framework (Dec 2023)
Transmission-Distribution Coordination Working Group
Ontario announced $3 billion in funding for the new Ontario Infrastructure Bank to support investment in critical infrastructure projects, including energy projects.1
The Minister expects “the OEB will continue to work with the Ministry and the IESO toward the Ministry’s stated commitment of developing and assessing local and market opportunities for DERs, including through alternative energy business models. The OEB should work closely with [the] Ministry to examine the potential regulatory landscape for future utility business models.”2
The Minister also directed the OEB to provide clear direction to the sector on EV charging, including consideration of service standards, a standardized process with enforceable timelines for connecting EV charging infrastructure, and publicly available electric distribution capacity information.
The Ministry of Energy launched a consultation “on the future of electricity energy efficiency programs in Ontario, ahead of the end of existing programs and launch of new programs in 2025.”3
Ministry of the Environment, Conservation and Parks published the province’s first Provincial Climate Change Impact Assessment that evaluated impacts of climate change across the province, including consideration of energy security and energy infrastructure.4
The OEB updated its Filing Requirements for Electricity Distribution Rate Applications to state that “A distributor must also demonstrate that it has a planning process for future capacity needs of the distribution system, which must include, among others, increased adoption of electric vehicles.”5
The OEB’s Framework for Energy Information Report said that the OEB “expects distributors to modify their planning and operations to prepare for DER impacts on their systems, including integrating these resources cost-effectively, while maintaining reliable service for their customers.”6
The OEB published its draft Phase One Benefit-Cost Analysis (BCA) Framework which is intended to help LDCs identify the full distribution-level impacts of NWAs.7
The IESO’s Transmission-Distribution Coordination Working Group8 (TDWG) is discussing DSO models and how different models would need to operate and coordinate with the IESO.
1 Ontario, Launching the Ontario Infrastructure Bank, November 2023: https://budget.ontario.ca/2023/fallstatement/oib.html
2 Minister of Energy, Letter of Direction from the Minister of Energy to the Acting Chair, November 29, 2023: https://www.oeb.ca/about-oeb/ corporate-governance-and-reports/letters-direction-formerly-mandate-letters
3 Ministry of Energy, Electricity Energy Efficiency Programming Post 2024, July 24, 2023: https://ero.ontario.ca/notice/019-7401
4 Climate Risk Institute. Ontario Provincial Climate Change Impact Assessment: Technical Report. Report prepared by the Climate Risk Institute, Dillon Consulting, ESSA Technologies Ltd., Kennedy Consulting and Seton Stiebert for the Ontario Ministry of Environment, Conservation and Parks. January 2023: https://www.ontario.ca/page/ontario-provincial-climate-change-impact-assessment
5 OEB, Filing Requirements for Electricity Distribution Rate Applications – 2023 Edition for 2024 Rate Applications, Chapter 5, Distribution System Plan, December 15, 2022, pg. 9: https://www.oeb.ca/sites/default/files/OEB-Filing-Reqs-Chapter-5-2023-Clean-20221215.pdf
6 OEB, Framework for Energy Innovation: Setting a Path Forward for DER Integration, January 2023, p. 3: https://www.oeb.ca/sites/default/files/FEIReport-20230130.pdf
7 OEB, Benefit-Cost Analysis Framework for Addressing Electricity System Needs: https://www.oeb.ca/consultations-and-projects/policy-initiativesand-consultations/benefit-cost-analysis-framework
8 IESO, Transmission-Distribution Coordination Working Group: https://www.ieso.ca/en/Sector-Participants/Engagement-Initiatives/Engagements/ Transmission-Distribution-Coordination-Working-Group
Mechanism
Ultra-Low Overnight Prices
Clean Electricity Regulations (Aug 2023, Feb 2024)
Federal Government’s Fall Economic Statement (Nov 2023)
Announcement
The introduction of the Ultra-Low Overnight electricity price plan in 2023 gives low volume electricity customers more choice and flexibility to manage their energy costs and consumption.
On August 10, 2023, the federal government released draft emissions performance standards for generation technologies that emit greenhouse gases with the goal of a net-zero national electricity grid in 2035.9 An updated proposal was released in February 2024.
Included delivery timelines for the federal government’s five clean economy refundable investment tax credits (ITCs): for carbon capture, utilization, and storage; clean technology adoption; clean hydrogen; clean technology manufacturing; and clean electricity.10 These ITCs augment significant federal funding to support clean energy and grid modernization, such as Natural Resource Canada’s (NRCan) $4.5 billion Smart Renewables and Electrification Pathways Program.11
Federal Government’s Electric Vehicle Availability Standard (December 2023)
Municipal Leadership
Electrification and Energy Transition Panel
On December 19, 2023, the federal government announced its new Electric Vehicle Availability Standard to increase the supply of clean, zero-emission light duty vehicles, and achieve a target of 100 percent zero-emission vehicle sales by 2035.12
Over the past few years, an increasing number of Ontario municipal councils (which in many cases are the sole shareholder of an LDC) have been passing climate change, netzero emission, and/or community energy plans and strategies (e.g., Thunder Bay, Toronto, Windsor, Sudbury, Ottawa, London, Kingston).
On January 19, 2024, the report of Ontario’s Electrification and Energy Transition Panel (EETP)13, was released. Among the 29 recommendations of the report, the EETP called for the Ministry of Energy, working with the IESO, OEB, LDCs, municipalities, and gas utilities, to develop a formal and transparent co-ordination framework that sets out the scope and objectives for enhanced planning co-ordination at the bulk, regional, and distribution levels. Further, the EETP recommended that to foster innovation within the distribution sector, enhance capacity, and promote prudent risk-taking for the benefit of customers and communities, collaboration among the government, IESO, and OEB is essential, and that the government should develop a clear vision and roadmap for system-wide application, harnessing the full potential of the distribution system and DERs. The EETP asserts that the OEB must facilitate LDC initiatives in grid modernization by establishing a transparent process and technical criteria to identify which LDCs are equipped to locally procure and dispatch DERs effectively. Moreover, the EETP recommends that LDCs should be mandated to bolster their capabilities in procuring and actively managing DERs as NWAs to address distribution-level needs effectively.
9 Canada, Clean Energy Regulation (August 2023): https://www.canada.ca/content/dam/eccc/documents/pdf/climate-change/clean-fuel/ electricity/81000-2-4931-CGI_Unofficial%20Version%20Non%20Officielle.pdf
10 Canada, Fall Economic Statement 2023, Chapter 3 Building an Economy That Works for All Canadians, November 21, 2023: https://www.budget. canada.ca/fes-eea/2023/report-rapport/chap3-en.html#tax-credit
11 NRCAN, Smart Renewables and Electrification Pathways Program: https://natural-resources.canada.ca/climate-change/green-infrastructureprograms/sreps/23566
12 Canada, Canada’s Electric Vehicle Availability Standard (December 2023): https://www.canada.ca/en/environment-climate-change/news/2023/12/ canadas-electric-vehicle-availability-standard-regulated-targets-for-zero-emission-vehicles.html
13 EETP, Ontario’s Clean Energy Opportunity Report, January 2024: https://www.ontario.ca/document/ontarios-clean-energy-opportunity-reportelectrification-and-energy-transition-panel
APPENDIX B. DISTRIBUTION SYSTEM EVOLUTION
This paper describes an evolutionary framework for U.S. electric distribution systems to enable DERs and their evolving use as virtual power plants (VPPs) for a broad range of grid services while also offering grid planning considerations for state regulators, utilities, and stakeholders. VPPs can help address a broad range of challenges to modern grid operations by providing clean energy and demand flexibility to help minimize costs for a decarbonized future, improve resilience, and provide other consumer and grid benefits.
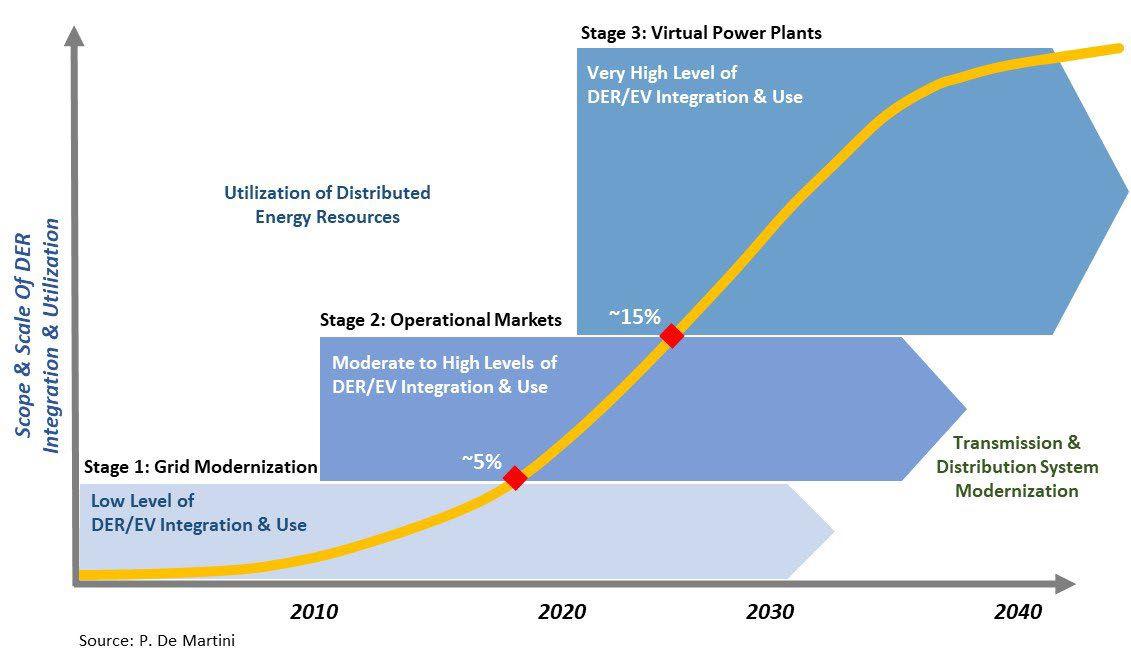
Source: Figure from Martini, P., & Schwartz, L. (2024). Distribution System Evolution. Lawrence Berkeley National Laboratory: https:// escholarship.org/uc/item/1g0940d5
The Three Stages of DER Penetration and Distribution System Evolution
(Reproduced from Martini & Schwartz (2024))
Stage 1 – Grid Modernization: Low DER adoption (<5% of distribution system peak). DER levels can be accommodated within existing distribution systems without material changes to infrastructure, planning, and operations. Grid modernization is undertaken to address reliability, resilience, safety, and operational efficiency and to enable forecasted requirements for DER integration and utilization.
Stage 2 – Operational Markets: Wider scale (e.g., 5% – <15% of distribution system peak) customer adoption of onsite DER/ EV technologies for their energy management and resilience. DERs – individually and in aggregations – are increasingly used as load-modifying resources for both distribution NWAs and wholesale capacity and ancillary services. Integrated distribution system planning and grid modernization are needed to enable real-time observability and operational use of DERs.
Stage 3 – Virtual Power Plants: Large scale (e.g., >15% of distribution system peak) adoption of DER/EV technologies and utilization for wholesale and distribution services, plus community microgrids. Individual DERs and DER aggregations are optimized and orchestrated to support grid service requirements for distribution and transmission systems. Multi-use/ community microgrids help support local energy supply and resilience. Ultimately, distribution system-level energy transactions are enabled. This third stage of DER utilization requires coordination across jurisdictions (e.g., FERC Order 2222) and infrastructure to support both grid and market operations.
Note: The percentages shown are rough approximations for the threshold levels at which significant institutional, business, and grid changes are required due to consumer actions, policies, and new business models. The term “market” in [the] paper applies to any transaction involving the use of DER services through one or more wholesale, retail, bi-lateral market, and compensation methods (e.g., tariff, program, procurement, bi-lateral trade, locational marginal price market, auction).
APPENDIX C. METHODOLOGY FOR ESTIMATING DISTRIBUTION SYSTEM EXPANSION COSTS AND
POTENTIAL AVOIDED COSTS TO THE DISTRIBUTION SYSTEM
Distribution System Costs
Electricity distribution infrastructure is designed to serve seasonal peak demand. On a long enough timescale, most of a distributor’s capital expenditures are linearly related to the distributor’s customer demand. By the same principle, a sustained reduction in peak demand due to energy efficiency or the use of DERs would lead to deferred or avoided capital investment.
Different approaches can be used to estimate the value of avoided distribution infrastructure. Some techniques estimate the cost of growth-driven service upgrades for small, representative samples of the overall service area. Another option, used in this report, relies on empirical relationships between spending and demand.
Data from the OEB’s Electricity Reporting & Record Keeping Requirements for 2015 to 2022 are used to explore the relationship between demand and capital spending:
• LDC Noncoincident Demand is defined as the higher of summer and winter peak for each LDC each year.14
• Total Gross Capital Additions is used as an indicator of the demand-related capital expenditures.15 Costs are escalated to 2023 dollars using Canadian All Items Consumer Price Index (CPI).
As expected, LDC capital spending increases linearly with noncoincident demand for each service area (Figure C-1).
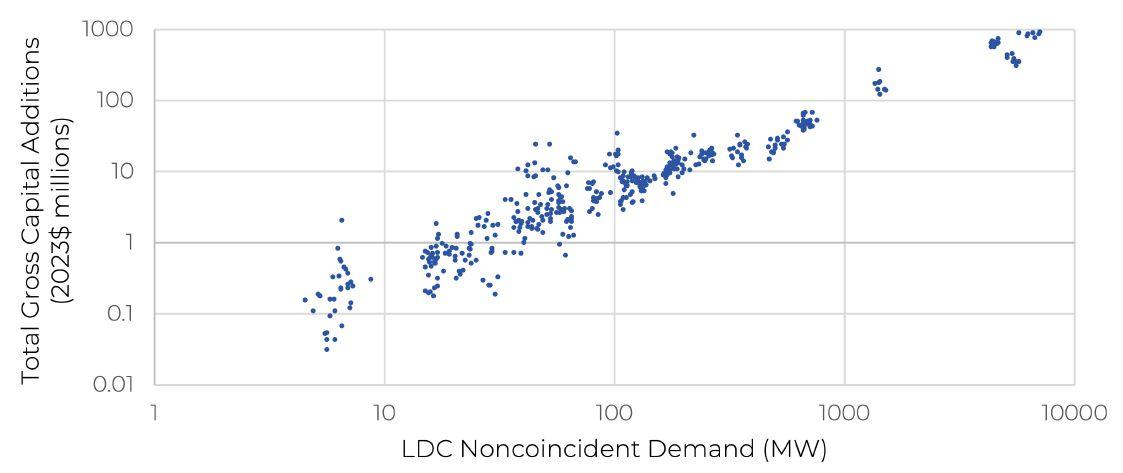
When considering the total for all LDCs, each MW of noncoincident demand for LDC service areas leads to an annual capital addition of approximately $0.1 million (Table C-1). When calculating the capital additions needed to serve
14 The maximum of Winter_Peak_Load_Without_Embedded_Generation and Summer_Peak_Load_Without_Embedded_Generation from: https:// www.oeb.ca/open-data/electricity-reporting-record-keeping-requirements-rrr-section-2155-utility
15 Total_Gross_Capital_Additions from: https://www.oeb.ca/open-data/electricity-reporting-record-keeping-requirements-rrr-section-2152-capital
Figure C-1: Linear Relationship Between LDC Size and Capital Additions
demand, spending is assumed to occur two years before demand appears, reflecting the lag between spending and system expansion.
Table C-1: Total LDC Noncoincident Demand and Capital Additions, 2015-2022
The annual growth rate of Ontario’s summer and winter peak demand was calculated for the IESO’s 2022 P2D demand forecast16 and the 2024 APO demand forecast.17 These growth rates were then applied to the seasonal noncoincident peak demand for each LDC to estimate the total noncoincident peak in each scenario (Figure C-2 and Figure C-3). By the mid-2030s, all LDCs become winter-peaking in the P2D scenario. Scenario assumptions are shared below.
16 IESO, Pathways to Decarbonization Appendix D, December 2022, https://www.ieso.ca/-/media/Files/IESO/Document-Library/gas-phase-out/ Pathways-to-Decarbonization-Appendix-D.xlsx
17 IESO, Annual Planning Outlook (APO), March 2024, p. 30: https://www.ieso.ca/-/media/Files/IESO/Document-Library/planning-forecasts/apo/ Mar2024/2024-Annual-Planning-Outlook.pdf
Figure
Fig C-2: P2D
Figure C-3: Historical and Forecast LDC Noncoincident Demand by Season, Based on 2024 APO Scenario
Table C-1: Major Scenario Assumptions Impacting Demand Growth – IESO’s P2D versus 2024 APO
Major Scenario Assumptions IESO Pathways to Decarbonization (P2D) Report (issued December 2022)
Residential and Commercial Water and Space Heating
Increased mix of electric powered air source heat pumps and ground source heat pumps for commercial and residential buildings in a 9-year transition.
Implementation of the Toronto Green Standard version 6 in 2028, which would require buildings constructed in Toronto in or after 2030 to have near zero emissions. EVs
For existing buildings, it reaches a 100% target by 2035 and for new buildings it reaches a 100% target in Toronto by 2030 and all other IESO zones by 2035.
Light Duty Battery EVs:
Consistent with federal government policy targets so mandatory target of 100% of new sales of light-duty vehicles in 2035 and thereafter to be zero-emission and interim target of 60% of new sales of light-duty vehicles in 2030 and thereafter to be zero-emission.
Medium and Heavy Duty Battery EVs:
100% of municipal transit commission buses to be electrified by 2040, increased bus fleet, and electrical charging demand, of 10% higher than baseline forecasts, other electric mobility electrical charging demand increased to be equivalent of 5% of light duty battery EV, and majority of freight vehicles to be hydrogen fuel cell powered, rather than battery electric powered.
Light Duty Battery EVs:
EV adoption forecast continues to be in line with federal government regulations of at least 60 per cent sales by 2030 and 100 per cent in 2035.
Medium and Heavy Duty Battery EVs: Adoption of battery-powered medium and heavy-duty vehicles will reach 22 per cent of total medium/heavy duty vehicles by 2050.
APPENDIX C. METHODOLOGY FOR ESTIMATING DISTRIBUTION SYSTEM EXPANSION COSTS AND POTENTIAL AVOIDED COSTS TO THE DISTRIBUTION SYSTEM
Major Scenario Assumptions
Industry
DERs
IESO Pathways to Decarbonization (P2D) Report (issued December 2022)
Broad substitution of natural gas fuel to electricity, roughly 20 per cent of current levels by 2050.
Incremental DERs can potentially exist up to levels to be identified in the IESO’s 2022 Distributed Energy Resource Achievable Potential Study.
Conservation Savings consistent with the maximum achievable potential from the 2019 IESO Conservation Achievable Potential study.
Does not assume broad-scale industrial sector fuel-switching for process heating from GHG-emitting fuels to electricity.
Will leverage the mechanisms in the Resource Adequacy Framework to provide opportunities for these resources to continue to provide capacity and energy to help meet Ontario’s reliability needs.
Does not assume policy of pursuing all estimated cost-effective achievable CDM program savings potential. Increased forecast CDM program savings relative to 2022 APO are based on enhanced 2021-2024 CDM Framework budgets, targets and updated actual results.
Potential Avoided Costs
The IESO’s DER Potential Study included three demand forecast scenarios. Results from the BAU+ demand forecast scenario are adjusted each year to align with the 2024 APO demand forecast. By applying the adjusted peak demand savings from the DER Potential Study to the cost forecast from Figure 5, the cost savings potential from DERs can be estimated. There exists a range of DER potential, based on the “achievable” and the “economic” potential of the resources, which are defined as follows18:
• Achievable Potential: How much of that potential is likely to emerge over the next decade considering market barriers and dynamics?
• Economic Potential: How much of that DER potential is cost-effective considering the benefits they bring to the system and the costs of procuring them?
18 Ibid.
IESO 2024 APO
C-4 APO2024 DER Benefits, converted to $2023
The seasonal achievable potential and economic potential from the IESO’s DER Potential Study BAU+ scenario was adjusted each year based on the ratio between the demand forecast scenario (P2D or APO) and the demand forecast in the BAU+ scenario. This adjusted DER potential was then allocated to each LDC based on its share of total 2022 noncoincident demand.19 The DERs were assumed to reduce each LDC’s noncoincident demand and associated spending on capital additions. The analysis focused on potential DER benefit from avoided distribution investments. Other potential system benefits of DERs (capacity, avoided transmission, reduced losses, etc.) were not assessed.
The analysis of distribution investment in this report does not distinguish between costs related to incremental growth and costs related to renewing the existing system. In addition, the avoided distribution costs identified assume that all LDCs identify and make use of all cost-effective DER potential. Maximizing the potential of DERs as distribution nonwires alternatives would require not only the DER-enabling technologies discussed in this report (automation, distribution management systems, etc.), but also integration of DERs into the distribution investment planning and regulatory process.
19 Ontario’s Distributed Energy Resources (DER) Potential Study Appendix G – Detailed Results and Inputs, September 30, 2022: https://www.ieso.ca/-/ media/Files/IESO/Document-Library/engage/derps/derps-20220930-appendix-g-detailed-results-and-inputs.xlsx
Figure C-4: Gross Reduction in Gross Annual Capital Additions by Ontario LDCs with Fully
APPENDIX D. JURISDICTIONAL SCAN OF QUANTIFIED GRID MODERNIZATION COSTS AND BENEFITS
Table D-1 summarizes those grid modernization plans in Power Advisory’s jurisdictional scan that quantified total costs and/or benefits. Benefits were most frequently quantified for categories like avoided infrastructure costs, reduced operations and maintenance, and energy savings from volt-var optimization and/or conservation voltage reduction. Many utilities also used value of lost load or interruption cost estimation techniques to monetize the value of improved reliability.
Table D-1: Quantified Costs and Benefits of Grid Modernization Plans in the United States
TN EPB Chattanooga
180,000
OR Lincoln PUD 620,000
Received federal funding for AMI (USD $112 million). Benefits are reported annually, total benefits assume a 20-year period.
Received federal funding (USD $10 million) for AMI, MDMS, OMS, and various DA upgrades.
WA Snohomish PUD 183,524
Received federal funding, total project cost of USD $31.7 million not realized.
APPENDIX E. FOUNDATIONAL TECHNOLOGIES AND VALUE FOR CUSTOMERS AND THE GRID
Technology Enablers
Sensors and Monitoring Information Technology
• AMI
• Grid Sensors
• Advanced SCADA
• Modernized Protection Relays
• Advanced Communication Networks
• Edge and Cloud Computing
• GIS
• EMS
• DERMS
• Cybersecurity Solutions
• Artificial Intelligence
1. Sensors and Monitoring Devices
Smart Meters Smart meters continuously measure and record customer energy usage information.
Operational Technology
• Power Electronics
• Smart Inverters
• Remote-Controlled Switches
• Remote Terminal Units
• DMS
• ADMS
For the Grid:
• Generation
• Energy Storage
• EVs
Grid Sensors Grid sensors monitor various parameters, such as voltage, current, and temperature. They provide real-time data for grid health assessment and detection of faults or disruptions.
• Visibility to system conditions at the customer level.
• More granular customer consumption data.
• Efficient demand response and load balancing.
For Customers:
• Access to real-time consumption information and datasharing services (e.g. Green Button).
• Personalized notifications (e.g., high bill alerts, outage notifications).
• Potential for dynamic pricing and cost savings.
For the Grid:
• Enhanced situational awareness and condition monitoring.
• Improved fault detection and quicker response times.
• Optimal grid performance via informed decisions.
For Customers:
• Increased grid reliability and reduced outage durations.
• Minimized impact of power quality issues.
Technology Description
Delivered Advanced Supervisory Control and Data Acquisition (SCADA)
SCADA systems integrate data from various devices and provide monitoring and control capabilities for the entire power distribution network.
Modernized Protection Relays (MNPRs)
MNPRs have improved functionalities and minimize trips caused by reverse power flows and two-way grid assets, such as DG or energy storage.
For the Grid:
• Centralized monitoring and control of distribution assets.
• Enhanced grid visualization and situational awareness.
• Improved operational efficiency and response to events.
For Customers:
• More reliable and resilient power supply.
For the Grid:
• Enhanced protection against overload and faults.
• Quicker fault detection and selective tripping.
• Reduced downtime and equipment damage.
For Customers:
• Reduced risk of equipment damage due to electrical faults.
• Minimized downtime and improved service continuity.
2. IT/OT Convergence
Technology Description
Edge and Cloud Computing
This approach involves processing data closer to the source for real-time decision-making, which leverages centralized cloud servers for storage, computation, and analytics.
Geographic Information System (GIS)
Provides a modern mapping and connectivity environment of systems assets.
For the Grid:
• Reduced latency and enhanced responsiveness of critical grid functions.
• Real-time edge processing for optimal utilization of resources.
• Scalable data storage, processing, and analytics.
For Customers:
• Cloud-based infrastructure for uninterrupted customer services and communication.
For the Grid:
• Improved visualization of the system topology, configuration, and the relationships between different components.
• Visibility to plan and schedule field operations for maintenance and outage response.
• Better evaluation of the impact of new infrastructure, including spatial constraints and environmental considerations.
For Customers:
• Allows accurate communication of service locations, outage status, and response times.
Technology Description
Distributed Energy Resource Management Systems (DERMS)
Cybersecurity Solutions
A centralized platform or software solution designed to integrate, monitor, control, and optimize the operation of diverse DERs in realtime.
For the Grid:
• Enhanced situational awareness for decision-making and additional visibility into customer-sided resources.
• Optimized use and dispatch of grid resources.
• Effective voltage and power factor control.
• Efficient load balancing for improved grid stability and reliability.
• Supports integrating DERs into long-term grid planning.
For Customers:
• Enables the effective implementation of demand response programs.
Artificial Intelligence (AI)
These solutions include measures and technologies to protect the grid from cyber threats and ensure the integrity of data
AI involves the use of algorithms and machine learning techniques to analyze data, detect patterns, and make predictions.
For the Grid:
• Robust protection against cyber threats and attacks.
• Assurance of the integrity and confidentiality of grid data.
• Enhanced resilience to cyber risks and disruptions.
For Customers:
• Protection of personal data and privacy.
• Minimized risk of service disruptions due to cyber threats.
• Confidence in the security of electricity services.
For the Grid:
• Improved grid management via AI-driven insights and optimization.
• AI-driven load and DER forecasting, and predictive maintenance models
• Adaptive security for early anomaly and threat detection for proactive security measures.
For Customers:
• Faster and customized responses for customer applications.
3. Distributed Energy Resources
Technology Description
Distributed Generation (DG) Refers to the generation of electricity from small-scale power sources that provide localized energy production. These sources can include renewable energy as well as conventional generation technologies.
Values Delivered
For the Grid:
• DG systems can help offset peak demand on the grid, reducing the risk of overloads and blackouts.
• Grid operators can leverage DG systems for voltage support and regulation, enhancing grid reliability and stability.
For Customers:
• DG systems allow customers to reduce reliance on the grid and potentially lower energy bills.
• Increased energy independence and resilience during grid outages or disruptions.
• By generating clean energy on-site, customers can reduce their carbon footprint and contribute to environmental sustainability.
Energy Storage Systems (ESS) ESS are devices or technologies that store electrical energy for later use. At the distribution level, common types of energy storage systems include battery energy storage systems and thermal energy storage.
For the Grid:
• Provision of distribution-oriented ancillary services for congestion management and voltage regulation.
• Potential to smooth out the fluctuating behaviour of variable energy resources and improve the overall grid performance metrics and reliability.
For Customers:
• Optimized self-consumption and potential reduction in energy costs.
• Increased energy independence and resilience during grid outages or disruptions.
Technology Description
Electric Vehicles (EV)
Demand Response (DR) Technologies
EVs offer a cleaner and more sustainable alternative to conventional combustion engine vehicles, reducing greenhouse gas emissions during transport and dependence on fossil fuels.
Values
Delivered
For the Grid:
• EVs can serve as additional distributed energy storage resources through vehicle-to-grid capabilities.
• Smart charging of EVs can help smooth electricity demand patterns, particularly during peak hours.
For Customers:
• Potential long-term savings from reduced fuel costs and lower operating expenses.
• Convenience of home EV charging and maximization of cost savings via smart charging.
• Enhanced value proposition of EV ownership by participating in V2G or V2B programs to generate additional income.
DR technologies enable customers to adjust their electricity consumption in response to signals from the grid operator. They can include load curtailment, timeof-use pricing, automated control systems, and grid-interactive electric vehicle charging
For the Grid:
• Reduced stress on grid infrastructure and risk of equipment overload by incentivizing customer adjustment in DR programs.
• Avoided or deferred need for costly infrastructure upgrades and investments in additional generation capacity.
• Greater flexibility and control over electricity demand, enabling more efficient grid control, improved stability, and reliability.
For Customers:
• Reduced energy costs via incentive payments or tariff discounts offered by DR programs.
• Customer empowerment thanks to greater control over their energy consumption, allowing informed decisions based on price signals and incentives.
APPENDIX F. CASE STUDIES AND GRID MODERNIZATION INITIATIVES
Case Study 1: SP Energy Networks, Distribution System Operator Vision and Investment Planning
The DER penetration model was put into practice in the United Kingdom by SP Energy Networks (SPEN). SPEN is pursuing a DSO model. As part of its process, the utility convened a DSO Steering Group to develop a DSO Vision document20, which set out many of the points described above as well as setting out a high level investment sequencing plan for immediate, short-term, medium-term, and long-term activities SPEN would undertake to become a DSO.
The SPEN activity plan was grounded in the 3-stage LBNL model described above and represents a concrete example from which Ontario LDCs can develop their own unique and context-specific utility of a future vision.
Some of the key activities noted in the SPEN DSO Vision document were:
Key Short-term Activities (1-2 years):
• Rollout and extend the use of active network management (ANM) as a solution to manage network constraints. Introduction of ANM working group to accelerate into Business as Usual
• Network DSO classification to priority areas which are likely to benefit from a DSO model
• Expand network monitoring to future proof legacy assets
• Modelling and investigation into ancillary services market and identifying cost effective solutions
• Identifying policy changes required to facilitate a transition to DSO
Key Medium-term Activities (3-7 years):
• Trial DSO areas in SP Distribution network areas
• Development of network roadmap to DSO for all distribution areas
• Commercial arrangements in place with DER providers within DSO trial areas
• Policy changes implemented to facilitate DSO actions
Key Long-term Activities (8+ years):
• Full or modular implementation of DSO model
• Development of DSO development strategy for network areas with limited network service provisions
US. Departvment of Energy Grid Modernization Initiatives
Work funded by the U.S. Department of Energy’s Grid Modernization Initiative provides a clear depiction and delineation of the grid modernization investments required:
Utility-facing grid modernization initiatives include technologies and projects that help support more efficient and effective operation of distribution and transmission systems, including improved reliability and resilience. Customerfacing grid modernization initiatives include technologies that help support customer adoption of DERs and customer access to third-party service providers and markets.21 (See figure below)
20 SP Energy Networks, SPEN DSO Vision, October 2016: https://www.spenergynetworks.co.uk/userfiles/file/SPEN%20DSO%20Vision%20210116.pdf
21 Woolf, Tim, Havumaki, Ben, Bhandari, Divita, Whited, Melissa, and Schwartz, Lisa C, Benefit-Cost Analysis for Utility-Facing Grid Modernization Investments: Trends, Challenges, and Considerations, Lawrence Berkeley National Lab, United States, 2021, p. 3: https://emp.lbl.gov/publications/ benefit-cost-analysis-utility-facing
APPENDIX F. CASE STUDIES AND GRID MODERNIZATION INITIATIVES
Utilities include many different components in their grid modernization plans and combine them in different ways Utility-facing grid modernization initiatives include technologies and projects that help support more efficient and effective operation of distribution and transmission systems, including improved reliability and resilience Customer-facing grid modernization initiatives include technologies that help support customer adoption of distributed energy resources (DERs) and customer access to thirdparty service providers and markets
Figure 1 summarizes these two types of components.
1. Utility-Facing and Customer-Facing Grid Modernization Components 5
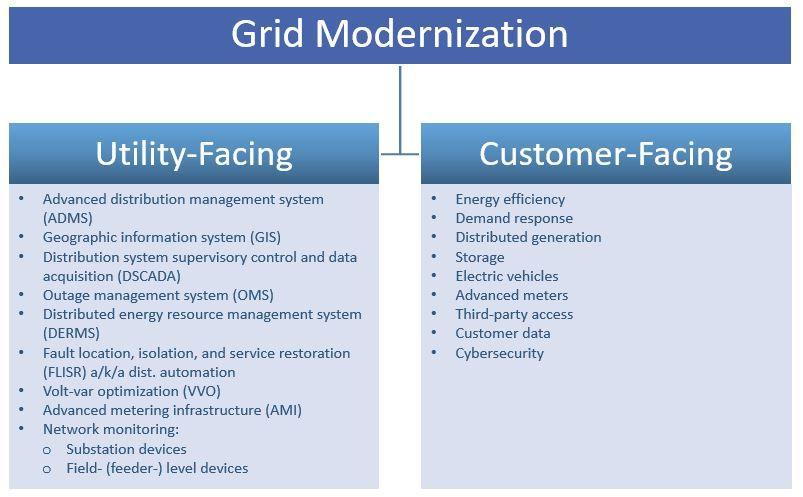
as , where technologies are mapped back to
This report focuses on conducting BCA for utility-facing projects. However, many of the principles and concepts described in this report are relevant to customer-facing grid modernization projects as well.
Key Costs and Benefits of Utility Grid Modernization
Table 1 and Table 2 provide examples of the types of costs and benefits associated with grid modernization plans. The list of costs and benefits comes from our review of utility-facing grid modernization plans, discussed in detail in Section 4.
5 Some grid modernization components may be either utility- or customer-facing, depending on the context. Several categories of DERs, for example, may be owned by the customer (behind the meter) or by the utility (in front of the meter).
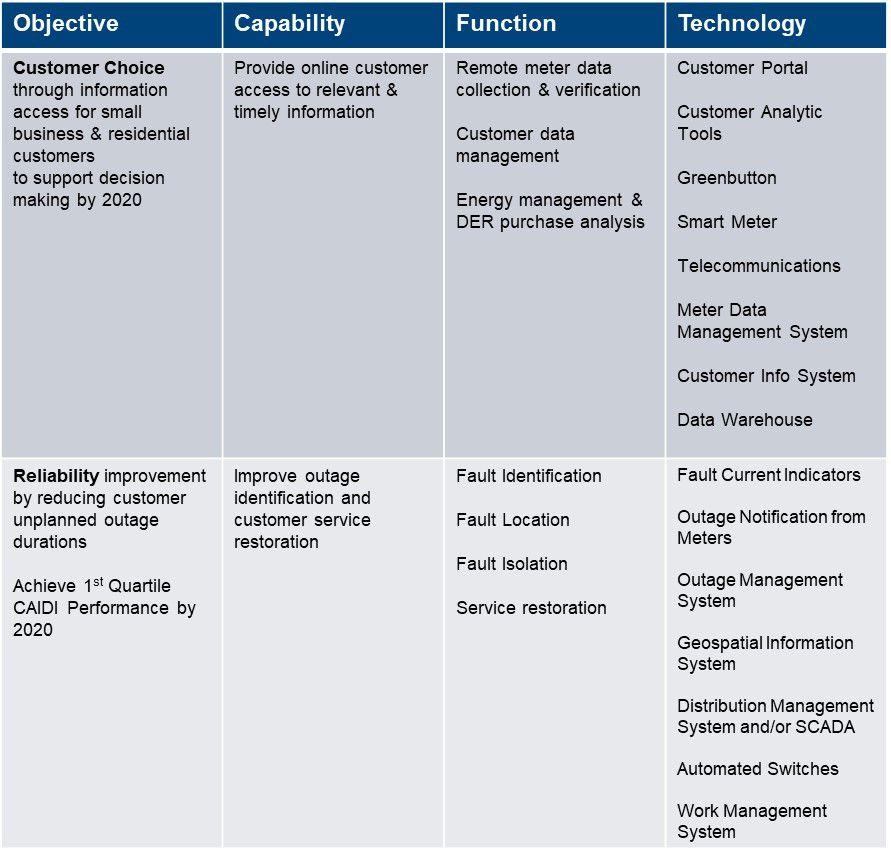
Source: DOE, Modern Distribution Grid, Volume 4: Strategy and Implementation Planning Guidebook, Version 1.0, June 2020, p. 53.

Figure 31 Examples of Technology Choices Mapped Back the DSPx Taxonomy
Figure
Other Case Studies:
Con Edison Hosting Capacity Web Application22
Con Edison has a hosting capacity web application which is a map visualization of New York’s amount of distributed energy resources (DER) that can be accommodated without adversely impacting power quality or reliability under existing control configurations and without requiring infrastructure upgrades. The map provides increased transparency as to where Con Edison has hosting capacity, potential DER locations especially where the cost of interconnection is low, and impacts of DERs on the distribution system. Con Edison continues to add new functionalities to the hosting capacity platform.
Florida Power & Light (FPL) EVolution Home 23
Florida Power & Light (FPL) is a U.S. electric utility company that is offering an “Evolution Home” EV program. Customers enrolled in this program can have unlimited night and weekend charging for one low monthly price and no upfront fees. As part of this program, FPL can permit, install and maintain a level 2 charger and the required 240-volt circuit in the eligible customer’s garage. Eligible customers can select one of two options: equipment-only installation ($31/month) and full installation ($38/month). To be eligible, the customer must be within the service utility area, own or lease an allelectric vehicle, own and live in a single-family home or townhome with an attached garage, and have access to Wi-Fi in the charging location.
Inclusive Utility Investment program24
In an Inclusive Utility Investment program, a utility provides up-front capital to pay for energy efficiency and electrification upgrades at a customer’s premises and recovers its costs through a fixed charge on the participating customer’s utility bill. This cost recovery charge is calculated based on an approved tariff that takes into account measure and installation costs, administrative costs, estimated savings, and cash flow for participating customers. This program is especially supportive of underserved sectors where it would be financially challenging to have programs targeting major end uses in the home such as water and space heating. Currently, 13 U.S. states have an Inclusive Utility Investment program/pilot activity.
Con Edison Rate Options for EV Owners Charging at Home25
Con Edison provides two types of rate options for EV Owners: standard residential rate and time-of-use rate. For the standard residential rate, the price you pay (per kilowatt-hour) for supply and delivery is based on the season and how much electricity you use (less than or greater than 250kWh). EV owners can also earn incentives for charging during times of the day with the SmartCharge New York program. The time-of-use rates are based on season and charging during peak time or off-peak time during the day. EV owners can benefit from the time-of-use rate by either switching to the time-ofuse rate for all home electric services for one year and get a potential credit based on the difference to the standard rate or by installing a separate residential meter solely for EV charging.
22 Con Edison, Con Edison Hosting Capacity Web Application: https://coned.maps.arcgis.com/apps/MapSeries/index. html?appid=edce09020bba4f999c06c462e5458ac7
23 Florida Power & Light, Evolution Home: https://www.fpl.com/electric-vehicles/evolution/home.html
24 Energy Star, Inclusive Utility Investment: https://www.energystar.gov/products/inclusive_utility_investment
25 Con Edison, Rate Options for EV Owners Charging at Home: https://www.coned.com/en/our-energy-future/electric-vehicles/electric-vehicledrivers/electric-vehicles-and-your-bill
Oxford Economics and Siemens AG Seeing behind the meter report: How electric utilities are adapting to the surge in distributed energy resources26
In the report, Siemens highlights key findings on how electric utilities in the US and Canada are managing the rapid adoption of behind-the-meter distributed energy resources. Oxford Economics and Siemens surveyed 100 decisionmakers from the industry during the fourth quarter of 2023 and conducted two in-depth interviews with Hawaiian Electric and Siemens. The key findings are unprecedented growth in the digitalization of customer experience, lack of detail needed to understand the location and behaviour of these resources for effective grid management, limited visibility causing a range of operational challenges, such as conducting interconnection analysis and planning infrastructure upgrades, lack of interest in programs by customers—but if successful utilities, could experience significant benefits, such as reduced costs, increased grid flexibility and resilience, and improved customer satisfaction.
Fleet advisory services offered by Consumers Energy and National Grid27
Consumers Energy’s PowerMIFleet™ Program assists eligible business customers in evaluating fleet vehicle performance. This one-time assessment delivers a customized electrification plan, including vehicle and charging station recommendations, cost savings estimates, and environmental benefits. Through site assessments, Consumers Energy estimate the incremental power demand at EV charging sites and plan for the impact of electrification. This program is open to businesses with at least one fleet vehicle under the utility’s “Retail Open Access” program.
National Grid’s MA Fleet Advisory Service Program supports customers in the municipal, school bus, transit, state, and federal fleet areas. ICF and National Grid’s ability support participating fleets throughout the full term of the program so fleets that begin participating early have access to ongoing technical, analytic, training, and market support services for a longer period of time as participants adopt EVs.
References from Section 2: New Services to Customers
Customer-facing websites, online tools, calculators, and hosting capacity maps
Enhanced reliability and resilience service offerings, such as microgrids/ islanding capabilities
Ontario
Alberta
Ontario
United States
https://www.londonhydro.com/shared-services
https://hydroottawa.com/en/accounts-services/accounts/electricity-rateselection/rate-plan-comparison-tool
https://www.fortisalberta.com/customer-service/get-connected/generation/ hosting-capacity-map
https://www.ieso.ca/Corporate-IESO/Media/News-Releases/2021/11/NewMicrogrid-Community-in-Pickering-Demonstrates-Future-of-ResidentialNeighbourhoods
http://www.communityenergypark.ca/
https://www.tampaelectric.com/solarsolutions/solaratteco/ microgridpilotprogram/
https://epb.com/newsroom/press-releases/city-of-chattanooga-and-epbpartner-to-enhance-energy-resilience/
26 Oxford Economics and Siemens AG, Seeing behind the meter report, 2024: https://assets.new.siemens.com/siemens/assets/api/uuid:92b96afd8953-4689-9f4d-8ef42c311e95/Seeing-behind-the-meter-report.pdf
27 Watson, Chris, and Stacy Noblet. Key Considerations for Developing a Utility Fleet Electrification Advisory Program, ICF, March 16, 2022: www.icf.com/insights/energy/utility-fleet-electrification-advisory-program
Green-choice programs or green tariffs
EV make-ready programs
Nova Scotia https://novascotiagcp.com
Georgia
Michigan
EV fleet advisory services
EV rates (i.e., delivery rates) are offered in multiple jurisdictions including
https://www.georgiapower.com/business/products-programs/businesssolutions/commercial-solar-solutions/clean-and-renewable-energysubscription.html
https://www.michigan.gov/mpsc/commission/workgroups/2016-energylegislation/voluntary-green-pricing
Colorado https://co.my.xcelenergy.com/s/environment/clean-energy-plan
Nevada https://www.nvenergy.com/cleanenergy/ngr-open-season
Massachusetts https://www.eversource.com/content/docs/default-source/save-moneyenergy/electric-vehicle-make-ready-application.pdf
New York https://jointutilitiesofny.org/ev/make-ready
Illinois https://www.consumersenergy.com/business/products-and-services/ powermifleet
Massachusetts https://www.consumersenergy.com/business/products-and-services/ powermifleet
Quebec https://www.hydroquebec.com/business/customer-space/rates/rate-brexperimental-rate-fast-charge-stations.html
British Columbia https://app.bchydro.com/accounts-billing/rates-energy-use/electricity-rates/ fleet-electrification-rates.html
Massachusetts https://www.mass.gov/info-details/dpus-electric-vehicle-chargingresources#5.-demand-charge-alternative-rates-
New York https://dps.ny.gov/system/files/documents/2023/01/pr23008.pdf
California
New York
Managed EV charging programs
Connecticut
Flexible (curtailable) connection arrangements
United Kingdom
https://www.cpuc.ca.gov/industries-and-topics/electrical-energy/infrastructure/ transportation-electrification/electricity-rates-and-cost-of-fueling
https://www.coned.com/en/save-money/rebates-incentives-tax-credits/ rebates-incentives-tax-credits-for-residential-customers/electric-vehiclerewards
https://www.coned.com/en/our-energy-future/electric-vehicles/commercialelectric-vehicle-charging-station-rewards
https://www.uinet.com/documents/1678076/1704262/UI+-+UEVC002+-+EV +Program+Participant+Guide+12-2023.pdf/2360d292-2da0-0e67-a31afde74cd60824?t=1702590958394
https://www.ukpowernetworks.co.uk/new-electricity-connections/distributedenergy-resources-der-generation/flexible-connections
https://www.ssen.co.uk/our-services/flexible-solutions/flexible-connections/
European Union https://www.sciencedirect.com/science/article/abs/pii/S0301421522005614
https://saveonenergy.ca/For-Your-Home/Peak-Perks
Load control programs and interruptible rates
Ontario
Quebec
https://www.ieso.ca/Get-Involved/Innovation/Interruptible-Rate-Pilot/ Overview
https://www.hydroquebec.com/business/customer-space/rates/interruptibleelectricity-options-medium-power-customers.html