

Case Studies
Timeline of Research
Past and current projects contextualise the material research. Biological sandstone has not been deeply explored for its potential as a building material. These which have achieved related evidence about the architectural applicability can establish what has been tested and discovered, and allow us to determine how this research can be built upon. Case studies are further analysed for their relation to our goals, and shortcomings are identified as areas for improvement. These studies are compared in terms of context, stage of development, techniques employed, and scale. The work of Ginger Dosier proves biocalcified sandstone’s qualification as a load bearing material, supporting and initiating our investigation into its other architectural qualities.
microbial morphologies 32 BIOCEMENTATION WHIFFIN, VICTORIA DUNE LARSSON, MAGNUS SELF-HEALING CONCRETE JONKERS, HENK 2004 2005 2006 2007 2008 ANY TESTING PELLET STORAGE ANY LAB EXPERIMENT PHD THESIS MICROBIAL PRECIPITATION SCIENTIFIC PAPER SAHARA DESERT VISION IBJECTION PILING 6000 KM LONG INHABITABLE WALL CONTEXT/SITE STAGE TECHNIQUES SCALE
domain 33 MEMORABILIA BOLD-DESIGN MICROBIAL MANUFACTURE TRIMBLE, PETER BIOBRICK, bioMASON DOSIER, GINGER 2009 2010 2011 2012 2013 2014 ANY START UP MICP - LAYERS MASONRY UNIT BEACH SAND PRODUCT PROPOSAL MOULD TOY DOMESTIC PROTOTYPE MOULD FURNITURE
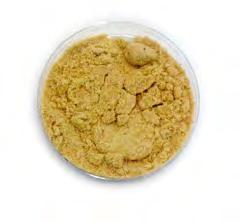
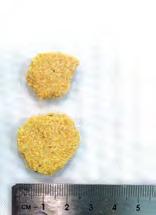
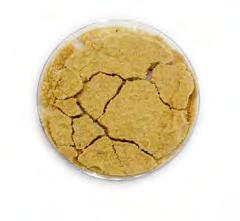
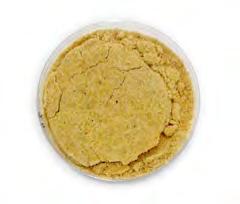
Laboratory Tests
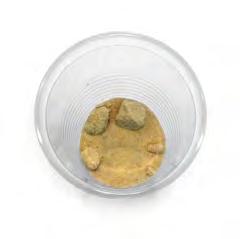
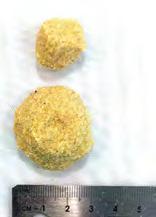
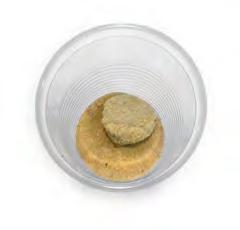
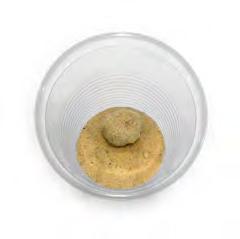
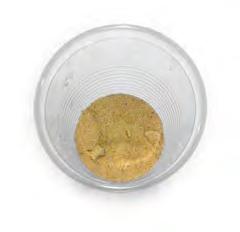
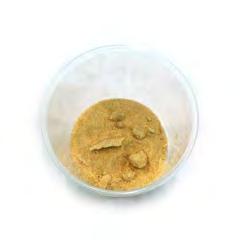
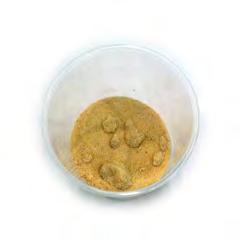
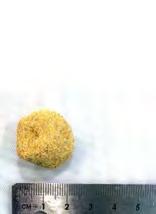
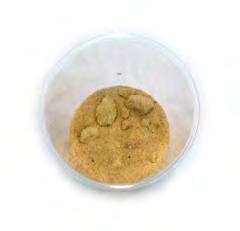
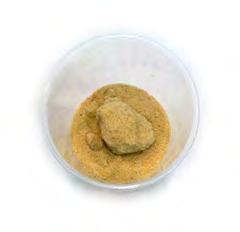
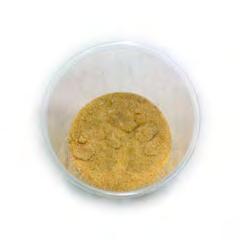
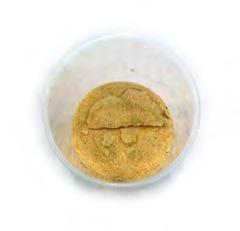
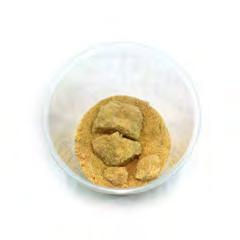
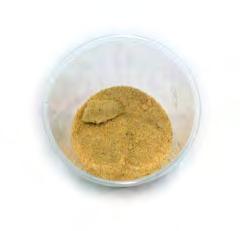
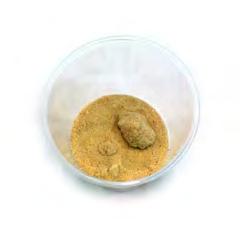
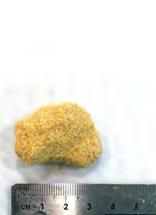
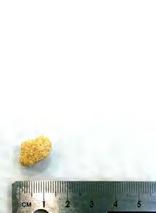
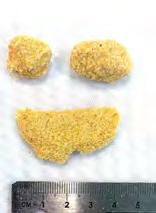
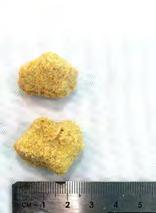
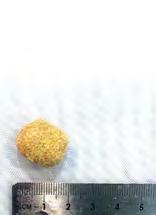
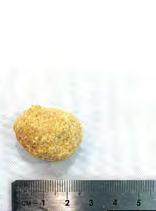
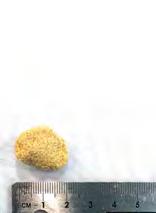
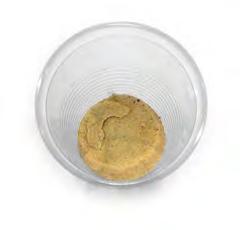
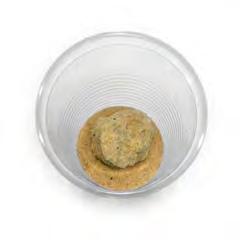
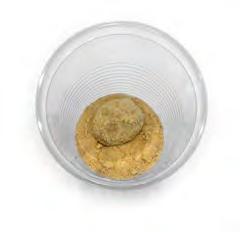
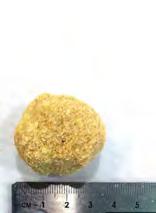
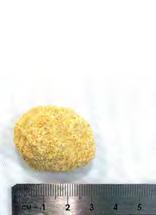
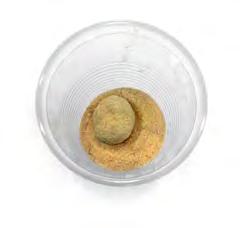
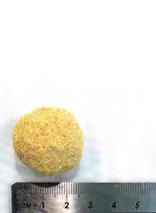
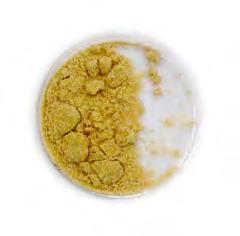
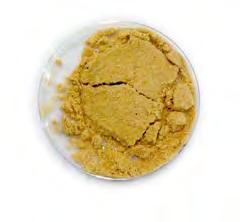
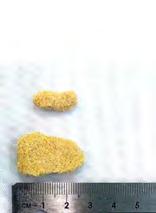
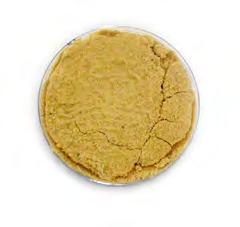
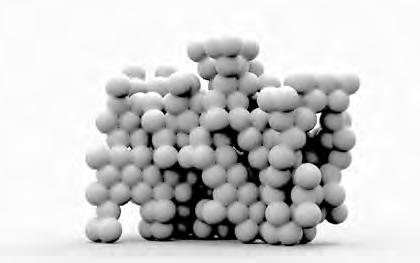
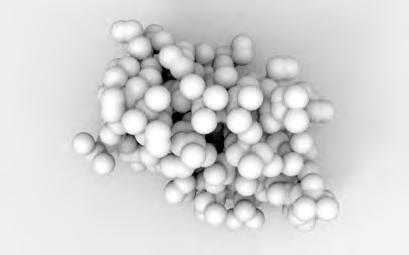
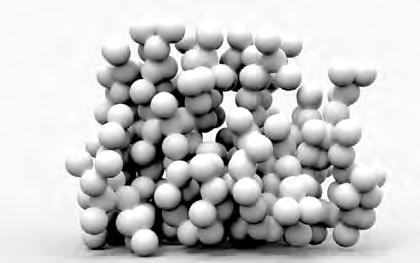
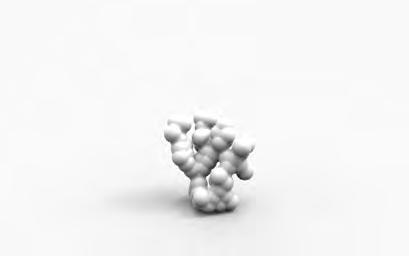
Images: Results of air supply experimentation
Constants: Bacteria Sand


Variables: Cementation medium Flush volume No. of flushes
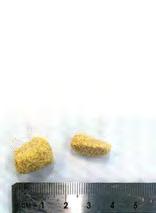
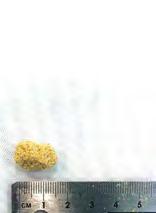
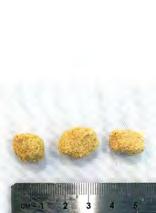
Sample set A: Horizontal line injection
microbial morphologies
Sample set B: Vertical line injection
62
S1 S2 S3
S4
S5
S6
S7
S8
S9 S10
S11
S12
S13
S14
S15


research development 63
Sample set C: Exposed surface
S16
S17
S18
S19
S20
S21
S22
S23
S24
S25
S26
S27
S28
S29
S30
Laboratory Tests
Graph 3a: Longest span
Graph 3b: Total weight biocalcified
Graph 3c: Strength rating
64
microbial morphologies
Fittest Samples: S14 S17 Fittest Samples: S7 S9 S14 S17 S18 Fittest Samples: S14 S17 S18 S20 0 5 10 15 20 25 S30S29S28S27S26S25S24S23S22S21 S20S19S18 S17 S14S16S15 S13S12S11 S10S9S8S7S6S5S4S3S2S1 Weight (g) 0 1 2 3 4 5 S30S29S28S27S26S25S24S23S22S21 S20S19 S18S17 S14S16S15 S10S13S12S11 S9 S8 S7 S6S5S4S3S2S1 Span (cm) Rating 0 1 2 3 4 5 S30S29S28S27S26S25S24S23S22S21 S20 S19 S18S17 S14S16S15 S13S12S11 S10S9S8S7S6S5S4S3S2S1
Fittest Samples: S7 S9 S14 S17 S18 S14 S17 S14 S17 S18 S20
Cementation
Analysis of Results
From the lack of biocalcification in the third set (samples 21-30), it can be inferred that exposure to air during application may not be preferable to occur across the entire surface. In this way, perhaps it is not ideal to propose the entire construction system ex-situ or build multi level buildings outside of the sand. The biocalcified rocks found within samples from set 1 (sample 1-10) and set 2 (sample 11-20) were both excavated from within the sand.
Only the top layer had been exposed, and rarely biocalcified on any of its surface area in these experiments.
By identifying the fittest individuals from each measured property - longest span, total biocalcified weight, and strength rating - we can evaluate the concentrations of bacteria and cementation medium whcih were initially injected, in order to determine optimal ratios for further experimentation. It is found that Samples 14 and 17 were among the most fit inidivudals in each category, indicating that concentration of cementation medium to bacteria should be a ratio of at least 2:1,
with 2 flushes for this concentration. These are scaled up for 1:1 construction.
Most importantly, the lack of need for air supply does not eliminate in situ construction as a viable application for the material system. Further physical explorations of scale and technique with materials that have similar properties, and digital experiments, will continue to determine other factors that render in situ preferable or not.
research development 65 No. of Flushes 0 5 10 15 20 25 30 35 Per Flush Cementation Medium Bacteria
S14S16S15 S13S12S11 S10S9S8S7S6S5S4S3S2S1 Volume (mL)
S30S29S28S27S26S25S24S23S22S21 S20S19S18 S17
Graph 3d: Input concentrations for evaluation of fittest samples
Physical Experiments
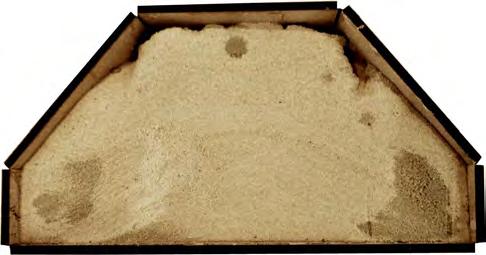
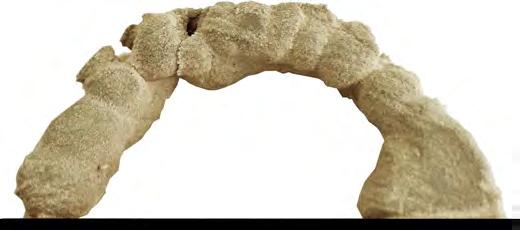
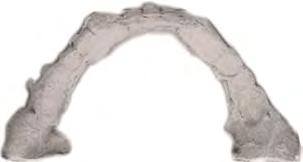
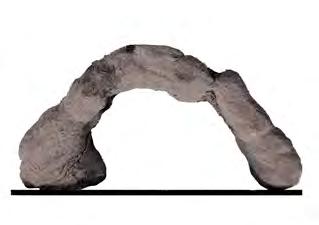
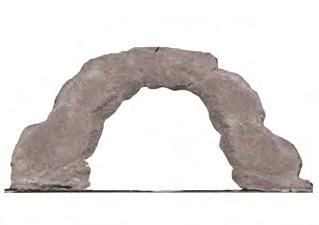
Experiment 1.4: Localised injections within a rough formwork
As exploration involves the possibility of constructing directly into pre-existing dunes or sand piles. The angle of repose of sand would necessitate that for a building 3 storeys high, the sand pile would have to be 35m wide in order to achieve such an effect (Fig. 3b). An alternate technique wherein a rough formwork, more or less the form of the desired structure can be filled with sand to test this procedure. Bacteria and the calcifying medium are injected into the sand, calibrated exactly to the actual form that is to be created. On removal of the formwork, uncalcified sand can be blown away to be reused. The form is that of the calcified sand structure.
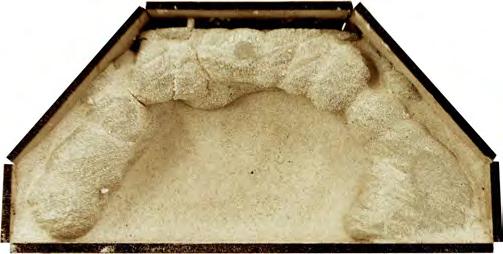
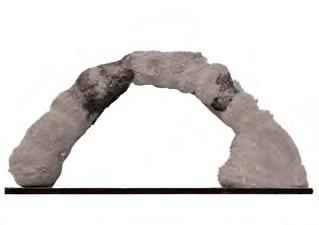
This is similar to the method used in Trimble’s furniture prototype but at a much larger scale. While eliminating the labour of a precisely formed mould, a disadvantage of a rough formwork is still the manufacture of a mould, which could be eliminated by exploring a similar approach in situ (Fig. 3b).
Thinner structures are achieved through the use of more glue. This is the basis for our argument that the injection technique works well for the material system with the bacteria, since the strength of these can be increased through multiple flushes, as shown on the opposite page.
microbial morphologies 68
Localised Injection Formwork
Fig. 3a: localised injection formwork
Image 3i: formwork of experiment through excavation
Physical Experiments
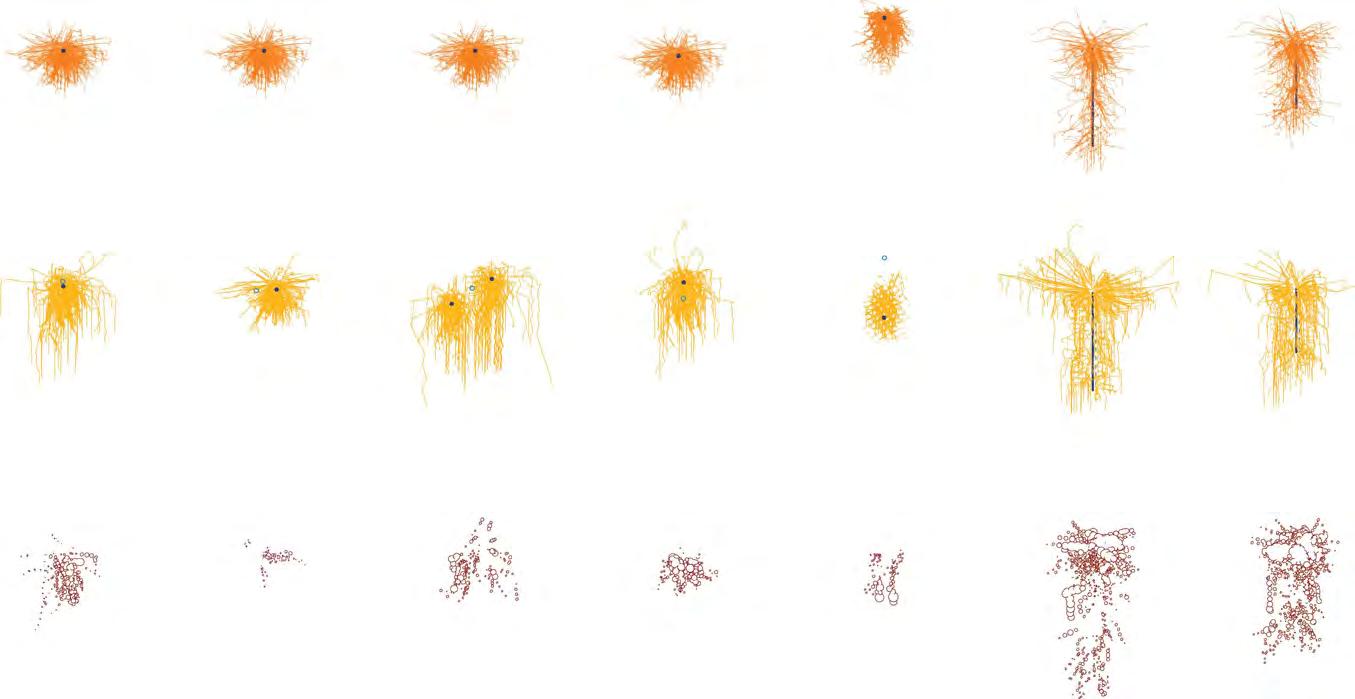
Experiment 2: injection patterns by sand type
To measure the behaviour of fluid in the sand matrix, coloured water is injected into different kinds of sand. The data in this experiment is gathered with water’s specific viscosity, and results are calibrated to the fluid dynamic properties of the bacterial fluid to predict behaviour. Since this material would require two fluids to interact within sand (bacterial fluid and cementation medium), a physical test is performed using two different coloured liquids to measure the area of overlap, injecting each in the same spot (Fig. 3c). This is done
for three different sand types: soft sand, silica sand, and sharp sand. It is found that when the sand grains are smaller, as are the 0.3mm soft sand grains in Fig. 3c, the capillary forces have more influence than inflow pressure and gravity, causing spread to be more horizontal. With larger grains, as in the 1.5mm sharp sand, the aggregate is more porous, generating more downward spread. This overlap region is where biocalcification would occur, making it crucial in determining whether a particular sand type is viable for this system (Graph 3g). Highly homogenous volumes in the sand of fresh injection and displaced fluid would not biocalcify.
microbial morphologies 70
7.61 mL 0.72 mL 7.67 mL 6.78 mL 7.96 mL 1.26 mL 10.41 mL 2.27 mL 3.32 mL displaced biocalcified new injection 0.3 mm SOFT SAND 0.8 mm SILICA SAND 1.5 mm SHARP SAND 16 mL volume Ratio of biocalcification to displacement for first injection
Optimal/medium porosity Multidirectional spread Degree of overlap expt 2: injection patterns in different sand types 0.3 mm SOFT SAND 0.8 mm SILICA SAND 1.5 mm SHARP SAND 1 mL 4 mL Spread directionality 7 mL 10 mL (2 mL into 8 mL) 16 mL (8 mL into 8 mL) 13 mL (5 mL into 8 mL)
Comparison of sand types
Fig. 3c: digital traces from photographs of fluid spread for different sand types
Graph 3g: ratio of biocalcification to displacement for first injection
Comparison of sand types:
Digital Experiments
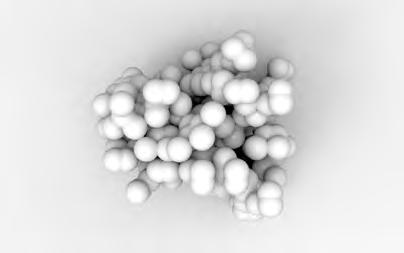
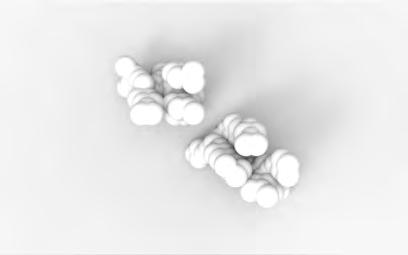
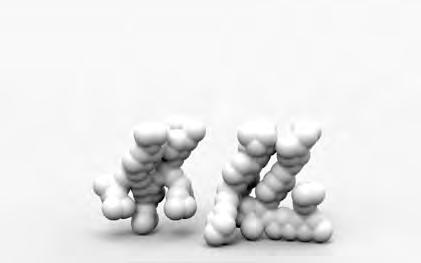
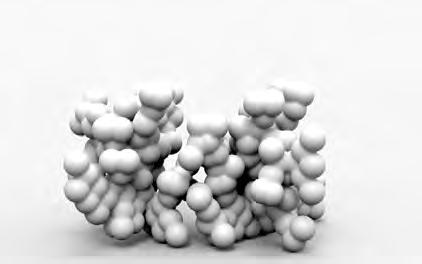
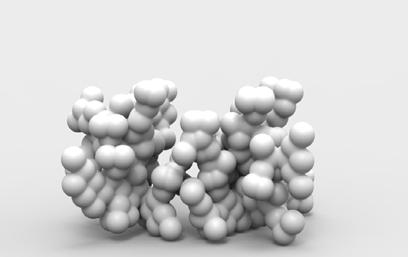
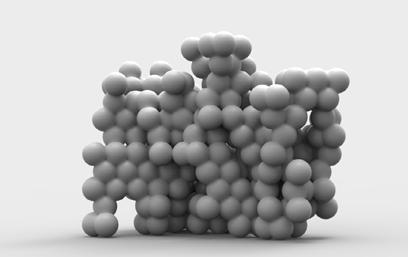
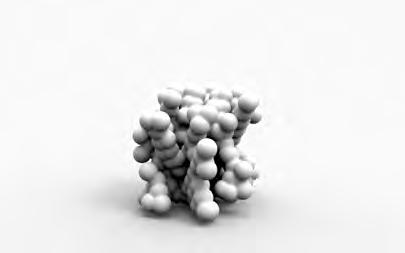
Morphological Possibilities: Continuous Injection
From the physical and digital experiments conducted, it is observed that single point injections result in more of an uneven surface because of pressure differences. When single points have multiple dispersion outlets, a much more even surface is achieved. By experimenting with a mobile inlet system, more control over the curvature and variation in thickness of the structure can be achieved.
In single point dispersion, high local pressure causes uneven surfaces. Single inlet with multiple dispersion points achieves greater uniformity in two directions, and mobile dispersal maximises smoothness and control in all directions of the three methods. Specifically, multiple point inlets creates more uneven dispersion and destabilises the sand within because of its high local pressure. Mobile dispersal techniques enable the relieving of pressure such that a well controlled degree of curvature and more even surfaces can be achieved, controlling differentiation of pressure and therefore volume of dispersion over the surface.
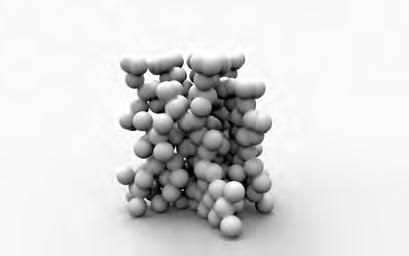
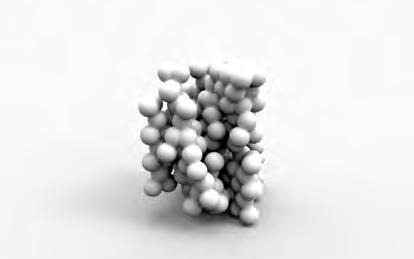
By this method, a rough formwork for the desired built morphology (Fig. 3e) has mobile inlets entering from above and below (Fig. 3f). As the scale increases, multiple formworks are grouped to create a global formwork (Fig. 3g).
Through a mobile inlet system for dispersing the bacterial fluid and the calcifying fluid into sand, mobile inlets would move simultaneously over and under through the formwork at different depths according to the desired surface curvatures. Scaling up, the assembly of abstract formwork is put together in accordance with the actual form required (Fig. 3h). Each component of the formwork would have its own mobile inlets.
The rough formwork would require a system to enable the movement of the mobile inlet over it. Such complexity is due to the need for upflushing the cementation medium. The actual behaviour of the bacterial and cementation fluid is herein tested to understand the actual importance of the upflush. This complexity of a formwork and mobile inlet system is a large limitation and thus negative aspect of ex situ construction, however, these methods will inform translation to an in-situ, formwork-free scheme.
microbial morphologies 72
Subdivided into sections, each assigned mobile inlets
Scaled up assembly of formworks
Inlet
Rough formwork filled with sand Desired morphology
path Mobile Inlets
Fig. 3e:
Fig. 3f:
Fig. 3g:
Fig. 3h:
research development 69 Multiple injections per inlet Angular injections Vertical injections: varied volume Vertical injections: 15 mL per inlet 100 0 100 200 200300 100 0 100 200 200300 100 0 100 200 200300 100 0 100 200 200300 Localised injections within a formwork Injection pattern: Physical test results: Projection of form: Analysis: Thickness accuracy: Location accuracy: 100 0 100 200 200300 35 50 50 75 100 0 100 200 200300 35 35 50 60 Surface smoothness: 100 0 100 200 200300 35 50 50 80 100 0 100 200 200300 35 50 65 35o 9m 10m 35m 35 o
Fig. 3b: technique as developed within a dune
Scale and Technique Conclusion
Ex-situ
Construction moduleBuilding component
Scales of Application
In-situ
SuperstructureStand-alone structureContinuous structures spanning multiple dunes
Mould flushingLocalised injection : Rough formwork
Tube flushing
Injection grouting
Semi-mobile Static
Techniques of Construction
3-D printing
Mobile
Scalar potential of application
morphologies 82
microbial
research development 77 % bacteria Degree of Calcification Uniformity of distribution: Distance between calcified interfaces mm mm mm Horizontal Spread Vertical Spread 0 20 40 60 80 0 100 200 0 100 200 300 0 2 4 6 8 Technique Single point Adjacent site Adjacent site (duplicate) Up-flush Translational Rotational Translation Vertical Scatter Bacterial Fluid Flow Pattern Comparison of Results Cementation Medium Flow Pattern Cementation Medium Flow Pattern Graph 3h Graph 3i Graph 3j Graph 3k
Table 3a: Extent of Calcification by Technique
Site of Intervention
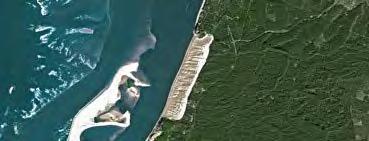
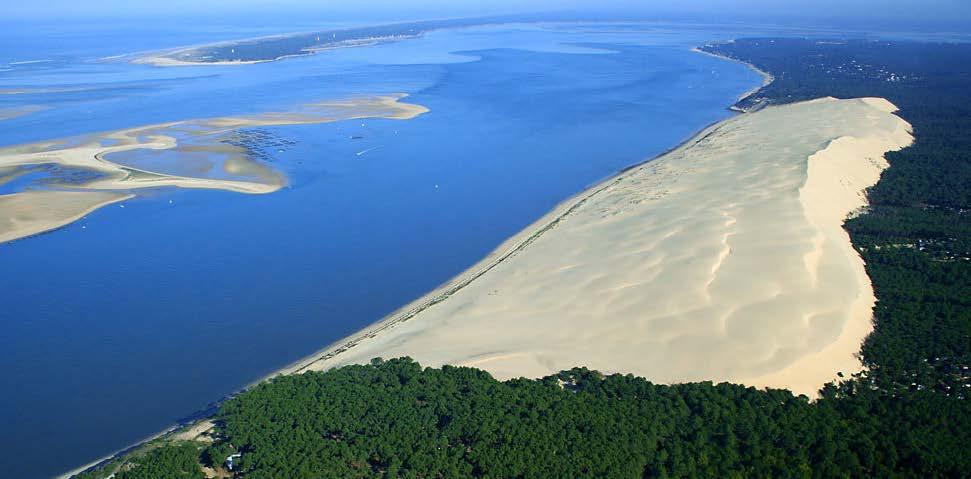
The Dune of Pilat (Dune du Pyla) (Images 4b & 4c) in the Arcachon Bay on the west coast of France is Europe’s highest sand dune (Bogs, 2014). This is an applicable site of intervention as the dune is encroaching on the adjacent forest. This barchan dune has a convex windward slope, and the strategy would need to follow its specific seasonal patterns (Figs. 4a, 4b, and 4c). This site would benefit from Dune stabilisation as its 2.1 km long dune is threatening the forest. Site conditions throughout the year indicate time scale for the dune to predict what will influence the structure, and when and where best to construct.
The dune has gained a great deal of recognition for its unique architectural qualities, but its rapid threat of encroachment outweighs its attractiveness. These will find a compromise within the design strategy that follows.
Variation in the specific action of the erosion elements will lead to variation in structural form. Erosional elements are dual in nature. All spaces which are meant to be eroded by the sea will have inlets facing the tide, and spaces which are meant to be eroded by the wind will face multiple directions. This design will be developed over the course of a morphological exploration based on parametrising injection techniques, followed by strategic application to the Dune of Pilat.
Graph 4a: Tide Patterns in Arcachon, 2014
Tidal Patterns in Arcachon, 2014
Raw data acquired from: tides4fishing.com
microbial morphologies 90
Image 4b: Dune of Pilat as seen from SPOT satellite, 2007
-1 0 1 2 3 4 5 Jun May Apr Mar Feb Jan high and low tides (m)
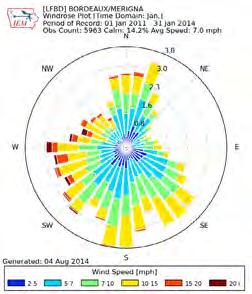
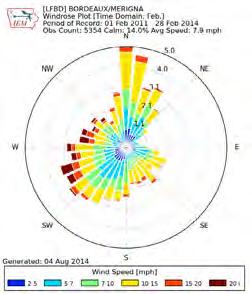
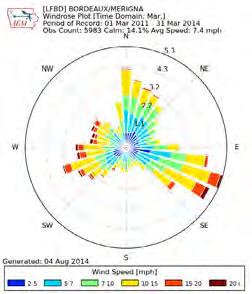
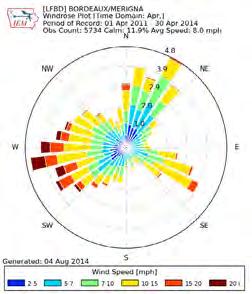
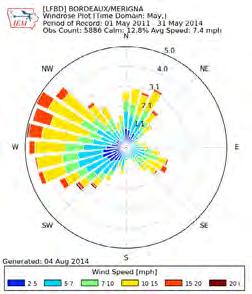
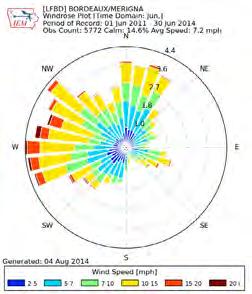
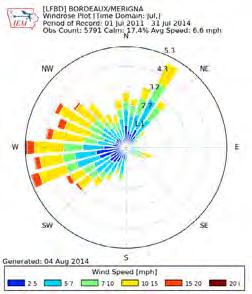
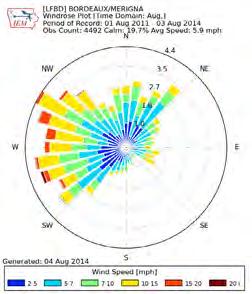
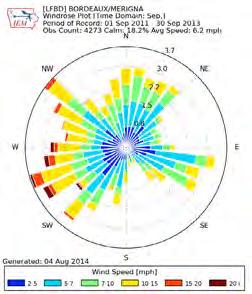
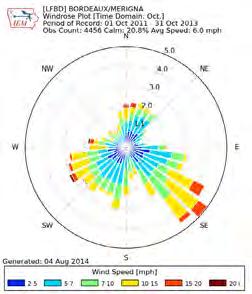
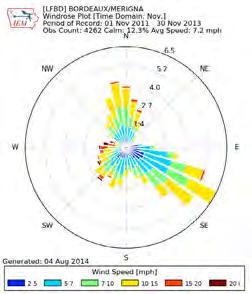
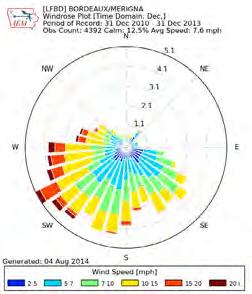
Wind Patterns in Arcachon, 2011-2014 averages
Fig. 4c: Wind Patterns in Arcachon, 2011-2014 averages. Wind roses acquired from: http://mesonet.agron.iastate.edu/
Environmental Ambition
design development 91 Dec Nov Oct Sep Aug July
0 3 6 9 Dec Nov Oct Sep Aug MayJulJun Apr Mar Feb Jan Speed (mph)
Image 4c: Aerial view, Dune of Pilat. Photograph from: www.travigators.com
Average wind speed 2011-2014
Graph 4b: Average wind speed in Arcachon, 2011-2014. Data from: http://mesonet.agron.iastate.edu/
Morphological Generation
Test 4: Varying the overlap amount
microbial morphologies 102
Maximum width (m) 1.474.70 2.02.75 0.3 5.05 Maximum height (m) Volume of structure (cu. m) 1-25 1-50 1-100 1-150 2-25 2-50 2-150 2-100
termine the degree of enclosure or openness of emergent spaces. Due to the possibility of influence by a large number of factors, tests are conducted to understand the contribution of each towards the generation of spaces and forms.
For the purpose of this series of experiments, a created space is considered to be any void or volume whose boundary is partially or wholly defined on two or more sides by the generated structure. A form is considered to be the morphology of the material composition itself.
Overlap is needed only in either horizontal or vertical direction, and more flexibility is achieved by having vertical overlap between horizontal layers (Seq. 4e). A diagonal arrangement of holes at a radial distance is more efficient for construction and in terms of material usage. Specific gap increments will be different for each case. These results are simply used as a base case to start the experiment. The greater the overlap, the shorter and narrower the structure, and vice versa. Very definite branching patterns emerge among larger overlap configurations, which yields a more spread out form. This information informs structural requirements.
The structure can be made tighter and compact or loose and spread apart by changing the vicinity factor of the material formation, the amount of injected material adjacent to other material locations. Variations have branches of diverse thicknesses when the factor is low and form clusters when the factor is large.
design development 97
continuity in plan overlap from height continuity in elevation overlap from width continuity in plan overlap from height continuity in elevation overlap from width
Seq. 4e: Variation along a Horizontal Plane
Spatial Formation
Strategy for removal of residual sand
Section
Erosion by water
Erosion with wind and water
Erosion by wind (50 m) (100 m) (400 m)
Plan
Old dune profile
Reshaped profile of stabilised dune
Spatial boundaries
Erosional force of water
Erosional force of winds
Erosion process
Seq. 4f: Zones within structure
By water By wind
Zones within structure
primary - water eroded spaces
secondary - water and wind eroded spaces
tertiary - wind eroded spaces
microbial
106
morphologies
the sea
the sea
the sea
the sea
Reach of
Reach of
Reach of
Reach of
Simulation Data Implementation
Lastly, the simulation determines that in connecting the threshold spaces, a 6m width is necessary in the threshold, and angles should vary between 60 and 90º. All of these and the previous parameters will be randomised in a generative algorithm, as well as the occurence of angled spaces throughout the dune, which will not emerge everywhere. The GA will be selectively analysed post process.
As secondary spaces are meant to be both wind and water eroded, it is necessary that sufficient force penetrate into the space, and that beyond this, throughout the network’s further spaces, the tide will have no effect as these should be strictly wind eroded (Seq. 4g). These angles therefore allow water erosion to have its effect in removing residual sand after construction, as well as shaping the space the way erosional forces in nature do, without damaging deep portions of the spatial network.
Erosional removal of residual sand after hardening
Internal transport of sand cyclically creates spaces
design development 113
Seq. 4g: behaviour of forces through network, as informed by CFD
Spatial Formation
Application of Morphology to Plan
A network of spaces are arranged in plan, controlled by parameters based on the CFD analysis of sedimentation and erosion. These spaces have been developed along the 2.1 km dune using a generative algorithm.
Parameters Controlling Tunnel
Conditions of 4 different inlet widths are dispersed among these 5% divisions, The variations in spatial condition are distributed about these 20 segments. Each of 4 inlet widths represents a unique condition. Multiple parameters of connecting tunnels are varied.
microbial morphologies 114
12m 15% 9m 40% 6m 5% 3m 40%
variation
between 60º and 90º perpendicular to fluid inlet vector
60º
Location of tunnel along spatial depth Angle of tunnel along fluid flow vector
variation along central lateral 20% 9m 9m 9m 12m variation among 3 locations tunnel width = 0.75 x inlet width 12m 15% 9m 40% 6m 5% 3m 40% 12m 15% 9m 40% 6m 5% 3m 40%
Location of tunnel intersection
Fig. 4f: Location of tunnel along spatial depth and possible variation along plan
Location of tunnel along spatial depth
variation among 3 locations
Angle of tunnel along fluid flow vector
tunnel width = 0.75 x inlet width
Angle of tunnel along fluid flow vector
variation between 60º and 90º perpendicular to fluid inlet vector
Angle of tunnel along fluid flow vector
variation between 60º and 90º perpendicular to fluid inlet vector
Location of tunnel intersection
tunnel intersection
Location of tunnel intersection
variation along central lateral 20%
Location of tunnel intersection
variation along central lateral 20%
design development 115
60º
9m 9m 12m
9m
60º
Fig. 4g: Angle of tunnel along fluid flow vector and possible variation along plan
Fig. 4g: Location of
Spatial Formation
Generation of bounding surface for spatial volume
Zone 1: Erosion by the sea
Bottom open volume
Zone 3: Erosion by wind
Top open volume
Creation of spatial bounding volume from planar layout
The spatial volumes created work in tandem with the planar layout in utilizing the erosional potentials of the site. The two erosional forces considered have different behaviours and ranges of influence, and the spaces are designed taking into account these differences.
The sea, on the one hand, has a dual-action of moving towards and away from the coast, both in the form of waves and tides. This restricted direction of direct erosion by the sea requires that the majority of the openings face seawards. Having the opening further away from the sea smaller than the one closer to it increases the Venturi potential of the sea water as it moves through the space and further enhances the action of the sea. Therefore the spatial form required is one than
Oriented for dual action of the sea
Oriented for varying wind directionality
spans between the two openings while performing as a compressional structure.
On the other hand, wind is poly-directional in nature, varying both diurnally and seasonally. To maximise the impact of the wind in eroding the excess sand, openings need to be oriented towards these various directions. The space is bounded by two openings, a lower one that forms the connection to the neighbouring space and the extraction point for sand that is being eroded away, and a smaller funnel-like opening above that captures and directs wind movement within the space. The orientation of the former is governed by the planar direction of erosion, whereas that of the latter is informed purely by the winds. Fig. 4h shows how this variation of directionality affects the forms of the bounding volumes created.
microbial morphologies 116
Fig. 4h: Comparison of wind and water eroded 3D spaces, as single and multiple spaces
Comparison of wind and water eroded 3D spaces, as single and multiple spaces
Generation of bounding surface for spatial volume: Parameters governing Zone 3 spaces (Erosion by wind)
Planar arrangement over inclined dune surface
Spatial configuration with wind oriented openings
Distribution of wind vectors over generated plan
Connecting between the wind receptor spaces
Sample wind flow patterns within the generated space
design development 119
Fig. 4j:
Three dimensional morphologies are evolved from the spatial formation in plan through a process involving a series of optimisation procedures, projection techniques and running of a form generation algorithm. Each step sequentially refines the various parameters needed to run the final form generation procedure. This strategy is both top-down, in its development of specific morphology from the global requirements for space and provision for erosional factors, as well as bottom-up in having been designed to cater to the material’s specific generative parameters.
The spatial form extracted from the planar arrangement is therefore not the final geometry of the resulting system. Instead, it provides the spatial constraint for the injection matrix, such that all the injection locations occur between the soffit of this surface and the top surface of the dune. The structural procedures on this derived bounding surface are carried out to establish the pattern of overlap between injected material on and above the surface at each specific location. The influence of the bounding surface also extends to the morphology of the injected material itself through its relationship with the injection patterning, as is detailed
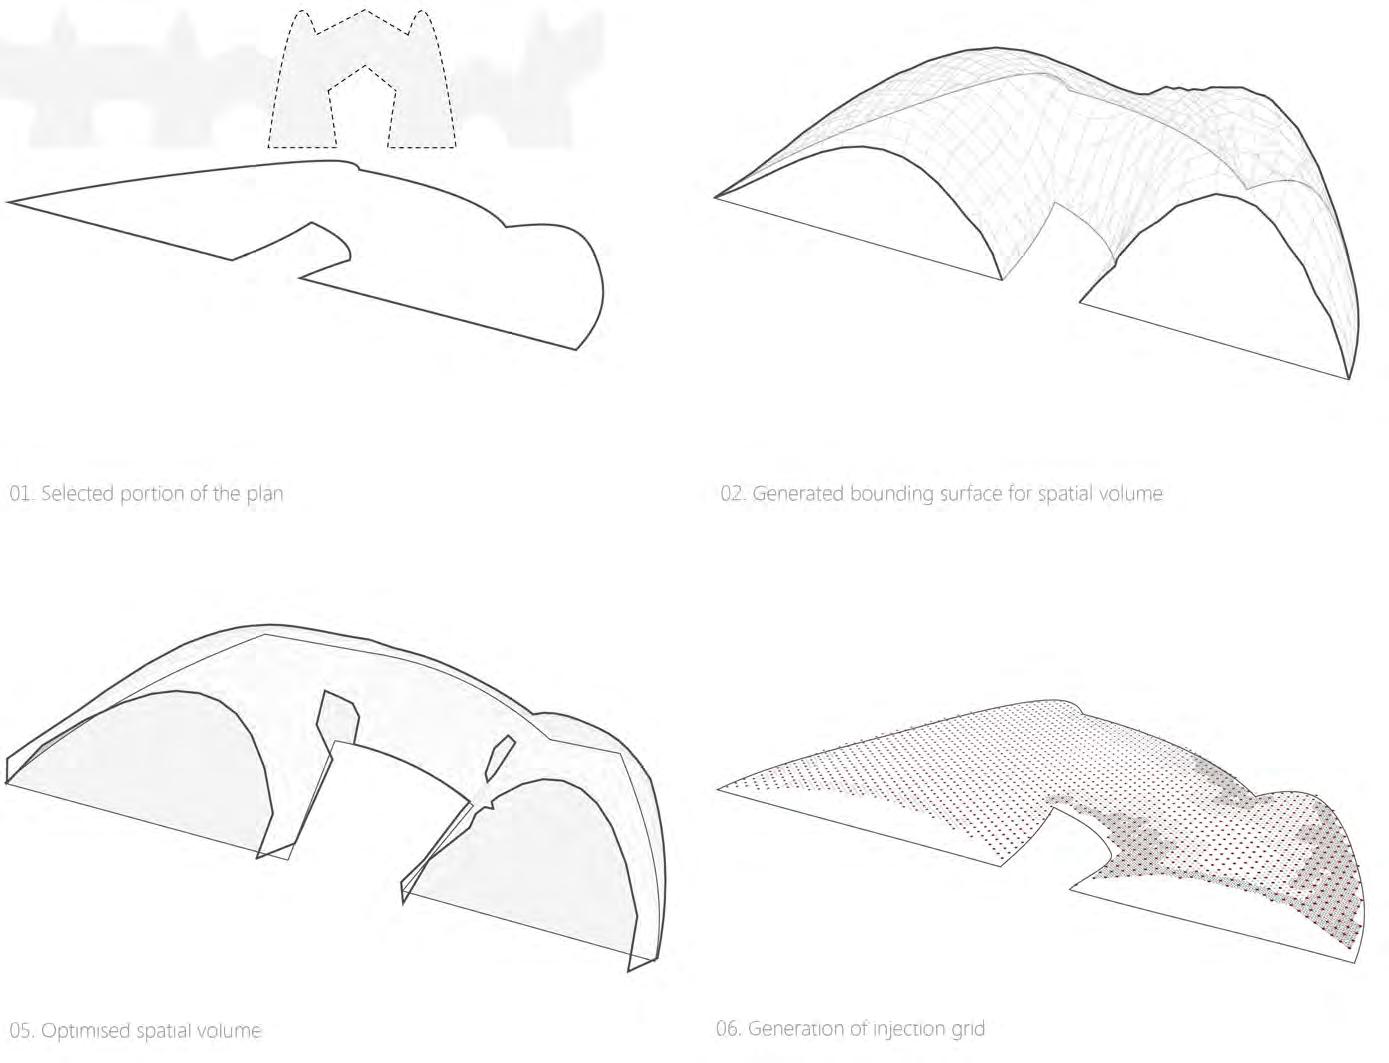
microbial morphologies 122 Optimisation Logic
in the coming sections.
The bounding surface has intrinsically stored information about the morphology to be generated above it. A set of properties at every location on the surface is reflected throughout the material created directly above it, including geometrical properties like possible angles of interaction with adjacent material, and those that are construction-imposed, such as material layering and thicknesses along the same vertical injection line.
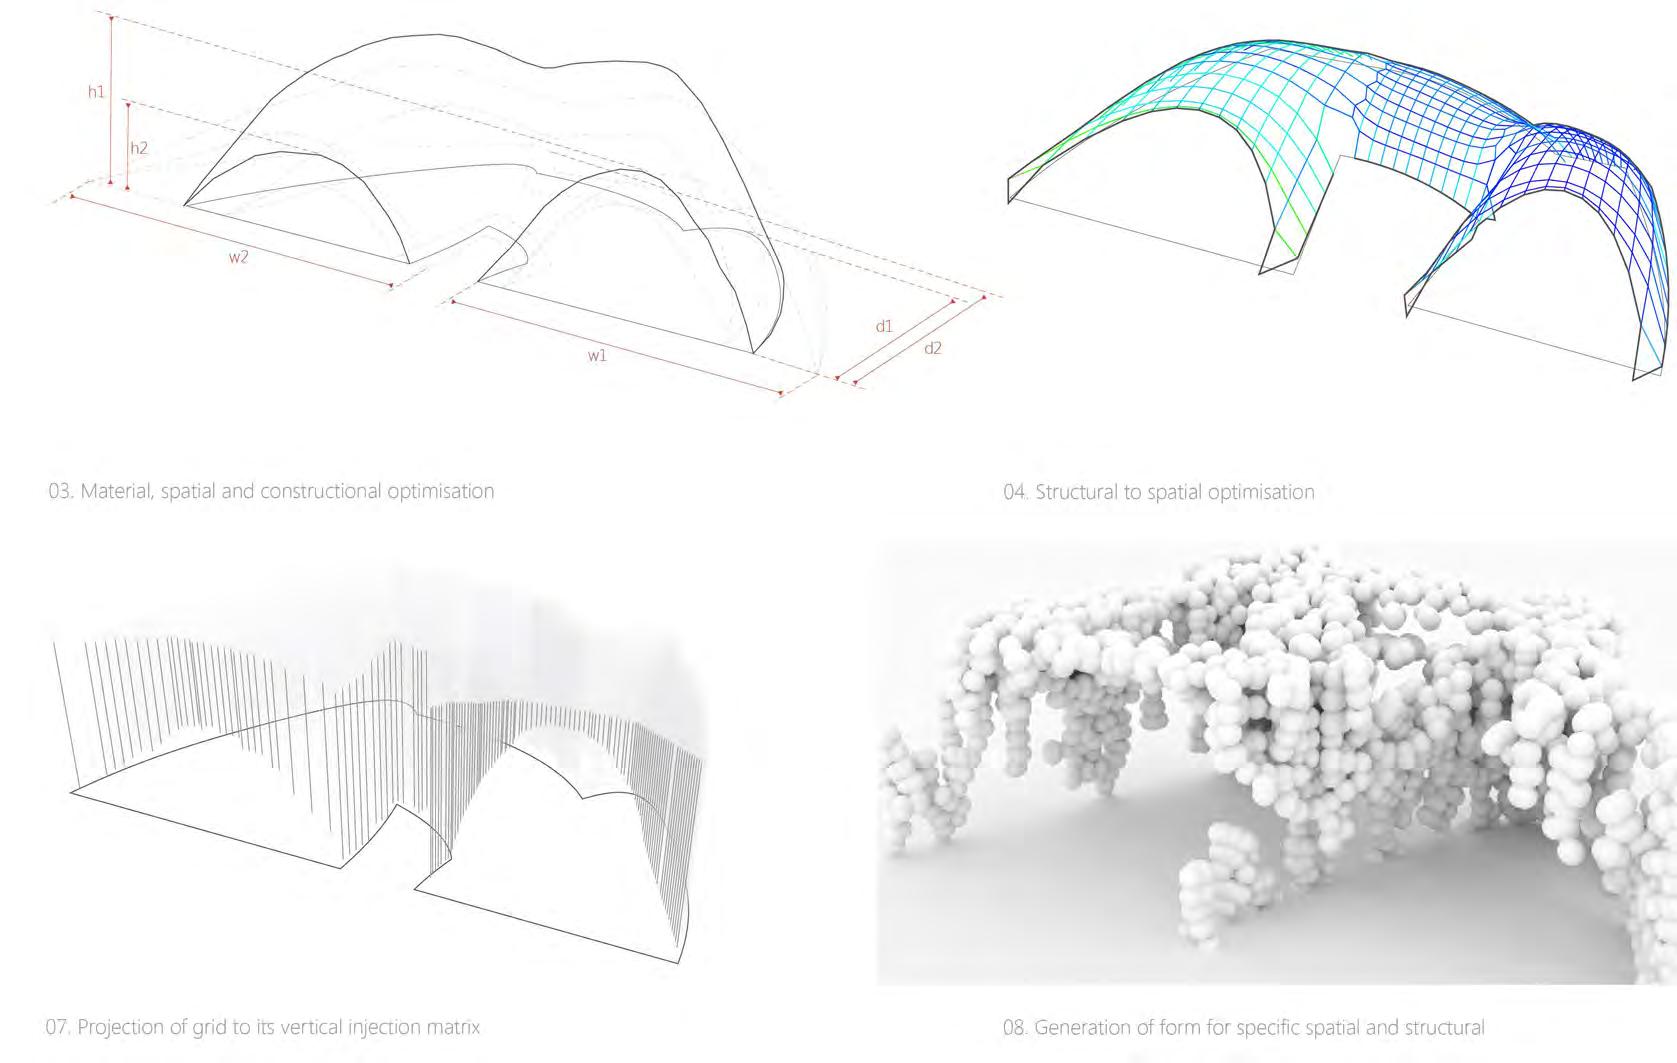
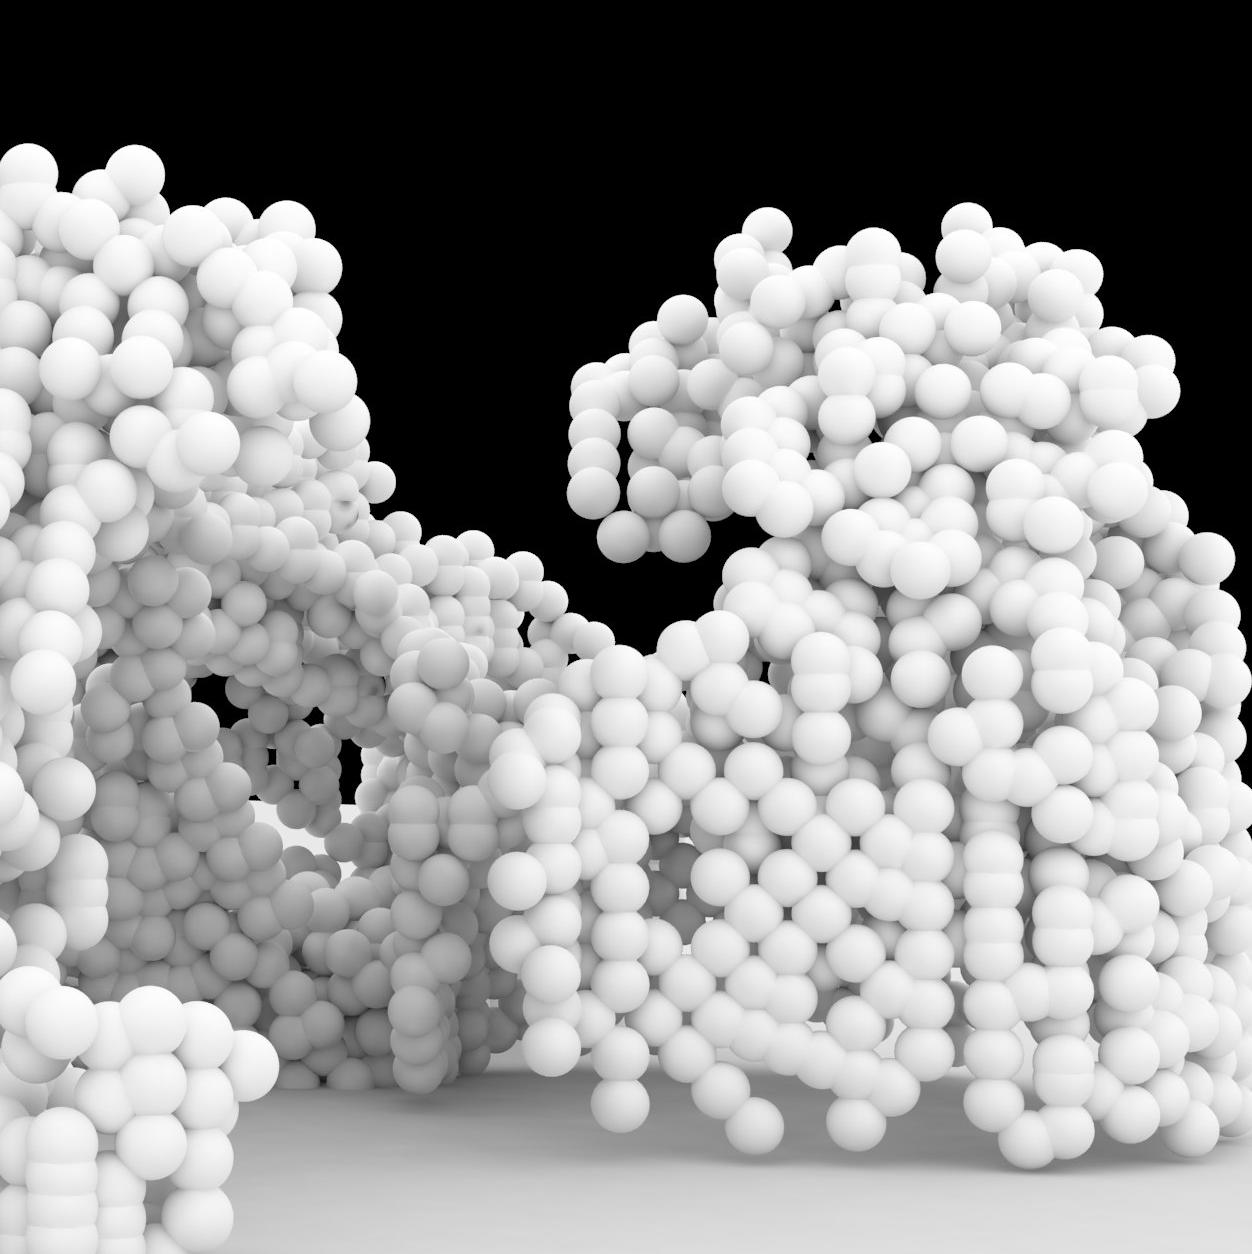
The procedure of generation of the built morphology
is described in sequence above, as applied to a specific section of the plan. The spatial boundary derived at the end of the first optimisation encompasses a linear strip of 600m along the 2.1km length of the dune, to allow for variations in the phenotype being evolved while maintaining sufficient localised control. Requirement for specificity increases in the subsequent steps, which necessitates a smaller region of action. Therefore, structural optimisation and injection patterning is done over a 15m length of the plan, and the morphology is evolved for each space separately.
design development 123
Optimisation Logic
Structural to Spatial Optimisation
The second stage of the evaluative form-finding process considers the material and structural loads acting on the bounding surface and assesses their contribution in reshaping it. The initial process leads to a surface with increasing height further away from the sea as the height of the dune increases. Nevertheless, the weight of the structure itself and the weight of the residual un-eroded sand will contribute loads in deforming the structure (Fig. 4o). This process allows the boundary surface to be affected by and adjusted to these loads.
The iterative process creates a surface initially as a compression vault that is equally loaded. Localised loads are added to it to match the conditions within the dune. The refinement at each step involves an adjustment in the load distribution on this surface such that it changes to become closer to the surface created at the previ-
ous stage. The result of this process is a refined version of the bounding surface created for a different set of constraints, i.e., structural performance. The loading capabilities of this surface are different from both that of the initial surface, as well as that of a typical compression vault (Fig. 4n).
The load limits of the surface define the strength requirement, and therefore the overlap between adjacent material units at each location on the surface. It forms the initial value for the structural gradient above that particular location. They also define how much load the structure is capable of actually carrying and limit the amount of hardening that can occur above it. The total load of the hardened and dry sand above a location cannot cross this defined limit. The structure is a failure if it cannot carry the load of the dry sand residual from the dune and will need to be redesigned.
microbial morphologies 128
Load
Iteration 01 30% residual sand Dune profile Spatial soffit 70% hardened sand 20 100140180 60 195 Axial
Iteration 04 Iteration 06 Load to required overlap co-relation 25 50 100 150 Overlap amount (mm) Load (kN)
Structural to spatial optimisation: Loads intrinsic to the spatial form
Dead load of the structure and residual sand
profile with respect to volume above
load within the surface structure (kN)
Fig. 4n: Structural to Spatial Optimisation, Loads intrinsic to the spatial form
Dead load of the structure and residual sand
Dune profile
30% residual sand
70% hardened sand
Spatial soffit
Load profile with respect to volume above
Wind and water loads on the structure
design development 129
Pressure (N/mm2)
9.4 5.0 2.5 7.5 0.6
Fig. 4o: Loads influencing structure
design development 121