
Water Quality Monitoring Network Severn Pilot Interim Report July 2023

This interim report sets out the progress the Angling Trust’s Water Quality Monitoring Network (WQMN), part of the Anglers Against Pollution campaign, has made since its launch in May 2022; summarises the first year’s results for the pilot on the Severn catchment; and highlights the issues facing the Severn and many other rivers across England and Wales. A fuller analysis of the findings of the WQMN, across all the rivers and catchments monitored, will be published later in 2023.


The WQMN has been an out and out success with more than 490 anglers from over 200 angling clubs stepping up to the plate, monitoring pollution on over 130 rivers across more than 50 catchments. In excess of 2,200 samples have been recorded highlighting the pollution crisis on our waterways.
On the Severn catchment
• 26 sites are summarised in the report
• 11 have a mean average that exceeds the WFD upper limit for phosphate, 42%
• 9 sites have a mean average for nitrate exceeding 5 ppm, 35%
• 8 sites exceed both, 31%
Cycle 3 classifications under the Water Framework Directive show that of the 209 river waterbodies assessed in 2019; none achieved a ‘Good’ Overall classification; only 4 achieved ‘Good’ Ecological status; all ‘Failed’ for Chemical status; and 197 didn’t achieve ‘Good’ status for Phosphates, 94%! As with many rivers across England and Wales the Severn is being impacted by agricultural runoff, sewerage discharges and urban runoff
Heightened levels of nutrients, phosphate and nitrate, from agriculture and the sewerage system cause eutrophication, the process whereby excess nutrient levels give rise to accelerated algal/plant growth with adverse effects on the ecology and uses of water bodies The Severn now regularly experiences significant algal blooms, the riverbed is covered in brown algae along much of its course, and much of the catchment is now devoid of the once common ranunculus, or water-crowfoot Fine sediments clog spawning gravels, suffocating fish eggs and invertebrates.
The Severn catchment experiences some of the highest levels of sewerage discharges in the country with 33,667 spillages, over 46 spillages per day, discharging for a total of 265,881 hours, over 364 hours per day, over the last two years. It is now commonplace to see sewage litter (wet wipes, sanitary pads, tampons, tampon applicators and nappies) from combined sewer overflows caught up in bankside vegetation or on the riverbed
To address the issues blighting the Severn, and many other rivers across England and Wales the Angling Trust asks for the following.
We need …
• The English and Welsh Governments to establish fully funded policies to address pollution in our waterways that deliver improvements now, not in the dim and distant future.
• Government to fund the enforcement of regulatory standards and implementation of the polluter pays principle across all sectors.
• Government to fast track the mapping and replacement of septic tanks discharging into surface waters, with a focus on high-risk areas such as protected sites.
• Government to ensure that the Department for Environment, Food and Rural Affairs (Defra); the Water Services Regulation Authority (Ofwat); the Environment Agency (EA); and Natural Resources Wales (NRW) prioritise addressing the pollution of our rivers and that they are funded in order to do so.
• Government to provide significant investment in local and catchment wide nature-based improvements, working with nature and using natural processes to protect and improve water quality.
• Government to include gateway requirements and specific options in all three Environmental Land Management schemes that go beyond regulatory baselines and basic good business practice and encourage farmers to achieve clean water in watercourses and waterbodies across their holdings. Options should range from basic soil health measures to large-scale habitat creation through arable reversion.
• Government to drive compliance with agricultural diffuse water pollution regulations by establishing a comprehensive advice and training regime to support land managers, complementing enforcement work.
• Farmers to stop polluting rivers and to comply with the most basic regulations such as Nitrate Vulnerable Zone (NVZ); Silage, Slurry and Agricultural Fuel Oil (SSAFO); Environmental Permitting Regulations (EPR); and the Farming Rules for Water.
• The EA to further increase the number of Agriculture Regulatory Inspection Officers, undertake more farm inspections, support compliance, enforce regulations and boldly prosecute non-compliance.
• Water companies to do more, and more quickly. No bonuses for directors and senior managers until raw sewage is no longer discharged into our rivers.
• A change of culture at the EA and NRW. They need to become detectives looking for pollution and enforcers of the law.
• Government to follow through on its commitment to reinvest fines handed out to polluters into environmental improvements.
Anglers are passionate about the places they fish and are deeply concerned about the poor water quality impacting fish, fishing, and the environment But they have often found it difficult to understand the state of their waters due to either a lack of information or a lack of transparency on behalf of the regulators and the water industry.
To engage anglers in better understanding the quality of their waters and to empower them to improve their waters in May 2022 the Angling Trust launched the Water Quality Monitoring Network (WQMN) with a pilot on the Severn catchment. Following the success of the pilot the WQMN was rolled out across England and Wales in July 2022.

“I started the testing myself on the Severn two years ago because I did not want the Severn to follow the demise of the River Wye. Along with a couple of other anglers we found out with our testing that the river biodiversity was under threat. Thankfully the Angling Trust got involved based on my findings and the WQMN pilot on the Severn started. The success of the pilot and consequently the national rollout has been amazing. Anglers are now able to monitor their local river and very quickly identify water quality issues. Like my fellow anglers we all care passionately about the state of our waterways and with the help of the Angling Trust, we are doing something about it. The testing that I do in Worcester has uncovered some worrying issues and with the help of Fish Legal we are trying to find out more about the discharges into the river. Through the WQMN anglers are not only the eyes and ears of our waterways but now we have become citizen scientists too.”
Glyn Marshall – WQMN Severn Pilot CoordinatorThe WQMN now has over 470 volunteers from over 195 angling clubs sampling water quality on 130 rivers across 50 catchments with over 2,000 samples recorded so far. On the Severn catchment more than 40 volunteers from 18 angling clubs are monitoring over 30 sites across the Severn catchment from the Upper Severn and its tributaries to below Tewkesbury.
Volunteers use a variety of equipment to test for Phosphate and Nitrate levels plus electrical conductivity (a measure of total dissolved solids) on a monthly basis and record their results using a smartphone app called Epicollect.

The WQMN focuses on nutrients as these are the main concern for fish and therefore anglers. High nutrient levels, eutrophication, contribute to algal blooms and excessive plant growth which in turn lead to oxygen depletion Eutrophication reduces a rivers resilience in the face of shifting weather patterns and climate change and without oxygen aquatic species, including fish, cannot survive and the river ecosystem collapses, as evidenced by the unprecedented number of fish kills across England in June 2023
The data gathered is not to replace the statutory monitoring undertaken by the Environment Agency (EA), Natural Resources Wales (NRW) or the water companies or to directly challenge this data. Statutory monitoring is extremely limited both spatially and temporally meaning there are significant gaps in our understanding of water quality. The WQMN data will help to fill these gaps. The data can be used by the local networks but will also be made available to other organisations to help inform the wider understanding of water quality. The data will help to show us patterns in water quality across a wide area, trends in water quality over time and potential problem sites or regions This solid foundation of data will be used to better understand the factors affecting water quality, aid in the development of effective solutions to improve water quality, and provide the Angling Trust with evidence to support its campaigning work
Its most important function is to support local and national action by communities and anglers by helping them to ask better questions and push for firmer action.
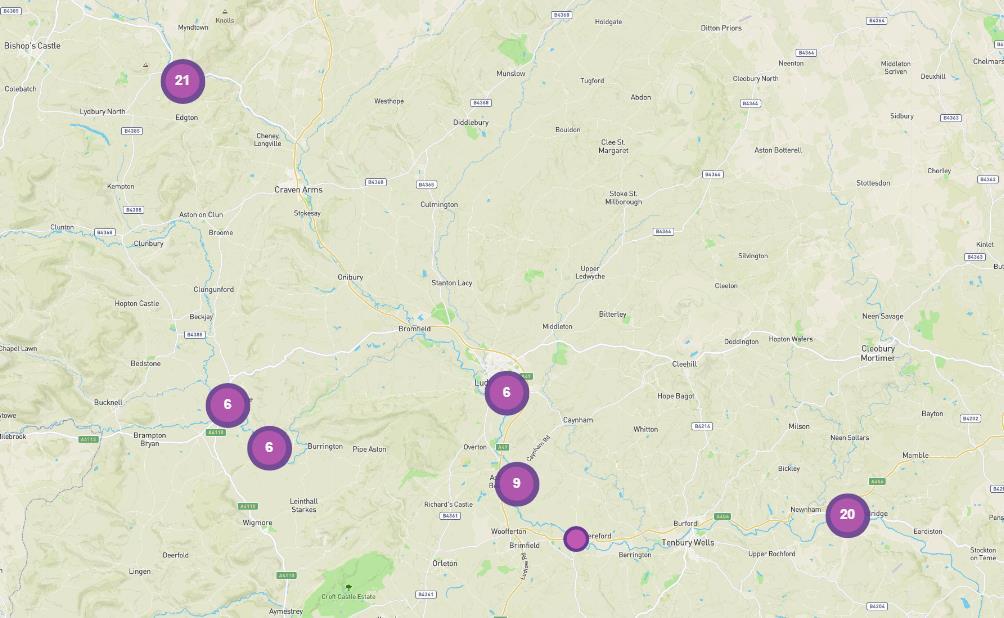
Sampling Locations on the Severn catchment

The overall results on the Severn are of concern. As of the end of May 2023 …
• 360 samples have been recorded on Epicollect
• Electrical conductivity results range from 50 to 1380 (µS/cm)
• Temperature results range from 0 to 24.6 (degrees centigrade)
• Phosphate results range from 0.0 to 2.5 (ppm). 141 samples exceeded the upper limit for Phosphate, 39%!
(Note: Water Framework Directive (WFD) limits for Phosphate are site specific and we are assessing against the upper limit, so it is likely that many more samples exceed their site-specific limit, and this is therefore a conservative assessment.)
• Nitrate results range from 0 to 20 (ppm). 201 samples were 5 ppm or over, 56%!
• 118 samples exceeded both Phosphate and Nitrate limits, 33%!
• 4 samples exceeded the upper limit for Ammonia with 10 observed algal blooms and 35 observed pollution incidents
• Of the 26 sites summarised in this report 11 have a mean average that exceeds the WFD upper limit for phosphate and 9 sites have a mean average for nitrate exceeding 5 ppm. 8 sites exceed both.
As a result of their involvement in the WQMN, two clubs have already escalated the situation on their part of the catchment due to the overall poor water quality and have approached the Environment Agency and Severn Trent Water to explore the causes and resolutions.

They are engaged in local community campaigns, have featured in local and national media, and have presented at regional events to highlight the plight of the Severn.
The Angling Trust is supporting them with advice, resources, and reports
Electrical Conductivity - Significantly elevated electrical conductivity can indicate that pollution has entered the river. A measure of electrical conductivity cannot tell you what the pollutant is, but it can help identify that there is a problem that may harm invertebrates and/or fish. Electrical conductivity may be high in a river without any visible effects on the clarity of the river water. Any human activity that adds inorganic, charged chemicals to a river will alter the electrical conductivity. For example, electrical conductivity may be higher in a river downstream of a sewage treatment works due to chemicals such as chloride and phosphate from household products. Winter road runoff, containing salt, can be very high in electrical conductivity. If this runoff reaches rivers, then it may, depending on the quantity of water, temporarily elevate the electrical conductivity in the river.
Phosphate - Standards for Phosphorus in UK Rivers were introduced under the Water Framework Directive (WFD) and associated Regs/Directions in 2009 and were updated in 2015. The standards are site-specific and depend upon the altitude and alkalinity of the site. The standards for good ecological status (close to natural) in Rivers are broadly in the range 0.077 – 0.306 ppm of Orthophosphate (PO4 3-), as annual means. This is as measured by the Hanna Phosphate Colorimeter.
Note - The Phosphate Checker upper limit is 2.5 ppm, the lower test limit is 0.00 ppm with an accuracy of ± 0.04 ppm. So, a 0.00 ppm reading does not mean there is no phosphate present, it will be between 0.00 and 0.04 ppm. A 2.5 reading does not mean that is the total phosphate, it means that it is in excess of 2.5 ppm.
Nitrate - There are no ecological status standards for Nitrogen in Rivers. The Environment Agency’s approach is to focus on Phosphate as the main cause of river eutrophication and the nutrient they are most able to reduce to levels that will improve the ecology There is a standard for Lakes and Reservoirs, which is 0.75 – 1.5 mg/l (ppm). Natural levels of Nitrate in freshwater are typically low, generally well below 5 ppm.

Caerhowel is on the main river near to Montgomery (Location 52.57552, -3.17522)
12 samples were recorded between the 23rd June 2022 and 18th May 2023.
Meifod Bridge is on the Vyrnwy, a major tributary of the Severn (Location 52.706935,3.249156)
5 samples were recorded between the 5th September 2022 and 8th February 2023.
Cynllaith at Sycarth and Pen y Bont
Sycarth and Pen y Bont are on the Cynllaith, a tributary of the Tanat which is a major tributary of the Severn (Location 52.819336, -3.182611 and 52.80453, -3.164355)
12 samples were recorded between the 1st June 2022 and 6th April 2023.
Averages are:
Nitrate levels exceeded trigger level on 7 occasions with pollution observed 4 times.
Tanat at Castellmoch Fawr and Banhadla
Castellmoch Fawr and Banhadla are on the Tanat which is a major tributary of the Severn (Location 52.811353, -3.320568 and 52.806739, -3.238213)
7 samples were recorded between the 23rd July 2022 and 16th May 2023.
Llanyblodwel Church Fields is on the Tanat, a major tributary of the Severn (Location
52.797273, -3.128325)
13 samples were recorded between the 19th June 2022 and 26th May 2023.

Rossall is upstream of Shrewsbury (Location 52.736421, -2.790039) 6 samples were recorded between the 3rd June 2022 and 6th June 2023
Shrewsbury Quarry is in the centre Shrewsbury (Location 52.70834, -2.762968)
30 samples were recorded between the 30th May 2022 and 6th June 2023. Averages are:
Nitrate trigger level exceed on 12 occasions
“Shrewsbury has an ageing Victorian sewer network and dozens of storm overflows that discharge into the Severn. Around Quarry Park there are 28 combined sewage overflows. Walkers regularly find sewage debris on the river path, sewage and tampons and wet wipes and all sorts. The stretch along Quarry Park used to have ideal angling conditions, and in the seventies and eighties it was home to major national competitions. We had anglers coming all from all over the country. It was always sold out, and it’s always been an iconic place for silver fish and competition fishing. Anglers no longer want to come, because the state of the river is so poor and that they are more likely to catch sanitary products than fish.
Fish need clean gravel. When I was fishing here in the seventies we had clean gravel, but now they are covered in a thick green slime and that’s a result of sewage dumping and high phosphate from the farms.”
Shrewsbury Weir is to the east of the town centre (Location 52.712795, -2.739384)
7 samples were recorded between the 5th March 2023 and 28th May 2023.
Nitrate trigger level exceeded on 4 occasions.
“Water quality at my site is poor. The major issues are untreated sewage from storm drains and run-off from agricultural land. Foam lines or foam ‘icebergs’ an almost constant sight on river surface, more pronounced immediately below the weir but apparent on the majority of sites around Shrewsbury. I have noticed that we no longer have beds of Ranunculus that were once abundant, beds of streamer weed are diminished as are other varieties. Stone and gravel beds have a covering of slimy, brown ‘algae’. Algal growth in marginal water more pronounced or excessive. Fish species are in reduced numbers or missing entirely. Swan mussels or freshwater mussels have disappeared in the last 10 years.”
Emstrey is downstream of Shrewsbury and Monkmore Sewage Treatment Works (Location 52.691628, -2.690939)
23 samples were recorded between the 30th May 2022 and 4th June 2023. Averages are:
Phosphate standard exceeded on 12 occasions. Nitrate trigger level exceeded on 10 occasions 2 algal blooms and 3 pollutions incidents observed.
Ismore Coppice Wroxeter is downstream of Shrewsbury just below the confluence with the Tern (Location 52.676434, -2.655355)
17 samples were recorded between the 8th June 2022 and 6th June 2023.

Apley is on the main river north of Bridgenorth (Location 52.549115, -2.409882) 9 samples were recorded between the 19th June 2022 and 26th March 2023.
Consistently exceeding both phosphate standards and nitrate trigger levels. Pollution observed on 2 occasions.
Severn at Diglis
Diglis is on the main river to the south of Worcester below Diglis Weir and Worcester Sewage Works (Location 52.178285, -2.226348)
11 samples were recorded between the 1st June 2022 and 31st May 2023.
Averages are:
Consistently exceeding both phosphate standards and nitrate trigger levels.
“I have been monitoring at Diglis for over two years now. Unfortunately, the state of the river here seems to be getting worse. Recent sampling has revealed that the phosphate levels are still extremely high, and this is a pattern which has not changed over the two years. There are definite algae blooms during the hot weather, with river clarity poor and a brown tinge. Unfortunately, there are two Combined Sewerage Overflows above where I do my sampling and these outflows seem to be the source of the high levels of phosphate recorded.”
Severn at Bushley and Deerhurst
Bushley and Deerhurst are on the main river to the north and south of Tewkesbury
(Location 52.019132, -2.18712 and 51.966297, -2.195849)
10 samples were recorded between the 25th June 2022 and 30th March 2023.
Averages are:
Consistently exceeding both phosphate standards and nitrate trigger levels.
Cleeve Mill is on the Ell Brook, a tributary of the Leadon, to the east of Newent (Location
51.933713, -2.391631)
6 samples were recorded between the 30th September 2022 and 3rd June 2023.
Averages are:
Consistently
Durbridge Mill is on the Leadon, a tributary of the Severn, (Location 51.966617, -2.390863) 6 samples were recorded between the 30th September 2022 and 3rd June 2023.
Plowden is on the Onny, a tributary of the Teme, northwest of Craven Arms (Location
52.480016, -2.907262)
19 samples were recorded between the 6th April 2022 and 5th May 2023.
The Clun confluence is just to the south of Lentwardine (Location 52.359563, -2.878406) 6 samples were recorded between the 22nd January 2023 and 31st May 2023.
Black Bridge is on the Teme southeast of Lentwardine (Location 52.34371, -2.853209)
6 samples were recorded between the 22nd January 2023 and 31st May 2023.
Phosphate Concentrations (ppm)
Phosphate Upper Limit
Nitrate Concentrations (ppm)
Nitrate Trigger Level
The Casemill is on the Teme on the southern edge of Ludlow (Location 52.364268,2.708302)
6 samples were recorded between the 8th January 2023 and 31st May 2023.
Teme at Teme’s Green
Teme’s Green is on the Teme at Ashford Carbonell (Location 52.333285, -2.702379)
6 samples were recorded between the 8th January 2023 and 31st May 2023.
Teme at Eastham Bridge
Eastham Bridge is on the Teme between Newnham and Lindridge (Location 52.318748,2.500157)
19 samples were recorded between the 1st June 2022 and 25th May 2023.

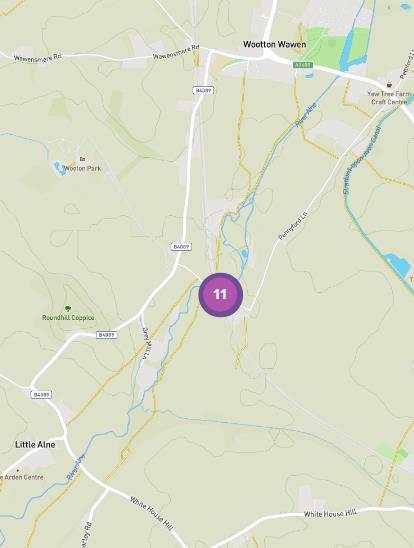
Pennyford Bridge is on the Alne, a tributary of the Arrow, which is a major tributary of the Warwickshire Avon, south of Henley-in-Arden (Location 52.255885, -1.782855)
11 samples were recorded between the 27th June 2022 and 5th May 2023.
Averages are:
Consistently exceeding both phosphate standards and nitrate trigger levels. Pollution observed on 4 occasions.
Blind Lane is on the Warwickshire Avon on the western edge of Evesham (Location
52.095305, -1.956096)
7 samples were recorded between the 10th October 2022 and 18th April 2023.
Warwickshire Avon at Evesham Tesco
Evesham Tesco is on the Warwickshire Avon on the western edge of Evesham (Location 52.10236, -1.953275)
7 samples were recorded between the 10th October 2022 and 18th April 2023.
Warwickshire Avon at Fladbury Paddle Club
Fladbury Paddle Club is on the Warwickshire Avon to the northeast of Fladbury (Location 52.11809, -2.006416)
8 samples were recorded between the 10th October 2022 and 15th May 2023.
Warwickshire Avon at Jubilee Bridge Fladbury
Jubilee Bridge is on the Warwickshire Avon to the south of Fladbury (Location 52.108816,2.000528)
13 samples were recorded between the 10th October 2022 and 15th May 2023. Averages are:
Consistently exceeding both phosphate standards and nitrate trigger levels
observed on 2 occasions.
“We were one of the first clubs to join the WQMN thinking that we had an isolated upstream incident but later learned from Severn Trent that there has been poor water quality in the Stratford to Pershore area since 2009. We have now measured water quality at our fishery on the Warwickshire Avon for over 14 months and patterns are beginning to emerge.
Measurements, particularly phosphate, have been alarmingly high throughout this period and twice now the stretch has been devoid of fish around November/ December. All submerged growth is covered in a thick black slime which cannot be healthy for the Fish. After liaising with Severn Trent and the Environment Agency many times we have failed to improve the situation.
As a fishing club we are concerned that the damage to the aquatic environment and the species that rely upon the river is reaching the point of no return. What chance have we got when there are seven overflow outlets in the Evesham area alone, many minor outlets not controlled, and nitrates allowed to flow off fields unchecked.
The Clubs efforts in measuring and publishing our data has inspired a local water quality group in the village and swimming in the river has almost ceased. The one area for encouragement is that there has been a huge increase in awareness and its initiatives like the WQMN which has raised this awareness. We are all keen to understand how we can turn this situation around.”
The Water Quality Monitoring Network was launched to engage anglers in better understanding the state of their waters and to empower them to address the blight of pollution. One year into the pilot on the Severn the WQMN has been an undoubted success with eighteen angling clubs involved, and further clubs interested in joining. Whilst the focus in the first year has been on gathering enough data to establish annual means for the key nutrient pollutants on the Severn, phosphate, and nitrate, it has been encouraging to see two angling clubs already campaigning locally for better water quality on the back of the data the WQMN has generated.
It was anticipated that levels of pollution on the Severn catchment would get worse as you progress down the catchment from the source, close to Blaen Hafren , through the head waters and tributaries high in the Welsh and Shropshire hills, as the major tributaries of the Teme and Warwickshire Avon join Severn, and onwards to the Severn Estuary. As agricultural intensity and urban densities increase, as the number of sewage treatment works (STWs) and combined sewer overflows (CSOs) increase, phosphate and nitrate accumulate. What is very concerning is the level of phosphates and nitrates on the middle and lower reaches of the Severn, below Shrewsbury, the Warwickshire Avon, and the tributaries, Leadon, and Ell Brook, feeding the lower river.
Cycle 2 classifications under the Water Framework Directive show that of the 209 river waterbodies assessed in 2019; none achieved a ‘Good’ Overall classification; only 4 achieved ‘Good’ Ecological status; all ‘Failed’ for Chemical status; and 197 didn’t achieve ‘Good’ status for Phosphates, 94%!
The latest Environment Agency figures show that pollution on the Severn is coming from three primary sources: 40% from agriculture; 35% from sewage; and 18% from urban runoff. Diffuse water pollution is the single largest agricultural contribution to the failure of water bodies to achieve good ecological status under the Water Framework Directive. According to DEFRA, “farming accounts for 25% of phosphate, 50% of nitrate and 75% of sediment loadings in the water environment” as well as being a significant source of pesticides. The increase in industrial dairy farming, intensive poultry production and arable farming in the Severn catchment is a concern and likely to increase pressure on the Severn.
In 2023 the Severn had the misfortune of being named the worst river in England for sewage pollution by the UK media. Over the last two years sewage discharges have been recorded from 655 of the 722 CSOs on the English portion of the catchment managed by Severn Trent Water 33,667 spillages were recorded, over 46 spillages per day, discharging for a total of 265,881 hours, over 364 hours per day.
Sewerage network overflows into rivers - 2021
Sewerage network overflows into rivers - 2022
Source: Rivers Trust Sewage Map


Report prepared by: Kris Kent - Campaigns & Advocacy Manager, Angling Trust Mobile 07949 529832 Email kristian.kent@anglingtrust.net
Supported by:


