3RD ANNUALREPORT
3RD ANNUALREPORT
“Firstly, I want to extend my sincere thanks to both the citizen-scientist volunteers and the members of the Angling Trust for their execution of this extraordinary survey. If anything positive can be gleaned from these results, it is that a great number of people care enough about our river catchments to volunteer untold hours of their free-time into water sampling - without that effort and dedication, this simply would not be possible.
Ultimately though, this depressing picture underlines firmly that the time for serious intervention and investment is now. This is no longer an abstract issue: we are at the tipping point. The health of our freshwater continues to decline and the time for direct action, at the very root of these causes, has come. Clean freshwater is a basic and fundamental right for all living things on Earth, we are utterly dependent on it as a species and we cannot expect to survive without it.”
Will Millard, Adventurer, Journalist, and Angling Trust Ambassador


“The Angling Trust’s 3rd Annual WQMN report once again shows how anglers are leading the way in the fight against river pollution. With nearly half of samples showing signs of pollution, the clean, plentiful water on which angling relies is under serious threat.
Campaigns like Anglers Against Pollution and citizen science initiatives such as the WQMN have been instrumental in pushing river pollution up the political agenda, with all major parties highlighting the issue in their 2024 election manifestoes. A total overhaul of the way we manage the water environment is needed, from sewage spills to agricultural pollution and road runoff. Fish, fishing, and the environment cannot wait any longer for these changes, and we urge the government to match its rhetoric with concrete action to rescue the rivers we love.”
Cook, CEO Angling Trust & Fish Legal
“The Angling Trust report confirms what the salmon are already telling us. In our chalk streams, water quality is failing and the consequences are catastrophic. Project White Hart aims to address how pollution is pushing these fish to the edge of extinction. The Water Quality Monitoring Network provides the hard evidence needed to hold polluters and regulators to account and force the urgent action required to restore clean and vibrant chalk streams.”
Jim Murray, Actor, Angling Trust Ambassador and Founder of Project White Hart
WHO’VE GIVEN UP 4,000 HOURS*
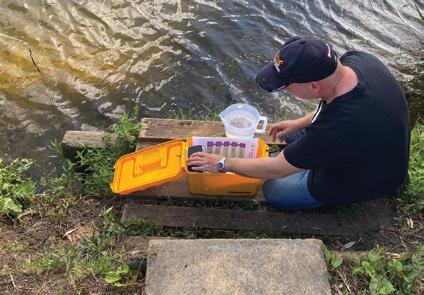
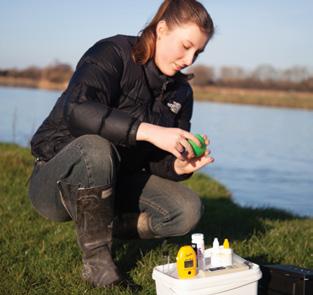
WQMN volunteers have been busy on the riverbank By 800+ volunteers 12250 water samples collected
That’s 167 days and nights non-stop
*assuming each sample takes 20 minutes.
INTRODUCTION
SUMMARY OF DATA ANALYSIS
ESTUARY WQMN
19 09 22 13 17
TAP WATER PHOSPHATE SAMPLING
FOCUS CATCHMENTS
50 Avon Warwickshire
62 Medway
72 Swale, Ure, Nidd & Upper Ouse
METHODOLOGY
LAKEFLY MONITORING DETAILED
THANKS

CHALK STREAMS
85 Test & Itchen Report: Exploring a Lower Standard for Phosphate in Chalk Streams
88 Nitrate Pollution in WQMN
Chalk Streams

Since its launch in 2022, the Angling Trust’s 800 Water Quality Monitoring Network (WQMN) volunteers have collected more than 12,250 water quality samples. Our 3rd Annual WQMN Report presents the data behind our freshwater crisis and the ways anglers are working to solve it.
More extensive and frequent water quality testing in UK rivers is essential to protect ecosystems, safeguard public health, ensure regulatory accountability, and restore public trust in water management. WQMN volunteers have demonstrated that data can be used to fight for and inform the bold decision making needed for a future with clean and plentiful water.
It has been a dizzying year in the world of politics and policy which affects our beloved rivers. The Independent Water Commission performed the largest review of the water sector since privatisation and the Government’s Water White Paper gave some indication of which recommendations will be implemented.
The Angling Trust and Fish Legal, as well as hundreds of WQMN volunteers have engaged extensively with the various bodies responsible for the regulation of the water sector and lobbied for the scrapping of Ofwat – the failed economic regulator. In the coming years the water functions from the Environment Agency, the Drinking Water Inspectorate, Natural England and Ofwat will be combined into a new single ‘super regulator.’
Following the publication of the Government White Paper, Jamie Cook, CEO of the Angling Trust and Fish legal commented:
There is no single point of failure, but a broken system, which is responsible for the dire state of our rivers which anglers witness every day. The surge of pollution must be stemmed from the water industry, agriculture and road runoff if our rivers are to be brought back from the brink. To do so, we will need to use all of the tools in our arsenal.
One tool which must be put to use is citizen science, which did not get a single mention in the 50 page White Paper, despite widespread calls for the new regulatory system to make use of the thousands of volunteers collecting robust data which could contribute significantly to the picture of the water environment which is necessary to effectively target improvements in ecosystem health.
With just 14% of UK rivers meeting good ecological status, more transformative action is needed to have rivers thriving for fish, fishing and the environment. The Angling Trust’s campaigns and environment team will continue to fight for this change, alongside an army of local groups, many of which have sprung out of the WQMN.
“The new regulator will only succeed if it is given the resources to adequately monitor the environment and enforce the law at national, regional, and local levels, and to get a grip on a multibillion-pound industry with a long track record of failure.”
In addition to the extensive presence of WQMN volunteers along the UK’s rivers, we are pleased to see the network expanding into estuaries and lakes. Following a successful pilot on the Ribble, volunteers are now monitoring seven estuaries across England and Wales, with further expansion planned for 2026. Estuaries are a vital habitat for fish and other wildlife, yet monitoring still lags behind freshwater. We are excited to see the WQMN estuaries programme grow from
strength to strength in the years ahead. Working as part of the Freshwater Biological Association’s Lakefly project, we have just completed a pilot to develop a methodology for assessing invertebrate abundance and diversity – key indicators of ecosystem health. Once the methodology is finalised, this project will be rolled out nationwide, applying a robust methodology to the lakes and ponds which anglers call their home.
In what follows, we present further information about our new Estuary WQMN, Lakefly programme, and a unique tap water sampling survey, before presenting detailed analysis of data collected over all 3 years of the rivers WQMN. Next, we discuss results in 3 focus catchments, both in terms of the data itself, and the wider activities of the local groups of volunteers who have led the fight for cleaner rivers in their catchments. Finally, we discuss the crisis faced by our precious chalk streams.
If you would like to get involved in the WQMN, be it in freshwater rivers, estuaries, or lakes, then contact us at aap@anglingtrust.net. We hope this report gives a sense of what the Angling Trust & Fish Legal is doing to fight the scourge of river pollution. If you care about river health, but are not yet a member of the Angling Trust & Fish Legal, then why not become a member, support the WQMN and protect your local environment?
Alex Farquhar Campaigns & Advocacy Officer Angling Trust
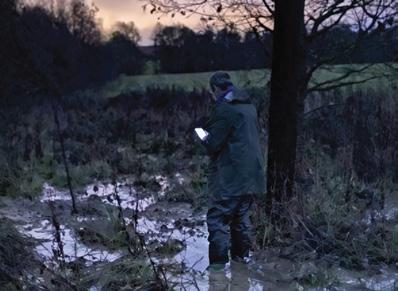
This report analyses three years of citizen science water quality data collected by the Angling Trust’s WQMN between July 2022 and July 2025. Using consistent methods and conservative regulatory benchmarks, the findings reveal widespread and persistent nutrient pollution across UK rivers, alongside a concerning rise in nitrate, ammonia and electrical conductivity readings. Thanks to the efforts of WQMN volunteers, the scale, spatial coverage and regularity of sampling provide a robust indication of national and regional trends. This report is a testament to the dedication of WQMN volunteers who have headed to the riverbank in all conditions, contributing more than 4,000 collective hours for the rivers we all love. All analysis and figures, unless otherwise indicated, were produced by independent researcher Isla Thorpe of the University of York.
Across all three years, a substantial proportion of monitored river sites failed to meet good ecological status when compared against the conservative upper phosphate threshold of 0.306 ppm. Among sites with 8+ samples per year, 43.9% breached the threshold in Year 1, falling slightly to 38.5% in Year 2 before rising again to 41.2% in Year 3. These figures almost certainly underestimate the true scale of failure, as many rivers have stricter site-specific limits and phosphate measurements are likely to be under-reported at lower water temperatures when using the Hanna phosphate checker. Seasonal patterns show higher concentrations in spring and summer, consistent with low flows and reduced dilution. Overall, phosphate levels
remain alarmingly high, with little evidence of sustained improvement. Phosphate Threshold Breaches of sites with 8+ samples/year:
Mean phosphate levels were calculated for each site. A threshold of 0.306 was applied. Percentage of sites that were greater than the threshold were calculated.
A threshold of 5 was applied. Percentage of samples that were greater than or equal to the threshold were calculated.
Compared to phosphate and nitrate, ammonia levels exceeded the upper benchmark of 0.6ppm in fewer samples. However, the proportion of breaches increased each year, from 3.6% in Year 1 to 4.5% in Year 3. This upward trend is concerning because ammonia is directly toxic to aquatic life, particularly under warm and high-pH conditions that favour the more harmful unionised form (NH₃). Peaks in ammonia during late summer and early autumn of Year 3 coincided with higher water temperatures, when ammonia becomes more toxic, increasing risk to fish and other wildlife.
A threshold of 0.6 was applied. Percentage of samples were greater than or equal to the threshold were calculated.
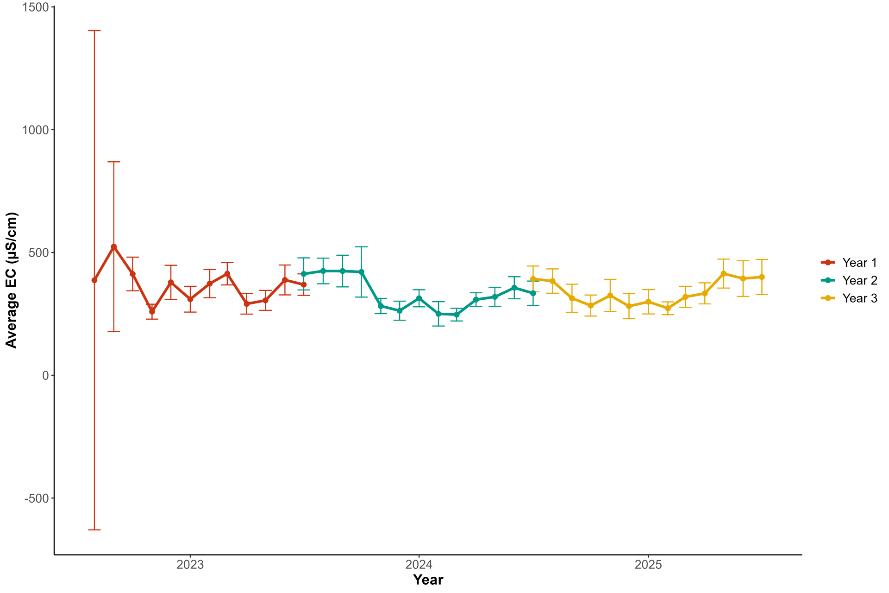
Electrical conductivity (EC), an indicator of charged chemical pollutants, shows a clear and worrying increase over the three-year period. Year 3 recorded the highest monthly average EC values in nearly every month, alongside a growing frequency of very high readings. While some extreme values may reflect equipment degradation, the overall shift in distribution suggests increasing pollution, potentially linked to sewage discharges, agricultural and road runoff. Seasonal patterns show EC peaking in warmer months, consistent with increased solubility at higher water temperatures and increased concentration effects during low flows.
Taken together, the WQMN data reveals that nutrient pollution is widespread, persistent and in some cases worsening across UK rivers. Nearly half of monitored sites now show nitrate pollution at ecologically harmful levels, over 40% fail conservative phosphate standards, ammonia toxicity risk is rising, and electrical conductivity is increasing year-on-year. These findings underline the inadequacy of current controls on pollution sources and demonstrate the growing influence of climate-driven low-flow conditions. The results provide compelling evidence that many rivers are failing to achieve good ecological status, and that urgent, systemic action is required to reverse these trends.
Estuaries are among the most productive and ecologically important environments in the UK, providing vital habitats for fish, birds and invertebrates, supporting fisheries, and acting as key transition zones between rivers and the sea. Despite their importance, many estuaries are under significant pressure from pollution, habitat modification, and climate change. Recent assessments show that 81% of England’s
estuaries fail to meet the Water Framework Directive (WFD) standard for Good Ecological Status, highlighting the scale of the challenge facing these systems. In response to this national issue, the Estuary Water Quality Monitoring Network was established to help improve understanding of estuarine water quality through coordinated, volunteer-led monitoring. Over its first six months, the project has brought together
13 trained volunteers, who have collected more than 250 water quality samples across 7 estuaries in England and Wales.
This report presents an initial overview of data collected by the network, focusing on dissolved oxygen and dissolved inorganic nitrogen, two key physiochemical elements used to assess estuarine condition under the WFD. At this stage, the dataset does not yet have the spatial or temporal resolution required to draw firm conclusions at an individual estuary scale, so this update focuses on the national trends we are recording rather than detailed site-by-site assessment. As the network expands and more volunteers join, the ability to identify both national patterns and local trends will improve, allowing future reports to explore changes over time and differences between estuaries in greater detail. Volunteers interested in contributing to this growing evidence base or learning more about the project are encouraged to get in touch with the Angling Trust via aap@anglingtrust.net
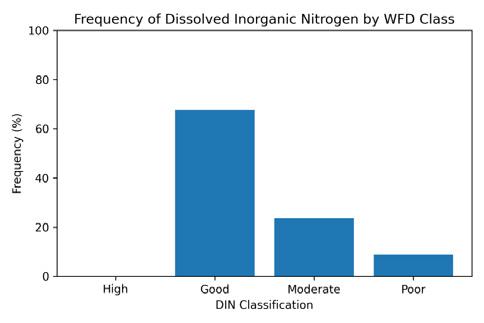
Dissolved inorganic nitrogen (DIN) is a measure of the readily available forms of nitrogen in the water column, primarily nitrate, nitrite and ammonium. In estuaries, DIN is used as an indicator of nutrient enrichment because elevated concentrations can promote excessive algal growth, which may affect water clarity, habitats and ecological functioning. Natural background concentrations of DIN vary widely between estuaries, particularly where waters are naturally turbid and strongly influenced by river inputs.
DIN is assessed in accordance with the Water Framework Directive (WFD). Under the WFD, estuaries are classified as transitional waters and are further grouped by natural turbidity. For very turbid transitional waters, DIN is assessed using the 99th percentile concentration rather than an average value. This approach focuses on higher-end concentrations and is intended to capture periods when nutrient
levels are most elevated, while recognising the inherently variable conditions that occur in estuaries. DIN data were screened and processed in line with WFD requirements prior to assessment.
The recalculated 99th percentile DIN concentration is 435 micromoles per litre (µmol/L). This value was compared against the WFD class boundaries for very turbid transitional waters. Under these standards, concentrations up to 270 µmol/L correspond to Good status, concentrations up to 405 µmol/L correspond to Moderate status, and concentrations above 405 µmol/L but below 607.5 µmol/L correspond to Poor status. Our findings of 435 µmol/L reflect elevated nutrient concentrations which may be negatively impacting ecological conditions. As DIN is a measure of nutrient input, it is clear that excess nutrients are making their way into many of our estuaries and coastal waters. There are many possible sources of nutrient input and diagnosing the sources in each catchment
is outside the scope of this report. We can say that agricultural runoff, wastewater treatment plants, and combined sewer overflows (CSOs) are common culprits which are undoubtedly contributing to the high nutrient levels we have recorded.
This outcome is consistent with national patterns observed across the UK. Many large, naturally turbid estuaries, particularly those with substantial freshwater catchments, fail to achieve Good status for DIN under the WFD. National assessments show that nutrient enrichment is one of the most common reasons why transitional waters do not reach Good ecological status, even where dissolved oxygen and other supporting elements meet high standards. Welsh statutory testing revealed nutrient pollution to be the primary reason for coastal marine protected areas failing to meet their conservation objectives. While the Poor DIN classification indicates elevated nutrient pressure, it does not in itself imply severe ecological degradation, and it reflects a widely recognised challenge for the management of turbid estuaries in the UK.
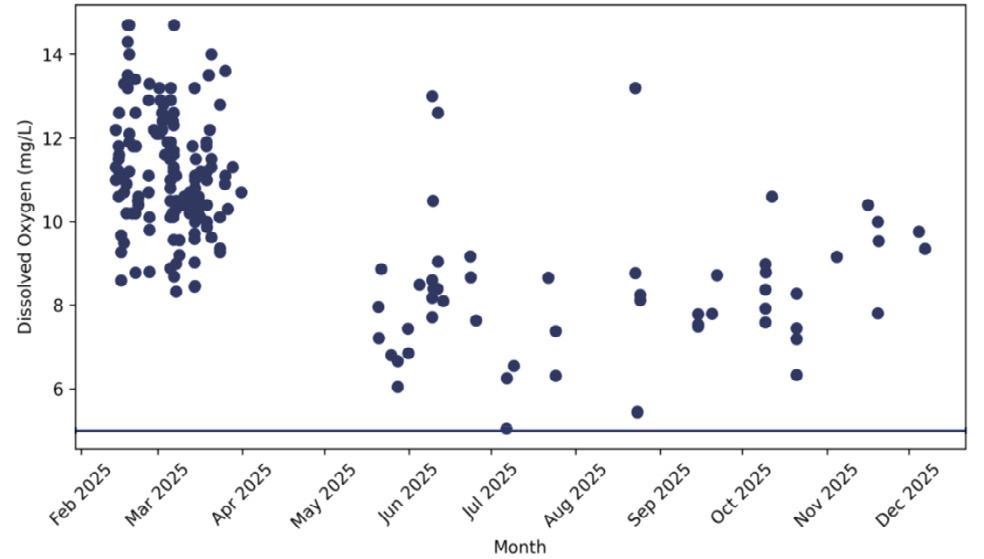
2: Dissolved Oxygen Measurements Relative to WFD High Threshold – Produced by Angling Trust.
The majority of dissolved inorganic nitrogen measurements (approximately two thirds of samples) fall within the Good status class under the Water Framework Directive. A smaller proportion of samples fall within the Moderate and Poor classes, reflecting episodic elevated concentrations that influence high-percentile statistics such as the 99th percentile.”
“NUTRIENT ENRICHMENT IS ONE OF THE MOST COMMON REASONS TRANSITIONAL WATERS FAIL TO REACH GOOD ECOLOGICAL STATUS.”
Robin Bradley
Cornwall Bass Investigations Group
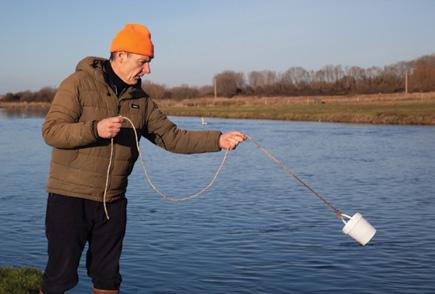
Dissolved oxygen (DO) is a key measure of water quality because it indicates how much oxygen is available to support aquatic life. Very low oxygen concentrations can cause ecological stress and in estuaries oxygen levels naturally vary in response to temperature, salinity, and tidal mixing. For this reason, DO data must be interpreted in a way that accounts for these natural influences.
DO was monitored at the site throughout 2025, with measurements collected across a wide range of environmental conditions, including different seasons and salinity levels. This provides a robust dataset for understanding both typical oxygen conditions and any potential low-oxygen events. The assessment has been carried out in line with the approach used under the UK Water Framework Directive (WFD), which is the regulatory framework used to classify the health of our estuaries and coastal waters.
Under WFD, oxygen assessments focus on the lowest oxygen conditions observed, rather than average values. Measured oxygen concentrations were adjusted to take account of water temperature and salinity, as oxygen is naturally less soluble in warm or saline water. Only samples representative of estuarine conditions were included in the classification.
The results show that dissolved oxygen levels at the site were consistently high throughout the monitoring period. Even the lowest recorded oxygen concentration still represents well oxygenated water. After accounting for
temperature and salinity, the lowest value was close to natural saturation levels and did not indicate oxygen depleted conditions that would be harmful to aquatic organisms. This should not be interpreted as meaning water quality as a whole was high, only that DO was not recorded as a limiting factor in water quality.
When assessed using the WFD classification method, dissolved oxygen at the site meets the highest category, known as “High status”. These findings are consistent with the wider national picture for estuarine waters in the UK. For example, recent national assessments show that in Scotland, 499 out of 504 transitional and coastal water bodies are classified as High status for dissolved oxygen. The summer of 2025 did serve as a great test case for dissolved oxygen, as high temperatures will result in lower DO levels. Considering this, it is a great result to see that DO levels remained high throughout the summer when tested. This does not mean to say there were perfect oxygen levels across the UK, as environmental context is important when interpreting our findings. Oxygen levels can fluctuate drastically within short periods, such as a tidal cycle. It is possible that an estuary may have experienced hypoxic conditions but for a brief window which wasn’t captured.
As the EWQMN grows, so too will our ability to detect hypoxic events. Another reason for these high DO levels is where we are sampling. Stagnant water tends to have lower DO levels than moving water. In the context of our coastal waters, a small back bay with little tidal influence could have significantly lower DO than nearby
moving water. EWQMN volunteers are trained to sample from water that is not stagnant, as this tends to be more reflective of the estuary as a whole. This will certainly miss out on the inter-estuary variation and is worth reflecting for future sampling in extreme weather conditions. to sample from water than is not stagnant, as this tends to be more reflective of the estuary as a whole. This will certainly miss out on the inter-estuary variation and is worth reflecting for future sampling in extreme weather conditions.
Sam Jones
Salmon Engagement Officer, Angling Trust

As well as expanding into estuaries, the Angling Trust has joined the Freshwater Biological Association’s (FBA) Lakefly project. The pilot has come to an end and once the methodology has been confirmed using the experience gained so far, the project will go live in 2026.
Lakefly is led by the Freshwater Biological Association (FBA) and aims to empower citizen scientists, enable stewardship and guide the management and restoration of freshwater habitats. There is a large gap in the statutory monitoring of lakes, as illustrated by the fact that in the Lake District, there are 80 lakes, tarns and reservoirs, but only 14 are monitored under the WFD. This is because the WFD limits investigation to lakes greater than 50 hectares, which ignores 66 crucial habitats.
Many WQMN groups take part in Riverfly, which is a well-established and widely adopted method for assessing ecosystem health through invertebrate surveys. Lakefly builds on the Riverfly methodology to provide a widely applicable method for assessing invertebrates in lakes – the absence of which has held back monitoring for years. Once the sample has
been collected, volunteers apply their training to identify and record the species found. In all, the methodology records the abundance of 24 invertebrate groups.
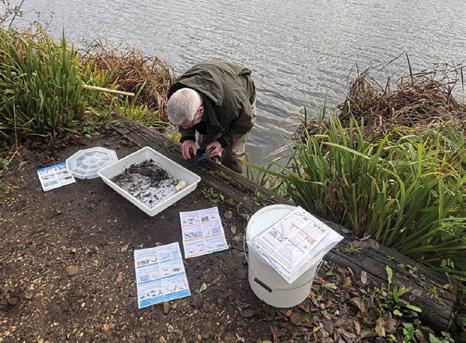
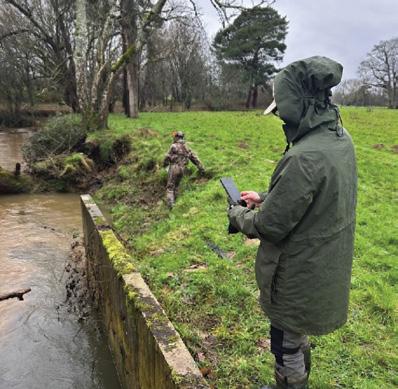
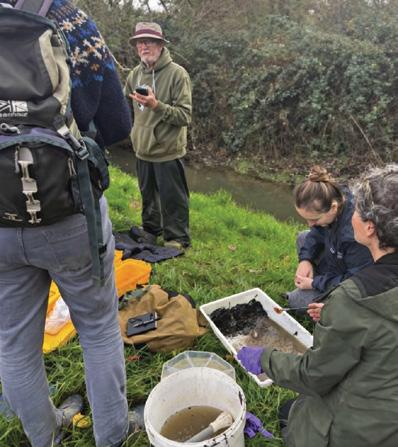
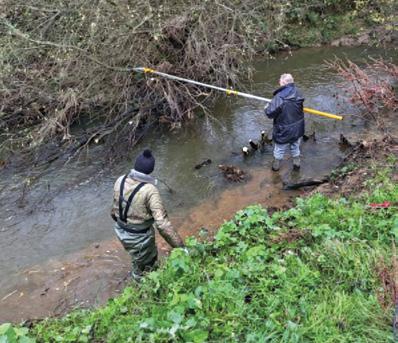
Bank side survey of invertebrates collected via kick sample.
The Angling Trust’s 4 fisheries support officers attended a training day with the FBA in Windermere in the summer of 2025 and have since been applying the pilot methodology at various habitats across the UK. We have been
performing regular surveys in a large reservoir, a mature shallow coarse lake, a trout lake, and a gravel pit. Our insights from the pilot will feed into the FBA’s final methodology, set to be launched in 2026.
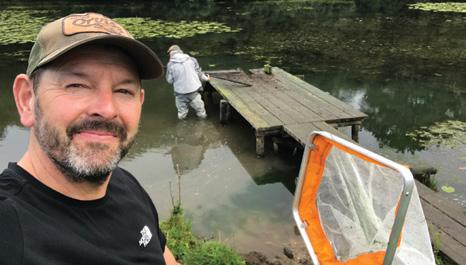
Mark Egerton, Fisheries Support Officer at the training day in Windermere
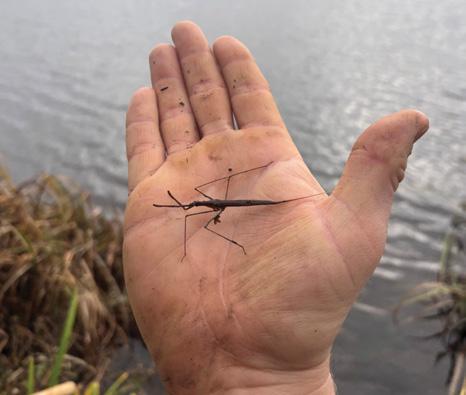
Water scorpion
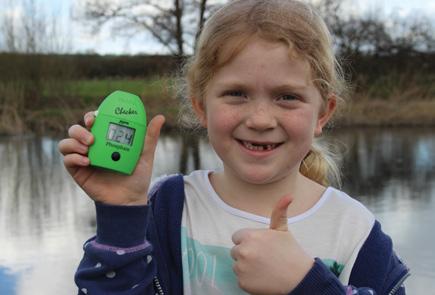
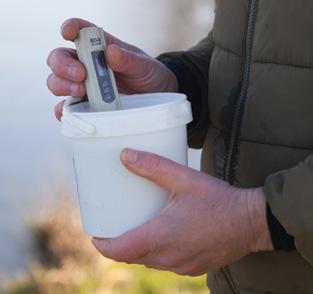
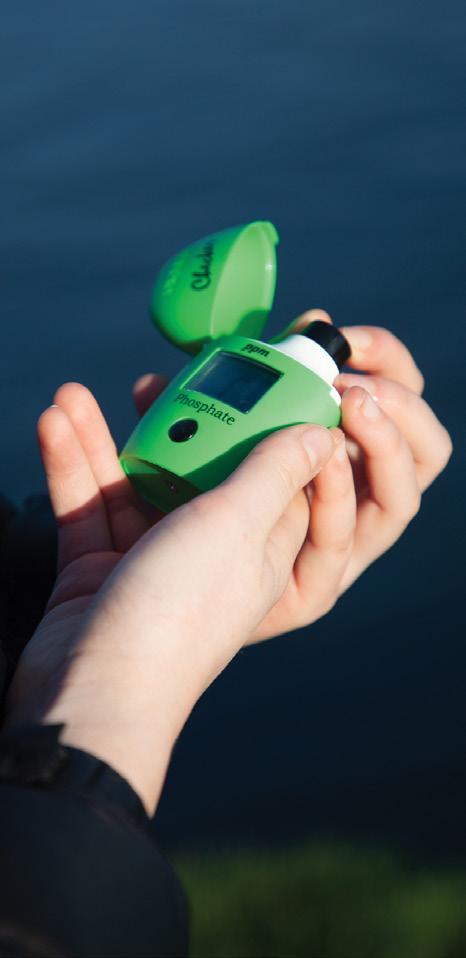
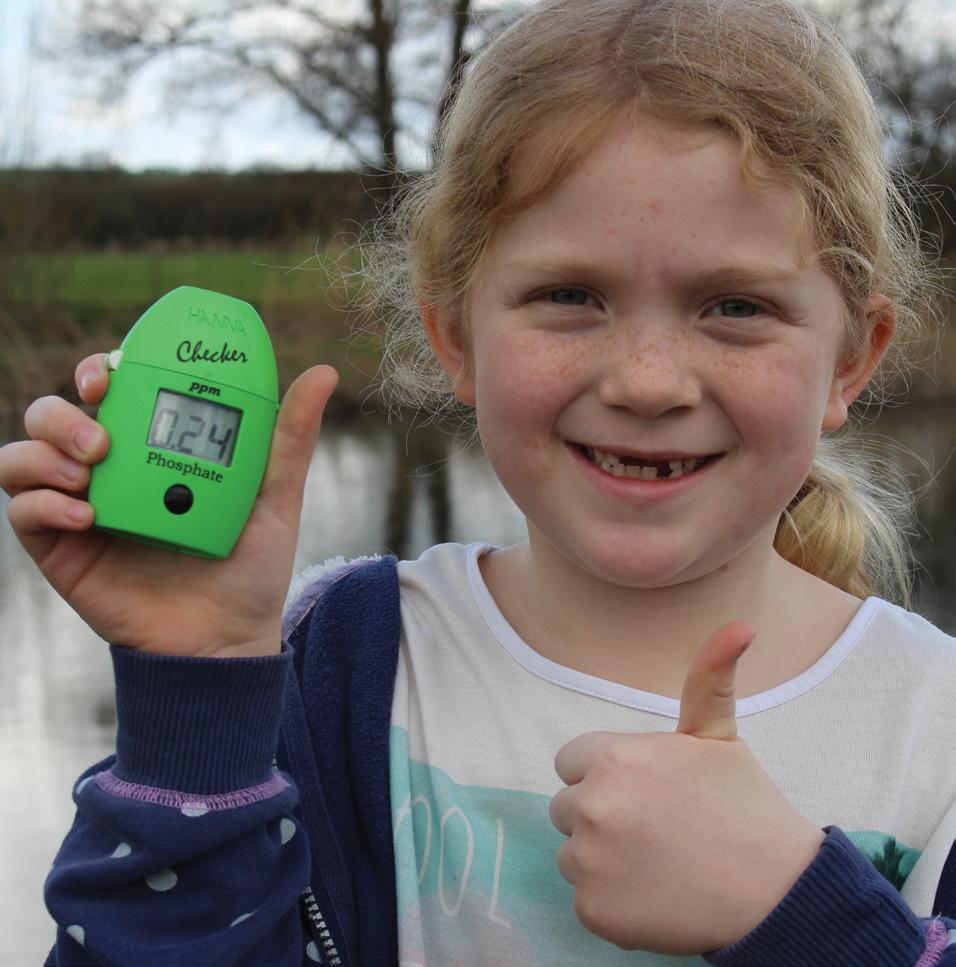
In summer 2025, the WQMN shifted its phosphate testing from rivers to tap water, with alarming results. Nearly 25% of tap water in England and Wales leaks from pipes into the environment. So it matters to fish and the wider ecosystem what is in tap water, an underresearched source of pollution beyond the usual culprits of sewage, agriculture and road runoff.
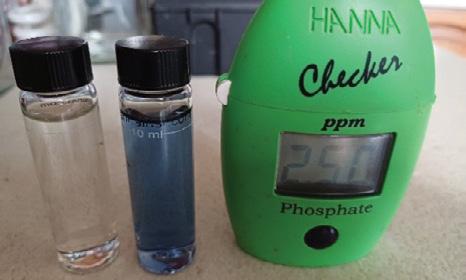
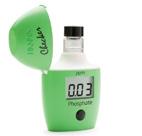
Out of 60 tap water samples taken, more than half (62%) maxed out the phosphate devices at 2.5ppm – meaning that the concentration was at least 2.5ppm.
3: Phosphate concentration of tap water samples collected by WQMN volunteers –produced by Angling Trust.
"WHAT FLOWS FROM OUR TAPS DOESN’T STAY IN OUR HOMES. EVERY LEAK SENDS POLLUTION INTO THE ENVIRONMENT WHILST THE WATER COMPANIES AND REGULATORS LOOK THE OTHER WAY"
Many volunteers reported their samples turning bright blue – something only seen in the natural environment during the most extreme pollution events.
Lead piping stretches back millennia. It has been used since Roman times across Europe, remaining the predominant choice for water supplies well into the 20th century, at which point the detrimental effects of lead poisoning on human health became clear. Responding to the science, the use of lead in new pipes in plumbing was banned in 1970 in the UK.
Of course, that left centuries of lead piping in place, which cannot be replaced overnight. Luckily, treating tap water with phosphates is highly effective at preventing lead poisoning from water pipes. Once in the water, phosphorous acts chemically to form a protective layer inside lead pipes, reducing the likelihood that lead will leach into drinking water.
As a result, public tap water in the UK meets high safety standards, with 99.98% of samples passing health and safety checks. The addition of phosphates to tap water in the concentrations typically seen in the UK to prevent lead poisoning doesn’t raise any health concerns. Therefore, we should not be concerned for human health’s sake, as neither the Drinking Water Inspectorate nor the World Health Organization specifies health-based guidance for phosphate in drinking water.
Phosphate loading of our drinking water supply matters for the environment, because tap water doesn’t just come out of taps - the biggest UK water utilities lose around 25% of drinking water to leakage – equating to 40 litres per customer per day. This means that the sky-high phosphate readings found in WQMN tap water samples ends up in the natural environment.
It is estimated that around 1200 tonnes of phosphorous enters the environment from tap water every year in England and Wales. That’s the same weight as 100 double-decker buses of harmful nutrients leaking into the environment annually.
Dosing tap water with phosphate has been effective for making our water safe to drink, but has come at a huge environmental cost. It is important to recognise that phosphate
dosing provides a temporary fix, not a long-term solution. Ultimately, lead pipes must be entirely replaced.
The solution is complicated due to the mixed ownership of lead piping in the UK. Some lead piping is owned by water companies, and some is owned privately (largely by households). The water industry made the ‘commitment’ to lead-free supply by 2050. But, this is not a legally binding requirement. Public trust in the water industry to meet even their basic legal obligations are at an all time low, and their progress towards essentially optional improvements has been extremely limited.
An immediate issue arises from the fact that the water industry doesn’t know how much lead piping they own. Thames Water, the UK’s largest water company which supplies 19 million people, has spent £82.7m to replace 89,465 pipes. But they haven’t provided a figure for how many pipes there are still to go.
The Independent Water Commission’s review into the water sector recommended a comprehensive mapping of water company assets must take place in order to understand the scale of investment needed to fix our crumbling infrastructure. This must take place swiftly, independently, and comprehensively to grasp, amongst other things, the scale of the challenge in replacing our lead pipes which the water industry claims to be committed to. We hope that this recommendation will be followed by the new regulator, under the guidance of the recently announced Chief Engineer.
Clear mapping of lead piping and ramped up investment is urgently needed and must tackle both water company and privately owned assets. Policies have emerged to this end, but the investment has been pitiful. If homes notify their water company of their intention to replace private lead pipes (built between 2003-2013), then the company is legally required to replace its section of pipe from the property’s perimeter to the mains. Several water companies also offer financial assistance to encourage homeowners to replace lead pipes from their properties.
A few WQMN volunteers have even had their water company pay entirely for the replacement of lead pipes on their property.
Water companies are miles away from meeting their 2050 lead pipe free commitment. The Telegraph reported last year that water companies are on track to replace all lead pipes by 3273. Rather than meeting their ‘commitment’ by 2050, at the current rate, we’ll have to wait another 1247 years!
Even with a radical shift in ambition and investment for infrastructure improvements, lead piping will remain in place for years to come. During this time, significant investment is required to reduce leakage from water pipes. Fixing our leaking pipes would go a long way to meet water shortages and prevent excess phosphates entering our waterways.
We are at a crossroads in the world of water governance amidst the whole sector overhaul
following the Independent Water Commission’s report and the government’s acknowledgement that it is a ‘once in a generation’ opportunity for reform. The Independent Water Commission highlighted the water industry’s chronic underinvestment which has led to crumbling infrastructure, and tap water leaking from pipes. Ofwat will be scrapped, and a new ‘super regulator’ will take responsibilities from Ofwat, the Environment Agency, the Drinking Water Inspectorate, and Natural England.
Water companies need clear, enforceable targets for replacing and upgrading old mains. The replacement of leaking pipes and old lead piping must be scheduled in a way that prioritises highleakage areas, pipes nearing the end of their design life, and regions facing water scarcity. Regulatory changes should shift incentives so that leakage reduction is no longer an optional public-relations exercise, but a requirement backed by penalties and rewards.
Phosphates will remain in our drinking water at the alarming levels identified by the Water Quality Monitoring Network for as long as lead piping stays in place. The environment cannot wait the 1247 years required at the current replacement rate. Stronger regulatory oversight, targeted leakage reduction, lead pipe replacement and a major increase in investment would cut the 25% leakage of phosphate dosed tap water into the environment, easing pressure on rivers, lakes and seas while replacement happens.
This report will highlight the spatial and temporal trends of conductivity, phosphate, nitrate and ammonia levels measured during monitoring undertaken by the Angling Trust’s WQMN. All quantitative analysis and figures were produced by independent environmental researcher, Dr. Isla Thorpe, of the University of York, unless otherwise indicated, working towards the following aims:
1. Identifying spatial trends of the levels of the environmental parameters monitored from July 2022 - July 2025.
2. Establishing temporal trends of the levels of the environmental parameters monitored from July 2022 - July 2025.
3. Determining temporal trends of the levels of the environmental parameters across the entire WQMN sampling period.
Analysis was performed on all 3 years, with a focus on the most recent year’s data, but
looking at trends over time. The three years that this analysis has been undertaken on has been defined as:
• Year 1 - 17-07-2022 to 16-07-2023
• Year 2 - 17-07-2023 to 16-07-2024
• Year 3 - 17-07-2024 to 16-07-2025
The WQMN dataset, freely available on Epicollect, includes some samples taken in Lakes. This report focuses on results in rivers, with research into lakes scheduled for 2026 (see page 17). To filter out lakes, OS streams was uploaded into the GIS file, and a 100m buffer around rivers created. Erroneous values were also removed from the dataset, including those with no recorded latitude or longitude, those registering far from their intended location and those identified as outliers due to faulty equipment.
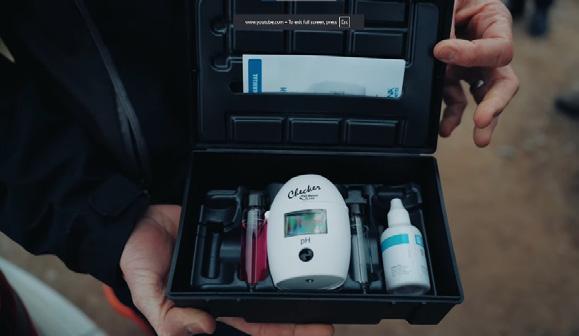
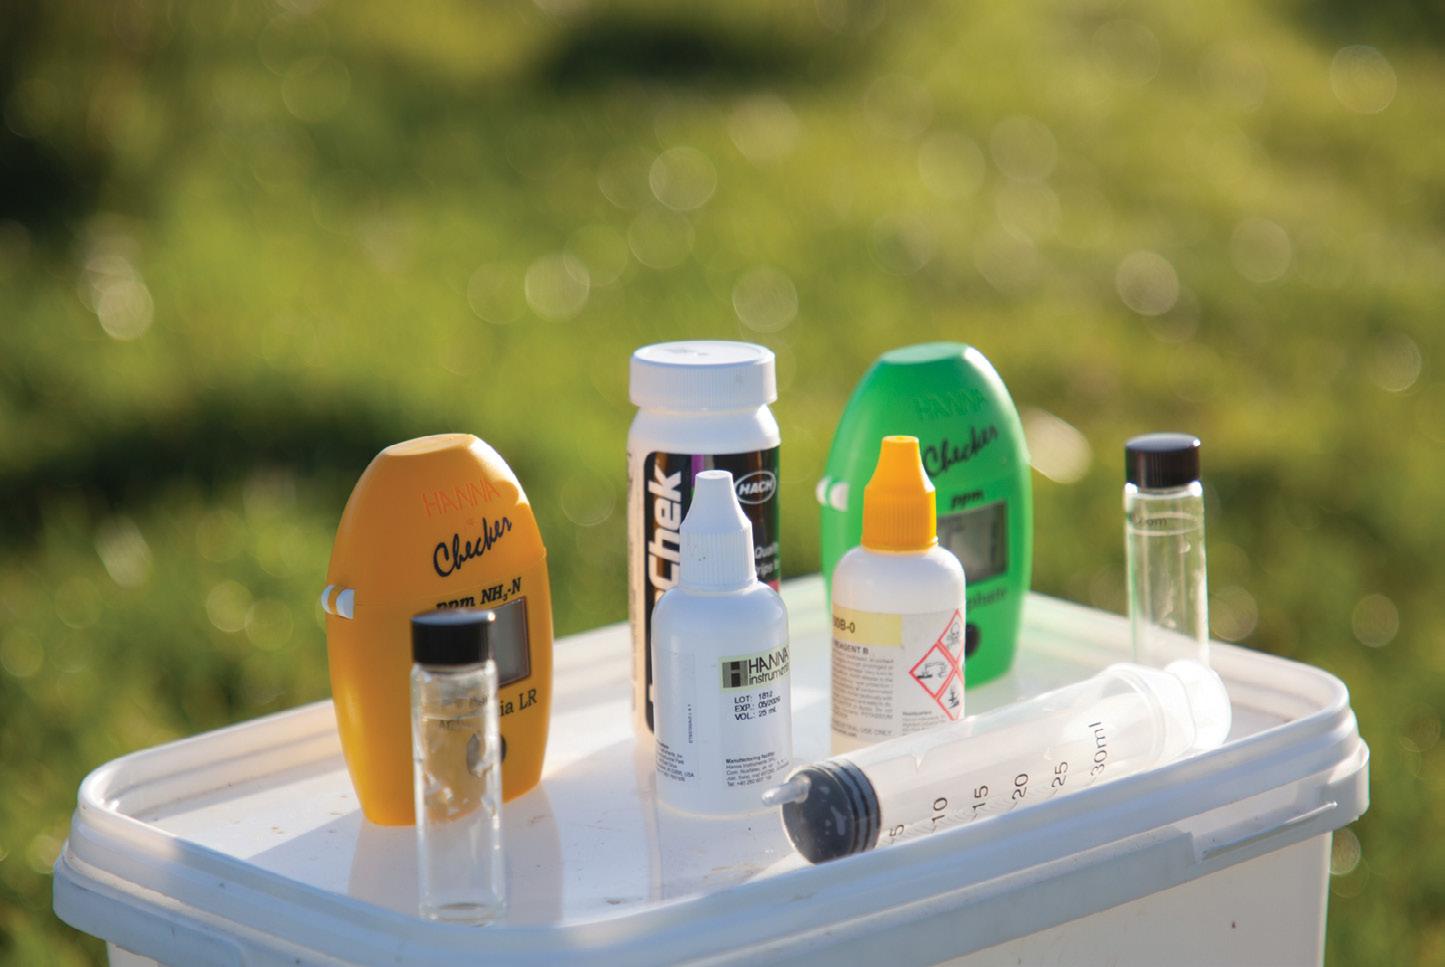
WQMN volunteers are equipped to monitor a range of parameters, using tried-andtested methods. Whilst these do not provide the same data quality as equipment used by statutory bodies, they are recognised as producing reliable data, which tracks statutory data closely.
WQMN volunteers are all equipped to monitor, as part of the standard kit*:
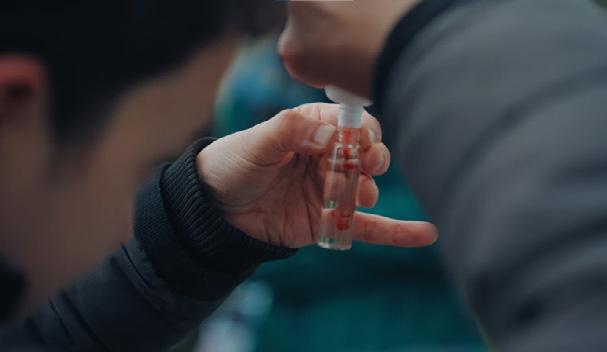
• Phosphate – Hanna Low Range Phosphate Checker
• Nitrate - Hach Nitrate strips
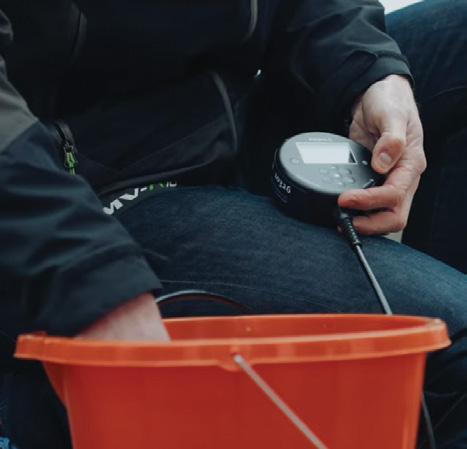
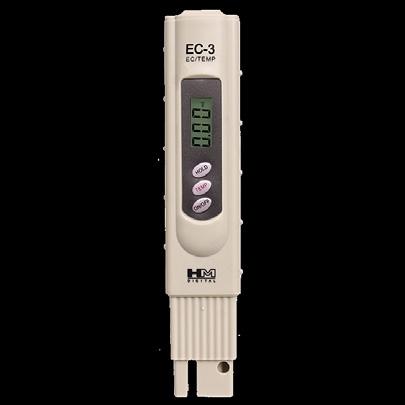
• Electrical conductivity and water temperature – HM Digital EC-3M
• *Approximately two fifths of groups are also equipped to monitor ammonia, using the Hanna Medium Range Ammonia Checker.
Nutrients are known to commonly pollute the aquatic environment within many countries. These nutrients exist in the environment naturally in all matrices including air, soil and water and are necessary for successful functioning of the environment (Manuel, 2014; The Rivers Trust, 2023). The major nutrients of focus for the WQMN are phosphate, nitrate and ammonia. These nutrients also enter the environment through anthropogenic sources,
which can lead to excessive levels of these nutrients. A major source of this pollution is from the agriculture and the wastewater treatment sectors, primarily as the result of use of fertilisers and run-off of animal manure and due to incomplete removal of these nutrients (The Rivers Trust, 2023; EPA, 2025b).
Focus has been on these nutrients for many years due to the potential negative environmental impacts that are associated with elevated levels of these pollutants within aquatic environments. This includes eutrophication which has negative environmental consequences including growth of algae and a depletion of oxygen levels within these environments. This can then result in hypoxic conditions, where there is no oxygen in a body of water (National Oceanic and Atmospheric Administration, 2014; Manuel, 2014). These conditions can result in the death of aquatic organisms within the environment.
Harmful Algal Blooms can also occur due to nutrient enrichment within aquatic environments, producing toxins. These toxins can potentially have a negative impact on human health where the water or contaminated organisms are consumed in aquatic environments (EPA, 2025a). These impacts are largely driven by phosphate pollution but also nitrate. Ammonia as a nutrient pollutant has been shown to result in negative environmental consequences such as direct toxicity to aquatic life (EPA, 2013; Edwards et al., 2024).

Electrical conductivity can indicate that pollution has entered a river, by measuring how well a river conducts electricity, which depends on the number of dissolved ions in the river. Whilst it cannot identify the pollutant, it can provide a useful indication of inorganic, charged particles entering the river.
There have been efforts to reduce nutrient pollution within aquatic environments. Regulations are in place to set legally binding benchmarks for pollutants, an example being the Water Framework Directive (WFD) which outlines environmental quality standards for different pollutants in the aquatic environment. A key aspect of the WFD is ‘good ecological status’ (GES), which is a key target for surface waters. To achieve good ecological status, a surface water must be characterised as a healthy ecosystem, only slightly different to its natural, undisturbed condition.
Part of the assessment for good ecological status is physio-chemical elements which support good biology. This includes variables
such as nutrients (phosphate, nitrate, ammonia) and electrical conductivity, which are monitored under the WFD. The WFD applies a ‘one out all out’ approach, whereby a surface water failing any single element of the assessment fails to reach good ecological status. For example, if a site breaches its target for phosphate, then it fails to reach good ecological status overall, regardless of performance according to other parameters.
In what follows, we analyse data collected for each parameter against regulatory benchmarks as well as assessing spatial and temporal trends over all 3 years of data collection. More detail is given in each section on the regulatory framework governing each parameter, the equipment used, and the results of 3 years of dedicated volunteers’ monitoring. Finally, we provide an analysis of local catchments with the highest sample frequency and explore whether the WFD standards are appropriate for chalk streams, by applying lower standards proposed by Natural England.
The power of the WQMN comes from the regular nature of sampling. Volunteers are encouraged to sample the same site monthly to identify trends over time and calculate annual averages. In this report, much analysis focuses on sites with 8 or more samples per year, which can be considered to have a good coverage over the full sampling period and allow reliable conclusions about chemical status which would not be possible by ad hoc sampling methods.
The WQMN’s coverage remains extensive in England and Wales, with a few sites monitored in Scotland, and new joiners since the end of this report’s data period in Northern Ireland. As with the previous 2 reports, 4 catchments made up the lion’s share of samples: Test and Itchen, Medway, Avon Warwickshire, and the Swale, Ure, Nidd and Upper Ouse catchment. These were chosen as focus catchments, with analysis presented on pages 50-84.
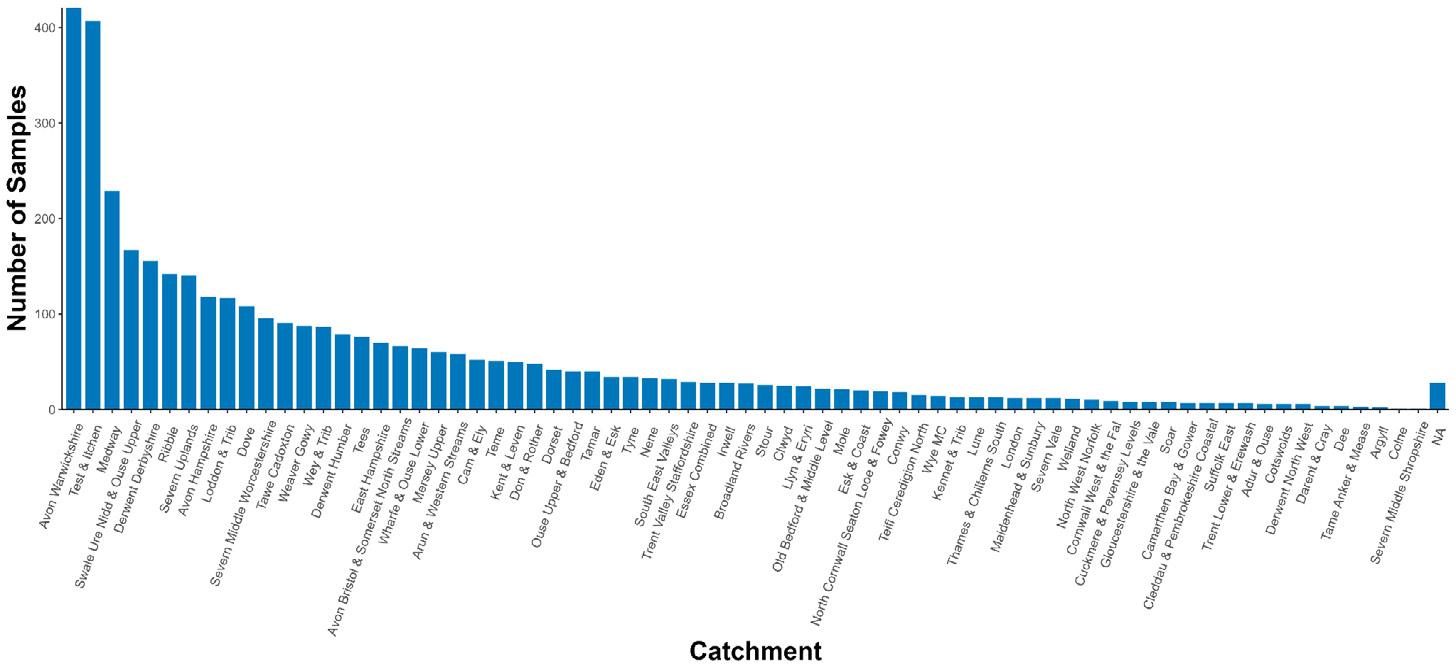
Figure 4: The number of samples monitored per catchment during the third year of the WQMN, this is from 17th July 2024 to 16th July 2025.
Catchments were defined utilising Environment Agency’s management catchments within their river basin district categorisations for England, Natural Resources Wales Water Framework Directive (WFD) Management Catchment Cycle 2 for Wales and Scottish Environment Protection Agency Water Framework Directive (WFD) Sub Basin Districts (SBDs) for Scotland. Catchment labelled NA is for samples that are located outside the catchment areas utilised within this report usually located in coastal areas.
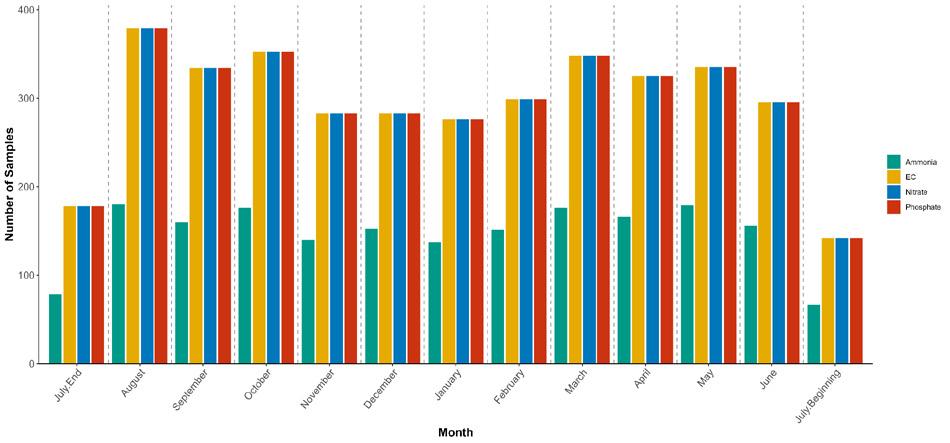
Figure 5. The number of samples monitored for each parameter each month in Year 3 of the WQMN, this is from 17th July 2024 to 16th July 2025.
Figure 5 shows the number of samples for each parameter by month in Year 3. The end months are smaller because the date range straddles the gap between years. Monitoring frequency declines over winter (November to February), as colder conditions make getting onto a riverbank less enticing for volunteers. However, effort remains high, with nearly 300 samples collected in each winter month in 2025. Such is their dedication that many even sampled on Christmas Eve and Boxing Day.
Just under half of the groups currently monitor ammonia. The kit is optional purely due to cost, adding another £100 upfront for volunteers, plus ongoing reagent expenses.
“IT IS 5 YEARS SINCE I WAS FISHING
MY LOCAL RIVER SEVERN AND I SAW ALL THE EVIDENCE OF SEWAGE SPILLS IN THE TREES. DURING THE YEAR I
STARTED TESTING THE RIVER WATER FOR PHOSPHATE. THE RESULTS WERE SHOCKING. I MET WITH THE ANGLING TRUST AND THE BASIS OF THE WQMN
STARTED, FOUR YEARS ON AND WOW!
WE HAVE THE MAJORITY OF RIVER CATCHMENTS COVERED AND THE INTEREST FROM ANGLERS AND OTHER GROUPS HAS BEEN FANTASTIC. THE MOMENTUM MUST KEEP GOING, OUR WATERWAYS DESERVE BETTER.”
Glyn Marshall Founding WQMN Volunteer
The standards for phosphate in rivers vary depending on the characterisation of the monitored site, altitude and annual mean alkalinity. Mean annual soluble reactive phosphorous is separated into high, good, moderate and poor benchmarks depending on the characterisations of the site (DEFRA, 2014). Median values calculated for a range of different rivers with differing characteristics range from 0.019 mg/L to 1.003 mg/L (DEFRA, 2014; UKTAG, 2013). However, there are specific recommended equations to be used to calculate the site-specific recommended phosphate
levels. Site-specific limits for good ecological status vary from 0.077ppm-0.306ppm. Since the sites selected for analysis by the EA and NRW do not match up to those selected by WQMN volunteers, the methodology applied here is to compare all sites to the conservative upper limit of 0.306ppm.
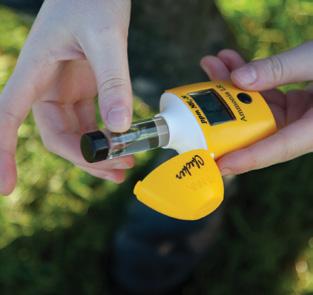
WQMN volunteers are equipped with the Hanna Low Range Phosphate Checker. The device measures phosphate in the range of 0 – 2.50 ppm as PO4. It is accurate +/- 0.04 ppm of reading. It should be noted that measurements of 2.5ppm indicate that 2.5ppm is the minimum reading, not the exact measurement.
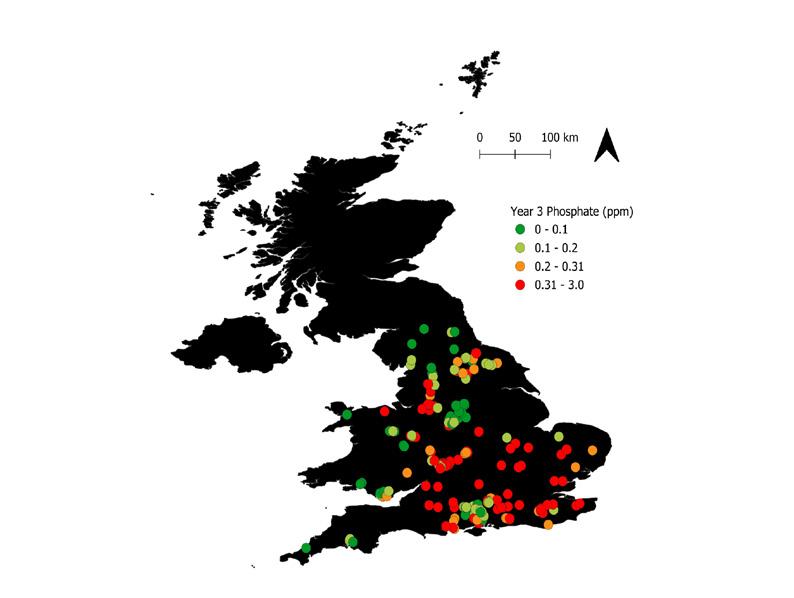
Figure 6. Map illustrating the location and concentration of phosphate levels monitored by the WQMN during Year 3 of their monitoring. Year 3 is from 17th July 2024 to 16th July 2025. Figure 7. Monthly Averages of phosphate levels across the three years of the WQMN in ppm. Error bars represent 95% confidence intervals. Black dashed line illustrates the benchmark of 0.306ppm. This represents all samples, not just sites with 8+ samples per year.
In the citizen science space, this is one of the most widely adopted pieces of technology, owing to its relative low cost (c.£90) and high quality of data. It is recognised by the Environment Agency as producing reliable data which, whilst not as accurate as more expensive technologies, tracks data collected by them very closely.
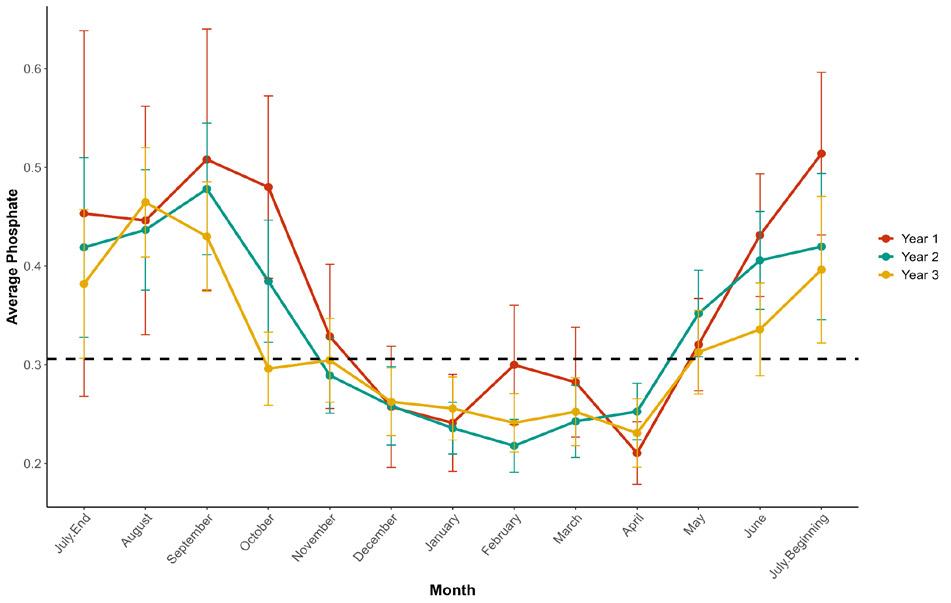
Figure 7 shows the significant seasonal variation in all 3 years. Phosphate concentration tends to fall in the winter months, and rise in the summer. There are two interpretations of this pattern.
First, it suggests that the effect of dilution outweighs the raw amount of phosphate inputs.
The winter sees an increase in the levels of nutrients entering waterways, as wastewater treatment works (WWTW) release more untreated sewage when rainfall overwhelms their treatment capacity. With more rainfall comes more runoff from agricultural and urban land, inputting more nutrients into rivers. However, rainfall also increases river levels. More water means greater dilution. One interpretation of the
trend then is that the effect of greater dilution in winter outweighs the greater inputs over these months. The converse applies in the spring and summer months, where low rainfall means fewer nutrient inputs, but more low flows, leaving little water for any nutrients present to dissolve in, therefore increasing nutrient concentration.
However, this seasonal pattern cannot be concluded with any confidence, due to known limitations of the Hanna Phosphate device when used to test samples with a low water temperature. The stated accuracy of the Phosphate checker of +/- 0.04ppm is for samples tested at 25°C. During summer, river water temperatures very rarely reach 25°C and in the winter, samples are often well below 10°C.
The Hanna checker uses a colorimetric method based on a blue tint produced by a chemical reaction of phosphate with the reagents. The chemical development reaction’s speed depends on temperature, and significantly lower than 25°C readings are systematically different, generally lower, than they would at the specified 25°C conditions.
Work is ongoing with CaSTCo to develop best practices for overcoming this systematic issue in the use of the Phosphate checker. Currently, the recommendation is to monitor water temperature at the same time as monitoring phosphate. This has been done during every sample by WQMN volunteers, so we are in a good place to adjust methodology or interpretation once an approach is decided.
The potential under-reporting of phosphate concentration due to colder than recommended water temperatures for testing must inform our conclusions about year-on-year changes. The WQMN has found alarming percentages of breaches of good ecological status in UK rivers in all 3 years of data collection. If anything, these are likely to be underestimates of the severity of
the situation, when we account for likely underreporting of readings at low temperatures.
The 0.306ppm benchmark for GES is the maximum site-specific standard for phosphate, with many sites having considerably lower specific standards. The percentage of threshold breaches is therefore a definite underestimate when compared to site-specific standards. We are unable to accurately apply site-
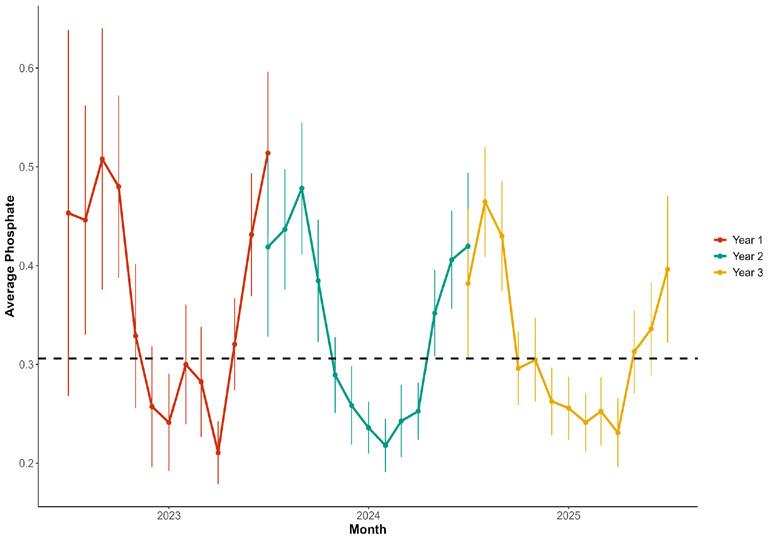
Figure 8. Monthly Averages of phosphate levels across the three years of the WQMN in ppm. Error bars represent 95% confidence intervals. Black dashed line illustrates the benchmark of 0.306ppm. This represents all samples, not just sites with 8+ samples per year.
specific standards, as WQMN sites do not map directly onto statutory monitoring sites, so the conservative 0.306ppm limit is applied nationwide.
Figure 8 shows the strong seasonal trend and slight decline over the 3 period in phosphate concentration. Unlike the site averages, this figure includes all measurements, not just those with 8+ samples per year. Since the mid-1990s, there has been a significant decline in phosphate concentrations in UK rivers, following drastic increases over much of the 20th century. In recent years, results have been mixed and varies each year, as reflected in the WQMN’s findings.
Looking at site averages for those with 8+ samples per year against the conservative upper limit of good ecological status, the proportion of failure is startling. In year 1, 43.93% failed to meet good ecological status, falling to 38.52% in year 2 and rising again to 41.22% in year 3.
"THE SLIGHT FALL IN PHOSPHATE CONCENTRATION IS WELCOME NEWS. BUT THE LEVELS REMAIN SKY-HIGH, WITH 41.22% BREACHING GOOD ECOLOGICAL STATUS IN THE 3RD SAMPLING YEAR."
Alex Farquhar Angling Trust
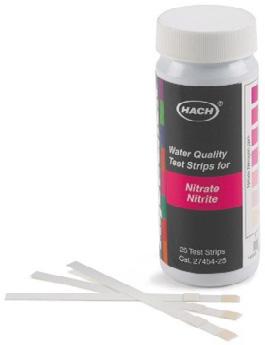
Nitrate pollution is a major contributor to eutrophication across the UK, with huge inputs from agriculture and the water industry. Nitrate concentration is measured by the WQMN using Hach Nitrate Strips. These give coarse data, with volunteers comparing the colour of the strip, once reacted with the sample, against a colour chart. This process is open to bias according to the eyesight of the volunteer, and where the colour of the result sits between 2 bands, volunteers must make a decision which best approximates that on the strip.
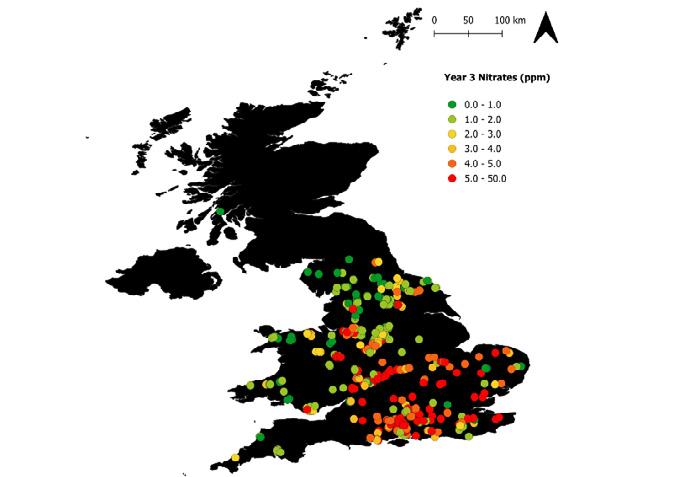
Figure 9. Map illustrating the location and concentration of nitrate levels monitored by the WQMN during Year 3 of their monitoring.
Of all methods used in the WQMN, the nitrate strips produce the lowest quality data, which must be understood not as a robust scientific method matching that of the regulators (as with ammonia and phosphate), but an indicative result of nitrate concentrations.
Nitrate concentrations in UK rivers are not governed by the WFD, but by the Nitrates Directive. This sets an upper limit of 11.3ppm for good ecological status (GES). This value was co-opted from the EU drinking water standards, which set maximum nitrates standards at 11.3ppm
(NO3-N), without ecological evidence. 11.3ppm is far above the concentration of nitrate required to contribute to eutrophication, so volunteers are advised to consider results of 5ppm or more as showing signs of nitrate pollution.
Against the 5ppm standard, the share of breaches has increased year on year in WQMN
data, rising from 43.8% in year 1 to 45.91% in year 2 and 49.93% in year 3. This is reflected in Figure 9, showing monthly average nitrate concentrations across the UK over the three years of sampling. After a peak in early 2023, when the WQMN had few samples due to its recent formation, results show a steady upward trajectory, peaking in spring and summer 2025, when every monthly average breached 5ppm.
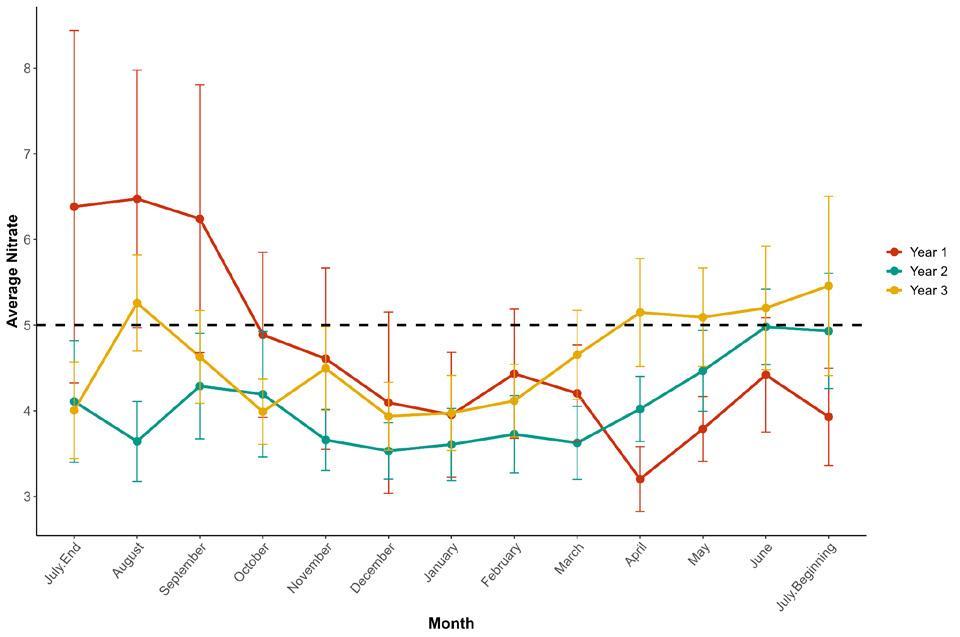
Figure 10. Monthly Averages of nitrate levels across the three years of the WQMN in ppm, and each year reflected in its own line. Error bars represent 95% confidence intervals. Black dashed line illustrates the benchmark of 5ppm.
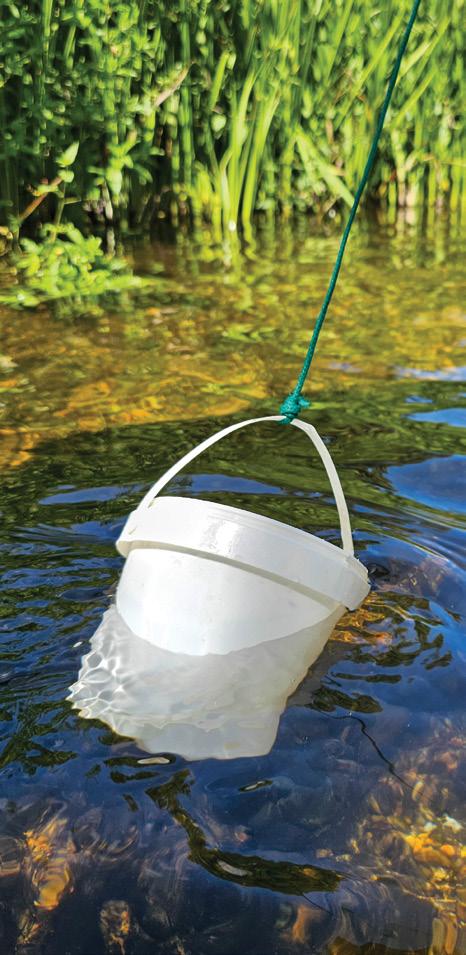
Figure 11. Monthly Averages of nitrate levels across the three years of the WQMN in ppm. Error bars represent 95% confidence intervals. Black dashed line illustrates the benchmark of 5ppm.
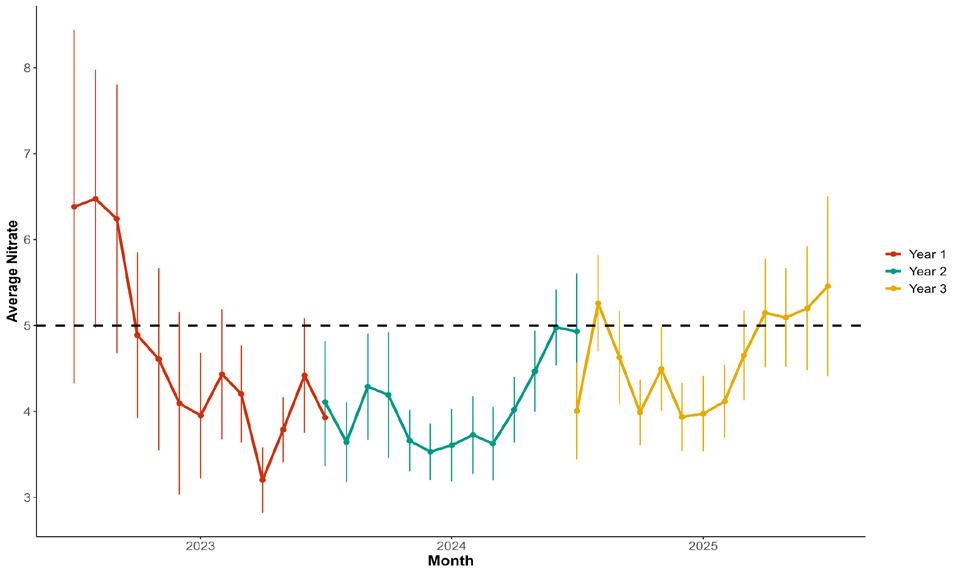
Figure 11 shows this spike in Spring 2025 more clearly, which is explored in depth in the WQMN spring report, as covered in The Times, BBC South East and The Independent. Looking at Figure 10, year 1 monthly averages surpass that of year 3 in all months from July end up until March, when year 3’s nitrate concentrations spiked during the drought-induced low-flows. 4 extreme months which followed were enough to push year 3’s percentage of site average breaches significantly above that of year 1. With climate change marching on, springs like that seen in 2025 will increase in frequency and intensity.
Of course, climate change exacerbates, rather than causes nitrate pollution. Urgent action is needed to curb sources of excess nitrates into rivers, primarily from agriculture and sewage, as the eutrophic effects of nearly half of all nitrate readings in year 3 of monitoring will have had significant negative effects on fish and the broader environment.
Ammonia levels are also considered within the Water Framework Directive with sites categorised as upland and low alkalinity or lowland and high alkalinity. The total ammonia 90-percentile ranges from 0.2 ppm to > 2.5 ppm. The standards for good ecological status (close to natural) in rivers and lakes are broadly in the range 0.3 – 0.6 ppm for ammonia, as annual means, as measured by the ammonia Colorimeter.
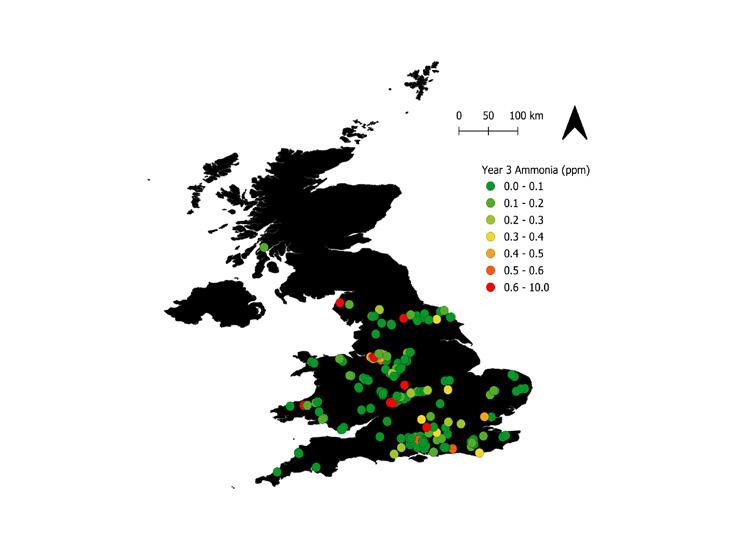
Figure 12. Map illustrating the location and concentration of ammonia levels monitored by the WQMN during Year 3 of their monitoring. Year 3 is from 17th July 2024 to 16th July 2025.
Volunteers are equipped with the Hanna Medium Range Ammonia Checker, which has an upper limit of 9.99 ppm, the lower test limit is 0.00 ppm with an accuracy of ± 0.05 ppm ± 5%. So, a 0.00 ppm reading does not mean there is no ammonia present, it will be between 0.00 and 0.05 ppm ± 5%. A 9.99 ppm reading does not mean that is the total ammonia, it means that it is in excess of 9.99 ppm.
The Hanna Ammonia checker is currently used by approximately 2/5 groups, being the most expensive and therefore, optional add on to the standard WQMN kit. Similarly to the phosphate
checker, it provides highly accurate data, though not as accurate as kit used by statutory bodies. As shown in Figure 12, compared to the upper limit of 0.6ppm, relatively few sites breach the 0.6ppm upper limit. However, when we look at the trends over the 3 years of data, there is reason for concern.
Whilst the overall proportion of breaches remains low, there is a marked increase in each sampling year, from 3.58% in year 1 to 4.49% in year 3. Figure 12 shows a similar pattern to nitrate, where there was a peak in the early data collection period as the WQMN number of sites remained low, followed by a highly variable monthly trend, with an overall upwards trend in ammonia concentration.
This is concerning because ammonia is toxic to fish, interfering with respiration and nervous system function. The Hanna checker monitors Total Ammoniacal Nitrogen (TAN), which includes both NH₃ (unionised ammonia) and NH₄+ (ammonium). A sample of higher-thannormal TAN does not necessarily mean that fish in that water body are exposed to toxic effects. NH₃ is highly toxic to fish, whereas NH₄+ has a low toxicity. The relative abundance of each chemical depends on pH and temperature. The abundance of NH₃, and therefore toxicity, increases in warmer, higher pH water.
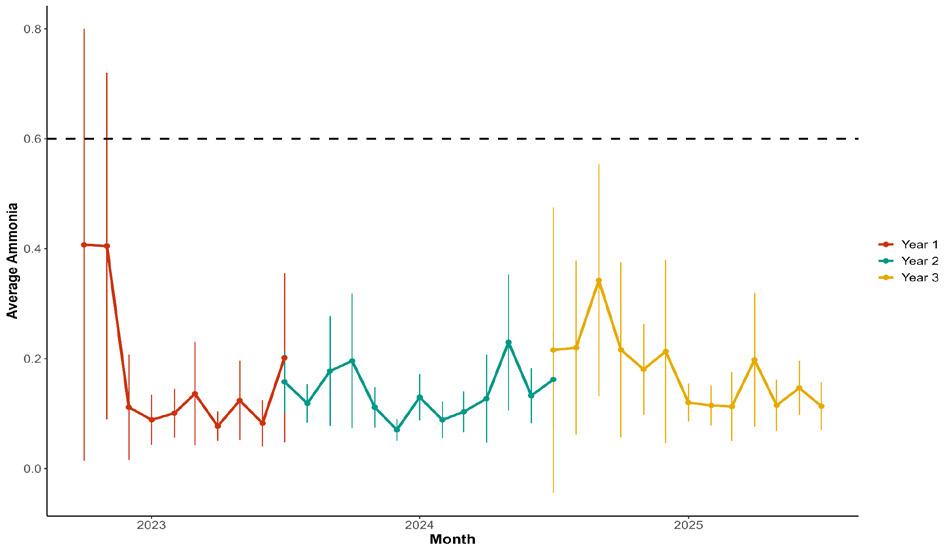
13. Monthly Averages of ammonia levels across the three years of the WQMN in ppm.
Error bars represent 95% confidence intervals. Black dashed line illustrates the benchmark of 0.6ppm.
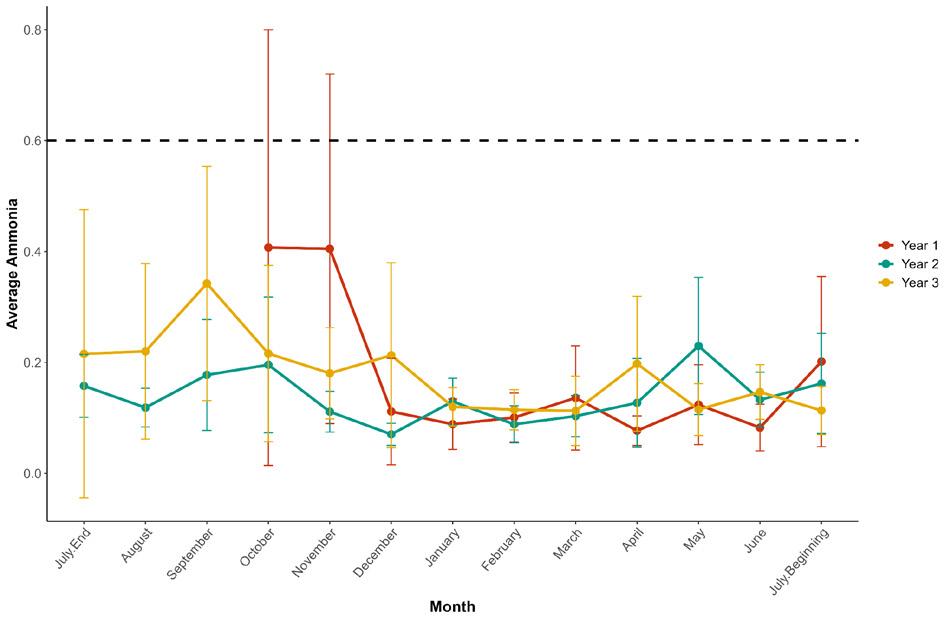
Figure 14. Monthly Averages of ammonia levels across the three years of the WQMN in ppm. Error bars represent 95% confidence intervals. Black dashed line illustrates the benchmark of 0.6ppm.
Figure 14 shows that ammonia levels do not vary as significantly as phosphate by season, but do have slight peaks in the winter months in late-summer and early autumn of year 3. This is concerning, given that these are also the months with the highest water temperature, meaning that the NH₃ concentration, and therefore toxicity, will be significantly elevated, given the higher TAN concentrations and high water temperatures.
Significantly elevated electrical conductivity (EC) can indicate that pollution has entered a river. A measure of EC cannot tell you what the pollutant is, but it can help identify that there is a problem that may harm invertebrates and fish. EC may be high in a river without any visible effects on the clarity of the river water. Any human activity that adds inorganic, charged chemicals to a river will alter the EC.
For example, EC may be higher in a river downstream of a sewage treatment works due to chemicals such as chloride and phosphate from household waste. Winter road runoff, containing salt, can be very high in electrical conductivity. If this runoff reaches rivers, then it may, depending on the quantity of water, temporarily elevate the EC in the river.
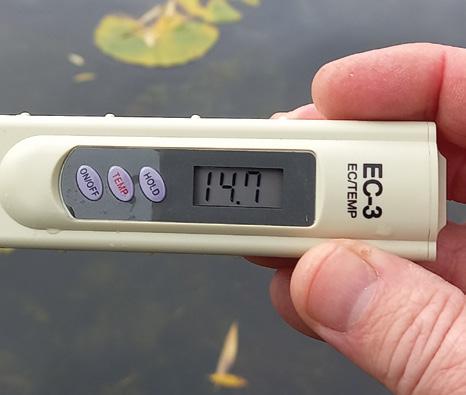
Electrical conductivity and water temperature are both monitored using the HM-Digital EC-3 device. This is an affordable piece of equipment, with a large range of 0 – 9990µS and high accuracy of +/- 2%. The resolution of the data is such that it increases in 1 µS intervals from 0-990 µS and by 10 from 1000-9999 µS. When taking samples, volunteers let the sample settle before measurement until the reading is stable.
Electrical conductivity has shown a worrying rise over the 3 years of WQMN sampling, as shown in Figure 16. Figure 15 shows a seasonal effect, with EC tending to increase through spring, peak in summer, and fall towards the winter in all 3 years. This is to be expected, as the solubility of electrolytes rises with increasing water temperature. It also shows the marked increase in EC from year to year. Year 3 had the highest average EC in every month apart from July.
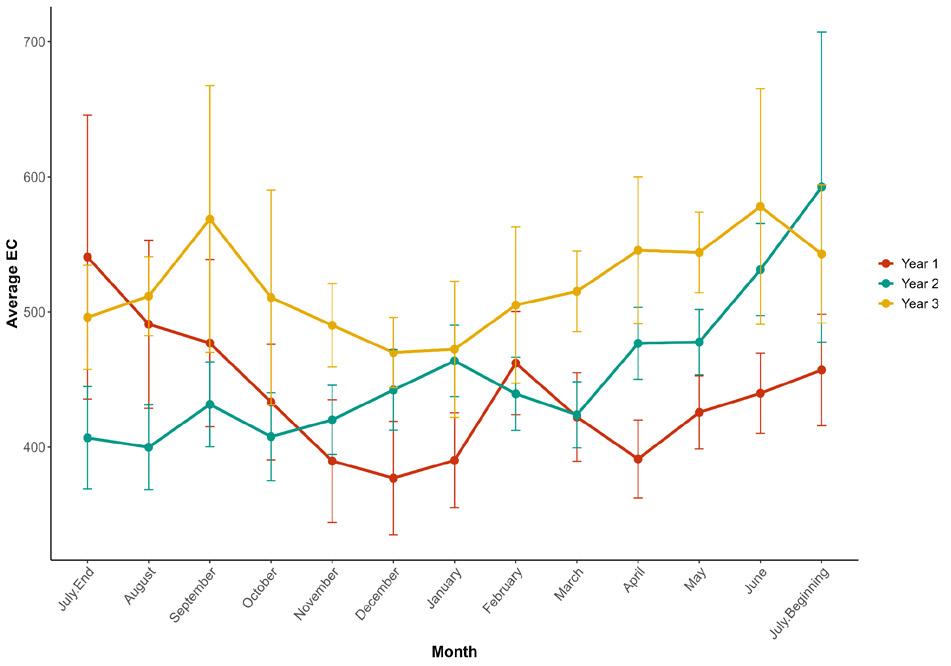
15. Monthly Averages of electrical conductivity levels across the three years of the WQMN in ppm. Error bars represent 95% confidence intervals.
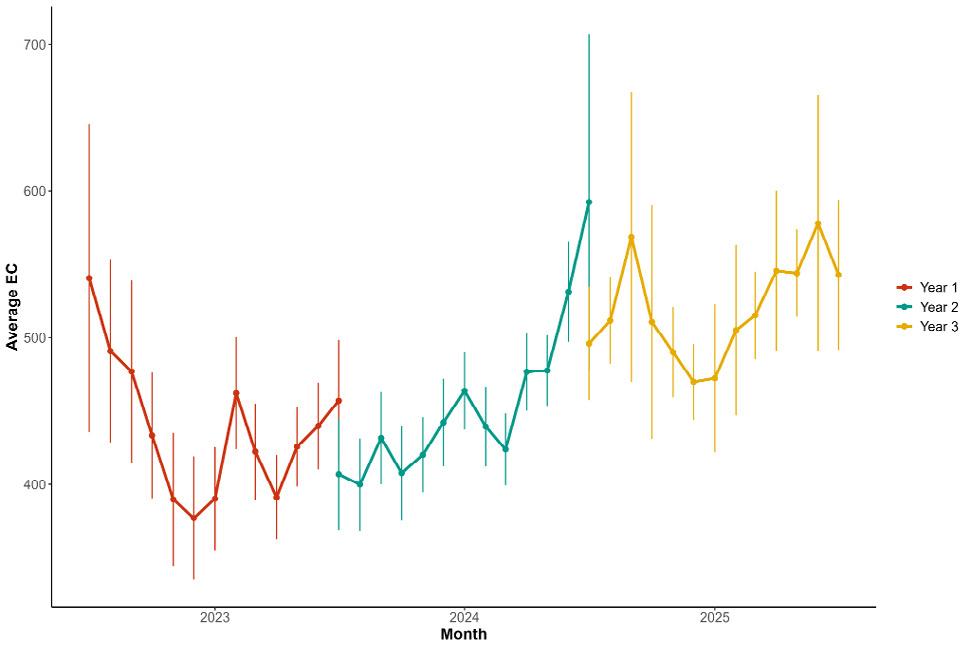
Figure 17 offers some explanation for the increase in electrical conductivity over time. 2 reasons account for the rising trend in EC. Year 1 exhibited the strongest positive skew, with readings focused on the left (low) of the diagram. Over the next 2 years, this skew weakened, and there was a significant increase in the higher readings in the range of 600800µS, increasing the average reading.
Secondly, there has been a significant increase in the number of outliers, with none above 2000 in year 1 but several beyond 2000 and even some at nearly 10,000 in years 2 and 3. This could be a sign of severe pollution events. However, it could be a sign of issues in data collection methodology, with older EC-3 devices deteriorating in accuracy. This may be explained by salts crystallising on the devices, leading to false high readings.
Error bars represent 95% confidence intervals.
Even with this potential inaccuracy, we can conclude with confidence that EC has increased over 3 years, given the previously discussed trend of diminishing positive skew. Further work is needed to identify volunteers with potentially erroneous devices to add confidence to this conclusion.
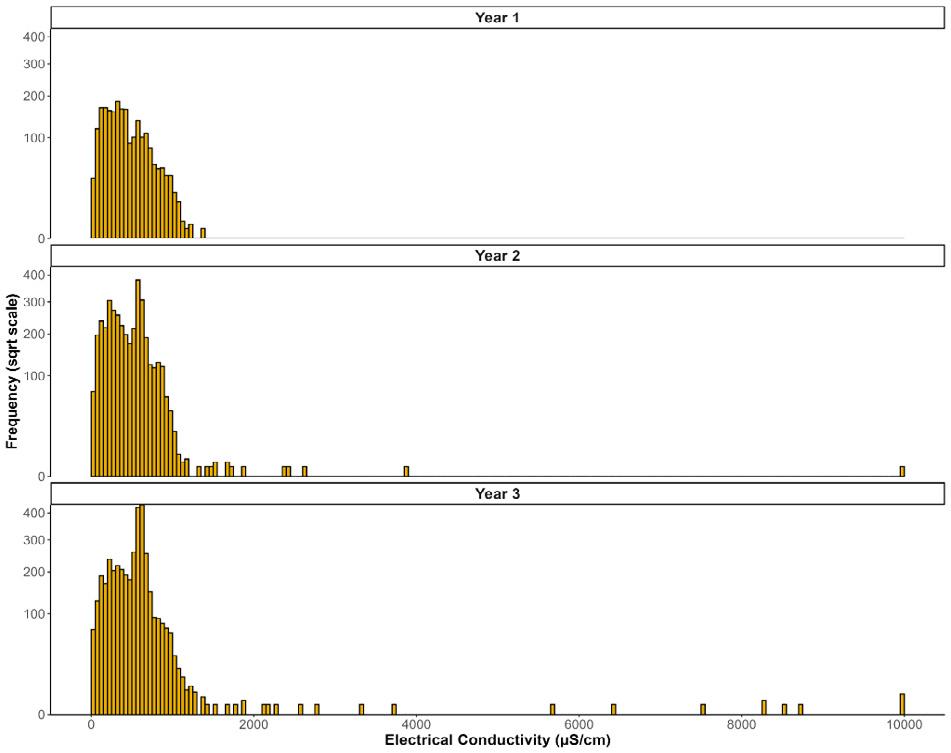
17. Frequency of electrical conductivity levels across the three years of the WQMN. The frequency axis has been transformed with a square root transformation method.

Four focus catchments are chosen due to their having the highest frequency of samples: Avon Warwickshire, Test & Itchen, Medway, and Swale, Ure, Nidd & Ouse Upper. This is owing to huge efforts in each catchment by key groups to build extensive WQMN volunteer bases, extensive investment in equipment. In this section, we look
at the data for each catchment and highlight some of the ways data has been used to drive campaigning. The criteria for being a focus catchment was that at least 200 samples were taken in any year, providing a large enough dataset to draw robust conclusions from the data analysis. Figure 18 shows the distribution
of samples per catchment, with the Avon Warwickshire and Test and Itchen catchments standing out with more than 400 samples in year 3, followed by Medway and the Swale, Ure, Nidd, and Ouse Upper catchments.
“NEARLY 300 SAMPLES WERE STILL COLLECTED IN EACH WINTER MONTH, WITH VOLUNTEERS EVEN SAMPLING ON CHRISTMAS EVE AND BOXING DAY.”

18: Number of samples per catchment in sampling year 3.
Alex Farquhar Angling Trust
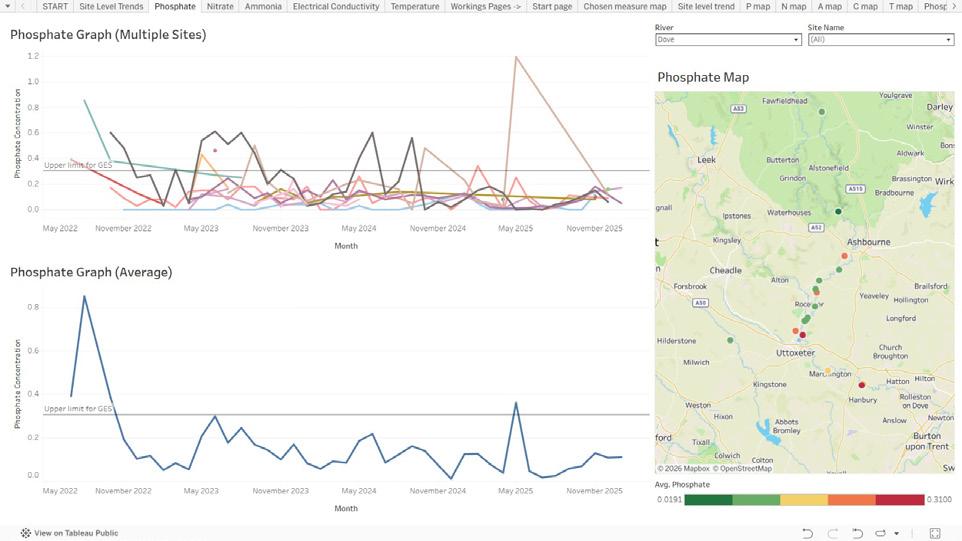
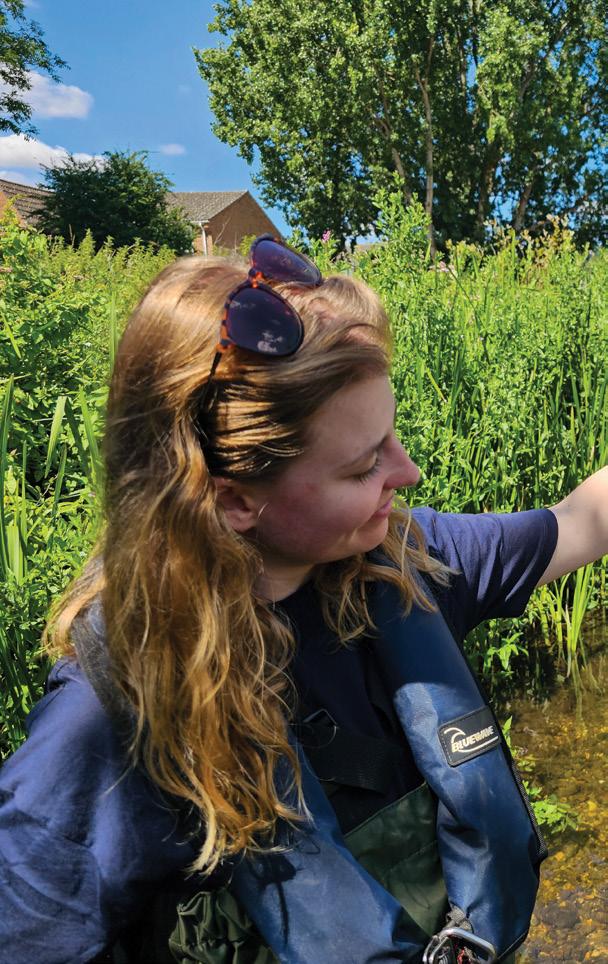
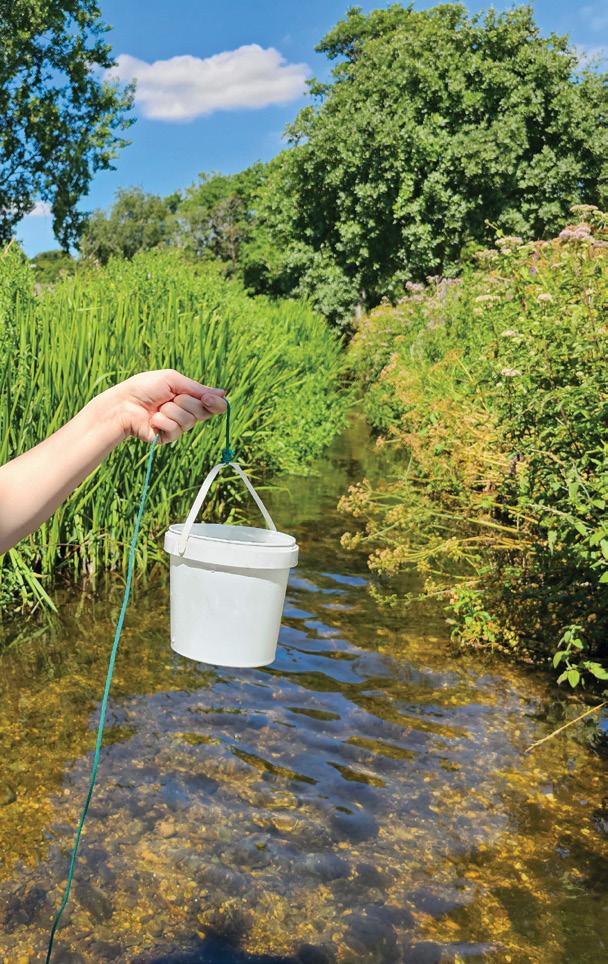
Table 1 shows a summary of key parameters for each focus catchment:
The Avon Warwickshire catchment remains one of the most polluted areas monitored by the WQMN. It is also the most sampled catchment, with 314 samples in year 2 and 421 samples in year 3, over 77 sites. There are signs of improvement in the catchment, with phosphate, nitrate, and ammonia on a downward trajectory.
Beginning with phosphate, 89.29% of samples breached GES in year 1, falling to 81.44% in year 2, and 74.91% in Year 3. Figure 20 shows that despite this improvement, almost all readings remain above GES. The catchment is still yet to record a single month where average phosphate concentration has fallen below the conservative upper limit for GES over 3 years of sampling. That’s 36 consecutive months where phosphate concentrations are high enough to cause significant eutrophic effects, with likely disastrous consequences for aquatic life. The improvements are welcome, but come from such a high baseline level of pollution that the catchment remains the most polluted of our focus catchments.
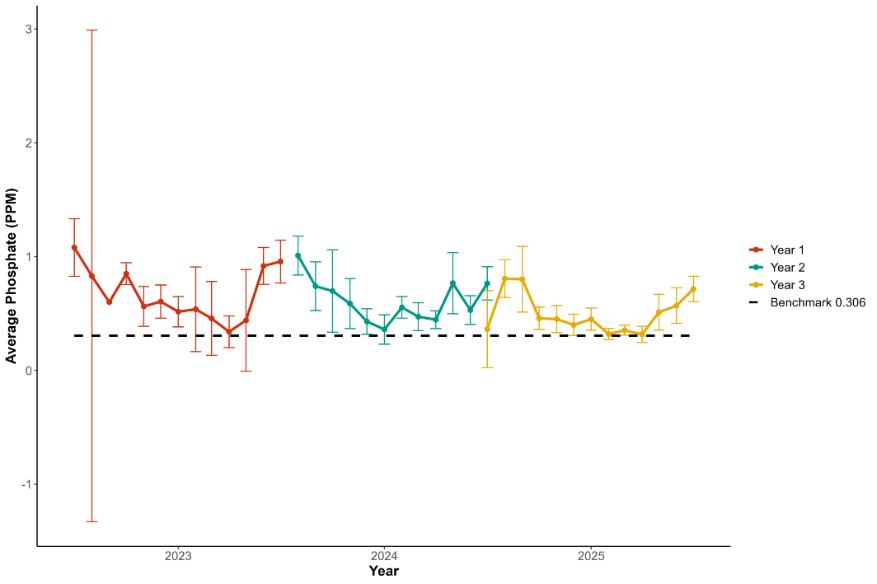
Figure 20. Monthly Averages of phosphate levels across the three years of the WQMN in the Avon Warwickshire catchment in ppm. Error bars represent 95% confidence intervals. Black dashed line illustrates the benchmark of 0.306ppm. This represents all samples, not just sites with 8+ samples per year.
The number of samples showing signs of nitrate pollution of 5ppm and above, rose from 82.72% in Year 1 to 86.62% in Year 2, before falling to 75.52% in Year 3. The improvements from Year 2 to 3 were most significant in the summer/autumn months from July(beginning) to October, as shown in Figure 21. Year 3 also saw the lowest recorded monthly average in July (beginning) and lacked the extreme spikes as seen in July(end) in 2022/23 and October in 2023/24.
Similarly to phosphate, the 11.1% fall in the number of samples greater than or equal to 5ppm nitrate is welcome. However, nitrate pollution remains endemic in the catchment, with only 3/36 months recording nitrate pollution levels where the average concentration fell below 5ppm.
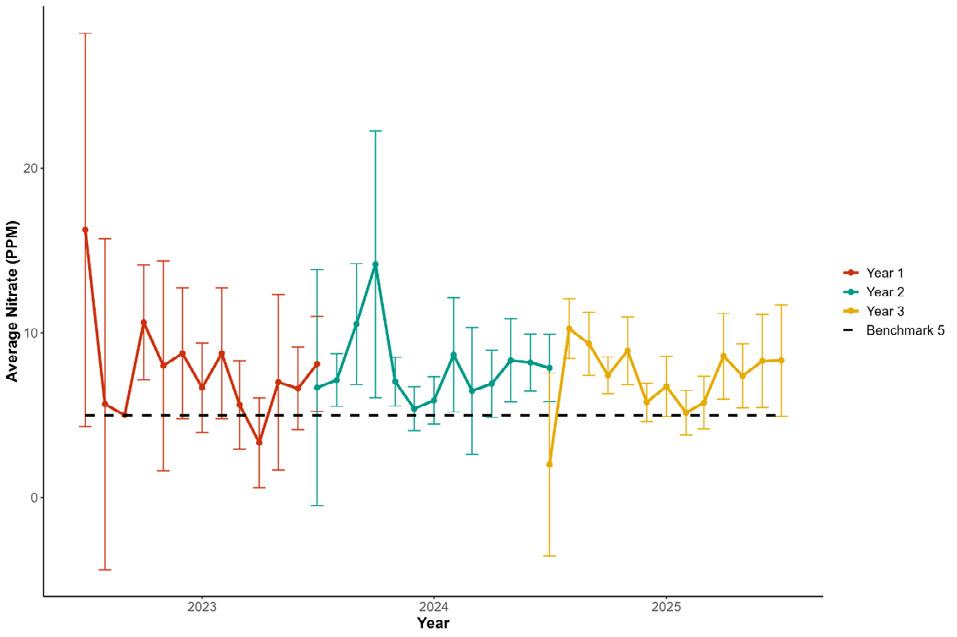
Figure 21. Monthly Averages of nitrate levels across the three years of the WQMN in the Avon Warwickshire catchment ppm. Error bars represent 95% confidence intervals. Black dashed line illustrates the benchmark of 5ppm.
The first year of ammonia results should be ignored because data was only collected in the last 4 months of the sampling year. There has been a slight fall in the percentage of ammonia samples breaching the 0.6ppm upper limit for GES, from 4.29% in Year 2 to 3.91% in Year 3. However, there is cause for concern for August 2024, which saw the monthly average breach the upper limit of GES. Due to the increased toxicity of total ammoniacal nitrogen in hotter water, this spike is especially concerning. The increase was due to 2 extreme results in August 2024 of 9.99ppm (max of the ammonia checker, so the concentration is at least 9.99pm) at Basil Brook. This extreme incident was covered in our
last annual report, which described how WQMN volunteer Caroline Warren reported the incident, caused by a blocked drain, which was swiftly cleared by Severn Trent Water.
Whilst the percentage of breaches of GES for ammonia has fallen from year 2 to 3 and now sits below the national average, any individual events such as that at Basil Brook has the potential
to cause significant environmental damage and often results in fish deaths. The groups in the Avon Warwickshire catchment have raised many environmental incidents with the EA and Severn Trent water to ensure the best chances of rapid response. Without volunteers’ feet on the ground, evidenced by the data, pollution events would be let to go on for even longer, causing greater damage.
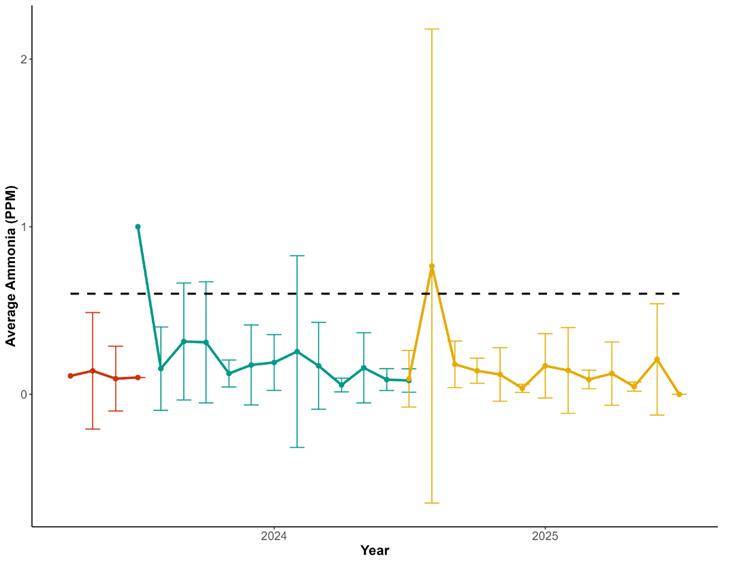
Figure 20. Monthly average ammonia across the three years of the WQMN in the Avon Warwickshire catchment in ppm. Error bars represent 95% confidence intervals. Black dashed line illustrates the benchmark of 0.6ppm
There was a rise from 736.99 to 745.86 from year 1 to Year 2 for average electrical conductivity. This fell marginally to 743.14 in year 3 (a 0.365% decrease from year 2 to 3).
Overall, the data should be interpreted as showing relatively stable conductivity over the long-term. The slight drop in year 1 occurred whilst the sampling effort was growing, as shown in September 2022 (the 3rd red point), where the extremely low average conductivity was the result of only a few samples. There were no samples taken in the Warwickshire Avon itself during this month.
Average electrical conductivity remains significantly higher than the average for the WQMN nationwide. Electrical conductivity is highly variable depending on local geological factors, which must be considered when comparing the catchment against those
elsewhere in the UK. However, given that nitrate and phosphates are both exceptionally high, it is likely that pollution has contributed to the elevated electrical conductivity in the Avon Warwickshire catchment.
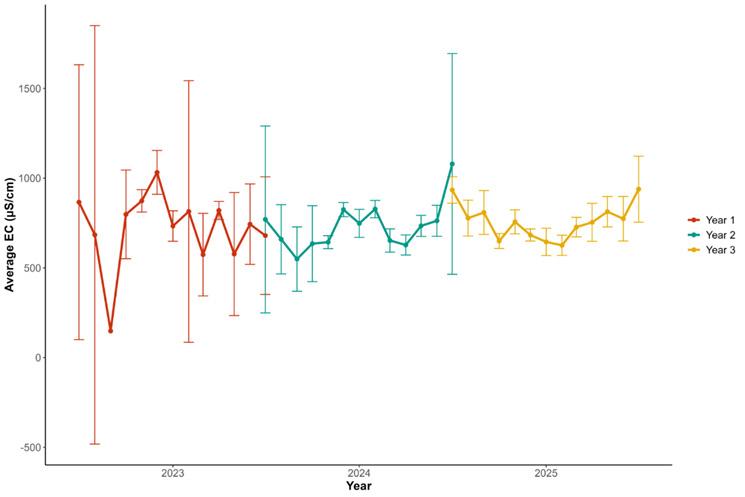
Figure 23. Monthly Averages of electrical conductivity levels across the three years of the WQMN in the Avon Warwickshire catchment in ppm. Error bars represent 95% confidence intervals.
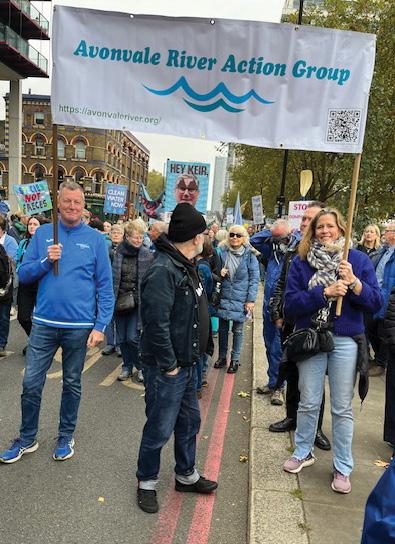
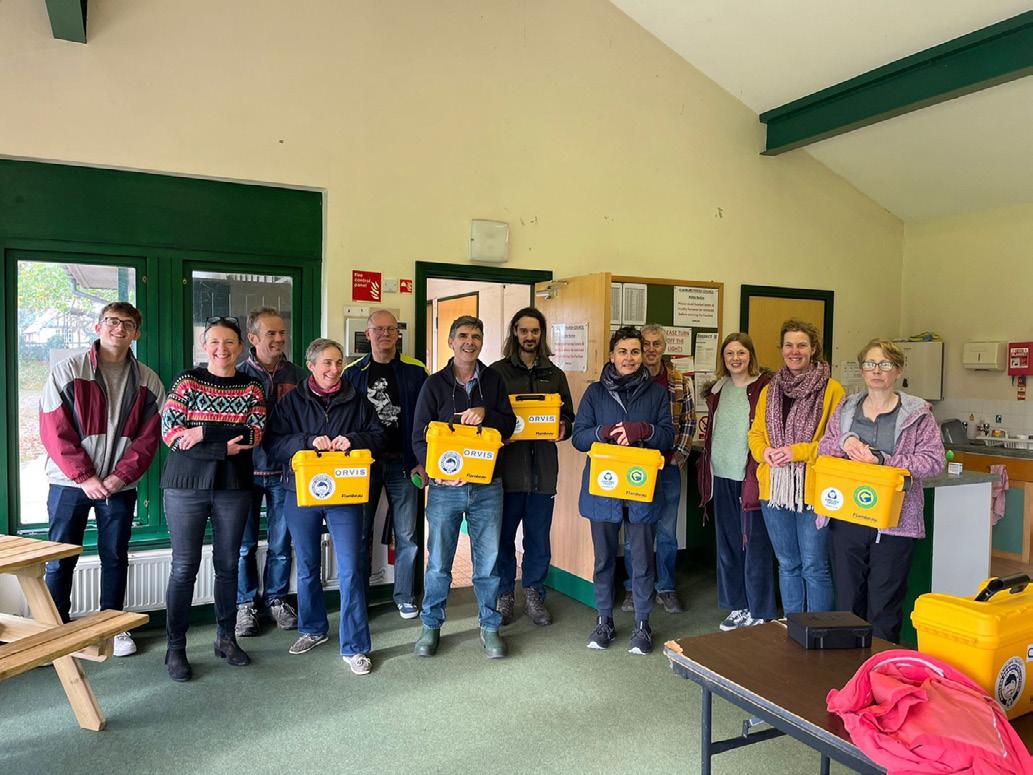
This update was provided by Steve Bowyer and Lou Bugg from the Avon Vale River Action Group, who have driven the immense sampling and campaigning effort in the Avon Warwickshire. It gives an overview of the Avon Vale River Action Group’s activities over the past 12 months.
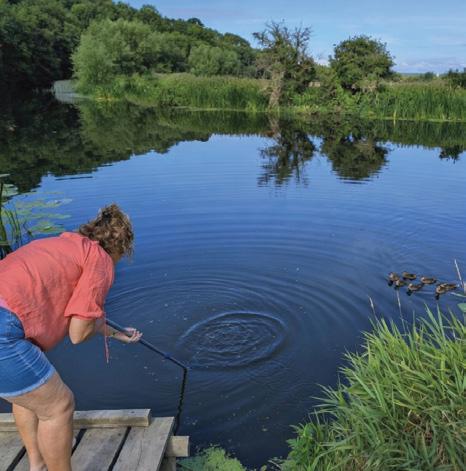
Our group of around 20 volunteers has continued its core citizen science activity of water quality monitoring along the River Avon, covering sites from Bidford to Eckington, contributing to the long-term dataset and attempting to identify pollution trends and incidents along this stretch of the middle to
ensure the quality of data that we are collecting. Additionally, some members contributed to the WQMN tap Water Phosphate Survey.
“MONITORING IS AT THE HEART OF AVONVALE RIVER ACTION GROUP’S WORK. DATA PROVIDES THE BACKBONE OF IMPACTFUL CAMPAIGNS.”
Neal
Cartwright Avonvale River Action Group volunteer and Treasurer
In addition to the monthly testing, the group has undertaken weekly E. coli testing at Bidford, Fladbury and Eckington.
These locations were selected based on the level of water contact activities that take place there such as swimming, paddle boarding, and canoeing. The initial funding for a single location was generously provided by Surfers Against Sewage, with our group self-funding the others. Our goal was to gain a better insight into water quality, short-term pollution events and potential sewage impacts, strengthening the evidence base for local water quality concerns.
We continue to respond to incidents reported to us. We have an online incident form and often receive reports through word of mouth. As a group, we have developed a positive feedback relationship with our local Severn Trent water company ranger.
Here are some examples:
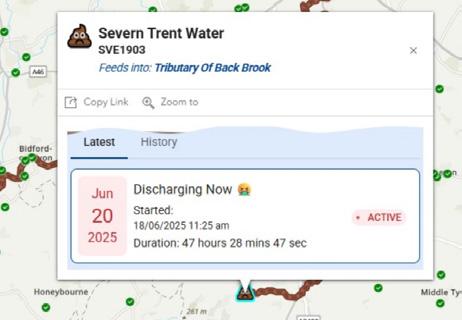
01/08/2024 Cropthorne - Basil Brook - high readings Blockage
01/03/2025 Evesham - Hampton Ferry - foaming
05/05/2025 Cropthorne - Elmley Brook - high readings EA ref 250522/KT04 - Elmley Brook land drain issue
15/05/2025 Birlingham - people unwell from irrigation spray
19/05/2025 Welford - fish stock decline
30/05/2025 Mary Brook - High Phosphate reading Steve has reported again to ST 05/10/2025
26/09/2025 Littleton - brook discoloured
Reported to EA and to Severn Trent. ST responded with information about the cause of the issue (misconnection from housing)
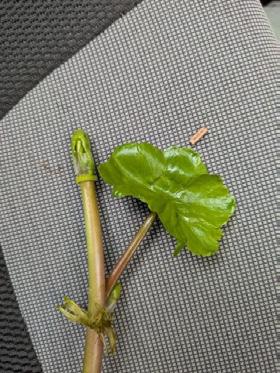
We are involved in the River Avon Floating Pennywort group with our volunteers reporting any
We now publish the results of our citizen science testing on our website through interactive maps and automated dashboards.
One of our group has created an email alert service where interested parties can sign up to receive a daily report of sewage spills into the Warwickshire Avon and its tributaries. Data is collated each day by SewageMap from the near real time Storm Overflow Hub, maintained by Water UK. On one occasion this year, the daily total exceeded 130 spills in a single day. This data is vital for identifying potential problem sites.
“VOLUNTEERS ARE THE AVON’S EYES AND EARS, SO THE RIVER ISN’T LEFT TO SUFFER IN SILENCE."
Steve Bowyer Angler and Avonvale River Action Group volunteer
These engagements have helped raise awareness of river health issues and the group’s role in monitoring and advocacy.
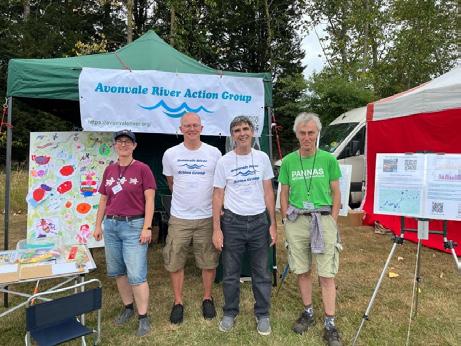
The Avon Vale River Action Group has actively engaged with the public through participation in local events, including:
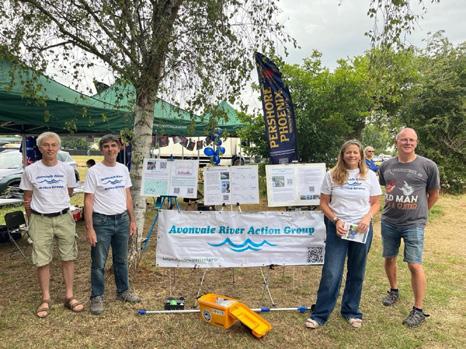
→ PERSHORE RIVER FESTIVAL
THE AVON AT PERSHORE PROVIDED THE PERFECT SPOT FOR MESSING ABOUT ON THE WATER LAST SATURDAY (JULY 19).
Despite inclement weather, thousands of visitors descended on the banks of the river to enjoy a variety of fun activities at the annual splash-tastic river festival.
Organised by the Avon Navigation Trust in partnership with Pershore Riverside Centre, the free event raised muchneeded funds for the youth charity.
Water-based pursuits included paddleboarding, boat trips and a bell boat regatta organised by Andy Train of Fladbury.
Try-it sessions in canoes and kayaks were on offer courtesy of Wychavon Kayak and Canoe Club.
On dry land there was a range of stands representing community groups, including the Avonvale River Action Group, who spoke to visitors about the work they are doing to monitor water quality.
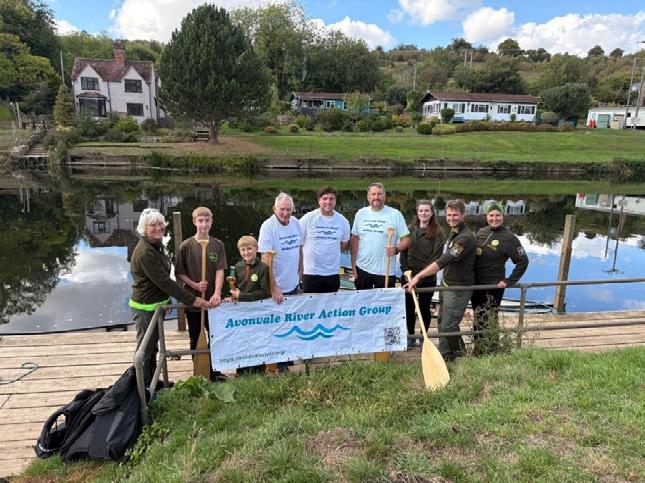
AT THESE EVENTS, GROUP MEMBERS SPOKE WITH MEMBERS OF THE PUBLIC ABOUT:
• The current state of the River Avon
• The group’s citizen science monitoring activities
• The importance of community involvement in protecting local rivers
→ VALE WILDLIFE HOSPITAL OPEN DAY
2.2
We are proactive in connecting with other groups such as SafeAvon and ROAR with our members attending meetings and events.
3.1 Attending the Wychavon Overview and Scrutiny Committee
We were invited again to attend the district council committee meeting to discuss water quality.
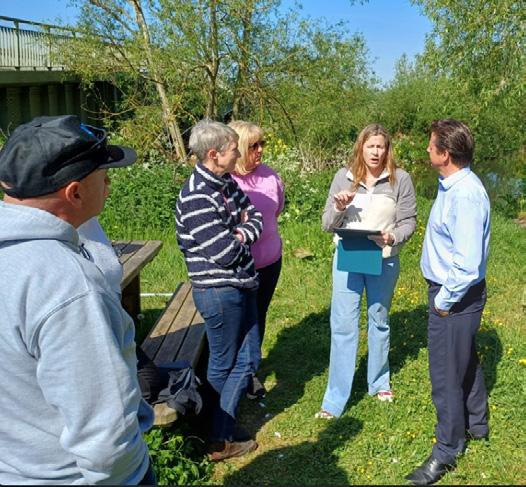
3.2 Meeting with Local Member of Parliament
• Introduce him to the Avon Vale River Action Group
• Explain the group’s citizen science activities
• Highlight local water quality concerns and monitoring evidence
3.3 Engagement with the Environment Agency
A meeting has been held with the Environment Agency, during which:
• The group received guidance on improving data quality
• Advice was provided on potential next steps, including the collection of ecological data alongside water quality monitoring
This engagement helped in providing methodology and confidence in the continuing development of the group’s monitoring activities.
Over the past year, the Avon Vale River Action Group has strengthened its collaborative work by becoming involved in wider citizen science and catchment-based networks:
• Participation in Testing the Waters, a coordinating citizen science initiative
• Involvement in the Warwickshire Avon Catchment Group, which operates as a subgroup of the Severn Catchment Group
• Participation in the monthly online WQMN update meetings
5.1 Transition to a Community Group
The group has developed plans to formalise its structure by:
• Becoming a recognised community group
• Establishing a bank account
This step will enable the Avon Vale River Action Group to:
• Apply more easily for external funding
• Support the continuation and expansion of the monitoring network
• Strengthen the group’s long-term sustainability and impact
On a lighter note, our founding member Lou Bugg received an award from the Angling Trust for her apparently ‘good behaviour’ or something like that…… Lou obviously realises that it was a team effort and still owes us all a drink!
Over the past 12 months, the Avon Vale River Action Group has:
• Maintained and expanded a robust water quality monitoring programme
• Improved data quality through calibration and additional testing parameters
• Engaged effectively with the public, elected representatives, and regulators
• Strengthened collaboration within regional citizen science and catchment networks
• Taken important steps towards formalising the organisation to support future growth
Together, these activities demonstrate a maturing and increasingly impactful citizen science group dedicated to improving our understanding and protection of the River Avon.
For 2026 our aim is to continue our groups commitment and potentially expand our wide range of activities.
In last year’s report, we heard from Andy Hammerton from Girling Angling Society (GAS), who reflected on the huge impact declining water quality is having on fish stocks. This year, Frank Bagley has provided an in-depth profile of fishery decline in recent years:
GAS has owned the Fishing rights to Fladbury Left Bank of the Warwickshire Avon since the 1940’s & many of our members have been within the Society for well over 40 years. For the last four seasons we have monitored water quality as such there is a wealth of experience & knowledge within the Society. The river & its species changes naturally over the years. Huge shoals of Dace are present in the Summer, years ago it was shoals of Bleak. Barbel breed in the weir pool & in the summer large Roach are present. Over the last few years we have seen a rapid decline in the ecology of the fishery caused by Pollution & Predation.
Water Quality Measurements have shown an alarming level of phosphate throughout the fouryear measurement period peaking at 1.34mg/l in June 2024 & averaging 0.7mg/l, with a minimum value of 0.22mg/l. The Environment Agency quote 0.1mg/l measured at Fladbury, a typical river value. The Society also measures electrical conductivity which is a measure of suspended solids with an acceptance value of 1000Us/cm. The Society has regularly recorded well above the acceptance value.
For the last four seasons, due to the high level of phosphate (nutrients) present we have seen an explosion of weed growth & prolonged periods of water clarity. Predation from Cormorants has increased alarmingly & we have problems with Otters. Visible foam smelling of detergent particularly during high water is an increasing occurrence & blackened river weed show the signs of pollution. Over the last three or four years we have noticed that Fish stocks regularly move downstream in November December leaving only Chub in the stretch with no other species present. This is true for upstream & downstream of Fladbury fishery.
The Society has archived seasonal tables of match results on their website for the last eight seasons. Proving this recent accelerated decline with data is difficult although the late Autumn decline in results due to fish migration is evident.
The chart shows excellent historic late Autumn match results 2018 to November 2022 but the last three seasons we have transferred the November & December GAS matches away from Fladbury due to extremely poor pleasure fishing results experienced during late Autumn.
The accelerated demise is obvious, high phosphate for the entire four years of recordings is indisputable. Increasing predation & accelerated growth of weed & prolonged water clarity are very evident with detergent foam now becoming a regular occurrence.
Where this leads to without a step change is complete decline of the fishery & a total loss
of fish stocks including the Barbel in the weir pool. This demise is threatening the longevity of the Society which has enjoyed & nurtured this natural fishery for over 85 years.
2018 5-14-0 / 4-15-0 / 4-9-0
2019 12-13-0 / 7-1-0 / 5-6-0
/ 3-15-0 / 3-10-0
/ 8-1-0 / 4-13-0
/ 1-1-0 / 0-9-0
2023 Match transferred from Fladbury Match transferred from Fladbury
2025
transferred from Fladbury Match transferred from Fladbury
"A COMMUNITY GATHERING AROUND ITS RIVER CAN BECOME A POWERFUL FORCE."
Louise Bugg WQMN volunteer and Chair of Avonvale River Action Group

Volunteers on the Medway have achieved impressive coverage in the catchment, amassing 702 samples in the 3 years of sampling. In this section, we present some data analysis, before providing an update from the Royal Tunbridge Wells Angling Society (RTWAS) on their network’s activities through the WQMN and beyond. RTWAS are a great example of where angling clubs have not only collected data to uncover pollution, but who have developed strong relationships with regulators and water companies, and worked to improve the habitat in their 10 mile stretch of river.
Figure 24 shows that phosphate pollution in the Medway catchment remains high. In the 3 years of sampling, there has been an improvement in phosphate concentrations, with 68.12% of samples exceeding good ecological status in year 1, 60.62% in year 2, and 44.3% in year 3.
This is a welcome improvement, but looking at sites which have been monitored regularly, the picture is more bleak. Looking at Figure 23, 12 sites are selected for having 24 or more samples, split over all 3 sampling years. 11 of these 12 sites have a 3 yearly average phosphate concentration above good ecological status. The only site to fall below the threshold of 0.306ppm is ‘Harpers Footbridge’ on the Teise, which has an average of 0.29ppm.
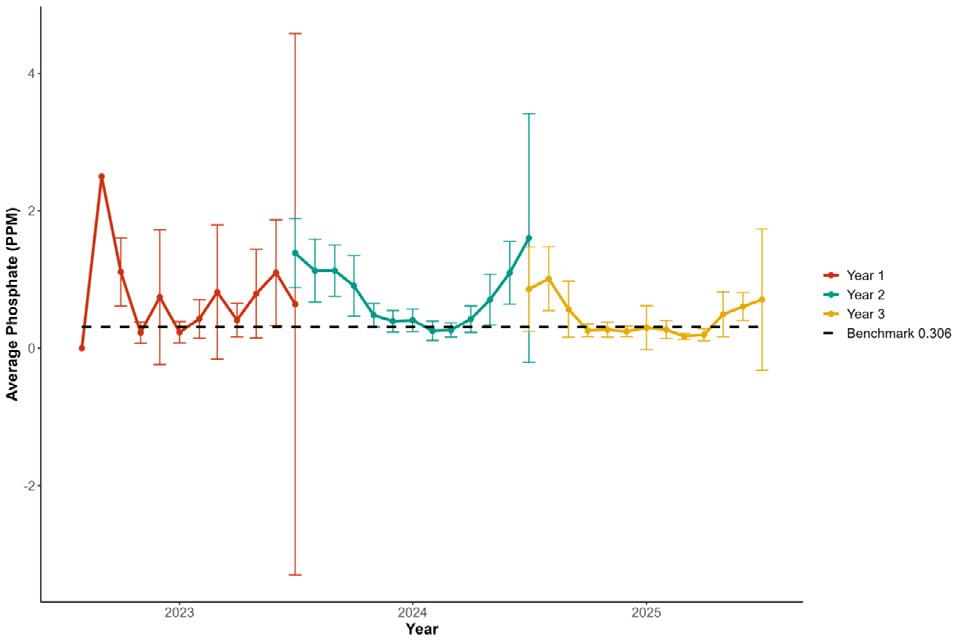
Figure 24. Monthly Averages of phosphate levels across the three years of the WQMN in the Medway catchment in ppm. Error bars represent 95% confidence intervals. Black dashed line illustrates the benchmark of 0.306ppm. This represents all samples, not just sites with 8+ samples per year.
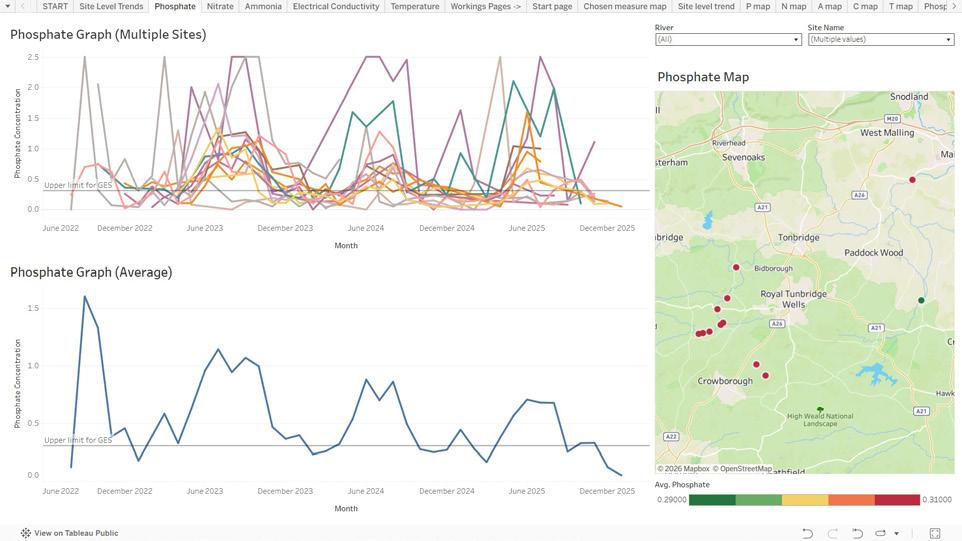
25. WQMN Online Map, produced by Angling Trust, filtered to show 12 sites selected for having 24 or more samples, split over all 3 sampling years, in the Medway catchment.

26. Monthly Averages of electrical conductivity levels across the three years of the WQMN in the Medway catchment in ppm. Error bars represent 95% confidence intervals.
The picture for both nitrate and ammonia has been mixed, with year 2 having the highest average concentration of each pollutant, peaking at 43.01% breaches for nitrate and 4.85% for ammonia. Nitrate, ammonia and electrical conductivity have each varied between years, rather than showing a pattern of increasing or decreasing concentration. It will be interesting to see the results going into the 4th year of sampling to determine what the long-term trend is beyond these variations.
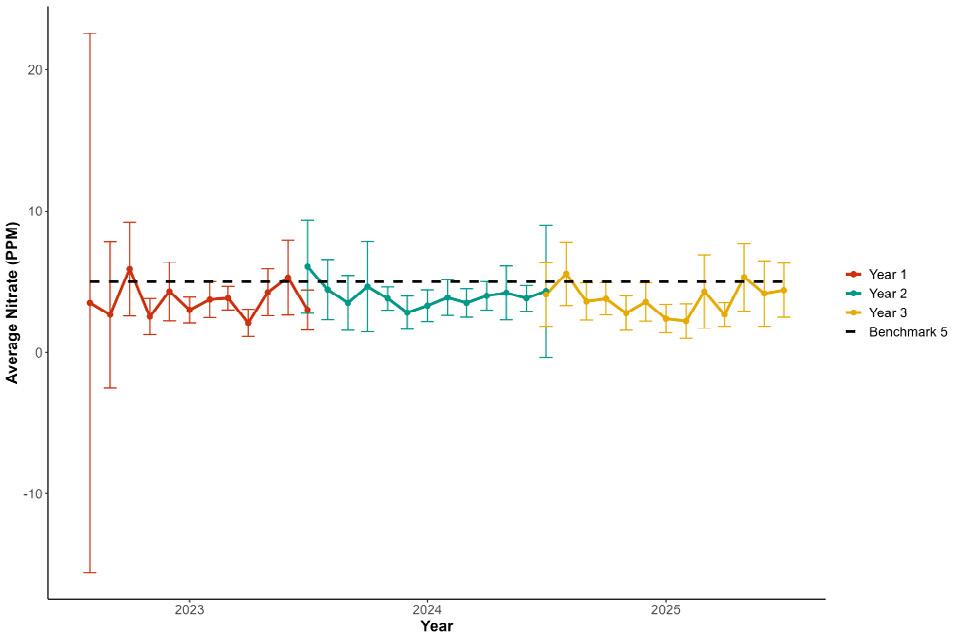
Figure 27. Monthly Averages of nitrate levels across the three years of the WQMN in the Medway catchment in ppm. Error bars represent 95% confidence intervals. Black dashed line illustrates the benchmark of 5ppm.
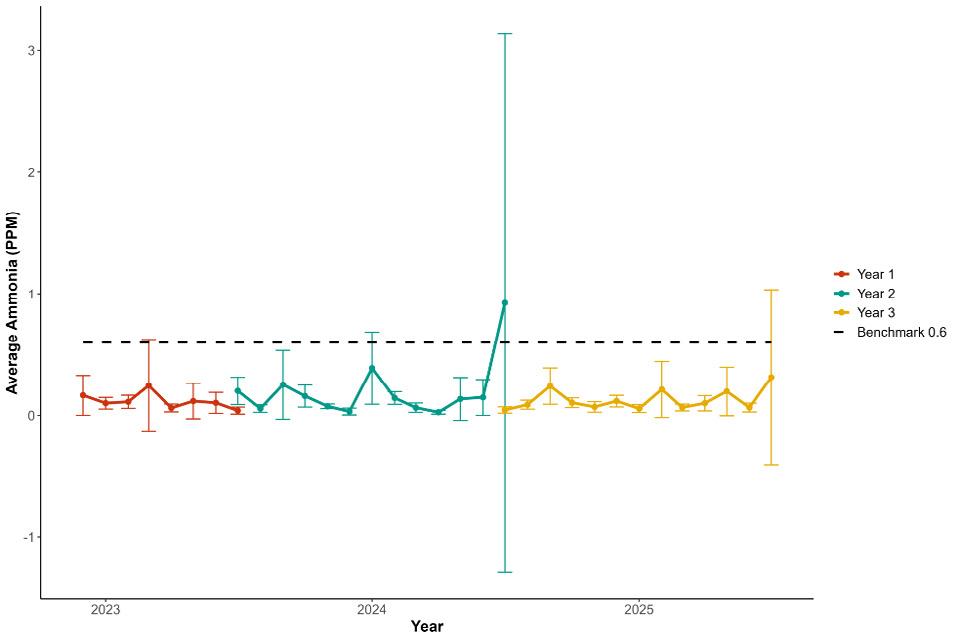
Figure 28. Monthly Averages of ammonia levels across the three years of the WQMN in the Medway catchment in ppm. Error bars represent 95% confidence intervals. Black dashed line illustrates the benchmark of 0.6ppm.
“THE COMBINATION WQMN NUTRIENT SAMPLING WITH RIVERFLY INVERTEBRATE MONITORING IS BUILDING A DETAILED PICTURE OF THE HEALTH OF THE MEDWAY."
Martin Mann RTWAS Fisheries Officer
ROYAL TUNBRIDGE WELLS ANGLING SOCIETY UPDATE
The following update was kindly provided by Ian Tucker of RTWAS following on from last year’s annual report.
• We have a team of 8 volunteers to cover the societies 10+miles of the Medway catchment
• We are also working with 4 other volunteers from local angling clubs using the AT WQMN
• Have close ties with Sussex University and Friends of the River Medway through their Ripple Effect Initiative They have their own database but share data
• This gives a network total of around 25+ volunteers keeping a very good eye on precious river and its tributaries
Have you had any stand-out campaigning successes this year?
• The first thing to mention is that we have had three major pollution incidents on the same stretch of the River Grom, a Medway tributary, in our area. This has been due to an antiquated main pumped sewer rupturing! The main could not cope with the pressure and volume asked of it. There was a significant fish kill during one of these episodes and the invertebrate life really suffered.
• Thankfully because of our network of volunteers and close ties with both Southern Water (SW) and the EA these breaches were mitigated relatively quickly and the effects on the main River Medway were negligible.
• Apparently, there are plans now within SW to replace this 2km main although timescales are still to be finalised.
• The RTWAS are now a recognised stakeholder, and very respected, in
the catchment and are very active members of the KCC Medway Catchment Partnership and South East Rivers Trust new initiative Water Quality Monitoring Group. Primary focus of these groups is networking and data/experience sharing.
• Through the work and measurements submitted to SW they have now taken on board our findings and employed new staff for the mapping and logging of all CSO’s - Better late than never!
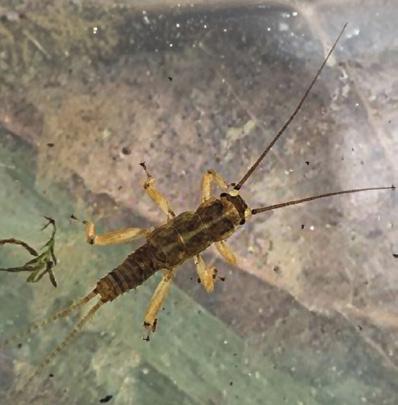
Medway Stonefly are increasing
Training day with Ripple Effect & Southern Water
Have you undertaken any other kinds of monitoring or restoration work?
» Still waiting however for the EA to set trigger levels for our sites
» You can view the results of our Riverfly surveys here
• The society has done a very significant amount of catchment maintenance and habitat improvement including:
» Flow defectors and planting
» Snag and blockage removal
» Dedicated swim creation
• Our RiverFly sampling group have been gathering and sharing significant amounts of data and now two volunteers are trained to
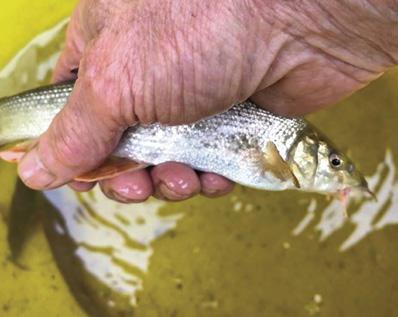
Our barbel are multiplying!
• We have had a number of issues with mink, so the Society is joining/giving access to the Waterlife Recovery Trusts Mink Eradication Project.
• Working with the Internal Drainage Board in the more efficient control of Giant Hogweed.
• Seeking to secure more grants from the AT (Fisheries Improvement Program), EA, and Southern Water for training, tooling, PPE and equipment.
River restoration in action

“The work of our testing team has made it all too clear that river water quality is seriously compromised. Whilst the structural solutions required are a horizon away, our maintenance work has focused on local mitigation through concentrated habitat improvements. Selective overshading cover removal, fencing cattle out of the river and flow enhancement measures have produced some regeneration of aquatic weed, abundant additional marginal plants and indications of a more mobile fish population.
We are partnering with the EA through the Fisheries Improvement Program to expand this work to further areas identified as suitable for an intervention.”
Martin Mann RTWAS Fisheries Officer

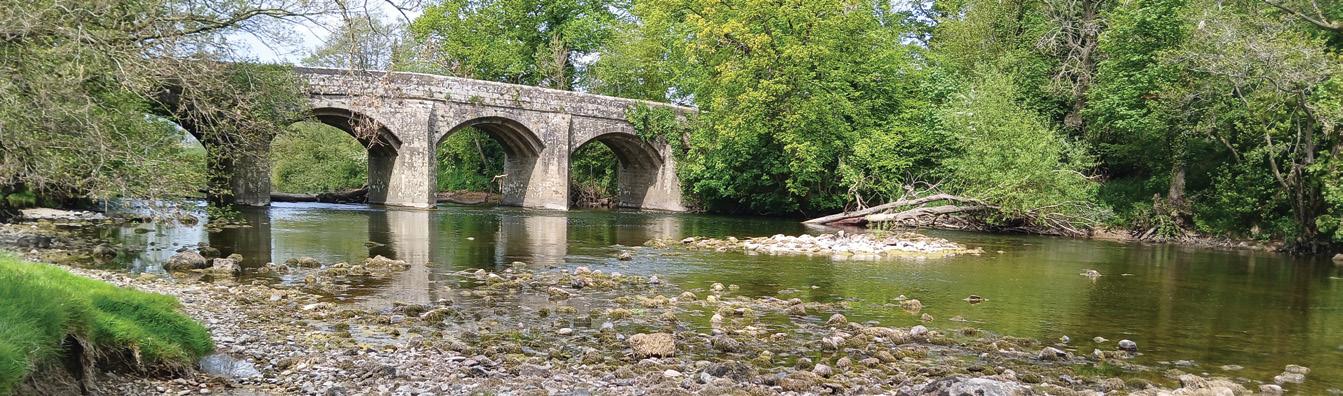
There has been a slight decline in both the number of sites monitored, and the total number of samples collected in the Swale, Ure, Nidd & Ouse Upper (SUNOU) catchment in the 3rd year of sampling. However, with 167 samples collected in year 3 (compared to 199 in year 1), it remains one of our most intensively monitored catchments. Sampling has become much more focused on a smaller range of sites, with an average of 3.98 samples per site in year 1, compared to 6.68 sites in year 3. This should be considered when interpreting the data, which suggests a worsening in nutrient pollution over the 3 years of sampling. Nitrate, phosphate, and electrical conductivity are all higher in year 3 than in year 1. Electrical conductivity provides the greatest reason for concern. There has been a significant year-on-year rise, from an average of 238.5 in year 1, to 283.28 in year 2, to 307.41 in year 3.
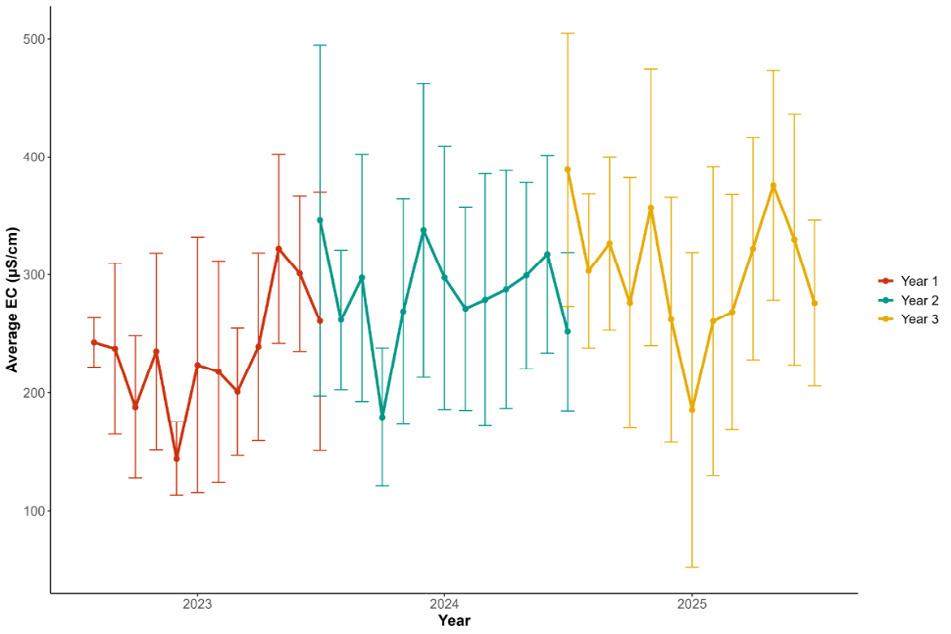
Figure 29. Monthly Averages of electrical conductivity levels across the three years of the WQMN in the Swale, Ure, Nidd and Upper Ouse catchment in ppm. Error bars represent 95% confidence intervals.

Phosphate breaches beyond 0.306ppm remain lower than the average in other catchments, but have shown a worrying rising trend. In year 1, the percentage of phosphate readings above 0.306ppm was 15.38%, falling to 9.19% in year 2 and rising again in year 3 to 16.67%. This roughly corresponds to the trend seen UK-wide, with year 2 experiencing the lowest phosphate concentrations. Figure 29 shows that very few monthly averages breached 0.306ppm, with the variability of results reducing significantly over the years, potentially due to the more focused sampling effort with more repeat sampling at the same sites rather than a more ad hoc method.
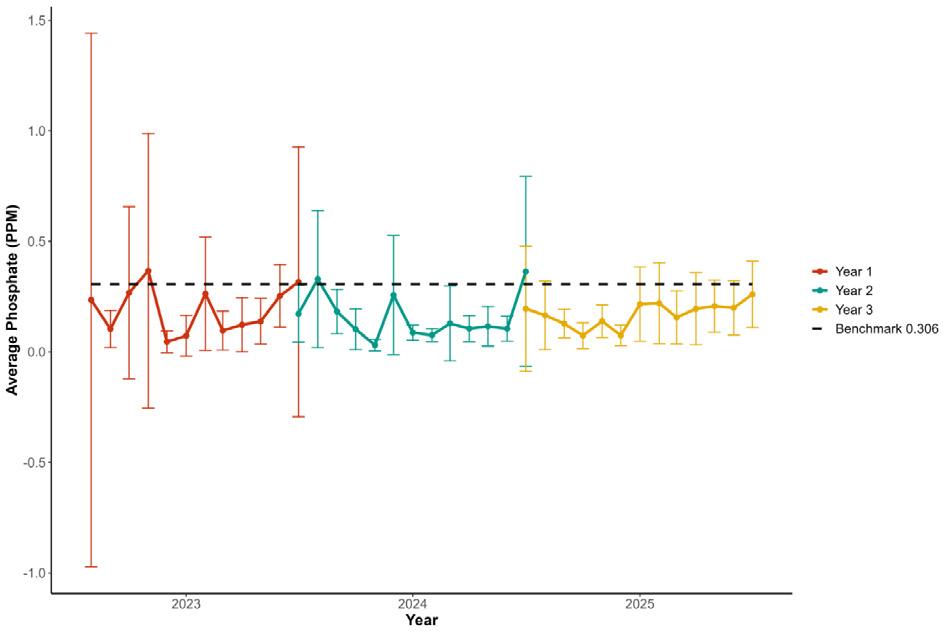
Figure 30. Monthly Averages of phosphate levels across the three years of the WQMN in the Swale, Ure, Nidd and Upper Ouse catchment in ppm. Error bars represent 95% confidence intervals. Black dashed line illustrates the benchmark of 0.306ppm. This represents all samples, not just sites with 8+ samples per year.
Nitrate concentrations have varied significantly between the sampling years. In year 1, only 8.54% of samples breached 5ppm, rising to 15.74% in year 2 and falling to 12.57% in year 3. Nitrate pollution in the SUNOU catchment remains lower than the UK average, with all monthly average nitrate concentrations falling significantly below the 5ppm line shown in Figure 30. However, the fact that both year 2 and 3 show significantly increased percentages of samples above 5ppm compared to year 1 is reason for concern.
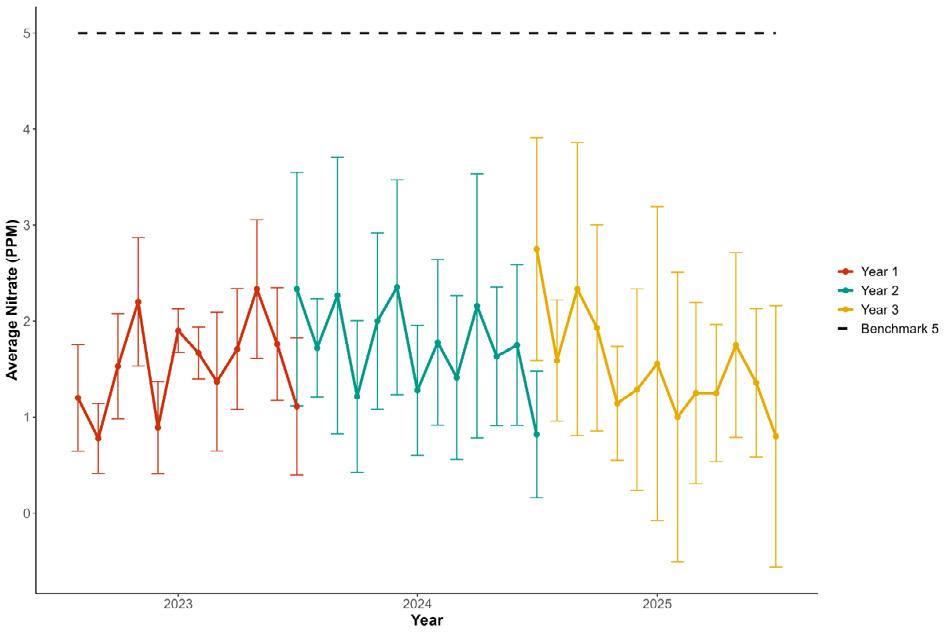
Figure 31. Monthly Averages of nitrate levels across the three years of the WQMN in the Swale, Ure, Nidd and Upper Ouse catchment in ppm. Error bars represent 95% confidence intervals. Black dashed line illustrates the benchmark of 5ppm.
The increase from 0% in years 1 and 2 to 2.27% samples breaching 0.6ppm ammonia in year 3 suggests a worrying trend. However, sampling frequency for ammonia (which remains an optional variable to add to the standard WQMN kit), is insufficient to draw this conclusion. This is reflected in Figure 32, which suggests a spike in ammonia in February 2025. However, this monthly average took into account only 1 sample, which was 0.44ppm at the Langton Pylon site. The first year of ammonia results should be ignored, since data was only collected in May, June and July. Further expansion of the number of ammonia checkers in the catchments is necessary to draw firm conclusions of changes over time.
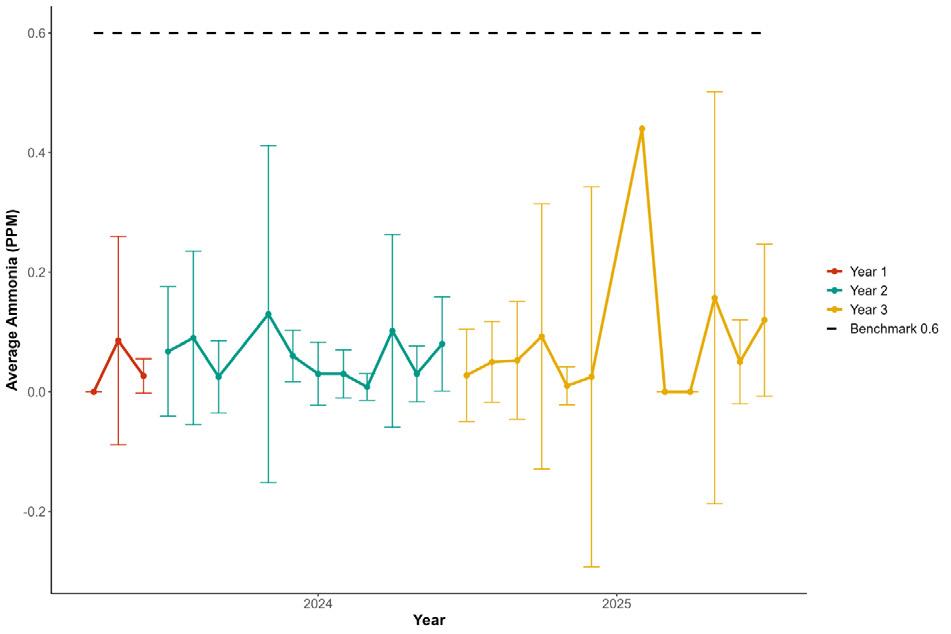
Figure 32. Monthly Averages of ammonia levels across the three years of the WQMN in the Swale, Ure, Nidd and Upper Ouse catchment in ppm. Error bars represent 95% confidence intervals. Black dashed line illustrates the benchmark of 0.6ppm.
Reviewing the River Ure, Wharfe, Nidd and Swale, volunteer Mike Grace, initially sponsored by Thornaby Angling Association, has collected 32 monthly water quality samples. Also volunteering with conservation activity on the Ure and tributaries, including bankside willow spiling to create fish fry refuges, stream improvements, etc.
Mike and other volunteers in the area have been deploying their Angling Trust WQMN kits, as well as driving progress with the campaign group Stop Ure Pollution (SUP), Yorkshire Dales Rivers Trust (YDRT), Lower Ure Conservation Trust (LUCT) and Riverfly Partnership invertebrate surveys.
Stop Ure Pollution was formed in summer 2024 at a public meeting in Leyburn. Attracting more than 70 residents and anglers concerned by the state of the river, and especially by the impact of raw sewage discharges. Citizen science is at the heart of the movement, with the YDRT hosting training events. The volunteering efforts on the Ure and its surrounding rivers has led to engagement with the Environment Agency, County Councillors and MPs. YDRT are extending
their Riverfly invertebrate sampling sites, with the training of new volunteers.
SUP carries out weekly laboratory analysis of samples from the Ure for E.Coli & other contaminants, supported by Surfers Against Sewage and led by fly fisher Prof. Dr Richard Loukota.
As part of the Surfers Against Sewage campaign, locals hope to attain bathing water status for at least one section of the Ure. This would be a powerful step forward, as it would legally require the Environment Agency to monitor the bathing site during the bathing season and implement the changes necessary to make progress towards improved water quality required for bathing.
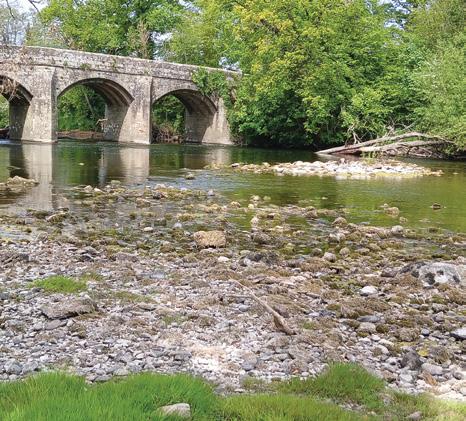
The Richmond and District Angling Society (RADAS) have been driving monitoring in their catchment on the Swale and the following update was kindly provided by Paul Price, member of the committee and trustee of RADAS.
As the Angling Trust prepares for the Third Annual Water Quality Monitoring Network focused on the River Swale catchment, it is useful to reflect on the meaningful activities and contributions made by the Richmond and District Angling Society (RADAS) over the past year. Our collective efforts have centred on promoting the ecological health of the River Swale, engaging community members, and addressing pressing environmental challenges.
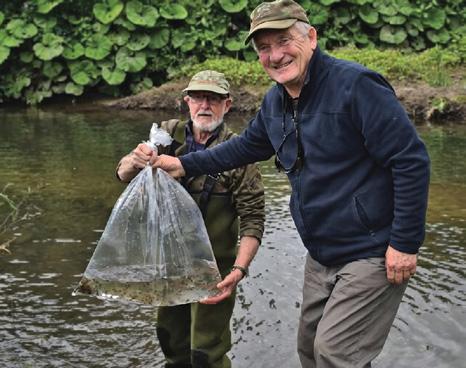
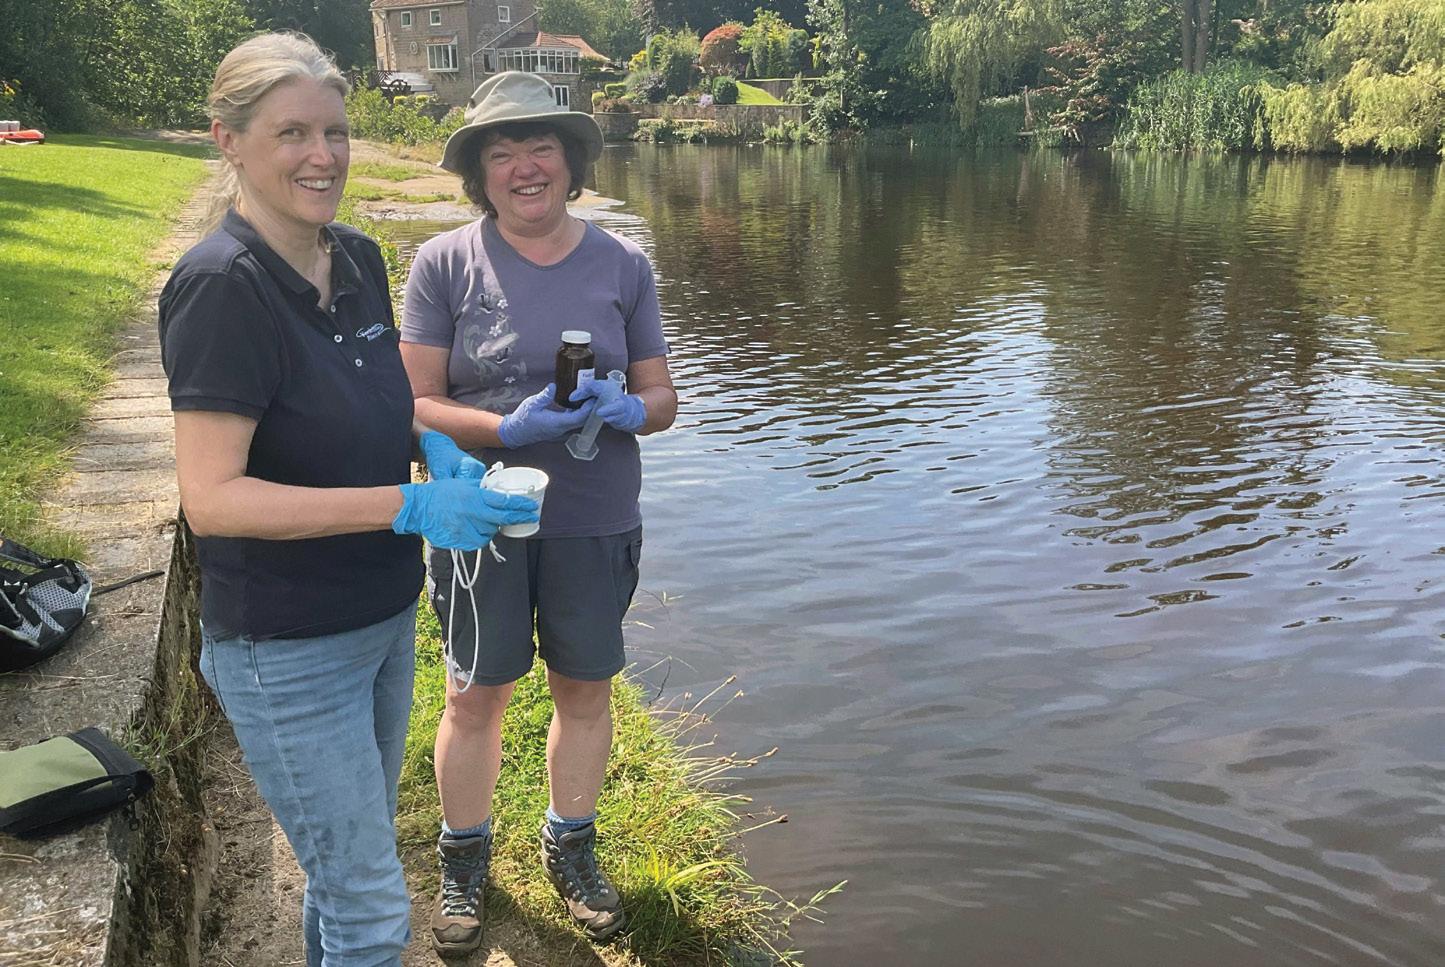
Under the leadership of Chairman Ron Wood, RADAS has been vocal in advocating for the protection and sustainability of the River Swale’s water quality. Throughout the year, we have actively participated in campaigns that raise awareness about the ecological significance of the River Swale and the need for its protection. Ron’s commitment to engaging various stakeholders has facilitated constructive dialogues surrounding sustainable practices and water conservation efforts critical to the river catchment.
One of the key initiatives we have supported is the Save Our Swale campaign, which aims to safeguard the river's health and biodiversity. In collaboration with local organizations and community members, RADAS has worked tirelessly to unite voices advocating for the preservation of our water resources. These collaborative efforts ensure that we advocate effectively for cleaner, healthier waterways and the overall well-being of the River Swale.
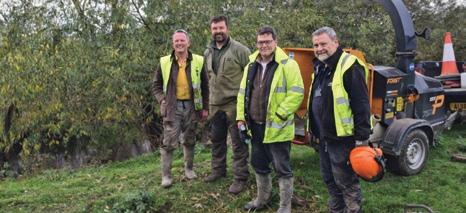
A cornerstone of our work this year has been the contributions of Paul Price, our “Citizen Scientist.” Paul has been instrumental in leading focused data collection and analysis initiatives aimed at understanding water quality in the River Swale catchment. His meticulous approach has enabled RADAS to identify pollution hotspots and specify areas requiring immediate attention.
By analysing trends and sources of pollution, Paul has provided insights that will be incorporated into the upcoming Water Quality Monitoring Network Review. The data obtained will aid in developing targeted strategies to address water quality concerns and contribute to the ongoing monitoring efforts within the catchment area.
RADAS remains committed to engaging the community. By fostering awareness and encouraging participation in local conservation efforts, we cultivate a unified approach to environmental stewardship. Initiatives aimed at engagement have not only strengthened community ties but also empowered individuals to take an active role in monitoring the health of the River Swale.
RADAS is enthusiastic about the potential for
future endeavours aimed at preserving the River Swale catchment. Our continued focus on collaborative restoration projects, enhanced data collection efforts, and ongoing community engagement will remain paramount as we work to combat the challenges facing our waterways.
In conclusion, the past year has marked a period of substantial progress for RADAS within the River Swale catchment, characterized by proactive initiatives and active participation from our community. We encourage all stakeholders vested in the health of the River Swale to join us in our efforts.
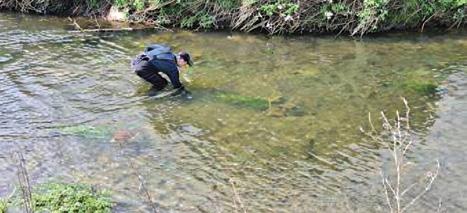
“LOCAL ACTION IS IMPROVING HABITAT, FINDING POLLUTION SOURCES, AND GIVING THE SWALE A FIGHTING CHANCE."
Paul Price
WQMN Volunteer, RADAS
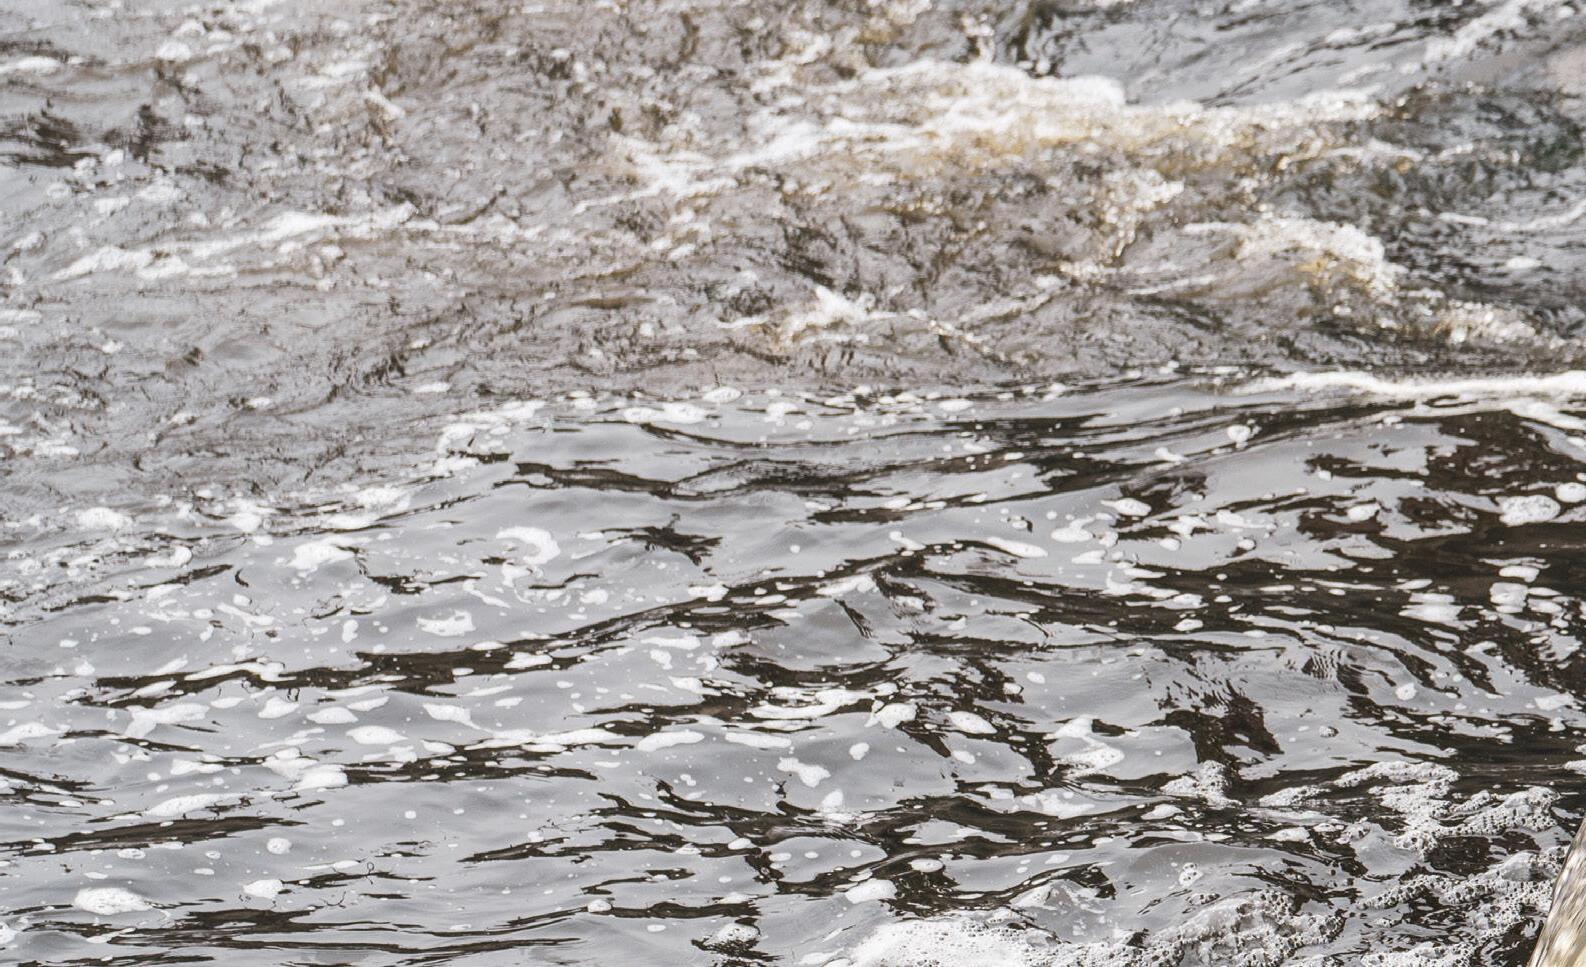
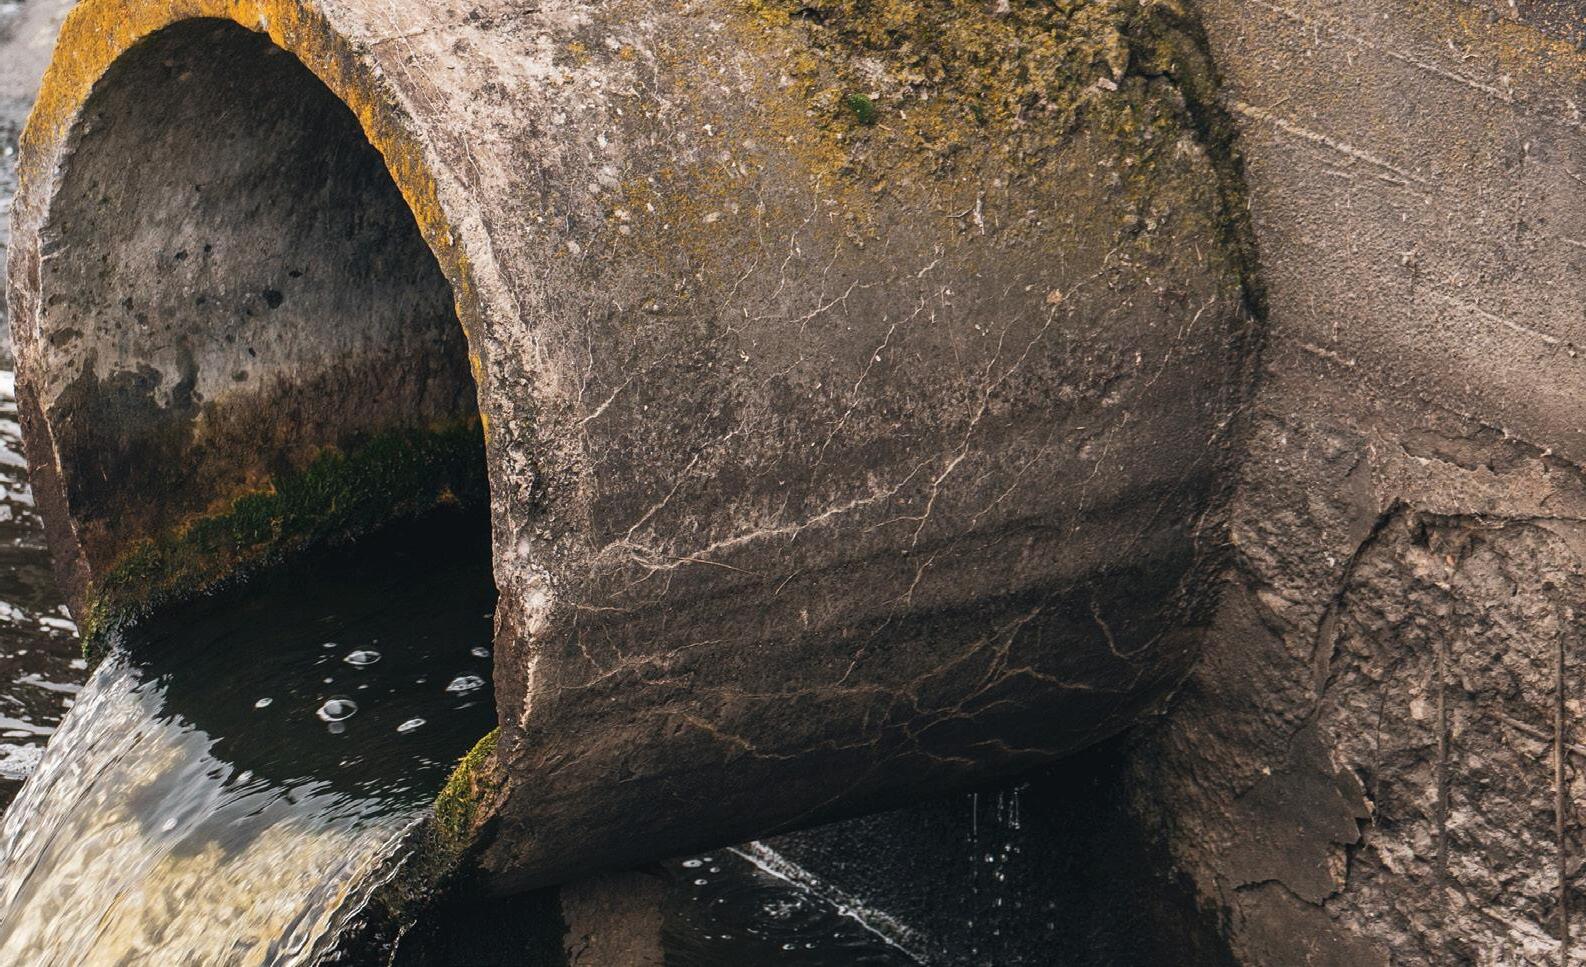
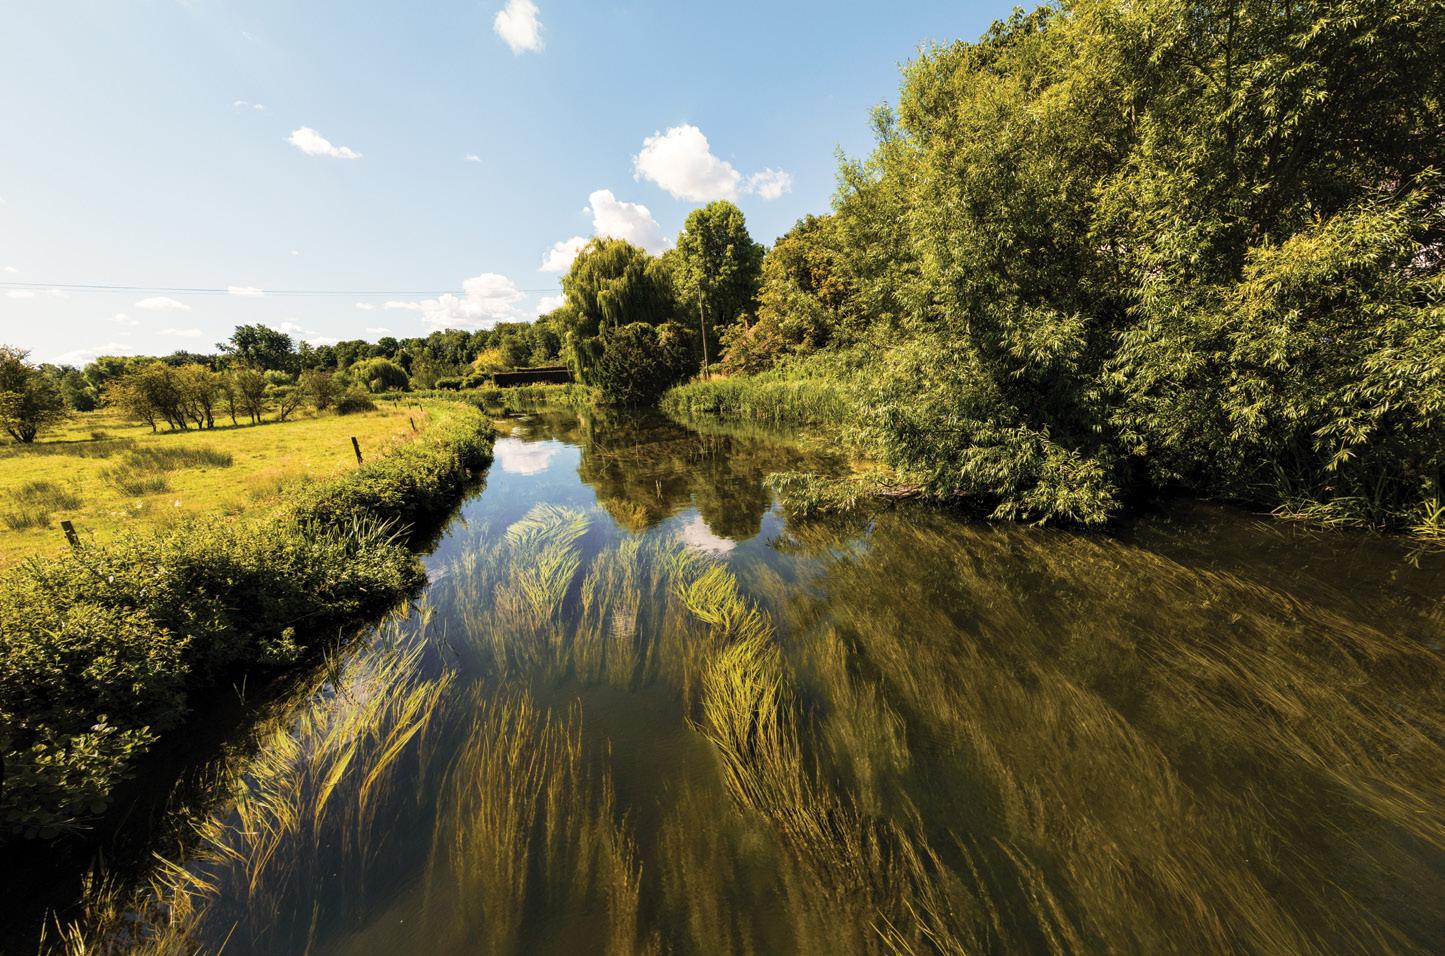
This section synthesises findings from two major citizen science initiatives: the Test and Itchen Association report (compiled by the Upper Itchen Restoration CIC, covering the Rivers Test, Itchen, and Meon) and For the Love of Water’s (FLOW) report, covering the River Avon Special Area of Conservation. Both reports highlight the urgent need for enhanced protection and more stringent water quality standards for our unique chalk stream ecosystems.
Chalk streams are among the rarest and most fragile riverine ecosystems on Earth, with approximately 85% of the world's total found in England. They are groundwater-fed, emerging from aquifers at a constant temperature and with naturally low nutrient levels. These "ecological arteries" support a unique abundance and diversity of life, including Brown Trout and a genetically distinct population of Atlantic Salmon. Beyond their biodiversity value, they
form the foundation of local economies and the angling tradition.
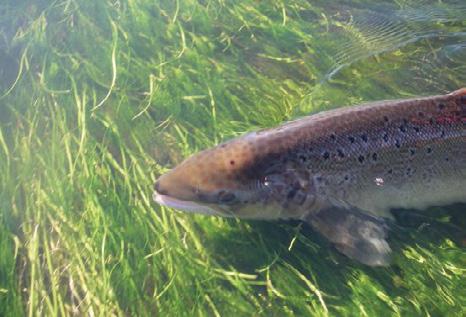
The Angling Trust and Fish Legal fought hard for a crucial amendment to the Planning and Infrastructure Bill, which would provide
vital protection for chalk streams from new developments:
“(6A) Where a strategy area includes a chalk stream, the spatial development strategy must include policies on permissible activities within the area of the stream for the purposes of preventing harm or damage to the stream or its surrounding area.”
As was the case with many environmental protections, following strong support in the House of Lords, Amendment 6A was rejected in the House of Commons. The Planning and Infrastructure Act received Royal Assent in December 2025 and has now become law. It is intended to speed up the planning system so homes, transport, energy projects and other developments can be approved and built faster.
The Bill prioritises speed and delivery, and the risk is that nature and rivers take the hit first, with damage that’s hard (or impossible) to reverse once developments are built. Considering central government’s failure to enact necessary changes to the legislation to protect nature, we will continue to fight for chalk streams across local and national government to ensure that development does not come at the cost of these most precious habitats.
Furthermore, the Government’s surprising decision to abandon the Chalk Stream Recovery Pack (the one targeted, evidence-based programme designed specifically to restore these rivers) has left them dangerously exposed. The government claims the Pack “falls short” of their
wider ambitions to clean up rivers, lakes and seas. Yet without it, and without the protections proposed in the amendments to the Planning and Infrastructure Bill, chalk streams risk becoming collateral damage in an accelerated growth agenda.
Natural England’s ‘favourable condition’ versus WFD’s ‘good ecological status’
Far from backing the Government’s move to potentially increase pressures on chalk streams via the Planning and Infrastructure Act, the science supports stricter protections. Natural England has set targets for stricter phosphorus levels for some 27 catchments, including the Itchen. For this iconic chalk stream which is designated as a Special Area of Conservation (SAC) and a Site of Special Scientific Interest (SSSI) for almost all of its length, this reflects the fact that chalk streams are naturally nutrientpoor ecosystems, uniquely sensitive to even low levels of contamination (Natural England, 2025).
Naturally, chalk streams emerge from aquifers with negligible levels of Soluble Reactive Phosphorus—often less than 0.01 mg/l in the upper reaches. Phosphorus is identified as the limiting nutrient in these waters, meaning even small increases can trigger harmful algal growth and the decline of sensitive species.
Throughout this report, we have applied the conservative upper limit of 0.1mg/l (PO4-P),
which converts to 0.306ppm (PO4), as given under the Water Framework Directive (WFD). The report argues, endorsed by the Angling Trust, that the WFD standards set out for ‘good ecological status’ (GES) for nutrients are too high for healthy chalk streams, given that they are naturally nutrient poor.
For the Test, Itchen and Meon catchments,
Natural England set out 2027 targets for ‘favourable ecological condition,’ which provides site-specific targets for phosphorous on these Hampshire chalk streams where there are protected river sections, i.e. a site is designated either as Special Area of Conservation (SAC) or Site of Special Scientific Interest (SSSI). These targets are generally one-fifth to one-half of the WFD upper limit for GES.
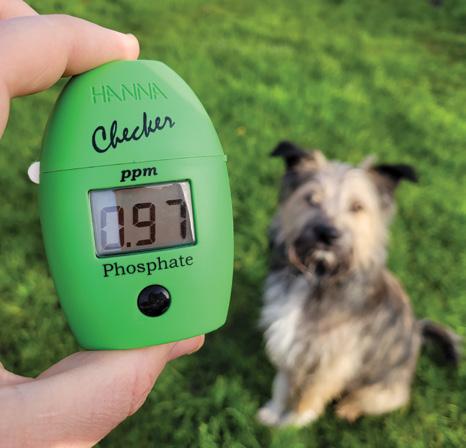
Before diving into the detail in the Test and Itchen and Hampshire Avon reports, Isla Thorpe from the University of York performed analysis of the data in both catchments, as well as the Loddon & Trib catchment. A 100m buffer was applied to designated chalk streams to identify 1,314 samples taken across the Test & Itchen, Avon Hampshire, and Loddon & Trib catchments.
Taken from the Test & Itchen report, a revised limit of 0.04mg/l PO4-P, being the highest Natural England target for any site across the Test, Itchen and Meon, was applied. It should be noted that this maximum is, in fact, slightly higher at 0.05mg/l in the Avon Hampshire. However, figure 33 gives some indication as to the impact of a lower limit being applied to chalk streams.
In the Test & Itchen catchment, the result is profound, with only 5.5% of samples breaching 0.1mg/l under the WFD, whereas 39.9% (a sevenfold increase) breached 0.04mg/l under the highest Natural England target on the Itchen. This reveals that, by applying WFD limits, results in what we might term a ‘good status illusion,’ whereby sites can seem to meet good ecological status limits under the WFD, but by applying the lower, more ecologically relevant targets of Natural England, the reality is far more severe.
Figure 33. Percentage of samples breaching 0.123mg/l and 0.306mg/l for Phosphate (PO4) in Avon Hampshire, Loddon & Trib, and Test & Itchen catchments.
The Test, Itchen and Meon report was published by the Test and Itchen Association, by the lead authors Ian Diver, and Martin Miles of the Upper Itchen Restoration CIC and Paul Vignaux of the Test and Itchen Association. Volunteer engagement is exceptional in the catchments, where volunteers analysed more than 800 samples across 60 sites.
The report proposes ‘Upper Safe Limits’ (USLs) for healthy chalk streams, covering the nutrients phosphate, nitrate and ammonia, as well as temperature which is important for salmonid fish which rely on cool, oxygen-rich water.
The report identified a high number of exceedances of proposed Upper Safe Limits (USLs) — limits tailored to the sensitivity of chalk streams rather than generic national averages:
• River Test: 177 total USL breaches (9% of samples), with excessive phosphate in 36% of tests.
• River Itchen: 164 total USL breaches (7% of samples), with excessive phosphate in 54% of tests.
• River Meon: 93 total USL breaches (16% of samples), with excessive phosphate in a staggering 88% of tests.
The report also highlights the nitrate time bomb, where nitrate levels are gradually rising. This is a predicted legacy of historical agricultural fertilizer use, as water can take centuries to
move through the chalk aquifer. Nitrate levels now frequently exceed WHO drinking water standards (11.3 mg/l NO3-N), threatening the viability of local boreholes and raw water abstraction.
Although multi-decade data from Environment Agency sampling do show a decrease in phosphate from a peak around the millennium due to the introduction of stripping at sewage treatment works and a tightening of discharge permits on the Itchen in the early years of this century, volunteers continue to find regular phosphate spikes which can be ignored by the annual average approach under WFD.
Their findings echo Natural England’s recent assessment of the Itchen (Natural England, 2025):
“... new and challenging pressures are coming to light ... some successes but, in the most part, urgent action is needed to address serious issues. Water quality is seriously impacted in most sections of the river.”
The report concludes by making 7 key recommendations, endorsed by the Angling Trust:
1. Regulators should tighten licence limits on all discharges into our chalk rivers, including wastewater treatment plants, fish farms, watercress beds and agricultural discharges
2. Southern Water should fit phosphatereducing systems to the final effluent outfalls
of all their wastewater treatment works
3. Householders should be made aware of phosphate inputs from their household cleaning and personal care products, with support to make genuinely environmentally friendly choices; this support should include better labelling and phosphate removal at source
4. For those households not on mains drainage which generate small sewage discharges, best practice in maintaining package treatment plants and septic tanks should be promoted, together with improved permitting and inspection
5. Southern Water should reduce their continuous phosphate dosing of our drinking water
6. Farmers should work to reduce run-off pathways into rivers, and adhere to the Farming Rules for Water regulations
7. Politicians should heed calls for greater protection for our precious chalk streams. Setting and applying different standards for phosphate should be part of that protection
“ENGLAND’S CHALK STREAMS ARE SOUNDING THE ALARM. THE EVIDENCE GROWS STRONGER EVERY YEAR, AND CITIZEN SCIENCE CAN NO LONGER BE IGNORED.”
Ian Diver Director, Upper Itchen Restoration CIC
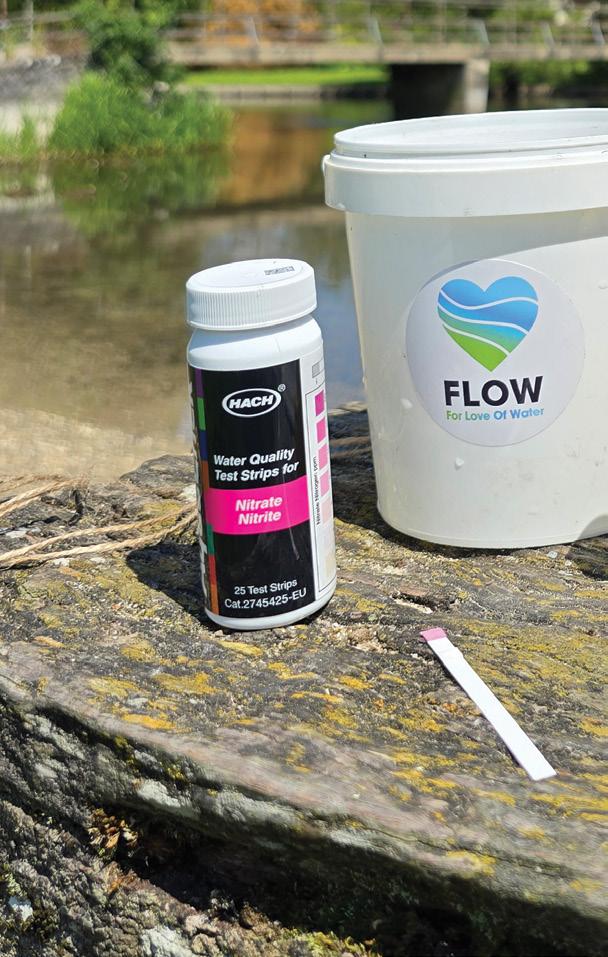
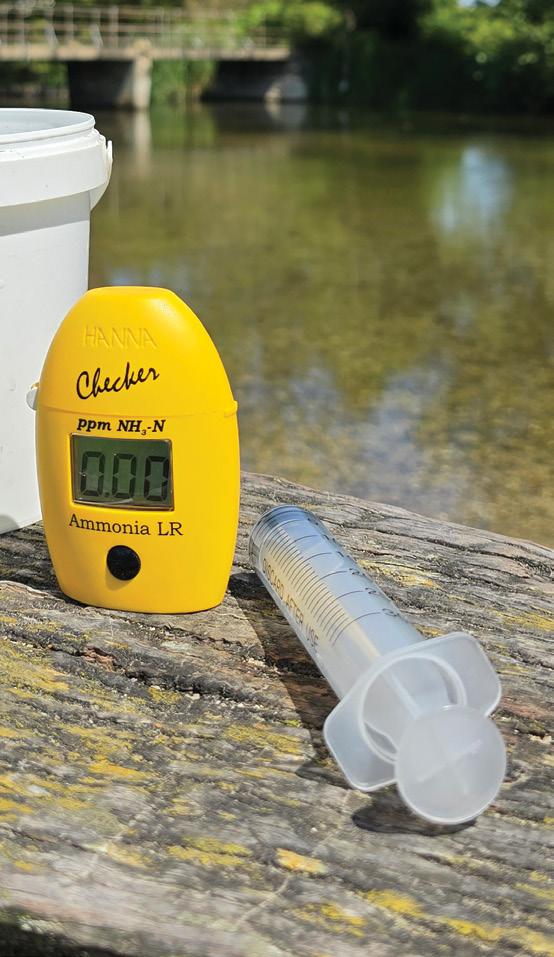
The Hampshire Avon Report, produced by For the Love of Water (FLOW), combined data collected by FLOW CIC, the Angling Trust, land managers and volunteers. The report focuses on the River Avon Special Area of Conservation (SAC), a globally rare and ecologically sensitive chalk stream system.
The report reflects the wider citizen science community’s experience in that while mean nutrient concentrations from citizen science are broadly comparable to official Environment Agency data, the more frequent community sampling detected numerous localised exceedances and short-term spikes that regulatory programs often miss. They found that:
The Hampshire Avon report confirms that this internationally important SAC is similarly struggling with nutrient overloads.
• Phosphate (PO4-P): Mean concentrations consistently exceed the catchment target of 0.05 mg/l at all monitored sites. The highest mean values were recorded at Downton (0.21 mg/l) and Charlton All Saints (0.15 mg/l)
• Nitrate (N3): Levels remain high across the catchment, with a marked increase in nitrate pollution noted in the third year of monitoring. While mean levels were generally consistent, an individual high reading of 20 mg/l was observed downstream of Downton.
relatively consistent overall, significant spikes were detected at Churchfields on the Nadder (max 0.56 mg/l) and Avon Castle downstream of Ringwood (max 1.75 mg/l).
Finally, the Hampshire Avon report made several key recommendations and actions which they will pursue:
• CaSTCo Alignment: Commit to CaSTCo principles to support a national monitoring framework and ensure all collected data is publicly available.
• Enhanced Data Platforms: Implement more robust capture and display systems to improve data control and shift toward sampling at fixed sites.
• Targeted Sampling: Focus future monitoring efforts on sub-catchments and areas with limited data to maximize ecological impact.
• New Forest Coordination: Work with local groups to standardize and coordinate sampling on tributaries within the New Forest National Park.
• Riverfly Monitoring: Establish a dedicated Riverfly monitoring hub in the area once the necessary funding is secured.
• Securing Resources: Fund a dedicated role to support the project and manage the expansion of data collection across the catchment.
• Ammonia (NH3-N): While levels were
• Data Integration: Encourage active data sharing between different organizations to allow all partners to utilize the collective findings.
• Expanding Parameters: Review the inclusion of additional testing parameters, such as turbidity, to complement existing river projects.
Looking at the Nitrate pollution data, the levels remain high in all 3 chalk stream focus catchments. In the Avon Hampshire and Loddon & Trib catchments, Nitrate concentrations started at a high baseline in the first year of data collection and have risen further since.
• In every month apart from one in 2024, average Nitrate concentration has been above 5ppm in the Test and Itchen catchment.
• Avon Hampshire has seen a marked increase in Nitrate pollution in year 3, with 10/12 months being above 5ppm, compared to 6/12 in year 2 and 7/12 in year 1.
• Loddon and Trib has also seen an increase in Nitrate pollution with every month in year 3 exceeding 5ppm. This is compared to 10 in year 2 and 6 in year 1.
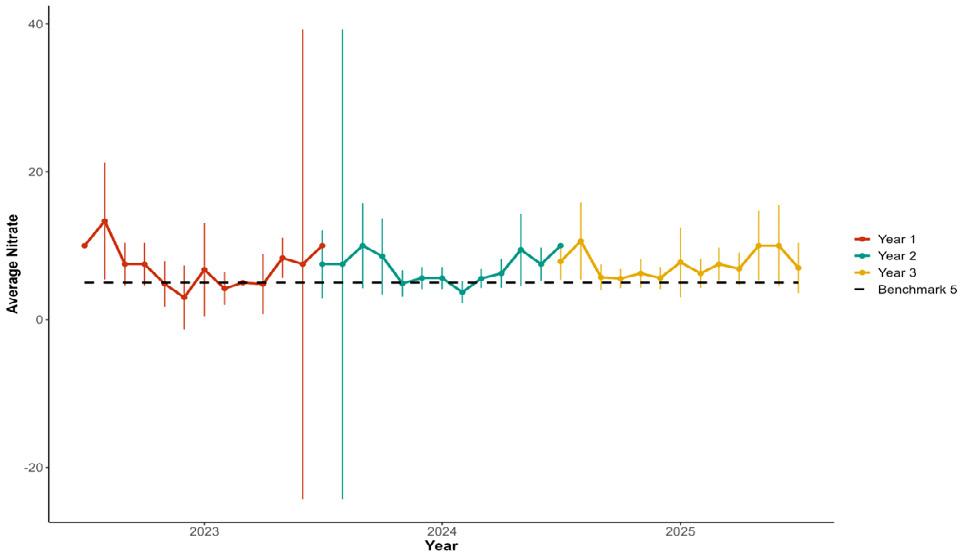
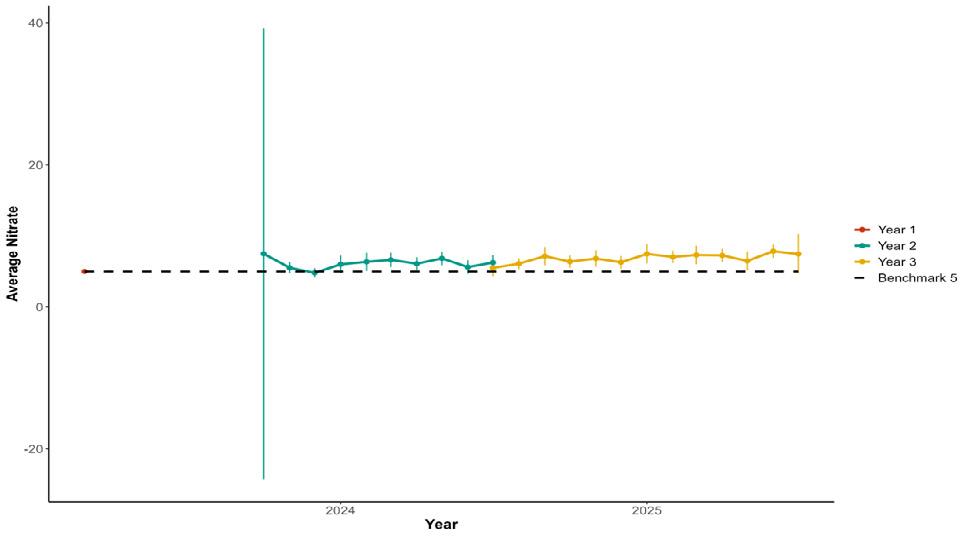
Figure 35. Average nitrate levels (ppm) across the WQMN campaign for the Test & Itchen catchment area. A benchmark of 5ppm has been illustrated.
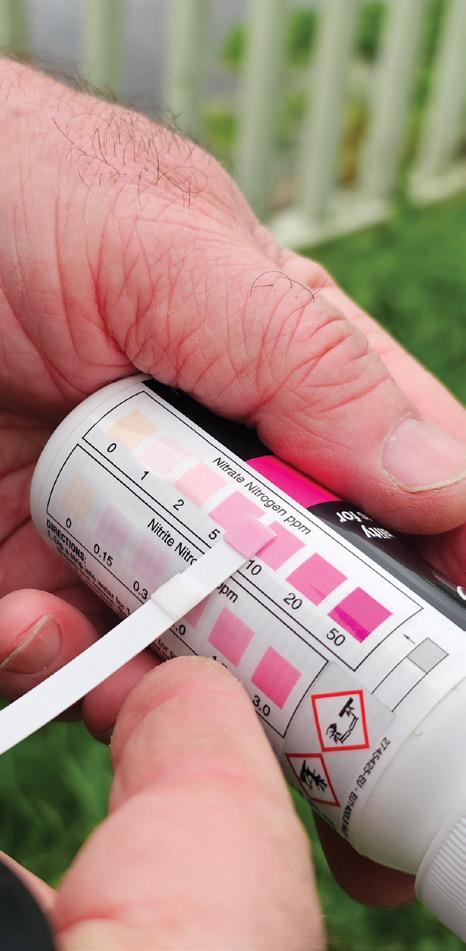
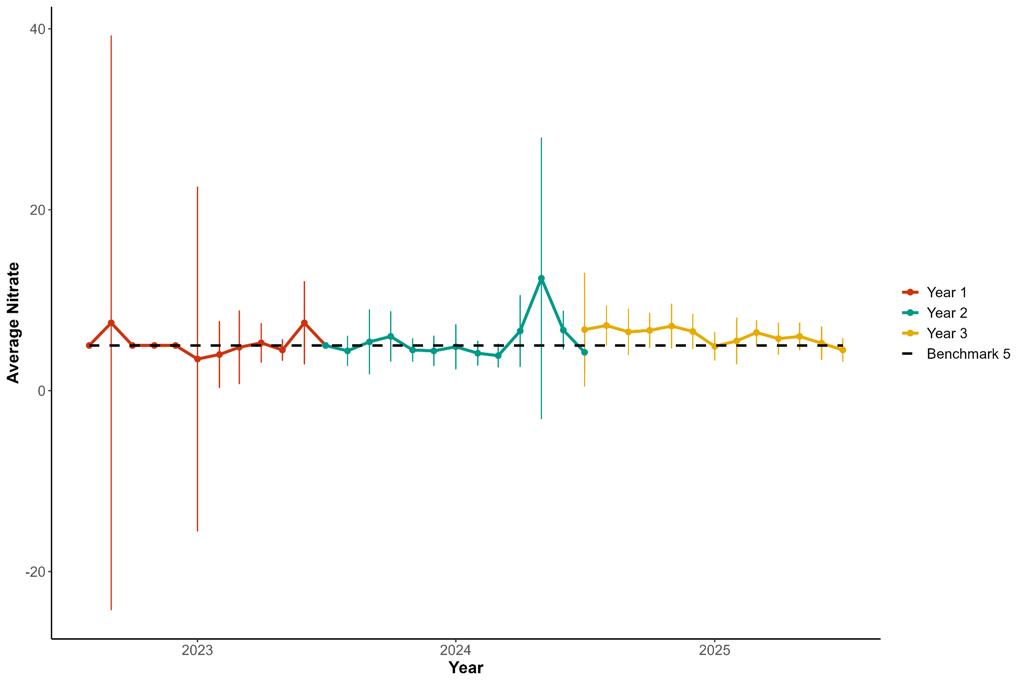
The monitoring programs in the Test, Itchen, Meon, and Hampshire Avon catchments have highlighted the immense scientific expertise
held by local volunteers and stakeholders. These river stewards are not merely collectors of data; they include riparian owners, river managers, and scientists who bring a deep understanding of their local rivers. They are a testament to
the power that citizen science has to robustly identify pollution hotspots and temporal spikes that routine regulatory monitoring often misses.
Having shed the WFD ‘good status illusion,’ the picture for phosphate pollution in naturally nutrient poor chalk streams is revealed. Add to this sky-high nitrate levels, and the viability of local boreholes, raw abstraction for human consumption, and of course, of keystone species like the Chalk Stream Atlantic Salmon, are under severe threat.
However, there is profound hope in the growing coalition of local action groups. These custodians are successfully bringing the plight of these rare ecosystems to light, holding water companies and regulators to account, and advocating for the stringent new standards necessary to restore these precious habitats for future generations.

We're not blameless either. We now have a drug for almost everything, which end up in our waterways because sewage treatment works can’t filter them out. On top of which we have chemical-laden farm run-off because we’ve bleached and poisoned the land of any natural goodness.

This crisis was never about one thing, which I know first-hand through my experience with The Avon Roach Project, and there is now a far greater awareness and a growing desire to help. Nowhere is this more evident than the rallying call to look after our critically endangered rivers and streams through the fantastic work being carried out by the growing army of volunteers, out in all kinds of conditions, helping to gather vital data through the Water Quality Monitoring Network.
"We are the custodians of the priceless ecological arteries of life that are our rivers and streams. Chalk streams - 86% of which exist here in England - are the rarest and most fragile riverine ecosystems on Planet Earth. Yet we allow companies to suck some of them almost dry, sell the water to us, charge us to ‘treat’ our sewage, then dump tonnes of still contaminated waste back into them with impunity.
I can’t praise highly enough the tremendous efforts of the volunteers and the Angling Trust, unquestionably the best conduit for delivering and representing our drive for change and to hold the water companies and government to account. Whether or not you agree with all their actions and policies, if you truly care about our rivers and streams and are not a member already, I would suggest joining to add to the common aim. The greater the membership, the louder our single representative voice."
Angling Trust Ambassador and Co-founder of the Avon Roach Project
EPA. (2025a). Basic information on nutrient pollution. [Online]. US EPA. Available at: https://www.epa.gov/nutrientpollution/basicinformation-nutrient-pollution [Accessed 3 November 2025].
EPA. (2025b). Nutrient Pollution: Sources and solutions. [Online]. US EPA. Available at: https:// www.epa.gov/nutrientpollution/sources-andsolutions [Accessed 3 November 2025].
Felicia Rankl, Patrick Grimes, Paul Bolton, Cassie Barton, Nuala Burnett, Sarah Coe. (2023). Nutrient neutrality and housing development. [Online]. House of Commons Library. Available at: https://commonslibrary.parliament.uk/ research-briefings/cbp-9850/ [Accessed 3 November 2025].
Manuel, J. (2014). Nutrient pollution: a persistent threat to waterways. Environmental health Perspectives, 122 (11), pp.A304-9.
Morse, A. (2017) Upper Itchen Phosphate Plan, Tackling nutrient inputs to the headwaters of the Itchen, Hampshire and Isle of Wight Wildlife Trust National Oceanic and Atmospheric Administration. (2014). What is nutrient pollution? [Online]. Available at: https:// oceanservice.noaa.gov/facts/nutpollution.html [Accessed 3 November 2025].
Natural England (September 2025)
Itchen SSSI Condition Assessment 2025, retrieved from https://designatedsites. naturalengland.org.uk/SiteFeatureCondition. aspx?SiteCode=S2000227&SiteName=River%20 Itchen%20-%202000227%20SSSI
The Rivers Trust. (2023). Nutrient pollution; we’re calling for environmental regulations not to be relaxed. [Online]. The Rivers Trusts. Available at: https://theriverstrust.org/aboutus/news/nutrient-pollution-were-callingfor-environmental-regulations-not-to-berelaxed#:~:text=Nutrient [Accessed 3 November 2025].
DEFRA. (2014). Water Framework Directive implementation England Wales: new updated standards protect water environment.
Edwards, T. M. et al. (2024). Ammonia and aquatic ecosystems - A review of global sources, biogeochemical cycling, and effects on fish. The Science of the total environment, 907 (167911), p.167911.
EPA. (2013). Factsheet - Aquatic Life Ambient Water Quality Criteria for Ammonia - Freshwater. [Online]. Available at: https://www.epa.gov/sites/ default/files/2015-08/documents/fact_sheet_ aquatic-life-ambient-water-quality-criteria-forammonia-freshwater-2013.pdf.
Freshwater Watch. Nitrates and phosphates. [Online]. Available at: https://www. freshwaterwatch.org/pages/nitrates-andphosphates [Accessed 11 November 2025]. UKTAG. (2013). Updated Recommendations on Phosphorus Standards for Rivers. {UKTAG}.
A huge thank you to the 800+ volunteers who have braved all conditions to collect the vast dataset analysed in this report. It is remarkable to see the scale of the WQMN today, since its inception by Kris Kent and Glyn Marshall back in 2022.
Special thanks to members of the WQMN community who sent in detailed reports for the catchments which have been used in this report, and For the Love of Water (FLOW) for allowing us to implement many of their images.
Finally, thank you to our funders, without whom the WQMN would not exist.