6 minute read
Positive feedback loops


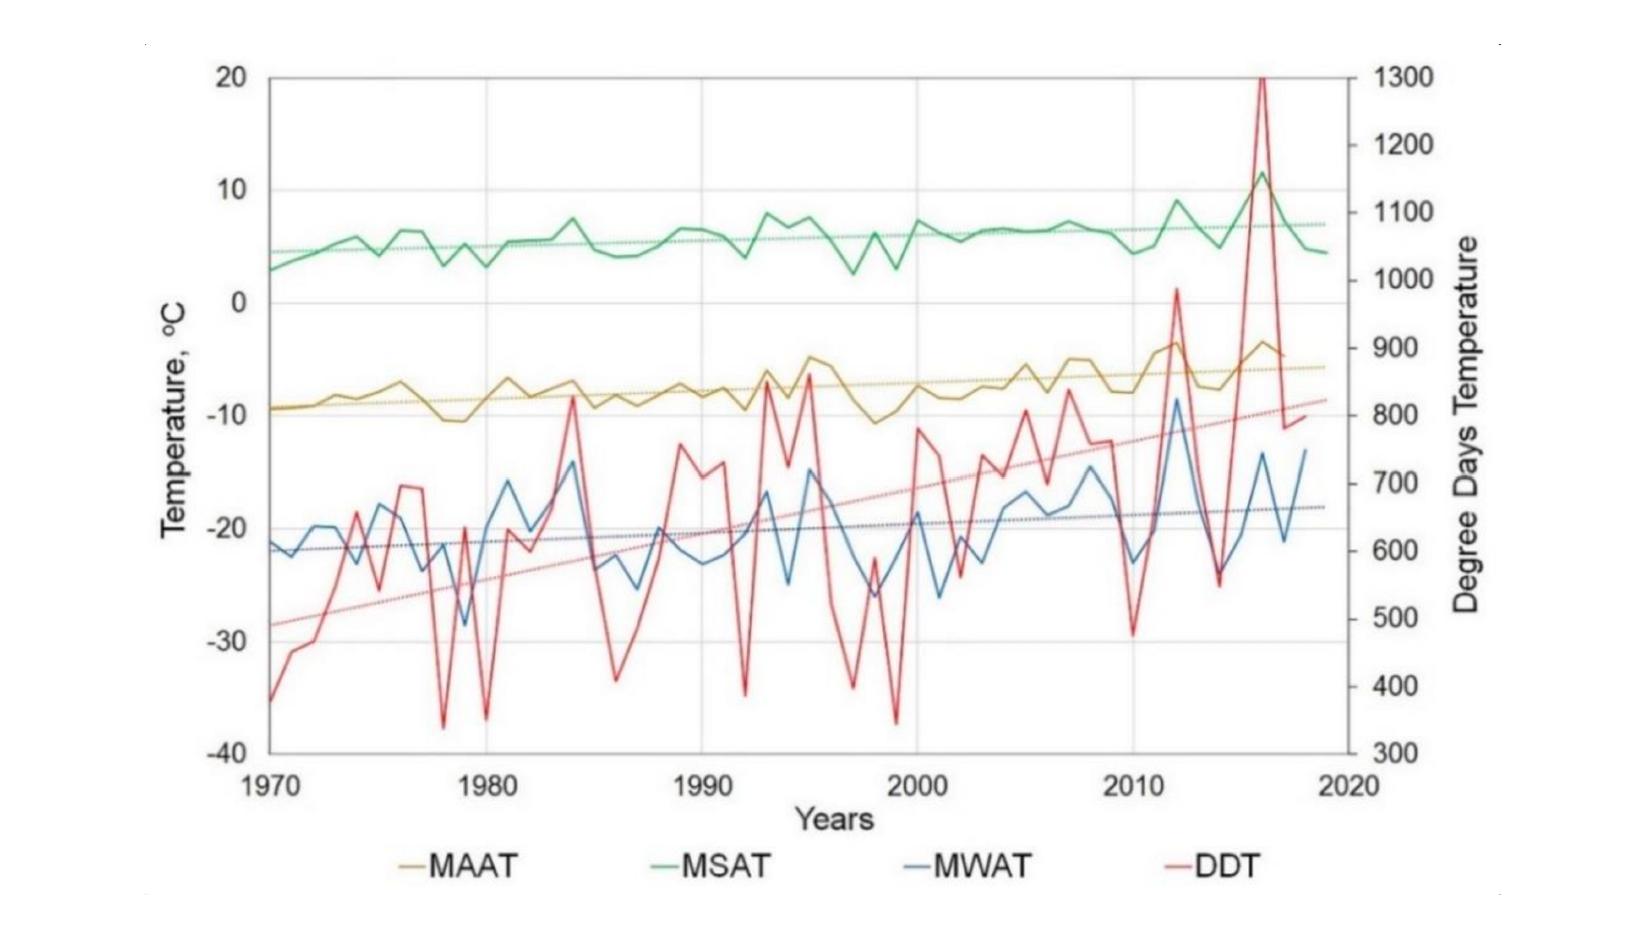
Change in mean annual temperature (MAAT), summer temperature (MAST), winter temperature (MAWT), and thawing index (DDT, degree-days above 0 C, calculated as cumulative number of all the positive mean daily air temperatures during a calendar year) over time, based on the data obtained from the Marre-Sale weather station, 1970–2019. Dotted lines show linear trends in changes of climatic characteristics.
Mean annual air temperature (MAAN)
Advertisement
Western Yamal is located within the subarctic zone of the moderately cold and humid Atlantic area of the Western Arctic climatic region. The climate of the study area is characterized by a long period with sub-zero air temperatures. According to the Marre-Sale meteorological station, the standard mean annual air temperature (averaged over 1961–1990) was 8.5 C. The coldest month is February with an average monthly temperature of 22.7 C, and the warmest is July with7 .1 C(1961–1990). The absolute minimum of the daily temperature was 45 .9C (27 December 1986), and the absolute maximum was 23.6 C (14 July 1990).
Climate warming in the western sector of the Russian Arctic began in the 1970s and continues since that time. The variations in mean annual air temperature (MAAT), mean temperatures of the warm (June–September) and cold periods (October–May), and thawing index (cumulative number of degree-days above 0 C, DDT) from 1970 to 2019 are shown in
The MAAT during this period has increased from 9.4 toС5 .9 C, the mean rate of increase in the MAAT was 0.07 C/year. The mean summer air temperature has increased from 5.5 to 6.9 C, the average rate of temperature increase was 0.029 C/year. The air temperature in the winter period has increased from 22.0 to 18.0 C, the average rate of temperature increase was 0.081 C/year. Thus, climate warming occurs largely due to an increase in air temperature in winter; an increase in summer temperatures is much less pronounced.
The standard thawing index (DDT value average for the 1961–1990 period) was 560; from 1970 to 2019 the thawing index has increased from 500 to 810; the rate of increase in DDT in 1970–2019 was 5.9 DDT/year. The standard amount of annual precipitation (averaged over 1961–1990) was 297 mm. Summer precipitation makes approximately a half of the total. Similarly, to changes in the air temperature, an increase in the amount of precipitation has been observed since 1970s: from 1970 to 2019 it has increased from 280 to 350 mm; average rate of increase in the amount of annual precipitation was 1.65 mm/year. Over the 1970 to 2019 period, average rate of increase in snow accumulation was 0.41 cm/year.
Modelling cryogenic processes in permafrost and frozen soils
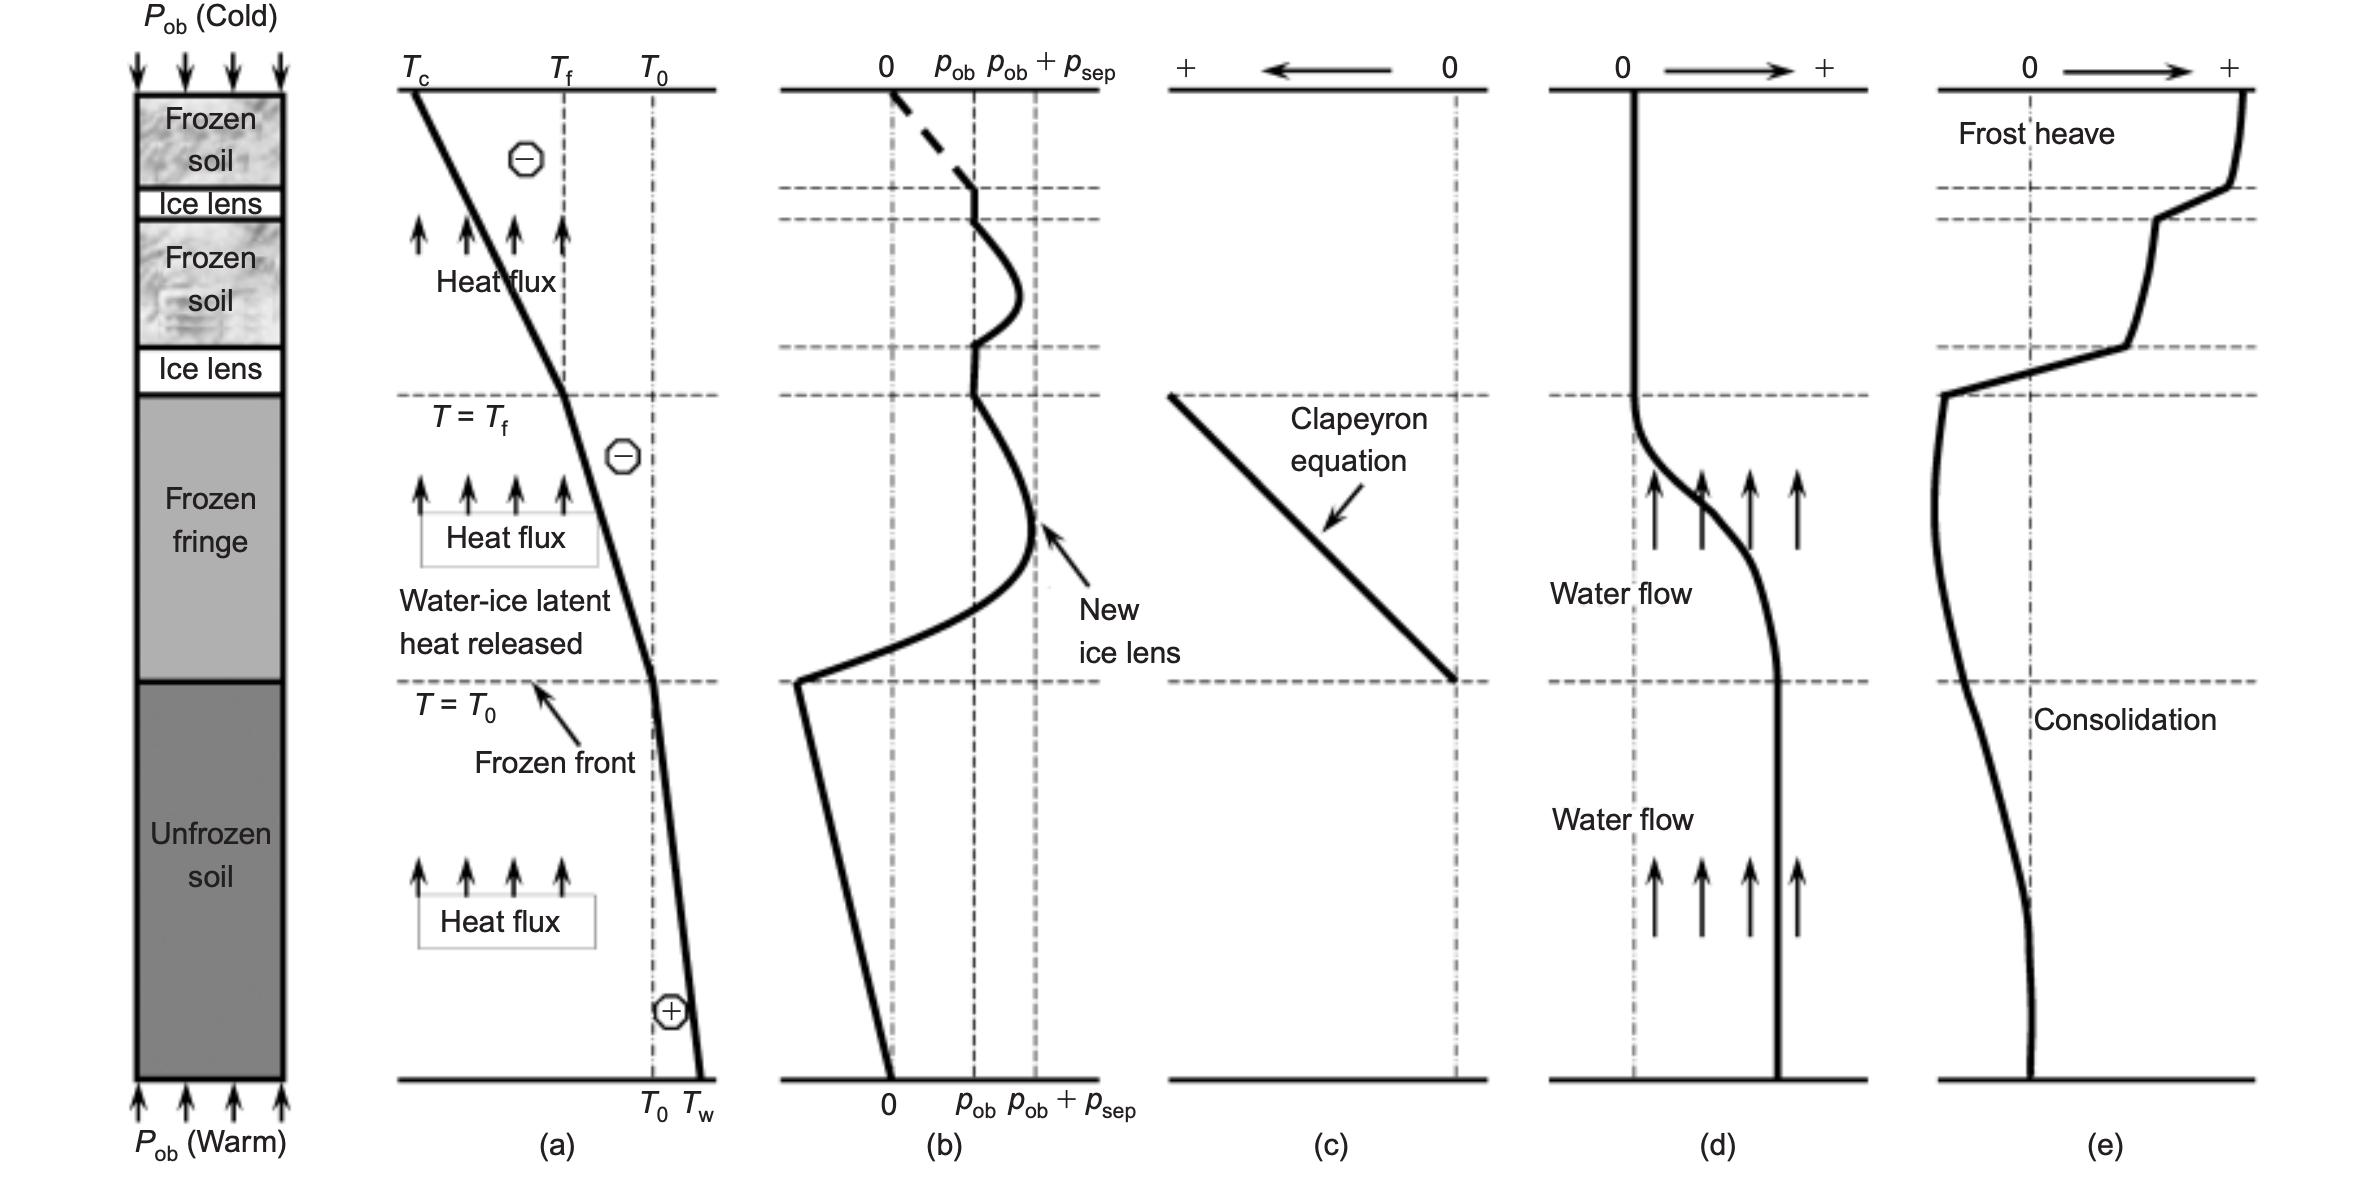
Schematic representation of a freezing soil with ice segregation: (a) layers; (b) temperature; (c) pore pressure; (d) cryogenic suction; (e) water velocity; (f) displacement (Tc,Tw, temperature at cold and warm ends, respectively; Tf, temperature at the base of ice lens; T0, freezing point; pob, surface overburden load; psep, separation strength)
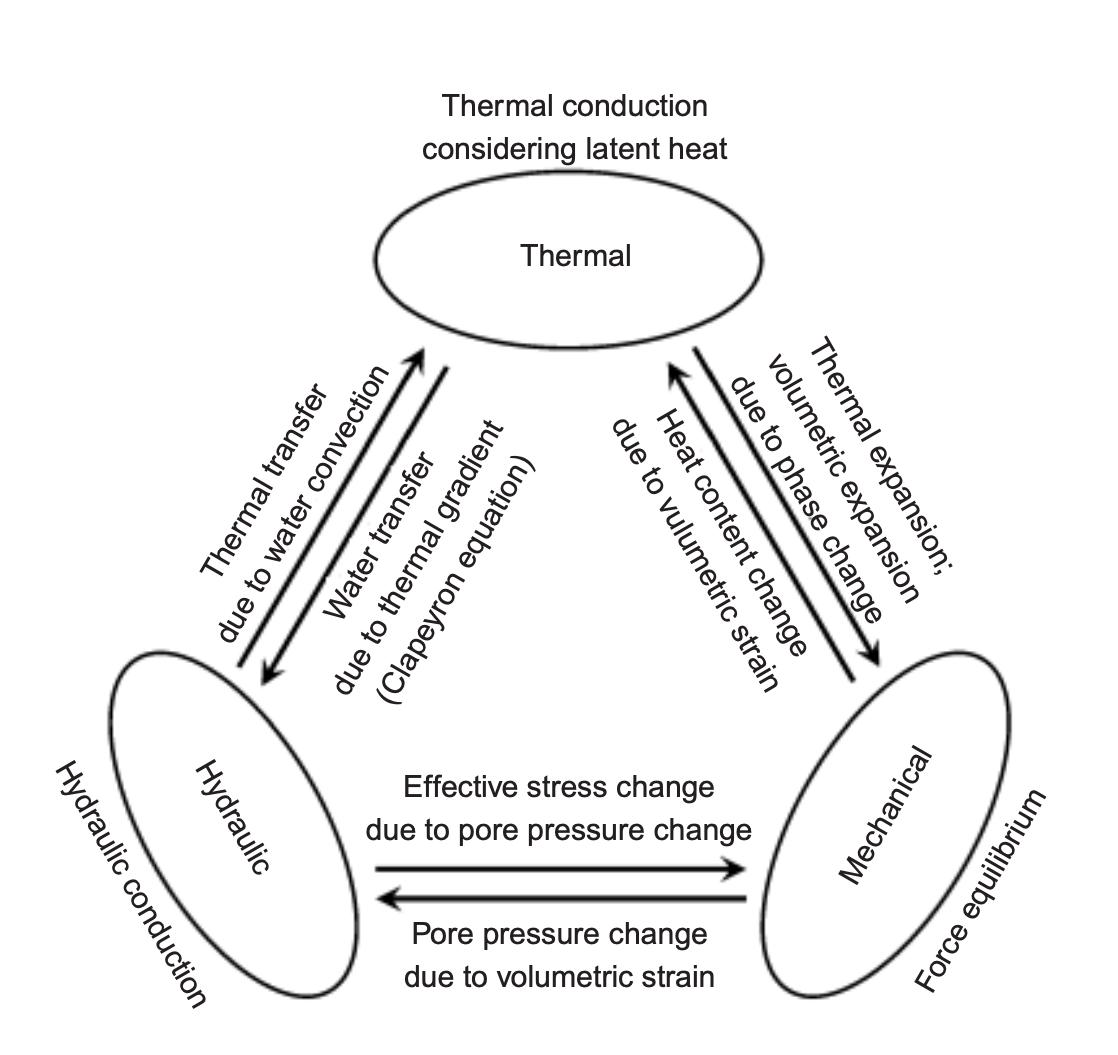
Thermo-hydro-mechanical interaction mechanism in freezing soils
Processes of soil freezing and ice segregation
As the surface temperature of a soil sample drops below the freezing point, the freezing front penetrates the sample progressively, as shown in Fig. 2. Unsteady heat flow due to the thermal gradient with depth leads to a decrease of the soil temperature. Phase change of pore water occurs in the so-called ‘frozen fringe’ (Miller, 1972), when the soil temperature falls below the freezing point; also, at this point latent heat of fusion is released. Volumetric expansion of water due to phase change (liquid to ice) causes an increment of pore pressure within the unfrozen pores. At the ice/ water interface a cryogenic suction gradient, which is developed in response to the temperature gradient, draws the pore water in the unfrozen soil towards the freezing front, which in turn raises pore pressure there. The thermally induced driving force causing pore water flow by the temperature gradient can be determined using the Clapeyron equation, whereby consideration of the thermodynamics of the system hows that the chemical equilibrium for the chemical potentials of ice and water is satisfied (Black, 1995; Henry, 2000). Ice segregation takes place if the pore pressure reaches a threshold value, and a new ice lens forms in the direction of heat removal (Miller, 1978; Gilpin, 1980; O’Neill & Miller, 1985; Nixon, 1991). Moisture accumulation and the volumetric expansion due to pore water phase change in both the fully frozen soils and ice lens result in frost heave.

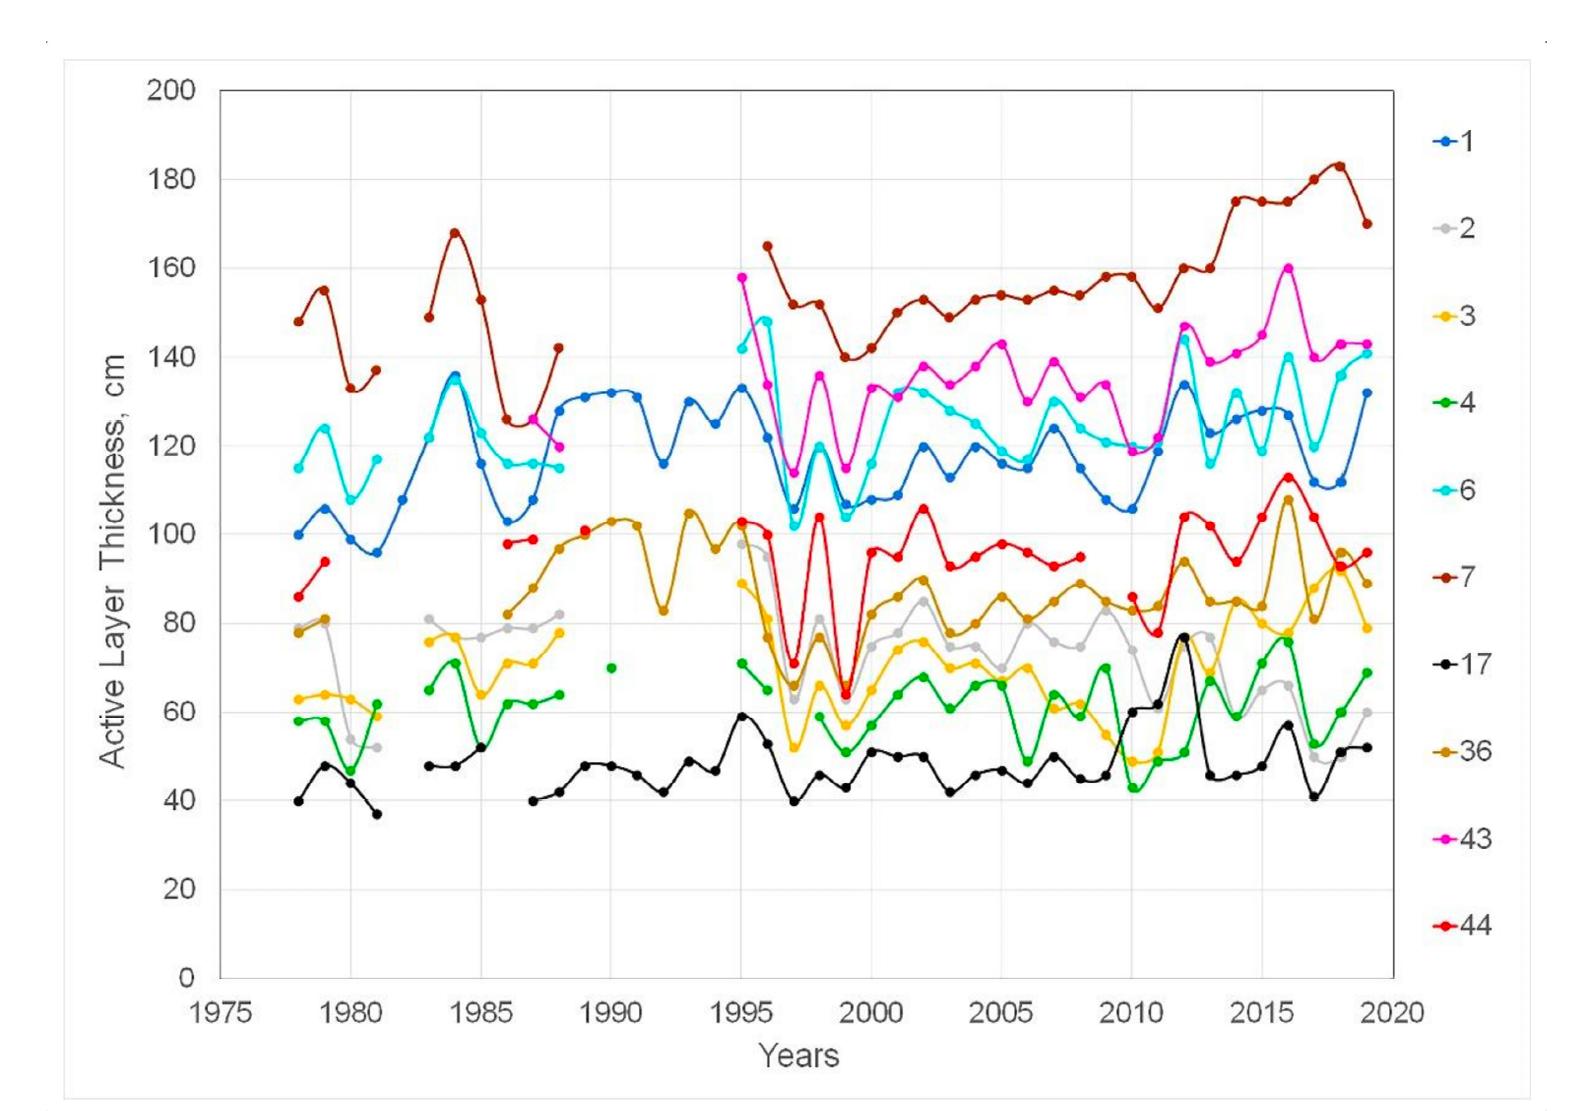
Methane contents and gravimetric moisture contents of soils of the active layer and transition zone of the upper permafrost in dominant landscapes of the Marre-Sale study area: (a) moist tundra (MT), (b) polygonal tundra (PT), (c) water tracks (WT), (d) saturated tundra (ST), (e) peat bog (PB). Legend: 1–4—soil texture: 1—peat, 2—sand, 3—silty loam, 4—clayey loam. Horizontal dashed lines show thaw depths measured in 2016, 2017, and 2018 (note that in 2017 thaw depths were measured significantly earlier in the season, on July 27–28, when a large portion of the active layer was still frozen). Depth of seasonal thawing in 1978–2019 in the Marre-Sale study area. Numbers of boreholes adjacent to observation sites are shown in the legend.
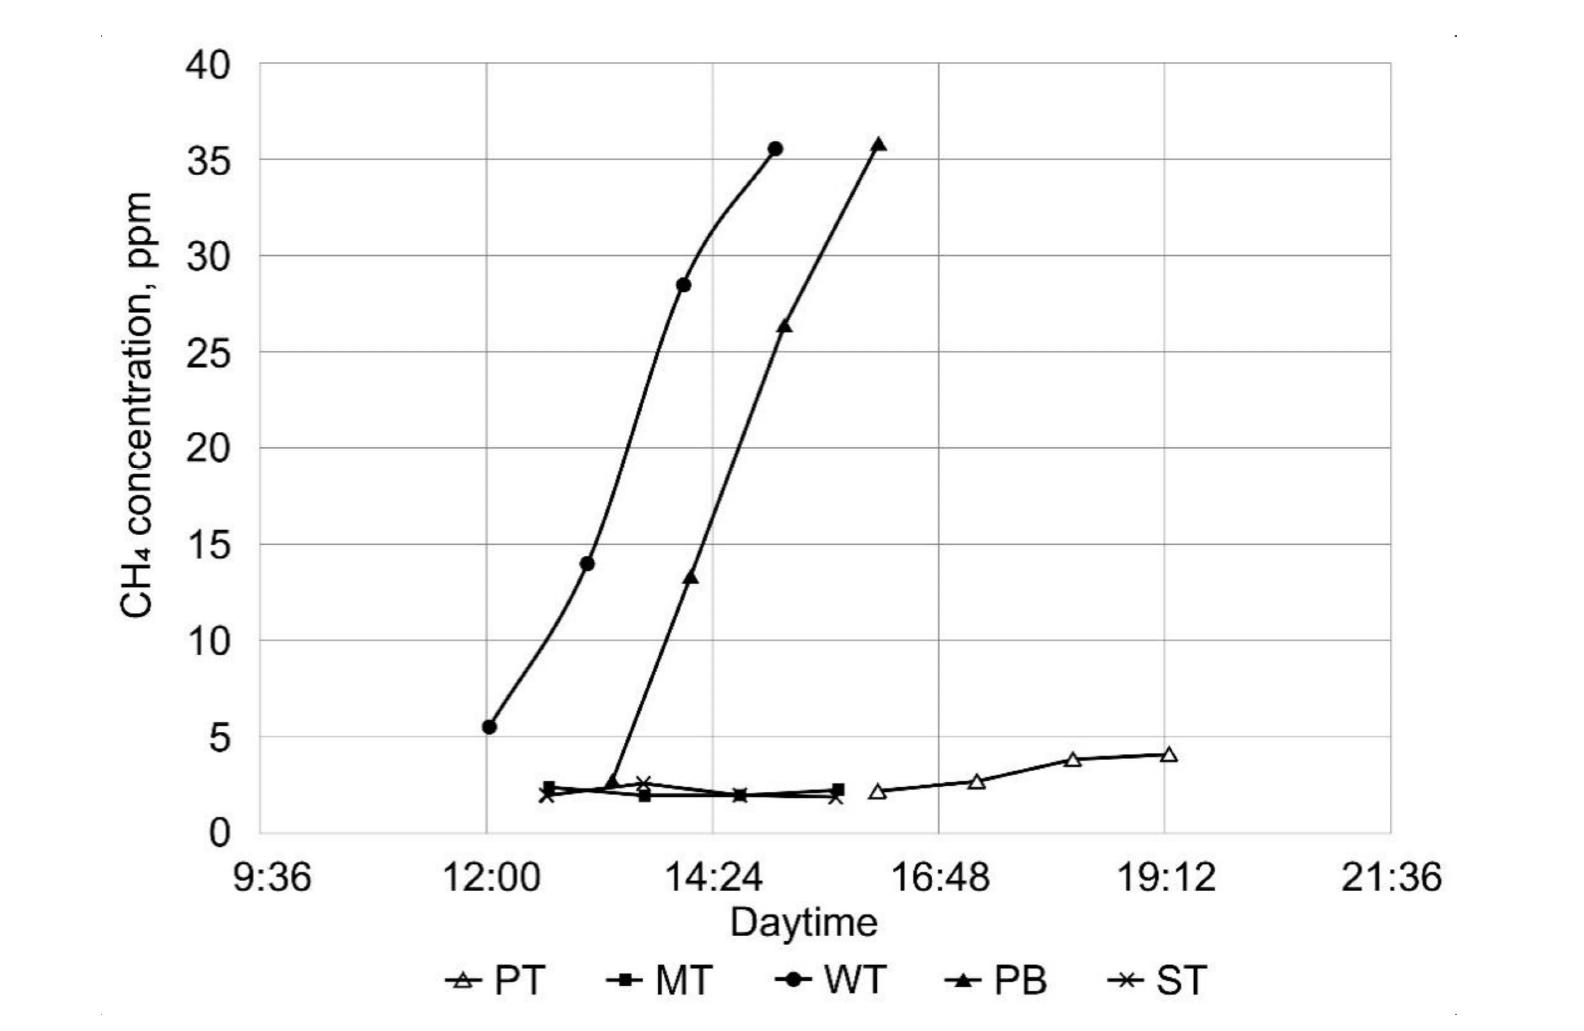
Graphs of methane accumulation in static chambers in the dominant landscapes of the Marre-Sale area (data for 20 August 2019).
Siberian wildfire anomaly
In a report about the remarkably warm temperatures in Siberia, European scientists examined historical temperature data in their global ERA5 reanalysis, finding that temperatures have been unusually warm in the region since January 2020. Since the ERA5 data begins in 1979, the European team also looked to GISTEMP, a NASA temperature record with data through 1880. They could not find any other examples in either dataset of such an intense heat wave in this part of Siberia persisting for such an extended period.
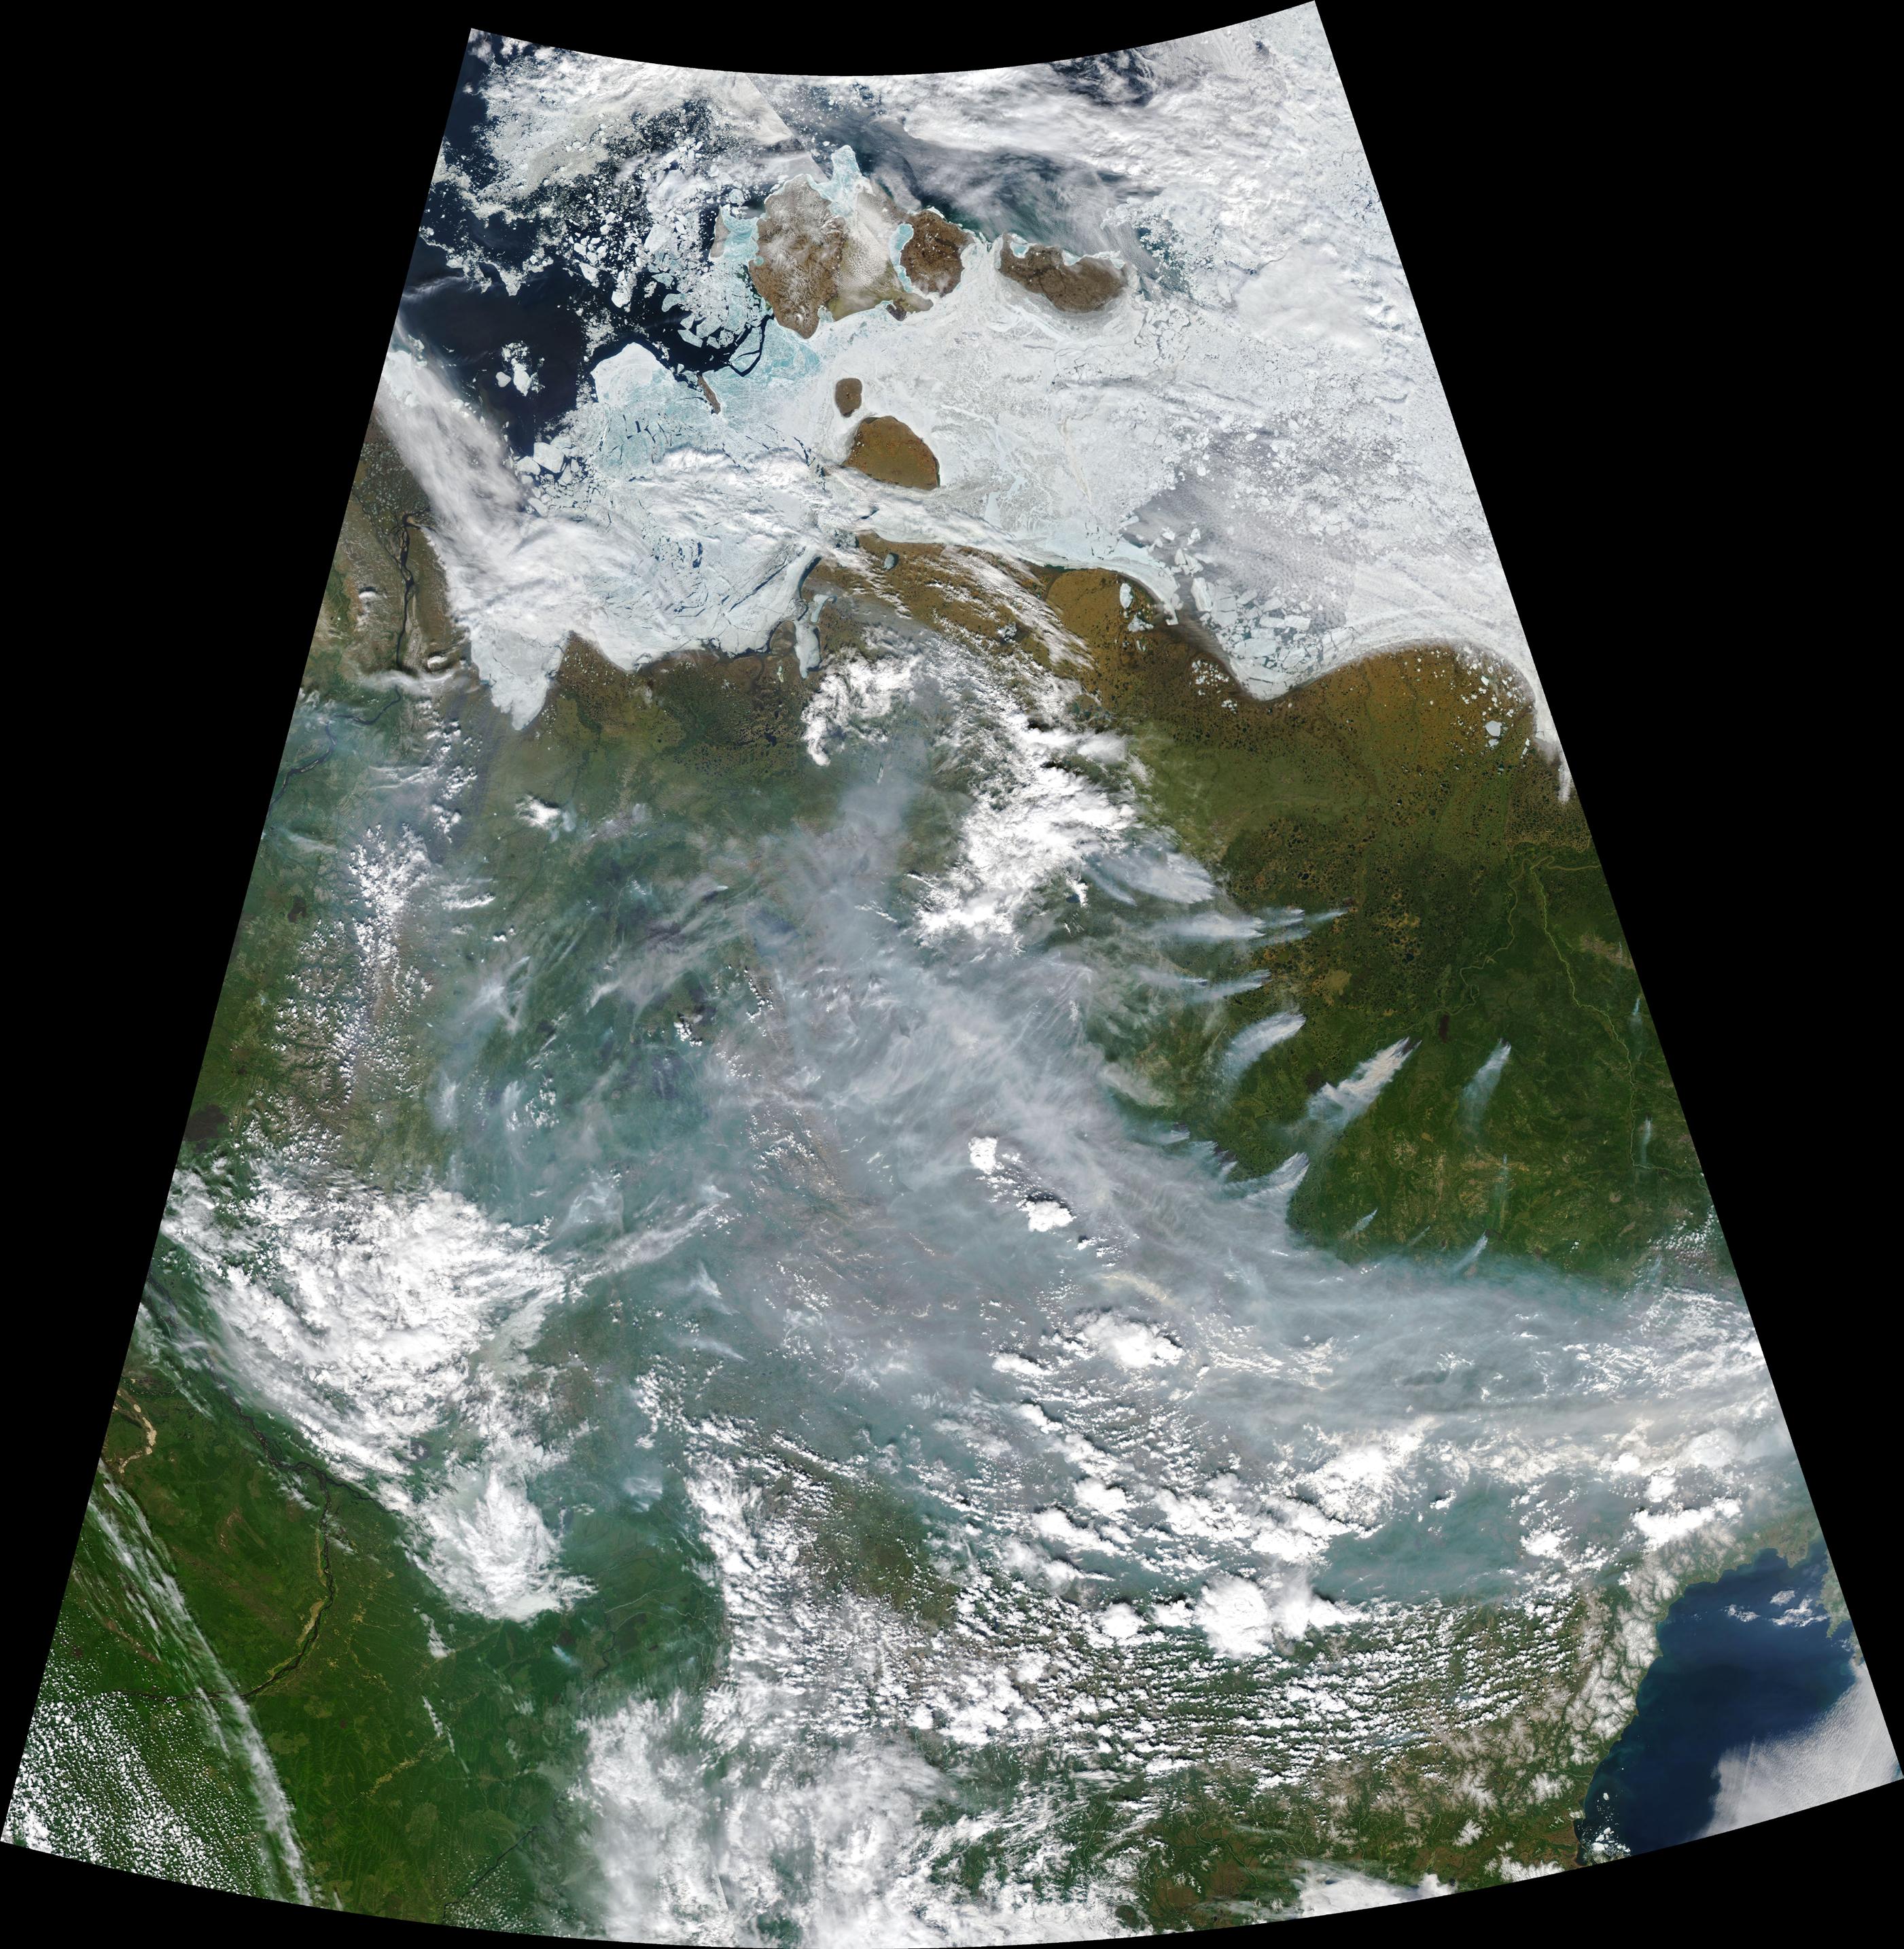
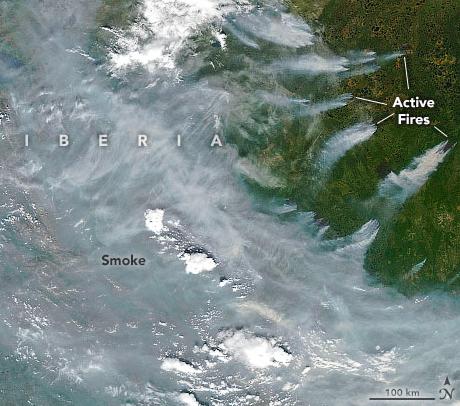
The persistent high-pressure atmospheric pattern that brought the extreme heat has exacerbated wildfires, prompting dozens to burn in the region’s forest and shrub ecosystems. Some of those ecosystems grow on top of carbon-rich layers of peat and permafrost. The natural-color image below shows smoke streaming from several active wildfires in Russia’s Sakha region.
“Most of Earth’s terrestrial carbon is stored in the upper latitudes of the northern hemisphere,” explained Amber Soja, a NASA and National Institute of Aerospace associate research fellow who has conducted field research in the region. Soja noted that many forests in the region are dominated by a coniferous tree—Dahurian larch—that drops its needles each winter. “But because the winters are so cold, there are few decomposers around to break the needles down. Over time, you end up with lots of buried fuel that has built up over millennia, which stores massive quantities of carbon in peat and soils.”
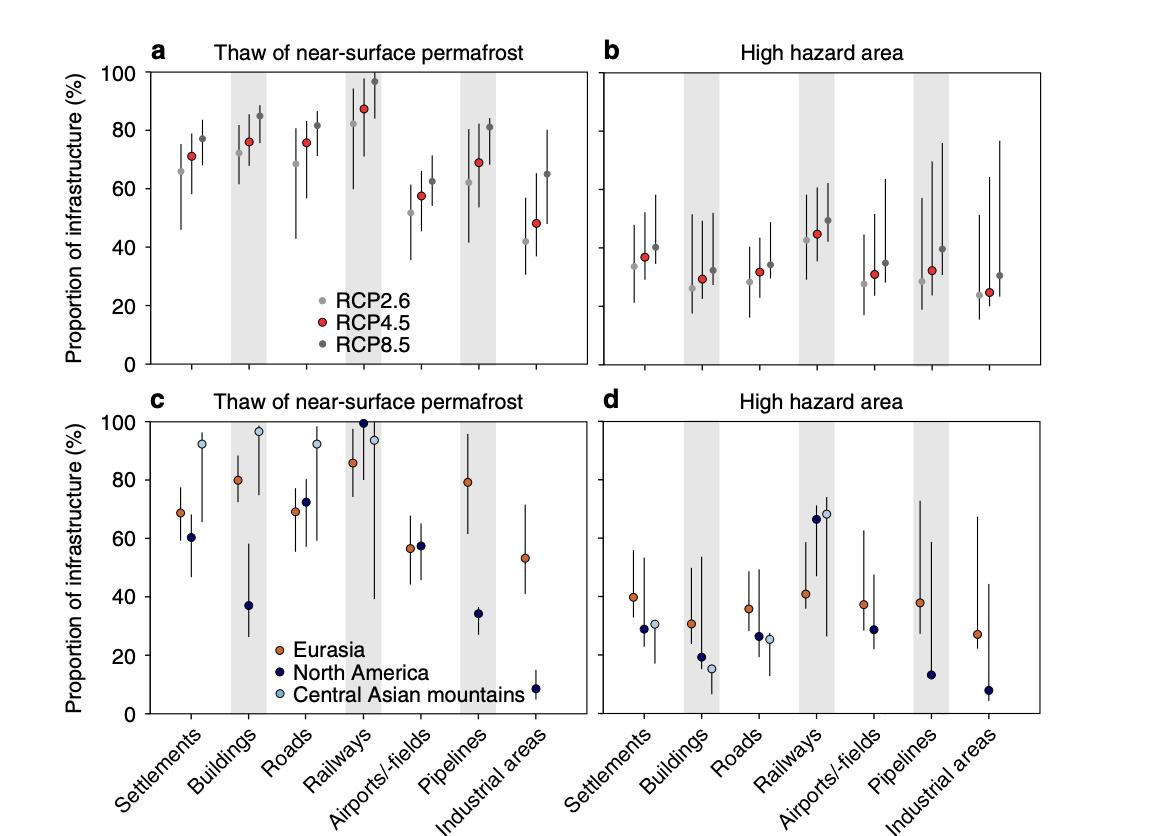

Paper on the Disappearing Cryosphere, pulished April 2012 Central results of the infrastructure hazard computations. Proportion of all residential, transportation, and industrial infrastructure in areas of nearsurface permafrost thaw (a) and high hazard (b) in the pan-Arctic permafrost area based on different Representative Concentration Pathway (RCP) scenarios by the middle of the century (2041–2060). The comparable results of RCP4.5 for geographical sub-regions (Eurasia, North America and central Asian mountains) are presented in (c) and (d) (also 2041–2060; percentages for airports/-field, pipelines and industrial areas are not shown for central Asian mountains owing to too few observations). The numerical results are presented in Supplementary Table 3. The uncertainty ranges (bars) were based on the uncertainty in the mean annual ground temperature (a–d) and active layer thickness predictions (b and d).