LEE COUNTY FLORIDA

2023 APRIL
Home of the CLHMS TM
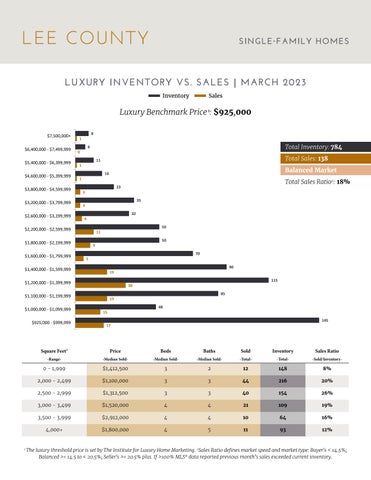
8 6 11 16 23 35 32 50 50 70 90 115 85 48 145 1 0 1 1 3 3 4 11 9 5 19 30 19 15 17 $7,500,000+ $6,400,000 - $7,499,999 $5,400,000 - $6,399,999 $4,600,000 - $5,399,999 $3,800,000 - $4,599,999 $3,200,000 - $3,799,999 $2,600,000 - $3,199,999 $2,200,000 - $2,599,999 $1,800,000 - $2,199,999 $1,600,000 - $1,799,999 $1,400,000 - $1,599,999 $1,200,000 - $1,399,999 $1,100,000 - $1,199,999 $1,000,000 - $1,099,999 $925,000 - $999,999 Inventory Sales Square Feet3 -RangePrice -Median SoldBeds -Median SoldBaths -Median SoldSold -TotalInventory -TotalSales Ratio -Sold/Inventory0 - 1,999 $1,412,500 3 2 12 148 8% 2,000 - 2,499 $1,100,000 3 3 44 216 20% 2,500 - 2,999 $1,312,500 3 3 40 154 26% 3,000 - 3,499 $1,520,000 4 4 21 109 19% 3,500 - 3,999 $2,912,000 4 4 10 64 16% 4,000+ $1,800,000 4 5 11 93 12%
SINGLE - FAMILY HOMES LUXURY INVENTORY VS. SALES | MARCH 2023 Luxury Benchmark Price 1: $925,000 Balanced Market 784 Total Inventory: 138 Total Sales: 18% Total Sales Ratio2: 1 The luxury threshold price is set by The Institute for Luxury Home Marketing. 2Sales Ratio defines market speed and market type: Buyer's < 14.5%; Balanced >= 14.5 to < 20.5%; Seller's >= 20.5% plus. If >100% MLS® data reported previous month’s sales exceeded current inventory.
LEE COUNTY
LEE COUNTY
SINGLE - FAMILY HOMES
13 - MONTH LUXURY MARKET TREND 4
MEDIAN
TOTAL INVENTORY
277 784 Mar. 2022 Mar. 2023
VARIANCE: 183 %
DATA REVIEW | MARCH
TOTAL SOLDS
VARIANCE: - 29 % 195 138
SALE TO LIST PRICE RATIO
VARIANCE: - 1 % $519 $512
100.00% 95.17%
VARIANCE: - 5 %
SALES PRICE
VARIANCE: 0 % $1.30m $1.30m
DAYS ON MARKET
8 21
VARIANCE: 163 %
LEE COUNTY MARKET SUMMARY | MARCH 2023
• The Lee County single-family luxury market is a Balanced Market with an 18% Sales Ratio.
• Homes sold for a median of 95.17% of list price in March 2023.
• The most active price band is $1,000,000-$1,099,999, where the sales ratio is 31%
• The median luxury sales price for single-family homes is $1,300,000.
• The median days on market for March 2023 was 21 days, up from 8 in March 2022.
3Square foot table does not account for listings and solds where square foot data is not disclosed. 4Data reported includes Active and Sold properties and does not include Pending properties.
Solds Median Sales Price Inventory 277 351 466 571 538 546 497 449 507 541 630 693 784 195 203 215 161 99 113 68 62 65 79 96 96 138 $1,300,000 $1,275,000 $1,375,000 $1,300,000 $1,300,000 $1,375,000 $1,192,500 $1,222,500 $1,424,363 $1,217,352 $1,300,000 $1,270,550 $1,300,000 Mar-22 Apr-22 May-22 Jun-22 Jul-22 Aug-22 Sep-22 Oct-22 Nov-22 Dec-22 Jan-23 Feb-23 Mar-23
Mar. 2022 Mar. 2023 Mar. 2022 Mar. 2023 Mar. 2022 Mar. 2023 Mar. 2022 Mar. 2023 Mar. 2022 Mar. 2023
SALE PRICE PER SQFT.
LEE COUNTY ATTACHED HOMES
29 12 11 11 19 26 23 19 12 29 43 57 65 51 40 6 3 0 2 4 7 3 10 6 7 9 12 5 10 8 $3,000,000+ $2,600,000 - $2,999,999 $2,200,000 - $2,599,999 $1,900,000 - $2,199,999 $1,700,000 - $1,899,999 $1,500,000 - $1,699,999 $1,300,000 - $1,499,999 $1,100,000 - $1,299,999 $1,000,000 - $1,099,999 $900,000 - $999,999 $800,000 - $899,999 $700,000 - $799,999 $650,000 - $699,999 $600,000 - $649,999 $575,000 - $599,999 Inventory Sales
Square Feet3 -RangePrice -Median SoldBeds -Median SoldBaths -Median SoldSold -TotalInventory -TotalSales Ratio -Sold/Inventory0 - 999 $615,000 2 2 3 30 10% 1,000 - 1,499 $700,000 2 2 7 100 7% 1,500 - 1,999 $700,000 3 2 25 118 21% 2,000 - 2,499 $957,500 3 3 23 88 26% 2,500 - 2,999 $1,270,000 3 3 18 56 32% 3,000+ $2,230,000 3 4 16 55 29%
INVENTORY
Luxury Benchmark Price 1: $575,000 Seller's Market 447 Total Inventory: 92 Total Sales: 21% Total Sales Ratio2: 1 The luxury threshold price is set by The Institute for Luxury Home Marketing. 2Sales Ratio defines market speed and market type: Buyer's < 14.5%; Balanced >= 14.5 to < 20.5%; Seller's >= 20.5% plus. If >100% MLS® data reported previous month’s sales exceeded current inventory.
LUXURY
VS. SALES | MARCH 2023
LEE COUNTY
ATTACHED HOMES
13 - MONTH LUXURY MARKET TREND 4
MEDIAN DATA REVIEW | MARCH
TOTAL INVENTORY TOTAL SOLDS
381 % 93 447 VARIANCE: - 16 % 109 92
SALE PRICE PER SQFT.
VARIANCE: 0 % $451 $452
SALE TO LIST PRICE RATIO
100.00% 96.90%
VARIANCE: - 3 %
SALES PRICE
18 % $790k $930k
DAYS ON MARKET
VARIANCE: 275 % 4 15
LEE COUNTY MARKET SUMMARY | MARCH 2023
• The Lee County attached luxury market is a Seller's Market with a 21% Sales Ratio.
• Homes sold for a median of 96.90% of list price in March 2023.
• The most active price band is $1,100,000-$1,299,999, where the sales ratio is 53%
• The median luxury sales price for attached homes is $930,000.
• The median days on market for March 2023 was 15 days, up from 4 in March 2022.
3Square foot table does not account for listings and solds where square foot data is not disclosed. 4Data reported includes Active and Sold properties and does not include Pending properties.
93 146 180 211 216 215 228 194 247 287 335 387 447 109 117 120 129 63 68 37 39 41 39 50 70 92 $790,000 $848,000 $820,450 $800,000 $769,500 $825,000 $795,000 $870,000 $760,000 $720,000 $970,000 $742,500 $930,000 Mar-22 Apr-22 May-22 Jun-22 Jul-22 Aug-22 Sep-22 Oct-22 Nov-22 Dec-22 Jan-23 Feb-23 Mar-23 Solds Sale Price Inventory
VARIANCE:
VARIANCE:
Mar. 2022 Mar. 2023 Mar. 2022 Mar. 2023 Mar. 2022 Mar. 2023 Mar. 2022 Mar. 2023 Mar. 2022 Mar. 2023 Mar. 2022 Mar. 2023