
REAL ESTATE MARKET ANALYSIS
ALVARO MARIN SERNA
REAL ESTATE MASTER. MARKET ANALYSIS Teacher: SAM AZASU (MRE: Markets)
UNIVERSITY OF NAVARRA
MARCH 2024
LIST OF FIGURES
LIST OF TABLES
EXECUTIVE SUMMARY
This report encompasses an in-depth real estate market analysis conducted on a property situated in Majadahonda, Madrid. The primary aim is to ascertain the property's highest and best use by considering the prevailing supply and demand dynamics across various property categories within the Majadahonda metropolitan area, alongside the distinctive attributes specific to the subject property. The resultant analysis will provide insights into the anticipated market rentals that the proposed development could command, factoring in foreseeable future market conditions.
Structured into three key sections, the market analysis commences with a metropolitan overview, delving into the broader economic forces shaping the local municipality. The macro analysis then evaluates the balance between property supply and demand within the local market landscape, with a focus on identifying potential market gaps that a development on the subject property could effectively address. Finally, the micro analysis narrows down to define the development scenario most conducive to success on the site, synthesizing the findings from the metropolitan and macro analyses.
METRO ANALYSIS
The metro of the community of Madrid has experienced growth driven by the demand for employment registered since the end of the crisis.
Demand-driven growth, coupled with inelastic labor supply, has resulted in real income per worker growing faster than employment. 45% of employment in the metropolitan area is found in two sectors: Wholesale and Retail Trade, Transportation and Storage; and Public administration and defense. The Scientific, technical and administrative services and Information and communications sectors have been experiencing strong demand-induced growth, driven by the preference of companies in this sector to establish their headquarters in the country's capital.
The metropolitan area is Spain's main financial services center and its large population and access to the international airport and two large train stations are good for the wholesale and retail trade, catering and accommodation sectors. The metropolitan area of the Community of Madrid serves as an example, promoting the rest of the country's territory.
MACRO ANALYSIS
The macro analysis conducted an assessment of supply and demand levels for residential space with the aim of determining the presence of any demand gaps for each property type upon completion of development on the subject property. The timeframe from 2023 to 2026 was utilized as the estimated duration required for completing development on the subject property; therefore, the supply and demand estimates pertain to the year 2026.
Retail, office, and industrial macro analyses were not conducted due to the saturation of the local market with commercial space, and the unsuitability of the site for industrial purposes owing to its dimensions and inadequate access and egress.
The residential macro analysis revealed that the demand resulting from population growth indicates a projected increase in demand of 3,072 units during the three-year analysis period in the metropolitan area encompassing the municipalities of Majadahonda, Las Rozas de Madrid, Villanueva del Pardillo, Villanueva de la Cañada, Boadilla del Monte, and Pozuelo de Alarcón. The anticipated new supply over the three-year period is estimated to be 1,915 units, encompassing both vacant stock and new completions. An estimated housing gap of 1,157 residential units has been identified. This suggests that by 2026, the market will experience a deficit of 1,157 residential units.
MICRO ANALYSIS
The microanalysis primarily concentrated on potential residential development, as commercial, industrial, and office projects were deemed unlikely to be feasible. It specifically examined the opportunities presented by Flex Living and Build-to-Rent (BTR) options. The analysis pinpointed target market segments that would be attracted to and resonate most with the amenities offered by the subject property, identifying young families and middle-aged families as particularly suitable demographics. Additionally, it identified comparable properties against which a development on the subject property would compete, as well as the amenities necessary for the subject property to effectively compete in the market.
PROPOSED DEVELOPMENT
The property's conditions dictate two residential development options: Flex Living (1-bedroom apartments and studios) and Build-to-Rent (BTR) (2 and 3-bedroom apartments). Based on urban constraints, Flex Living proposes 37 studios and 13 1-bedroom units, while BTR recommends 10 of each 2 and 3-bedroom apartments. Flex Living units are projected to yield €1,200 for 1-bedroom apartments and €1,080 for studios, totaling 50 units with essential amenities. BTR apartments anticipate rents of €2,100 and €2,700, respectively, for 20 units, complete with essential amenities. The property favors a 2 and 3-bedroom apartment mix, promising a monthly income of €48,000, but the potential for higher income lies in Flex Living, expected to earn around €55,560 monthly. However, tenant acquisition might be more challenging for Flex Living due to its target audience, primarily university students and young adults, and the property's distant location from major universities compared to BTR.
OPCION 1: FLEX LIVING (single & 1-bedroom apartments)1. INTRODUCTION
This market analysis has been conducted on plot called B1 which belongs to the M1 block included in the Reparcelling Project of the “Monte del Pilar” Partial Plan of the municipality of Majadahonda. In accordance with the current approach, it has a gross plot area of 2,410 m2 and a buildable area of 2,446.96 m2/m2 of multi-family residential use for an indicative density of 16 homes. Within residential use, as mentioned above, for the purposes of this analysis, Flex Living use in its multiple variants will be considered.


Plot B1: Mare Nostrum St. Majadahonda, Madrid is currently zoned as “Collective Residential”, it has a gross plot area of 2,410 m2 and a buildable area of 2,446.96 m2/m2 of multi-family residential use for an indicative density of 16 homes.
Table 01: Zoning details. Source: General Urban Planning Plan Majadahonda
The remaining sections of the report are organized as follows: section 2 delves into the analysis of the Comunidad de Madrid metro, the geographic location of the subject property. Subsequently, in section 3, we examine the market area to identify demand gaps across pertinent asset classes. Following this, section 4 conducts an analysis of the site and its surrounding neighborhood, presenting a development proposal equipped with details crucial for informing the architectural design of a prospective project.
Furthermore, the results of this analysis serve as the foundation for income projections in a feasibility study.
Figure 01: Site location (1:10.000). Source: google maps + own elaboration Figure 02: Site location (1:5.000). Source: google maps + own elaboration Figure 03: Site location (1:500). Source: google maps + own elaboration2. METRO ANALYSIS
As part of the metropolitan study, an analysis was conducted of the Community of Madrid, the area in which the plot is located. This administrative area serves as a cohesive economic unit where economic activities across all locations are significantly influenced by overarching forces. The community of madrid covers an

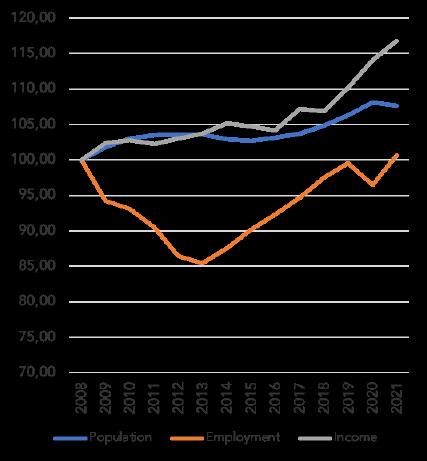
Madrid converted into indices using 2008 as the base year.
Income has been growing at a faster rate than the population, employment decreased during the crisis until 2013, returning to 2008 values in recent years. Average real earnings per worker have predominantly grown faster than employment for most of the analysis period, experiencing further growth since 2018, while employment has risen steadily.
In general, the population grew by 108% between 2008 and 2021 and real income per worker by 117%, while employment has barely grown at an aggregate level due to the crisis.
2.2 POPULATION TRENDS
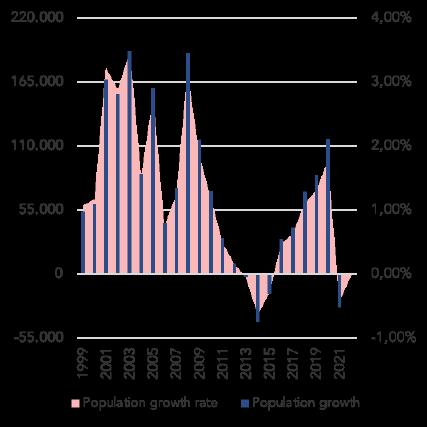
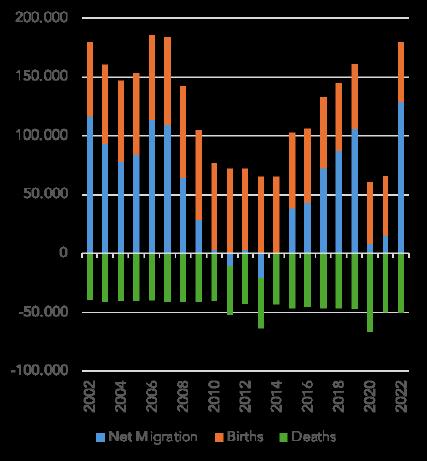
Figure 06 represents the annual population growth of the metropolitan city of the Community of Madrid, presenting both the percentage increase and the absolute number of individuals in which the population expanded. In the first decade of the 20th century, the metropolitan area witnessed a substantial growth of 1,253,276 people.
Throughout the period of analysis, the population growth rate fluctuated between 1% and 3.5%, except for the years 2014 and 2015, after the crisis period, when there was a decrease in the population by 58,555 people. After the pandemic (2021), the population also decreased by 28,637 people as a result of the population returning to the cities. Recent trends suggest the end of demographic decline, with signs pointing to a likely 0.5% growth that will persist into the future.
Figure 07 illustrates annual population growth, broken down into number of births, deaths, and net migration, with the goal of outlining the relative contributions of each to overall population growth within the metropolitan area.
Over the years, the metropolitan area has witnessed a constant number of births, around 64,000 births.
On the contrary, net migration has varied over the years, disappearing after periods of crisis and pandemic. The number of deaths has remained constant, around 44,000 deaths per year, increasing during the years 2013 (end of the crisis) and 2021 (after the pandemic).
Net migration has once again been the main driver of population growth within the metropolitan area, underscoring its fundamental role in shaping demographic trends and population dynamics.
2.3 ANALYSIS OF SECTORIAL EMPLOYMENT TRENDS
Figure 08 below illustrates the absolute sectoral share of employment within the Community of Madrid. In particular, the I05: Wholesale and Retail Trade, Transportation and Storage, and Public Administration and Defense sectors have consistently maintained the highest participation. Over the years, this share has remained around 26% and 23% respectively.
The predominance of these two sectors in terms of employment is not surprising, considering that we are talking about the country's capital. A large number of companies in the sector are based in the Community of Madrid, which contributes to the local employment scene.
On the other hand, there are sectors such as I01: Agriculture, forestry and fishing that have hardly any participation. An increase in the importance of the I09: Scientific, technical and administrative activities sector is also observed since 2000, which indicates that it could reach 20% participation.
Figure 06: Community of Madrid metro population growth. Source: INE Figure 07: Community of Madrid metro births, deaths and net migration. Source: INE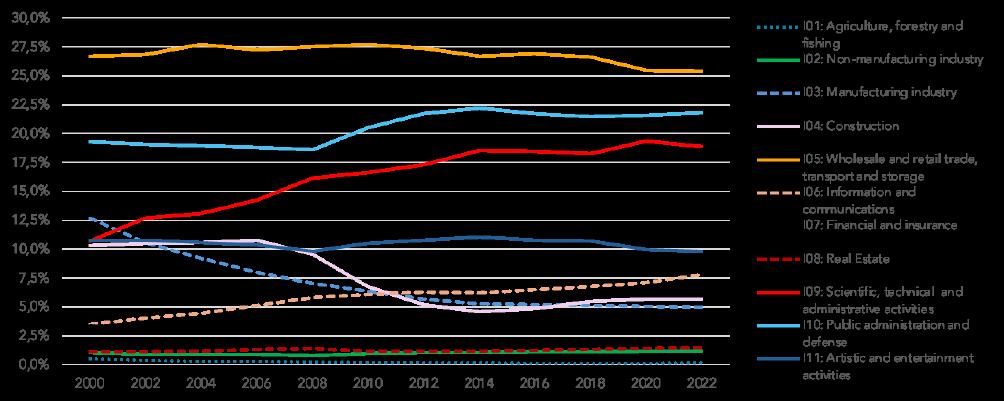
I05 sector: Wholesale and Retail Trade, Transportation and Storage is the one that occupies the first position in terms of employment, and has been this way since 2000 due to the large volume of activities that this sector develops in the capital of Spain. I10: Public administration and defense sector occupies second place in absolute terms of employment, currently standing at around 22%. It should be noted that this sector shows an upward growth trend that began in 2008, with the beginning of the crisis.
Following closely, the sector I09: Scientific, technical and administrative services has the third highest proportion of absolute employment, currently with around 18%, it has experienced great growth since 2000. In the municipality, the sectors that have lost weight Speaking in absolute terms of employment, I04:Construction has decreased by 5%, reducing its weight by half since 2008 as a consequence of the financial crisis suffered in the country and on the other hand, I03: Manufacturing Industry has gone from being ranked 13th. % to only 5% as a result of the automation of industrial processes. The rest of the sectors collectively contribute to a low combined absolute proportion without adding value to the rest of the study.
Table 02 presents the abbreviations utilized for each of the industrial sectors analyzed in this report. It's important to note that the agricultural sector is omitted from this analysis as it does not significantly influence the demand for real estate within a metropolitan area.
QSIC
QSIC
QSIC
Table 02: Sectorial abbreviations
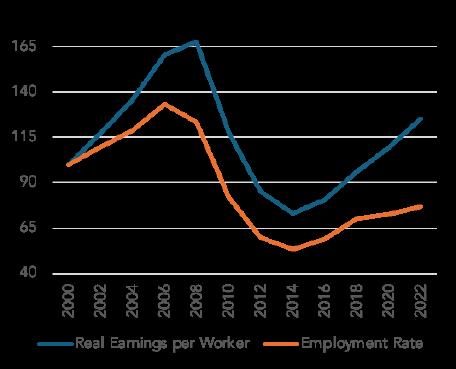
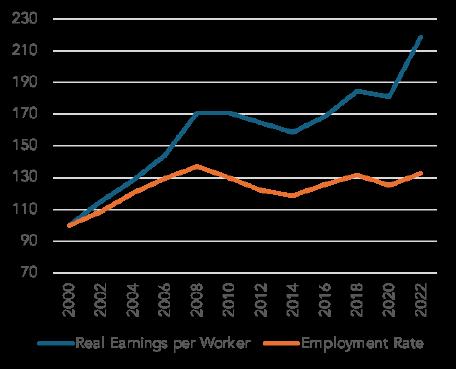
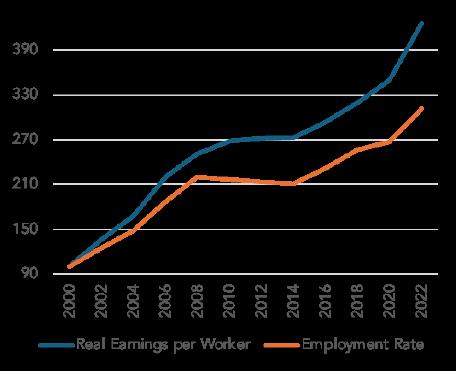
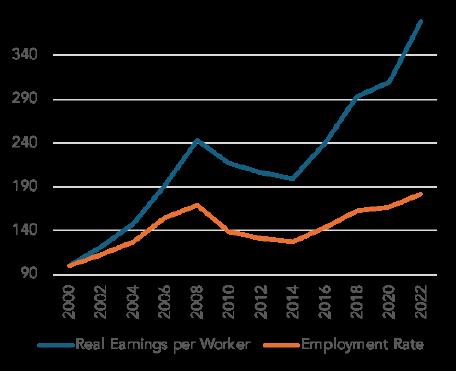
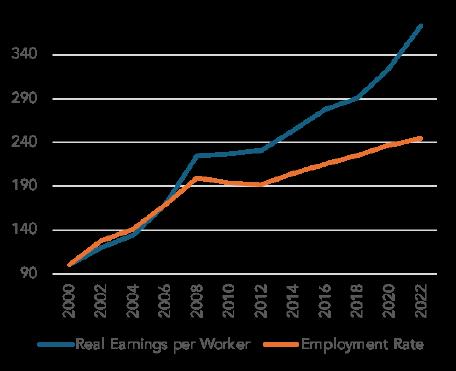
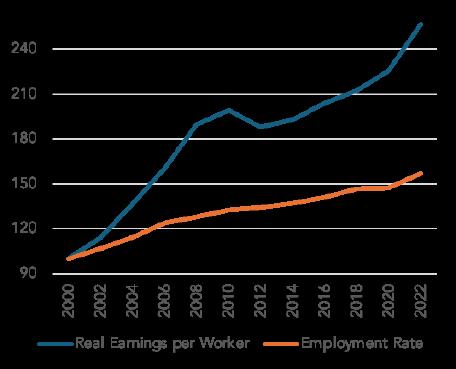
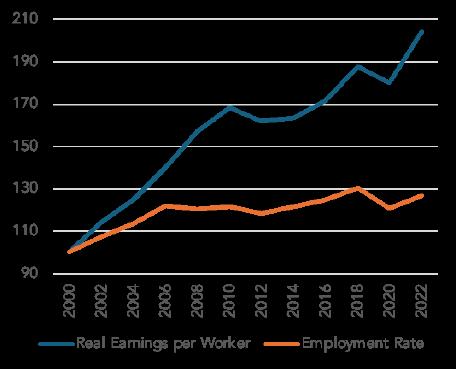
Figures 09 to 19 display plots depicting the employment and real earnings per worker, adjusted for inflation, for each of the 11 industrial sectors analyzed in this report converted into indices using 2008 as the base year.
Figure 08: Sectoral Absolute Employment Shares. Source: INEI01:
AGRICULTURE, FORESTRY AND FISHING
Agriculture, forestry and fishing sector has suffered a sharp decline in the number of workers since 2000, while real earnings per worker has fluctuated over time, experiencing a large increase in the last decade. Since 2016, real income per worker has almost tripled as a result of limited supply in this sector.
Agriculture, forestry and fishing sector is the sector with the lowest participation in gross terms of employment.
We are talking about a minority sector in the metropolitan area of the Community of Madrid that focuses its activities on the rest of the sectors.
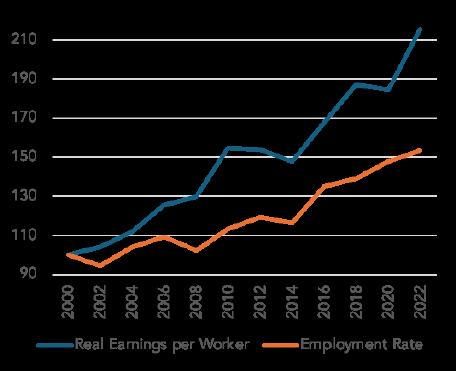
NON-MANUFACTURING INDUSTRY
I02:
I03: Manufacturing industry
03]
Non-manufacturing industry sector, real earnings per worker and employment rate have increased at the same time since the beginning of the period as a result of an increase in activities in this sector compared to the Manufacturing industry sector.
Real earnings per worker has doubled its value since the beginning of the period, going from 100 to more than 210.
Despite these great growths, Non-manufacturing industry sector continues to be one of the minority sectors in participation in terms of employment in the metropolitan area of Community of Madrid.
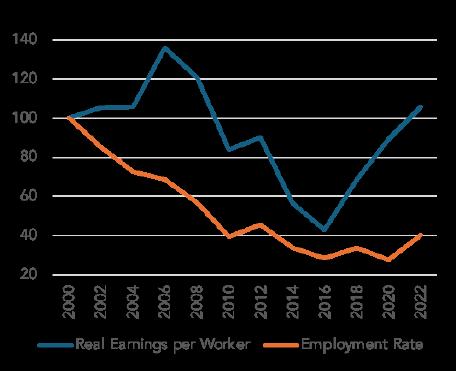
MANUFACTURING INDUSTRY
The Manufacturing industry sector has suffered a large decrease in the employment ratio from the beginning of the period until 2014 where it seems to have stabilized.
Likewise, real earnings per worker has followed the same path, experiencing a slight recovery starting in 2014 as a result of the lack of supply.
The trend indicates that real earnings per worker may reach values from the year 2000 as a consequence of the lack of workers in this sector, while the employment ratio will remain stable at the values reached since 2014.
Sector that has lost the most percentage of employment participation in recent years within the metropolitan area.
Figure 09: Agriculture, forestry and fishing. Source: INE Figure 10: Non-manufacturing industry. Source: INECONSTRUCTION
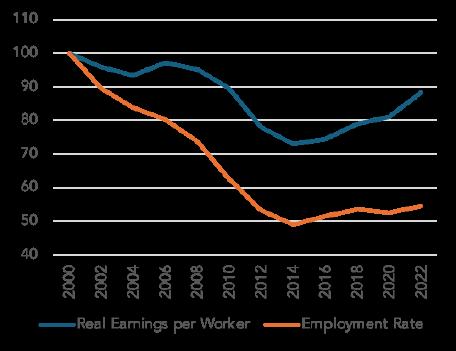
I04: Construction [QSIC 04]
I05: Wholesale and retail trade, transport and storage [QSIC 05]
I06: Information and communications [QSIC 06]
Construction sector is one of the sectors most affected by the period of financial crisis experienced between 2008 and 2013. Since the beginning of the crisis, a large number of jobs have been lost, as can be seen with the decrease in the employment ratio.
It can be seen how in this sector real earnings per worker and the employment ratio follow the same path.
The trend indicates an increase in real earnings per worker, reaching double the values of 2024. On the other hand, the number of jobs increases quite slowly, suffering a slowdown since 2018 that presumes the stabilization of the sector.
WHOLESALE AND RETAIL TRADE, TRANSPORT AND STORAGE
Wholesale and retail trade, transport, and storage sector, like the rest of the sectors to a greater or lesser extent, was affected by the crisis period. It is the most important sector in the metropolitan area of Community of Madrid in terms of employment participation.
The employment ratio grew until the beginning of the crisis, and since then, it has managed to remain stable, hovering around 130. Both the employment ratio and income evolved together until 2006, where real earnings per worker experienced significant growth, currently doubling the values from the beginning of the period.
The trend indicates that the number of jobs will remain stable, while real income per worker continues to grow.
INFORMATION AND COMMUNICATIONS
Information and communications sector has suffered enormous growth since the beginning of the period. The employment ratio has tripled despite having suffered a slight decrease during the crisis years.
In turn, real earnings per worker has followed the same path as the employment ratio. Without decreasing during the crisis period, it suffered a slight deceleration.
Currently, real earnings per worker has quadrupled the values at the beginning of the period in 2000. The trend indicates that they will continue to grow, maintaining the importance of this sector in the metropolitan area of Community of Madrid.
Figure 12: Construction. Source: INE Figure 13: Wholesale and retail trade, transport and storage. Source: INE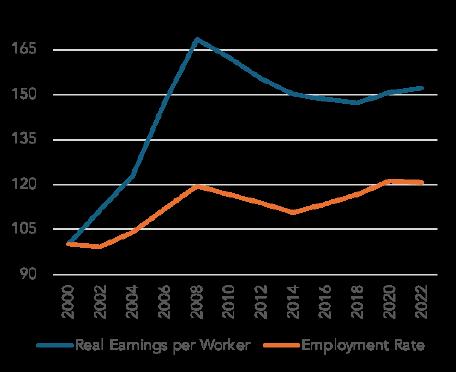
FINANCIAL AND INSURANCE
The Financial and insurance sector is one of the most affected by the crisis period. As you can see, real income per worker grew sharply until the arrival of the crisis, where they managed to maintain the fall at values of around 150.
On the other hand, the employment ratio follows the path of real earnings per worker in a more slight way, decreasing until 2014.
The trend indicates that both indices will remain stable in the future. This sector only represents a 2.5% share of the entire metropolitan area, so its variation is not influential for this study.
REAL ESTATE
Along with Construction and Financial and insurance sectors, Real Estate sector is one of those affected by the financial crisis that Spain experienced from 2008 to 2014.
Real earnings per worker has recovered the growth speed it had before the crisis, reaching three times the original values.
However, it is a sector in which the number of workers has not grown in the same way as income.
The crisis reduced supply, instilling fear in society. With little supply of workers, salaries will grow a lot in the future.
SCIENTIFIC, TECHNICAL
ADMINISTRATIVE ACTIVITIES
Scientific, technical and administrative activities sector is the third with the most weight in terms of employment in Community of Madrid. This is one of the sectors in which the crisis did not influence the change in these ratios.
The employment ratio has doubled since the beginning of the period at a high rate. In this case, the employment ratio and real income per worker grow together, although income from 2012 onwards experienced very sharp growth.
The trend indicates that both will continue to grow where income values will multiply by four the values of the year 2000.
Figure 15: Financial and insurance. Source: INE Figure 16: Real Estate. Source: INE ANDI10: Public administration and defense [QSIC 10]
PUBLIC ADMINISTRATION AND DEFENSE
The Public administration and defense sector is the second most important sector in terms of employment in the Community of Madrid. It is a sector used by administrations to control the GDP of a country, therefore it is not unusual to see how the number of jobs grows without being affected by periods of crisis or pandemic.
Real income per worker, for its part, is growing much faster than the number of jobs, experiencing greater growth after the crisis.
The trend indicates that it will continue to grow, being used as a tool to control the country's economic growth.
ARTISTIC AND ENTERTAINMENT ACTIVITIES
I11: Artistic and entertainment activities [QSIC 11]
2.3.1 LOCATION QUOTIENT
Artistic and entertainment activities sector is a sector of medium importance (10% participation) in terms of employment in the Community of Madrid.
As can be seen in the graph, the employment ratio grew until the beginning of the crisis and then has remained stable at that value. Real income per worker grows abruptly, well above the number of jobs.
After the beginning of the crisis, income decreased by around 10%, but managed to double the values of 2000 after overcoming a small period of slowdown during the covid pandemic.
The trend indicates that the employment ratio will remain stable while income will continue to grow.
The Location Quotient (LQ) represents the level of concentration of industrial activity of a particular sector compared to the level of concentration at national level. A location quotient of a particular sector grater than 100% would indicate that the activity within theSector is more concentrated within the Community of Madrid Metropolitan area than it is at a national level. Table 3 shows the location quotients for each industrial sector for the period from 2000 to 2022.
LQ = ( Metropolitan's Industry Employment
Metropolitan's Total Employment ) / ( Spain Industry Employment Spain Total Employment )
Information and communications sector [QSIC 06] had a location quotient of 160% in 2000, which has grown significantly to 260% in 2022. This growth supports the movement of Information companies to the large cities that make up the metropolitan area of the Community of Madrid.
Wholesale and retail trade, transport and storage [QSIC 05] sector, the sector with the greatest weight in terms of employment participation, had a location quotient of 100% in 2000, while in 2022 it has 90%. It is a very stable sector that lost 10% of its location quotient at the beginning of the crisis and has not been able to recover it.
Figure 18: Public administration and defense. Source: INE Figure 19: Artistic and entertainment activities. Source: INEThe Financial and insurance sector [QSIC 07] has slightly increased its location quotient by 30%. Companies in this sector want to maintain their headquarters in the capital, gathering their presence in the rest of the cities in Spain.
On the other hand, Agriculture, forestry and fishing [QSIC 01] sector has lost all its presence in the metropolitan area of the Community of Madrid, while Non-manufacturing industry [QSIC 02] and Manufacturing industry [QSIC 03] sectors have reached a location quotient of 50%, with half of presence of these sectors than in the rest of the country. Indicated in blue when LQs > 1.
The rest of the sectors have maintained their location quotient, varying in some by 10% above or below.
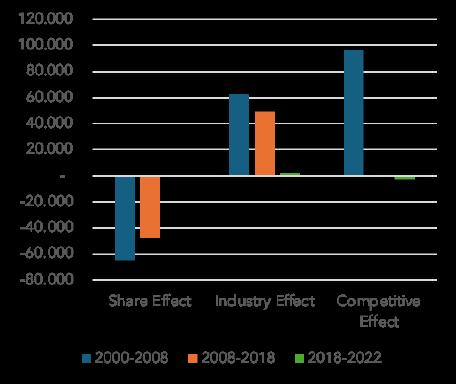
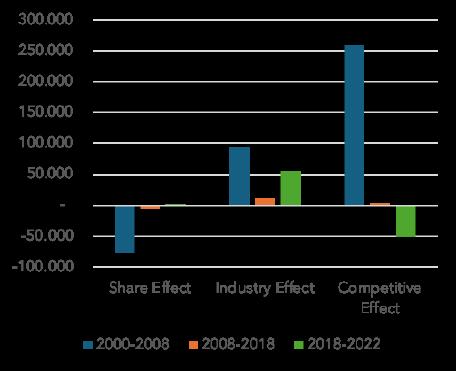
2.3.2 SHIFT - SHARE ANALYSIS
The shift-share analysis deconstructs the employment growth of each key industrial sector of Community of Madrid metropolitan into three components namely the share effect, the industry effect and the competitive effect. The share effect indicates how much a particular industry within the Community of Madrid metropolitan would have grown if it grew at the same rate as all other industries within the national economy. The industry effect indicates the additional growth that the Community of Madrid metropolitan is experiencing due its industry mix. The competitive effect indicates the growth that the Community of Madrid metropolitan is experiencing due to its competitive advantage over other metropolitans.
Figure 20 to Figure 30 show the shift-share analysis for
AGRICULTURE, FORESTRY AND FISHING
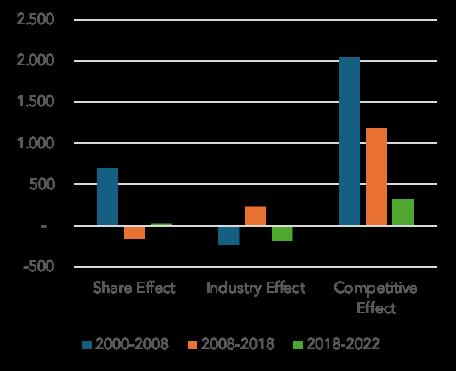
From 2000 to 2008, the competitive effect had the greatest influence on employment in the sector, resulting in the creation of 2000 jobs, while the share effect contributed 700 new jobs, and the industry effect led to the loss of 238 jobs. Overall, the sector gained 5102 jobs during the period, primarily attributed to jobs gained due to the competitive effect.
From 2008 to 2018, 158 jobs were lost due to the competitive effect, while the share effect and the industry effect jointly contributed to 1423 new jobs.
From 2018 to 2022, the sector lost 179 jobs due to the industry effect; however, the share effect and the competitive effect contributed 360 new jobs, resulting in an overall employment growth of 181 jobs. The metropolis has been gradually losing its competitive advantage over the years compared to the sector at the national level.
Table 03: Location quotient. Source: INE + own elaboration. each of industrial sector.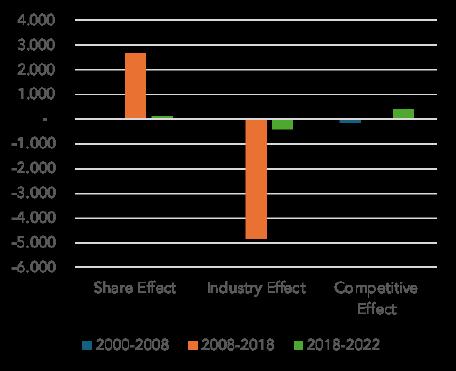
NON-MANUFACTURING INDUSTRY
From 2000 to 2008, minimal fluctuations occurred in the sector's effects, with the competitive effect leading to a loss of 153 jobs.
Between 2008 and 2018, the industry effect had the most significant impact, resulting in a loss of 4851 jobs. However, the share effect added 2680 new jobs, and the competitive effect contributed to 45 jobs, resulting in a net loss of 2126 jobs.
From 2018 to 2022, despite a loss of 441 jobs due to the industry effect, the share effect and competitive effect added 119 and 396 new jobs, respectively, leading to a modest overall employment growth of 74 jobs. Despite fluctuations, sector employment remained relatively stable throughout the study periods.
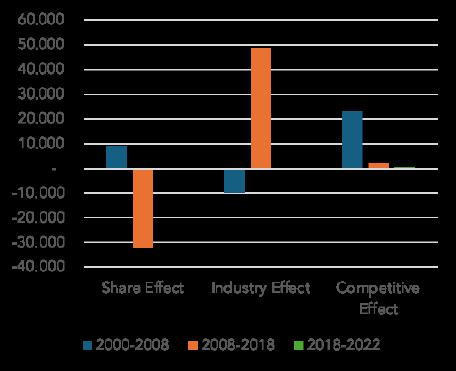
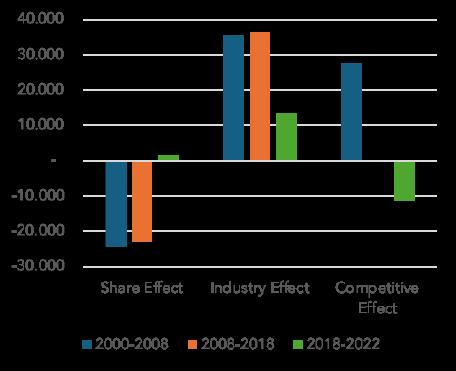
MANUFACTURING INDUSTRY
From 2000 to 2008, the sector experienced significant employment growth primarily due to the competitive effect, gaining 22,803 jobs despite losses from the industry effect.
Between 2008 and 2018, the sector faced challenges, with 32,293 jobs lost due to the share effect, while the industry effect created 48,604 new jobs.
From 2018 to 2022, despite minor losses from the industry effect, the sector saw a modest overall employment growth of 74 jobs, attributed to gains from both the share and competitive effects. Overall, recent years have seen the sector's employment stability affected by diminishing industrial importance.
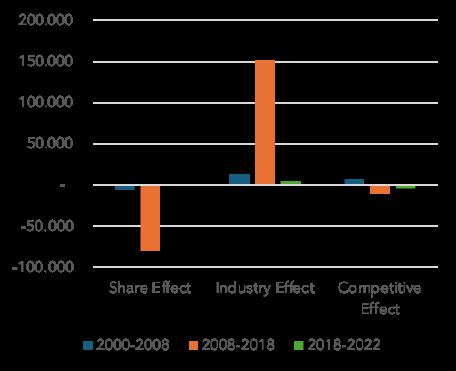
CONSTRUCTION
From 2000 to 2008, employment data in the construction sector remained very stable over the three study periods.
From 2008 to 2018, 79594 jobs were lost due to the competitive effect and 10306 due to the share effect, while the industry effect had a significant impact with the creation of a total of 151532 new jobs.
From 2018 to 2022, something similar to what happened in the first study period occurred, and the data remained relatively stable with no major changes. We observe the effects of the construction crisis, which has shifted from being one of the most potent sectors in job creation due to the industry effect to being a sector where much less employment is generated.
Figure 21: Shift-Share. Non-manufacturing industry. Source: INE Figure 22: Shift-Share. Manufacturing industry. Source: INEI05: Wholesale and retail trade, transport and storage [QSIC 05]
I06: Information and communications [QSIC 06]
I07: Financial and insurance [QSIC 07]
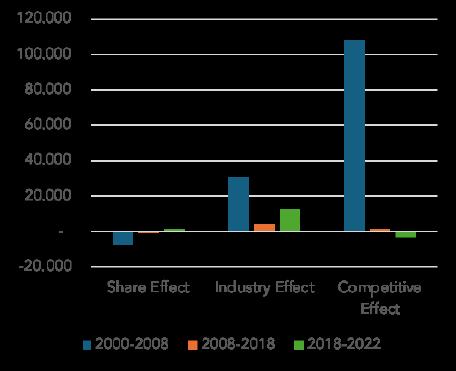
WHOLESALE AND RETAIL TRADE, TRANSPORT AND STORAGE
Between 2000 and 2008, sectors faced challenges, with significant job losses attributed to the share effect, partly offset by gains from the industry effect, yet overshadowed by a substantial competitive effect.
From 2008 to 2018, the industry saw mixed outcomes: job losses due to the share effect but gains from the industry effect, although dampened by a minor competitive effect.
In 2018-2022, a modest improvement occurred, with gains in the share and industry effects, offset by a decline in the competitive effect. Overall, there has been a drastic reduction in sector productivity, transitioning from substantial job creation to minimal gains.
INFORMATION AND COMMUNICATIONS
Between 2000 and 2008, the sector faced challenges, marked by a decline in the share effect, offset by a positive industry effect, yet overshadowed by a significant competitive effect.
However, from 2008 to 2018, there was a more balanced scenario: a decrease in the share effect alongside a positive industry effect, albeit with a moderate competitive effect.
Transitioning to 2018-2022, notable improvements emerged in the share and industry effects, although constrained by a decline in the competitive effect. Overall, the sector witnessed a drastic loss of significance in the competitive effect over the years, highlighting concerns at the national level.
FINANCIAL AND INSURANCE
Between 2000 and 2008, the sector encountered challenges, with a decline in the share effect, partially offset by a modest positive industry effect, yet tempered by a competitive effect.
From 2008 to 2018, there was mixed performance: a slight increase in the share effect, coupled with a small industry effect, offset by a negative competitive effect.
Moving to 2018-2022, a marginal improvement occurred, with slight increases in both the share and industry effects, but still impacted by a negative competitive effect. Since the 2008 crisis, the metropolis has been losing its competitive edge compared to the national sector.
Figure 24: Shift-Share. Wholesale and retail trade, transport and storage. Source: INE Figure 25: Shift-Share. Information and communications. Source: INEREAL ESTATE
I08: Real Estate [QSIC 08]
I09: Scientific, technical and administrative activities [QSIC 09]
I10: Public administration and defense [QSIC 10]
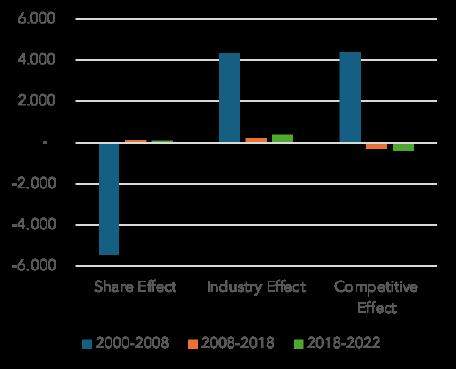
Between 2000 and 2008, the sector witnessed growth, with notable increases in the share effect and modest industry effect, overshadowed by a significant competitive effect.
However, from 2008 to 2018, challenges arose, with a decline in the share effect and minimal industry effect, alongside continued impact from the competitive effect.
Transitioning to 2018-2022, a resurgence occurred with increases in both the share and industry effects, though still impacted by a negative competitive effect. These trends underscore the sector's dynamic nature, influenced by various factors. Despite increasing industrial effect, the metropolis has been losing its competitive edge compared to the national sector over the years.
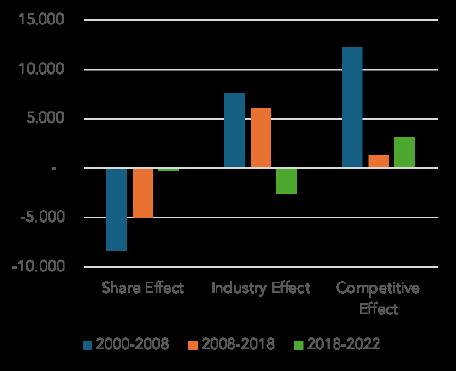
SCIENTIFIC, TECHNICAL AND ADMINISTRATIVE ACTIVITIES
Between 2000 and 2008, the sector encountered significant challenges, marked by a notable decrease in the share effect, partly offset by a positive industry effect, yet overshadowed by a substantial competitive effect.
However, from 2008 to 2018, there was mixed performance, characterized by a reduction in the share effect alongside a modest increase in the industry effect, while contending with a competitive effect.
Transitioning to 2018-2022, there was a notable improvement, with increases in both the share and industry effects, despite still being impacted by a negative competitive effect. The metropolis has lost its significant competitive advantage compared to the national sector over the years.
PUBLIC ADMINISTRATION AND DEFENSE
Between 2000 and 2008, the sector faced challenges, with a decrease in the share effect partially offset by a positive industry effect, yet tempered by a competitive effect.
Similarly, from 2008 to 2018, there was a decline in the share effect, coupled with a modest increase in the industry effect, albeit with minimal competitive effect.
Transitioning to 2018-2022, there was a notable improvement, with increases in both the share and industry effects, although still impacted by a negative competitive effect. These trends underscore the significant importance of the industry effect in this sector.
Figure 27: Shift-Share. Real Estate. Source: INE Figure 28: Shift-Share. Information and communications. Source: INEI11: Artistic and entertainment activities [QSIC 11]
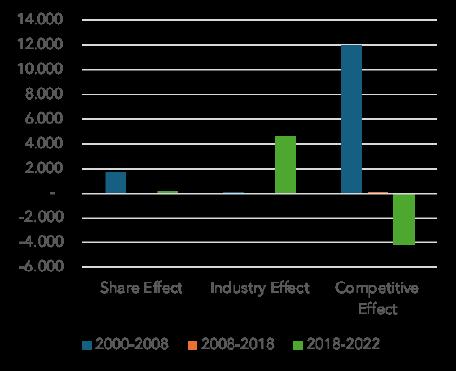
ARTISTIC AND ENTERTAINMENT ACTIVITIES
Between 2000 and 2008, the sector faced challenges, with a decline in the share effect, though offset by a positive industry effect, overshadowed by a significant competitive effect.
From 2008 to 2018, the sector continued to experience difficulties, with a further decrease in the share effect, coupled with a modest increase in the industry effect, yet with a relatively small competitive effect.
Transitioning to 2018-2022, the sector encountered continued challenges, with decreases in both the share and industry effects, partially offset by a positive competitive effect. The metropolis has gradually lost its competitive advantage over the years compared to the national sector, despite an increase in the last period.
ALL SECTORS
C00: All sectors resume [TOTAL]
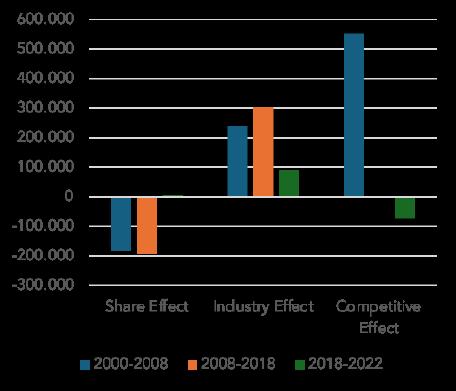
2.4 SYNTHESIS
We can observe that within all sectors, the competitive effect, which held significant relevance between 2000 and 2008, has greatly diminished in potential, even reaching negative territory in the final stage of the study. However, while the value of the industrial effect has decreased between 2018 and 2022, it has consistently remained highly relevant in job creation within the study area.Furthermore, the share effect, which initially yielded rather negative outcomes in the first two stages, has rebounded in the final stage to achieve a slightly positive figure. In summary, throughout all years of study, a total of 743,931 jobs were created, with 633,491 attributable to the industry effect and 478,695 to the competitive effect. Conversely, the share effect has been responsible for the loss of 368,256 jobs.
The period under analysis has been divided into three stages: the first from 2000 to 2008, prior to the financial crisis; the second from 2008 to 2018, coinciding with the financial crisis and its subsequent recovery; and a third stage from 2018 to 2022, during which economic recovery is hindered by the emergence of the pandemic. These series of events have led to a significant decline in employment during the first crisis, and a slightly milder one in terms of population during the second crisis caused by the pandemic. Although the employment rate has remained fairly stable since 2000, sectors such as manufacturing and construction have seen significant reductions over the years. However, scientific, technical, and administrative activities have increased, accounting for 65% of total employment along with public administration and defense, and wholesale and retail trade, transport, and storage. With the exception of deeply affected sectors such as construction or manufacturing, overall remuneration has increased due to rising demand.
Figure 30: Shift-Share. Artistic and entertainment activities. Source: INE Figure 31: Shift-Share. All sector resume. Source: INE2000 - 2008
Basic Statistics
Average annual rate of change
Population 2,56 %
Total employment 2,07 %
Table 04: Synthesis first period. Source: own elaboration
2008 - 2018
Basic Statistics
Average annual rate of change
Prevailing growth forces
• Scientific, technical and administrative activities
• Information and communications
Prevailing growth forces
• Construction
• Manufacturing industry Population 0,49 %
Total employment -0,53 %
Table 05: Synthesis second period. Source: own elaboration
2018 - 2022
Basic Statistics
Average annual rate of change
Population 0,43 %
Total employment 0,55 %
Table 06: Synthesis third period. Source: own elaboration
PROPERTY TYPE PROSPECTS
INDUSTRIAL
OFFICE
RESIDENTIAL
RETAIL
Prevailing growth forces
• Information and communications
• Scientific, technical and administrative activities
• The surge in demand for logistics warehouses will be propelled by non-manufacturing and Scientific, technical and administrative activities industry sectors.
• Conversely, demand for manufacturing space is on the decline due to the contraction of the manufacturing sector.
• Demand for office space is mainly driven by employment growth in the public administration and defense, information and communications and real estate sectors.
• The most requested location is the city of Madrid, with satellite municipalities becoming important.
• Although the number of births is decreasing over the years, net immigration has caused the population to grow by almost 200,000 people in the last year.
• This population growth and the increase in real income per worker make it necessary to have a large supply of housing in the metropolitan area to solve the housing problem in the community.
• The demand for commercial space is driven by the disposable income of the population residing within the metro. Rising income per worker will likely drive growth in demand for additional commercial space.
Table 07: Prospects. Source: own elaboration
2.5 CONCLUSIONS
The metro of the Community of Madrid has experienced growth driven by the demand for employment registered since the end of the crisis.
Demand-driven growth, coupled with inelastic labor supply, has resulted in real income per worker growing faster than employment. 45% of employment in the metropolitan area is found in two sectors: Wholesale and Retail Trade, Transportation and Storage; and Public administration and defense. The Scientific, technical and administrative services and Information and communications sectors have been experiencing strong demand-induced growth, driven by the preference of companies in this sector to establish their headquarters in the country's capital.
The metropolitan area is Spain's main financial services center and its large population and access to the international airport and two large train stations are good for the wholesale and retail trade, catering and accommodation sectors. The metropolitan area of the Community of Madrid serves as an example, promoting the rest of the country's territory.
3. MACRO ANALYSIS
The purpose of the macro analysis is to evaluate the overall market strength and anticipate the probable movements in market fundamentals influencing the supply and demand dynamics across different property sectors (such as industrial, office, residential, and retail) throughout the project's planning period. Irrespective of the property category, the macro analysis adheres to a consistent methodology involving the estimation of effective demand and the assessment of available and anticipated supply. By comparing the supply and demand factors, any gaps between supply and demand can be identified for each property type.
3.1 INDUSTRIAL MACRO ANALYSIS
The property under review is situated at the intersection of Mare Nostrum and Mar Adriatico streets, measuring 58.00 meters in length and 21.56 meters in width. Designated for residential use, any prospective industrial development would necessitate reclassification to permit industrial activities. Given its proximity to residential and commercial zones, any proposal to rezone the property for heavy industrial purposes is likely to face rejection. The only industrial endeavors conceivably acceptable would entail warehousing tailored for zero-emission, zero-effluent distribution centers, catering to retailers. However, the property's layout and positioning present challenges regarding the provision of adequate turning space and ingress/egress points, critical for distribution operations. Consequently, the industrial macro analysis will be omitted from this report due to these constraints.
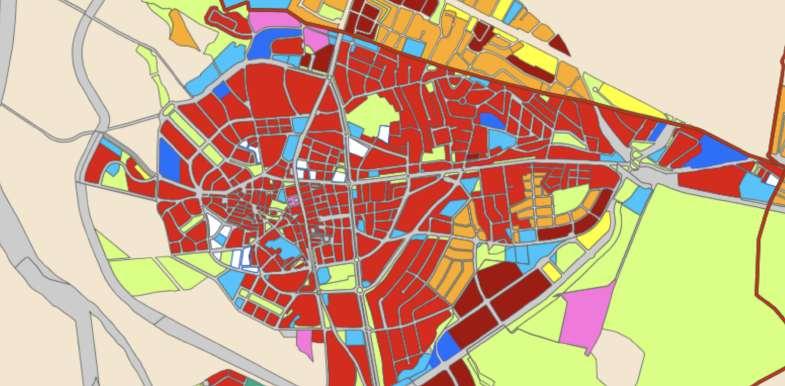 Figure 32: Site location (1:500) and plot dimensions. Source: google maps + own elaboration
3.2 OFFICE MACRO ANALYSIS
The macroeconomic analysis of the office market, similar to the previous examination of the industrial market, suggests the need for a reclassification of the land in question. Since the adjacent parcels and most of the Majadahonda metropolitan area are zoned for residential use, a change in designation poses significant challenges. The only viable scenario to incorporate offices on the plot would be to convert a residential unit into an office space, or for both residential and office activities to be carried out within the same unit. However, such considerations are not within the scope of this market study.
In the following section, we will further delve into the analysis of the residential market for the plot, with a particular focus on the metropolitan area of Majadahonda. It is assumed that Majadahonda serves as a dormitory municipality for Madrid, meaning that the majority of its residents commute to work in Madrid. Therefore, special attention will be given to its transportation connections with the city.
3.3 RETAIL MACRO ANALYSIS
Given the subject property's proximity to a mix of supra-regional and small regional shopping centers like the Sixth Avenue and Central West shopping centers, it is reasonable to conclude that the neighborhood is saturated with commercial space. Consequently, conducting a macroeconomic analysis of retail in this area is deemed unnecessary.

MAJADAHONDA
LeroyMerlin Majadahonda
Centro comercial Equinoccio Park Verdecora
3.4 RESIDENTIAL MACRO ANALYSIS
MediaMarkt
Centro Oeste shopping center
Sixth Avenue Shopping Center
This section of the analysis will evaluate the overall market strength and predict the probable shifts in housing demand and supply within the broader residential market in which the subject property is anticipated to compete upon completion of construction.
3.4.1 DEFINITION OF MARKET AREA
The standard methodologies for delineating the market area for a residential development generally operate under the premise that there is an acceptable maximum travel distance between the residence and the workplace. As previously noted, the majority of residents in the Majadahonda metropolitan area are employed in the city of Madrid, located approximately 20 kilometers away. Within Madrid, the primary commercial districts are concentrated in areas such as Nuevos Ministerios and Plaza Castilla in the city 22
Figure 34: Existing retail properties. Source: own elaborationcenter, as well as in municipalities like Alcobendas on the outskirts. However, it is essential to consider that these locations may not necessarily represent the main employment destinations for residents of Majadahonda, as employment opportunities in the Madrid Community are dispersed across various areas. Similar to Majadahonda, neighboring municipalities compete to accommodate Madrid workers who, with a medium to high income level, do not have a preference for one municipality over another except for housing prices. Figure 35 illustrates neighboring municipalities to Majadahonda in relation to Madrid.

MAJADAHONDA
MADRID
Figure 35: Market area (1:3.000). Source: google maps + own elaboration
Therefore, the market area in which the property in question will compete will be considered as the metropolitan area encompassing the municipalities of Majadahonda, Las Rozas de Madrid, Villanueva del Pardillo, Villanueva de la Cañada, Boadilla del Monte, and Pozuelo de Alarcón, using data from the National Statistics Institute (INE) for these municipalities.
3.3.2 TIME FRAME OF ANALYSIS
The analysis will encompass a timeframe of three years. This duration has been chosen to accommodate both the construction phase and subsequent marketing efforts for the completed development. Effective marketing and leasing of the entire development are paramount to optimizing the project's overall value.
•
Table 08: Time frame of analysis. Source: own elaboration
Hence, the finalized development will exclusively vie within the local residential market for a period of three years. Commencing from 2023 as a baseline, a prospective residential project on the specified property would ideally conclude construction and leasing activities by the conclusion of 2026.
3.4.3
ASSESSING HOUSING MARKET STRENGTH
The fundamental unit of demand for residential property is the household. Evaluating the existing levels of housing supply and demand in the local economy, alongside anticipated fluctuations in supply and demand over the subsequent three years, will ascertain the market conditions in which a potential residential development on the specified property will operate.
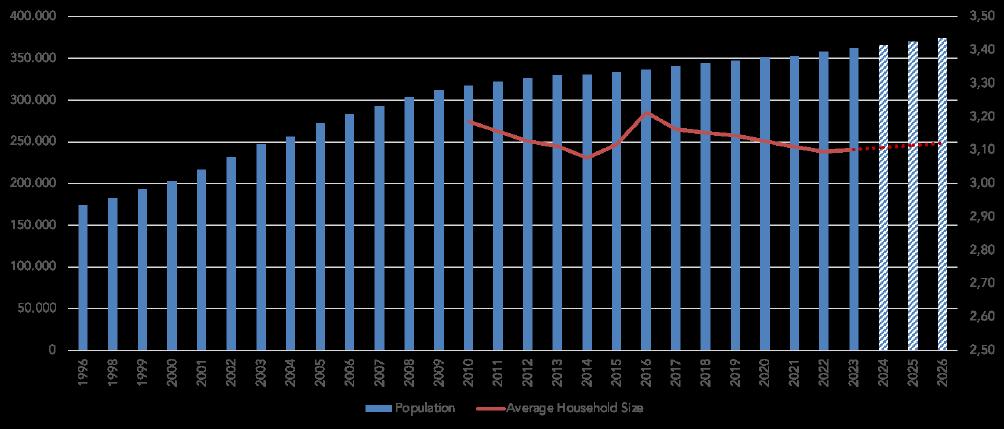
Figure 36 illustrates the population growth within the metropolitan area comprised of the municipalities of Majadahonda, Las Rozas de Madrid, Villanueva del Pardillo, Villanueva de la Cañada, Boadilla del Monte, and Pozuelo de Alarcón, throughout the analysis period, alongside the corresponding household size. It is projected that the population of the metropolitan area will rise from 362,327 individuals in 2023 to 374,099 in 2026, indicating an increase of roughly 11,800 people over the three-year span. Although the average household size has shown a downward trend since 2016, the forecast indicates that it will gradually increase over time. As expected, the average household size is expected to increase from 3.10 people per household to 3.12, representing marginal growth.
The population growth from 362,327 to 374,099 individuals, coupled with the slight decrease in average household size from 3.10 to 3.12 persons per household, is anticipated to drive the demand for residential real estate in the metropolitan area. Currently, there are an estimated 116,125 residential units in the metropolitan area, with approximately 7,748 units vacant. An assessment of the value of approved plans in the metropolitan area, along with the number of residential units for which plans have been approved, indicates that approximately 5,192 units will be introduced to the market over the next three years. A structural vacancy rate of 6.77% and a depreciation rate of 2% have been assumed.
Table
Figure 36: Population and household growth. Source: INE + own elaborationAccording to Table 10, an analysis of demand based on population growth indicates that there will be demand growth of 3,072 units over the three-year period of analysis. The expected new supply over the three-year period is estimated to be 5,192, which will include vacant stock and new completions. Therefore, it is estimated that the housing deficit is 1,157 residential units. This indicates that in 2026 the market will have a gap of 1,157 residential units, which represents 1% of the total household units.
3.4.4 SENSITIVITY ANALYSIS
After calculating the demand gap, a sensitivity analysis is performed to identify how susceptible the calculation is to changes in the determined variables. The variables under study are population, household size, and completions between 2023 and 2026, as they are based on estimations and are subject to potentially higher margin of error.
The sensitivity analysis reveals a high level of variation across each of the three scenarios, particularly in population data, where a deviation of 5% results in a 659% variation in housing gap data. This indicates substantial uncertainty regarding the market conditions, especially given the limitations inherent in estimation-based data.
Table 10: Expected housing GAP. Source: own elaboration Table 11: Sensitivity analysis summary. Source: own elaboration3.5 CONCLUSIONS
The macro analysis conducted an assessment of supply and demand levels for residential space with the aim of determining the presence of any demand gaps for each property type upon completion of development on the subject property. The timeframe from 2023 to 2026 was utilized as the estimated duration required for completing development on the subject property; therefore, the supply and demand estimates pertain to the year 2026.
Retail, office, and industrial macro analyses were not conducted due to the saturation of the local market with commercial space, and the unsuitability of the site for industrial purposes owing to its dimensions and inadequate access and egress.
The residential macro analysis revealed that the demand resulting from population growth indicates a projected increase in demand of 3,072 units during the three-year analysis period in the metropolitan area encompassing the municipalities of Majadahonda, Las Rozas de Madrid, Villanueva del Pardillo, Villanueva de la Cañada, Boadilla del Monte, and Pozuelo de Alarcón. The anticipated new supply over the three-year period is estimated to be 1,915 units, encompassing both vacant stock and new completions. An estimated housing gap of 1,157 residential units has been identified. This suggests that by 2026, the market will experience a deficit of 1,157 residential units.
4. MICRO ANALYSIS
The macroeconomic analysis has identified an unmet demand for residential real estate in 2026, with a positive demand gap of 485 household units, representing 2.01% of the total 24,142 household units in Majadahonda. This indicates potential profitability in developing residential properties on the specified site. The pertinent questions that arise pertain to determining the optimal type of residential development for the site and identifying the consumer segments to target to ensure project profitability. The microanalysis will concentrate on addressing two pivotal questions: firstly, the selection between two potential development options offered by the property – either a building featuring two- and three-bedroom apartments or a flexible living building offering studios and one-bedroom apartments; and secondly, identifying the primary demographic segments to focus on for this development.
4.1 RESIDENTIAL MICRO ANALYSIS
While macroeconomic analysis illuminates demand gaps in the broader housing market, the unique attributes of a particular site significantly influence a housing development's competitiveness relative to other properties and, consequently, its ability to address unsatisfied demand. The aim of microeconomic analysis is thus to refine the initial development plan, evaluate site-specific market dynamics, and project the revenue potential of the finalized product design. This analytical phase encompasses both qualitative and quantitative assessments.
The qualitative aspect involves scrutinizing the site and its immediate environs, local market conditions, and optimizing the product design to align with the preferences of target consumer groups likely to be attracted to the site. This entails identifying households with preferences harmonious with the site's characteristics and tailoring a residential product accordingly, whether it be a traditional community building or a flexible living space. This design choice aims to cater to both the site's attributes and the preferences of the identified target demographics. Conversely, quantitative analysis aims to pinpoint the most financially viable product design for the given site and project its revenue-generating potential accurately. Figure
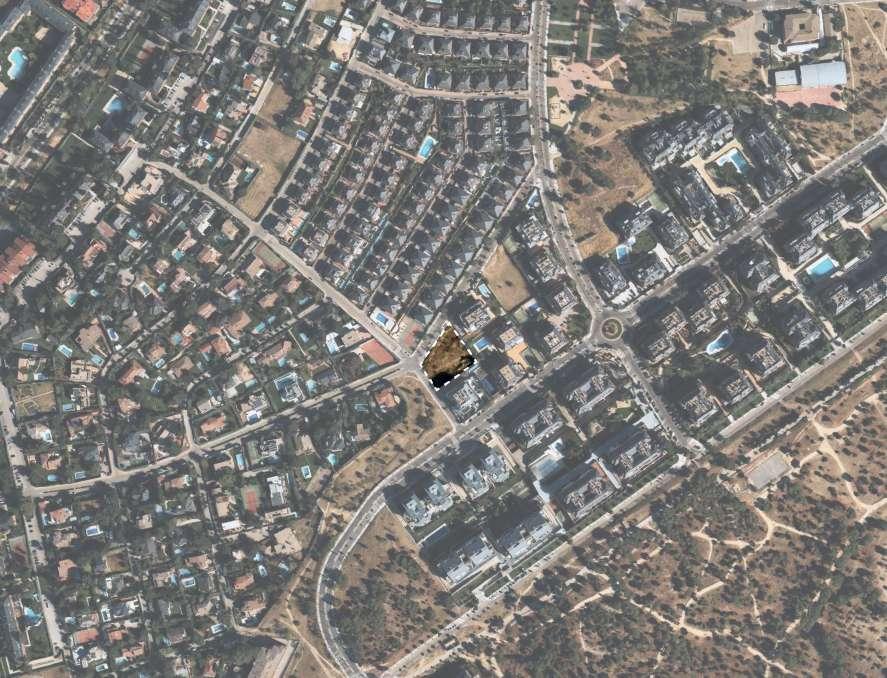
4.1.1 SITE LOCATION ANALYSIS
Figure 38 shows an aerial photograph of the site, which will serve as the focal point for the site and location analysis section of the residential microanalysis. The property is delimited to the north by Mare Nostrum Street and to the west by Mar Adriático Street.
Physical characteristics
Availability of utilities
Legal restrictions
Site environment
• The site consists of a plot 2,410 m2 in extent
• It is rectangle trapezoid in shape and has a flat topography
• There is no need for major bulk earthworks to level the surface
Bulk service connections will need to be established for:
• Water
• Sewerage
• Electricity
Plot B1: Mare Nostrum St. Majadahonda, Madrid is currently zoned as “Collective Residential”, it has a gross plot area of 2,410 m2 and a buildable area of 2,446.96 m2/ m2 of multi-family residential use for an indicative density of 16 homes.
Positive externalities:
• Located in a quiet residential area, surrounded by homes and green areas
• Large green spaces less than 10 minutes walk
• Quiet municipality away from the noise of the cities
Negative externalities:
• Far from the financial area of the community of Madrid
• Need to take the car for almost anything
Figure 38: Site location (1:500). Source: google maps + own elaboration Table 12: Site location analysis. Source: own elaborationNEIGHBORHOOD AND COMMUNITY ATTRIBUTES
Image Neighborhood quality:
• The plot in question is located in one of the best municipalities in the Community of Madrid, with one of the highest rents. Surrounded by residential municipalities, less than 20 minutes from the center of Madrid.
Crimes rates:
• Majadahonda crime statistics show that crime in the municipality has decreased by 14.9%, going from 2,004 cases in 2022 to 1,705 cases in 2023.
• A closer look at the different types of crimes reveals the main crimes are thefts and computer scams. Vehicle thefts have decreased by 60%.
Development stage
Demographic structure
Land use structure
Local public goods and fiscal environment
The neighborhood in which the property is located is an established neighborhood that has matured and has very little vacant land for development. With almost everything built there are hardly any empty lots to build on, therefore any new construction will be accepted.
The municipality of Majadahonda comprises a population consisting of 79.04% Spaniards, 12.80% Americans, and 4.47% Europeans, excluding Spaniards.

Spain
Europe (w/o Spain)
Africa
America
Asia
Oceania
The neighborhood primarily consists of freehold residential properties, with the property in question being closely surrounded by residential buildings and singlefamily homes. Approximately a 15-minute drive away, one can find Equinocio Park and Centro Oeste shopping centers, providing additional amenities and recreational opportunities beyond the immediate residential area.
Primary and secondary schools (closest 500 m) and hospitals (closest 2.10 km) shown in Figure 38 below. The closest university, 3.55 km away, cannot be seen on the map.
Sagrado Corazon Catholic School
Antonio Machado School
Francisco de Quevedo School
MAJADAHONDA
Caude School
Puerta de Hierro Hospital
El Tejar School
Rosalia de Castro School
Federico Garcia Lorca School
Majadahonda Hospital
4.1.3
ACCESS AND LINKAGES
Access to mayor employment
Access to services
The majority of Majadahonda's population commutes daily to Madrid for work across diverse sectors. The connectivity, facilitated by both public transportation and private vehicles, is direct and efficient.
As shown in the previous Figure 38, the area includes various amenities that provide comfort, such as schools and hospitals. Being primarily residential, there are no major retail stores in the vicinity, but there are large department stores on the outskirts.
Table 14: Neighborhood and community attributes. Source: own elaboration
4.1.4 ANALYSIS OF LOCAL REAL ESTATE MARKETS
Consumer information
Product information
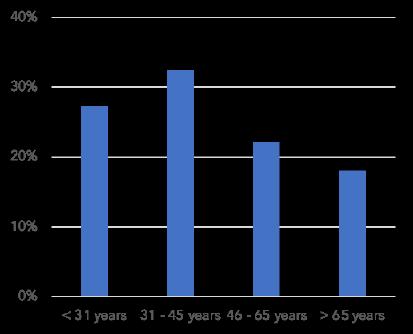
The majority of first residences are more than 30 years old, with 28% of homes less than 30 years old. Most of the first homes are between 30 and 45 years old.
Primary residences according to tenure status by average age of the household (Madrid)
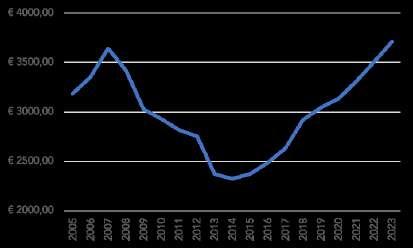
The average price of housing was affected by the financial crisis from 2008 to 2013, experiencing great growth since the end of the crisis, reaching €3,500 in 2022. More than 90% of homes are first homes.
Evolution of the average housing price €/m2
Household type tenancy
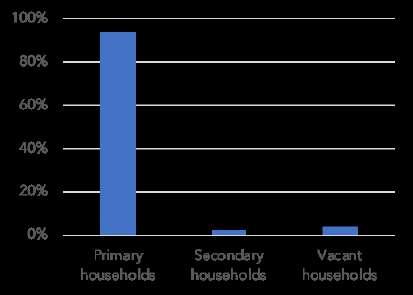
Table 15: Analysis of local real estate markets. Source: own elaboration
4.1.5 CONSUMER TARGETING AND REFINEMENT OF PRODUCT DESIGN
A comparison of available services and the types of services that various consumer/household groups value provides insight into the optimal residential development for the specific location. The analysis encompasses four distinct household types:
• College students: Young adults aged 18 to 25 who remain reliant on parental support.
• Young single professionals: Recently employed single young adults.
• Young couples (childless): Cohabiting young adults without children.
• Young families: Couples in their youth with small children.
• Mature families: Middle-aged couples with teenagers or grown children.
Based on the project evaluation matrix (Table 16), considering both the service mix of the subject property (located in the last column of the table) and the preferences of different consumer groups, it is evident that the subject property is highly conducive to a housing development targeting young families and mature families. This suitability stems from its location in a residential area distanced from universities and business centers.
4.1.6 ESTIMATING PROJECT RENT
In the process of estimating the rental potential of the project upon its completion, comparable properties in Majadahonda and neighboring municipalities such as Villaviciosa, Las Rozas, and Pozuelo de Alarcón are examined alongside the potential development on the subject property. The project's capacity to compete in the real estate market is assessed, serving as a foundation for projecting the potential rental income it would generate. The property proposal entails evaluating between a Build-to-Rent (BTR) development, which includes analysis of 2-bedroom and 3-bedroom units, or a Flex Living development, which involves assessing 1-bedroom units and studio apartments. These four distinct products are considered to inform the decision-making process.
OPCION 1: FLEX LIVING (single & 1-bedroom apartments)
Comparable single apartments
The apartments listed in the following table depict the three studios we are comparing with the studios intended for development in our project. The surface area ranges from 30 m2 to 50 m2, while the monthly rents vary between €700 and €1,147. The number of bathrooms is common in all case studies. The only comparable without lift is number 1, while number 3 is the most comprehensive in terms of services offered, as it includes laundry facilities, a gym, and 24-hour security.
Single apartments


Figure 40 below shows location of each comparable and the area where our project will be developed. Due to the lack of studio rental offerings in Majadahonda, we have had to select comparables located in nearby municipalities with similar characteristics. Majadahonda, Pozuelo de Alarcón, Villaviciosa de Odón, and Las Rozas are prosperous municipalities in the Community of Madrid, known for their high quality of life, green areas, cultural offerings, and commerce. Majadahonda, where the project will be developed, is residential and family-oriented. Pozuelo (comparable 1) is prosperous and business-oriented, Villaviciosa (comparable 2) combines modernity with history thanks to its university, and Las Rozas (comparable 3) stands out for its economic dynamism, natural spaces, and commercial offerings.
Table 17: single apartments comparable units. Source: Idealista Figure 40: location of single apartments comparable units. Source: Idealista
The competitive differential matrix, scores how well a development on the subject property would compete with the comparable properties with the intention of determining a reasonable rental that the development on the subject property would command. A studio on the subject property would command a rental of € 1.080 per month.
Comparable 1-bedroom apartments
The apartments listed in the following table display the three one-bedroom apartments which we proceed to compare with the one-bedroom apartments intended for development in our project. The surface area ranges from 50 m2 to 80m2, while the monthly rents vary between €850 and €1,100. The number of bathrooms and the presence of a terrace are common in all the case studies. The only comparable without a swimming pool is number 2, and the only one lacking a parking space is number 1.


 Table 19: 1-bedroom apartments comparable units. Source: Idealista
The location of each comparable and the area where our project will be developed can be observed on the map provided above. Comparable 1 is situated in the zone of Zona Norte, a residential neighborhood with ample green areas and modern infrastructure, renowned for its tranquility and quality of life. Number 2 is in the historic core of Majadahonda, characterized by its cobblestone streets, traditional architecture, and medieval charm. Lastly, number 3 is located in the Carretera del Plantío area, a residential zone close to the city center, with easy access to services, shops, and recreational areas. The project to be developed is situated on a plot in the Monte del Pilar area, a residential neighborhood blending modernity and nature, adjacent to the park of the same name, offering a serene environment and panoramic views.
The competitive differential matrix, scores how well a development on the subject property would compete with the comparable properties with the intention of determining a reasonable rental that the development on the subject property would command. A 1-bedroom apartment on the subject property would command a rental of € 1.200 per month.
Table 20: 1-bedroom apartments competitive differential matrix. Source: own elaborationOPCION 2: BUILD TO RENT (2-bedroom & 3-bedroom apartments)
Comparable 2-bedrooms apartments
The three 2-bedroom apartments listed in Table 21 have been identified as comparable assets for the 2bedroom apartments under consideration. These apartments range in size from 100 m2 to 115 m2, with rental prices ranging from €1,300 to €1,650 per month. Comparables 1 and 2 feature two bathrooms, whereas Comparable 3 has only one bathroom. All apartments are equipped with swimming pools and elevators. However, none of the comparables offer amenities such as security, a gym, or a clubhouse.
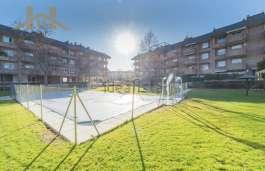

 Table 21: 2-bedroom apartments comparable units. Source: Idealista
Figure 42 below shows the location of each of the three comparable properties considered in the microanalysis. The three properties are located within the residential area of the municipality of Majadahonda, with comparables 1 and comparable 2 being the closest to the center of the municipality while comparable 3 is the closest to the plot.
Table 21: 2-bedroom apartments comparable units. Source: Idealista
Figure 42 below shows the location of each of the three comparable properties considered in the microanalysis. The three properties are located within the residential area of the municipality of Majadahonda, with comparables 1 and comparable 2 being the closest to the center of the municipality while comparable 3 is the closest to the plot.
The map provided above illustrates the location of each comparable property alongside the area designated for our project development. Comparable 1 resides within the historic center of Majadahonda, known for its cobblestone streets, traditional architecture, and medieval allure. Comparable 2 is situated in the Carretera del Plantío vicinity, an urban residential area in close proximity to the city center, providing convenient access to amenities, retail outlets, and recreational spaces. Lastly, comparable 3 is positioned within the Zona Norte neighborhood, characterized by expansive green spaces and contemporary infrastructure, renowned for its peaceful ambiance and high quality of life. The prospective project site is situated within the Monte del Pilar area, an urban neighborhood that seamlessly integrates modern amenities with natural surroundings. Adjacent to the park of the same name, this location offers a tranquil setting and panoramic vistas, fostering a serene living environment.
The competitive differential matrix, scores how well a development on the subject property would compete with the comparable properties with the intention of determining a reasonable rental that the development on the subject property would command. A 2-bedroom apartment on the subject property would command a
of € 2,100
Table 22: 2-bedroom apartments competitive differential matrix. Source: own elaborationComparable 3-bedrooms apartments
The three 3-bedroom apartments listed in Table 21 have been identified as comparable assets for the 3bedroom apartments under consideration. These apartments range in size from 100 m2 to 115 m2, with rental prices ranging from €1,300 to €1,650 per month. Comparables 1 and 2 feature two bathrooms, whereas Comparable 3 has only one bathroom. All apartments are equipped with swimming pools and elevators. However, none of the comparables offer amenities such as security, a gym, or a clubhouse.


 Table 23: 3-apartments comparable units. Source: Idealista
Figure 43 depicted below illustrates the positioning of the three comparable properties scrutinized in the microanalysis. All three properties are situated within the residential precinct of Majadahonda municipality, with comparable 3 positioned closest to the municipality's center, while comparable 1 is the closest to the plot in question.
Table 23: 3-apartments comparable units. Source: Idealista
Figure 43 depicted below illustrates the positioning of the three comparable properties scrutinized in the microanalysis. All three properties are situated within the residential precinct of Majadahonda municipality, with comparable 3 positioned closest to the municipality's center, while comparable 1 is the closest to the plot in question.
The map above illustrates the location of each comparable property in proximity to the designated area for our project development. Comparable 2 is situated near Carretera del Plantío, an urban residential zone very close to the city center, providing convenient access to services, retail establishments, and recreational facilities. Conversely, comparable 3 is positioned within the Zona Norte neighborhood, distinguished by its expansive green spaces and contemporary infrastructure, renowned for its tranquil atmosphere and superior quality of life. Comparable 1, along with the potential project site, is situated within the Monte del Pilar area, an urban neighborhood that seamlessly combines modern amenities with natural surroundings. Adjacent to the park of the same name, this location offers serene surroundings and panoramic vistas, creating an idyllic living environment.
Table 24: 3-bedroom apartments competitive differential matrix. Source: own elaboration4.1.7 CONCLUSION: PROPOSED DEVELOPMENT SCENARIO
Continuing with the specifications outlined by the property, the study's findings are presented for Flex Living (1-bedroom apartments and studios) and Build-to-Rent (BTR) (2 and 3-bedroom apartments). Considering the urban constraints of the site, the proposal suggests 37 studios and 13 1-bedroom apartments for Flex Living, while 10 2-bedroom residences and 10 3-bedroom apartments are recommended for BTR.
The Flex Living residential development would comprise 1-bedroom apartments and studios, projected to command rents of €1,200 and €1,080 per month, respectively. This proposed configuration would encompass 50 residential units, with amenities such as a swimming pool, gym, 24-hour security, and clubhouse deemed necessary to maintain competitiveness in the market. Conversely, the BTR residential development would feature 2 and 3-bedroom apartments with estimated rents of €2,100 and €2,700 per month, respectively. This envisioned setup would consist of 20 residential units, including provisions for a garage, swimming pool, gym, 24-hour security, and clubhouse to remain competitive in the market.
Given the circumstances, the property is better suited for a residential development comprising 2 and 3bedroom apartments, aligning with the area's characteristics and market demands, potentially yielding a monthly income of €48,000. However, for maximal revenue generation, pursuing the Flex Living residential development would be ideal, projected to yield a monthly income of approximately €55,560. It's worth noting that tenant acquisition may be more challenging for Flex Living, as it caters to university students and young adults, and the property's location is distant from major universities, resulting in a narrower target audience compared to BTR.
4.2 CONCLUSIONS
The microanalysis primarily concentrated on potential residential development, as commercial, industrial, and office projects were deemed unlikely to be feasible. It specifically examined the opportunities presented by Flex Living and Build-to-Rent (BTR) options. The analysis pinpointed target market segments that would be attracted to and resonate most with the amenities offered by the subject property, identifying young families and middle-aged families as particularly suitable demographics. Additionally, it identified comparable properties against which a development on the subject property would compete, as well as the amenities necessary for the subject property to effectively compete in the market.
Table 25: conclusions Flex Living. Source: own elaboration Table 26: conclusions BTR. Source: Idealista