August 2023
A Special Research Report by FiduciaryPathTM

Approximately 37% of Public Charities Tell IRS, Under Penalty of Perjury—“We Don’t Pay Any Investment Management Fees”
New Research reveals inconsistent public charity reporting of investment management costs; significant opportunity for IRS, CPAs, legal counsel, and advisors to help nonprofits fulfill their fiduciary responsibilities.

Allan Henriques, JD, Board Certified FiduciaryTM
Kathleen McBride, Board Certified FiduciaryTM
©2023 FiduciaryPath, LLC
©2023 FiduciaryPath, LLC

©2023 FiduciaryPath, LLC Introduction 1 Summary of Findings 2 Enhancing Donor Trust 3 The Data Source: The Form 990 Filings 4 The Money, The Law, and Board Member Challenges 5 Where to Start? 6 Are Public Charities Paying “Only Reasonable” Investment Management Costs? 7 A Closer Look at the Five Universities with the Largest Investment Funds 10 Unexplained Institutional Charitable Gift Fund Reported Investment Expenses 11 Surprising Reports Filed by Paid Preparers 12 Other Observations 13 What Do The IRS Filings Tell Us About Reported Public Charity Investment Management Fees? 14 Three Simple Questions Every Public Charity Board Member Should Ask Their Advisors 15 How Public Charities Can Assure Accurate Investment Fee Information and the Opportunity for Advisors 16 The Missing Link 19 Calls to Action 19 Our Recommendations 20 About the Authors 22 Appendix: Sample “Annual Statement of All Investment Management Fees, Including Direct and Indirect Expenses for Investment Consulting and Portfolio Management" 23 Endnotes 34 Table of Contents

FiduciaryPath™, LLC is an independent fiduciary consulting firm, not an investment advisor. We realize that nonprofits have limited resources and time. We help nonprofits achieve more of their mission, increase donor trust, and generate impacts donors appreciate.
Our sole objective is to help nonprofits effectively and prudently achieve their mission, so they can be the nonprofits that donors want to support, donors love, and better achieve their mission.
Let us be your guide:
• Know Your Investment Costs—Many nonprofit fiduciaries don’t know the all-in direct and indirect costs they pay for the nonprofit’s investments. That’s important because the law that governs nonprofits says nonprofits must “Incur only reasonable costs in investing and managing charitable funds.” We’ve developed a process and a tool to gather (and help reduce, when appropriate) your investment costs. How can you be sure that your nonprofit is getting the most out of your investments if you don't know what you are paying for those investments?
• Nonprofit Fiduciary Oversight Responsibilities and Tasks —Build a Nonprofit FORT©. We’ve identified 63 tasks that nonprofit fiduciaries must complete each year. Many can be delegated to service providers. When you see who is responsible for each task at a glance, oversight of your nonprofit’s investments is much easier.1
• Implement Safe Harbors Transfer many of your fiduciary investment risks to professional fiduciary service providers.
• Select Fiduciary Service Providers Hire prudent experts to manage your nonprofit’s investments in the best interest of your nonprofit, beneficiaries, and mission. Request for proposal (RFP) management: criteria, selection, and implementation.
• Delegate to Professional Fiduciaries Delegate fiduciary tasks to professional fiduciaries. We’ll show you how to reduce your liability and improve services by properly delegating to professional fiduciaries.
• Have an Investment Policy that Benefits Your Organization Update your Investment Policy Statement (IPS) to ensure it benefits your nonprofit’s strategic goals, objectives, mission, and beneficiaries.
• Be a Better Fiduciary Training for Lay Fiduciaries If you’re a nonprofit board member or an executive officer, you’re a fiduciary! This is what nonprofit leaders must know to be a better fiduciary.
• Professional Continuing Education Training for CPAs, attorneys, and investment advisors.
• Consultation and Fiduciary Support Services For CPAs, attorneys, and investment advisors.
©2023
1
FiduciaryPath, LLC
Introduction
Summary of Findings
From GuideStar’s downloads of Form 990s filed with the IRS, we reviewed information filed by over 15,000 public 501(c)(3) charities—all with at least $1 million of investments—responsible for managing over $1.9 trillion of “Investments/Securities.” 2
Our inquiry focused on the investment management fees reported (“IM Fees”) by these public charities. The findings include:
1. Approximately 37% of public charities reporting to the IRS (5,533 organizations responsible for about $348 billion) state, under penalty of perjury, that they pay no IM Fees.
2. The remaining 63% of these public charities (9,483 organizations responsible for managing about $1.587 trillion), on average, report that they pay IM Fees of just under half (0.30%) of what their private foundation counterparts report (0.64%).
3. As would be expected among those organizations reporting they pay IM Fees, average fees are generally less for larger investment pools than smaller investment pools. While fees reported by private foundations tend to confirm this, data reported by public charities fail to match this pattern consistently.
4. A much higher percentage of public charities than private foundations report paying no IM Fees, regardless of the amount of assets managed.
5. Reported IM Fees reveal unexpected and apparent inconsistencies that may reflect incomplete and/or possible underreporting of IM Fees.
6. Approximately 25% of CPA firms serving as “paid preparers” reported they had both clients that incurred IM Fees, and others that paid no IM Fees. Fifteen percent of these firms (102 CPA firms) filed 20 or more Form 990s.
7. Data filed by public charities, reporting they incur no IM Fees, raise questions regarding these charities’ possible failure to meet their legal responsibility to ensure they incur only reasonable investment costs and/or to verify relevant facts.
8. Significant value-added opportunities exist for the IRS, CPAs, legal counsel, and advisors to better assist nonprofits to fulfill their fiduciary responsibilities.
9. The IRS could provide the missing link that would potentially fill the current “investment cost knowledge gap” throughout the public charity universe.
10. A sample public charity Investment Management Fee data gathering document can be found in the Appendix.

©2023 FiduciaryPath, LLC
2
Data filed by public charities that report having no IM Fees raise questions regarding their possible failure to meet their legal responsibility.
Enhancing Donor Trust
After numerous discussions with and questions from nonprofit leaders, it is apparent that there is a fair amount of mystery surrounding investment management fees (IM Fees) and how these costs impact public charities’ bottom lines.

Recognizing that most public charities face limited financial resources, we felt a better understanding of IM Fees incurred could potentially:
• Assist public charities to verify that they were paying only reasonable IM Fees;
• Enhance public charities’ net investment returns; and
• Reinforce donor trust that contributions are being wisely managed by the organizations they support.
What we didn’t anticipate when we began our investigation was the wide disparity in how investment costs are reported by public charities and that more than one-third report that they’re getting “a free lunch” by paying no investment costs. Additionally, it became apparent that even if public charities accurately reported their investment costs, there was no readily available data source to facilitate public charity peer benchmarking to help determine if a public charity was incurring only reasonable IM Fees.
©2023 FiduciaryPath, LLC
What we didn't anticipate when we began our investigation was the wide disparity in how investment costs are reported by public charities and that more than one-third report that they’re getting “a free lunch” by paying no investment costs.
3
The Data Source: The Form 990 Filings

Charitable organizations are generally required to file an annual “information return”3 with the Internal Revenue Service (IRS) to maintain their tax-exempt status. Specifically, public charities with annual gross receipts of $200,000 or more, or total assets of $500,000 or more, are required to file Form 990.
Both an officer of the charity and the “paid preparer” (typically the charity’s CPA firm) sign Form 990 in the Signature Block, which states:
“Under penalty of perjury, I declare that I have examined this return, including the accompanying schedules and statements, and to the best of my knowledge and belief, it is true, correct, and complete. Declaration of preparer (other than officer) is based on all information of which preparer has any knowledge.”
Once filed, these information returns are available for public inspection and provide the operational and financial information required by law and deemed necessary by the Secretary of the Treasury. IRS Form 990 Instructions state:
“Some members of the public rely on Form 990 or Form 990-EZ as their primary or sole source of information about a particular organization. How the public perceives an organization in such cases can be determined by information presented on its return.”
Consequently, Form 990 is the official reporting mechanism by which charities annually detail critical information about their activities and finances, which is relied upon by both the IRS and the public to be accurate. It is designed to promote broad transparency and credibility of organizations granted special tax-exemption status. This, in turn, enables donors to receive favorable tax treatment on money or assets they give to charities.

©2023 FiduciaryPath, LLC
4
Form 990 is designed to promote broad transparency and credibility of organizations granted special tax-exemption status.
The Money, The Law, and Board Member Challenges
The footprint of US public charities and their financial impact is staggering4:
• More than 12 million board members, leading
• More than 1.5 million public charities, responsible for
• Managing approximately $4.9 trillion.
Their investment management responsibilities are governed by the Uniform Prudent Management of Institutional Funds Act (UPMIFA),5 as adopted by the charity’s home state. Among other factors, UPMIFA requires these charities, and those who manage and invest their funds, to:
• Act in good faith, with the care an ordinarily prudent person would exercise;
• Incur only reasonable costs in investing and managing charitable funds; and
• Make a reasonable effort to verify the accuracy of relevant facts.
In essence, UPMIFA was adopted to provide clear standards for how charities must responsibly manage themselves to merit the trust of their donors and the public.
Donors have the right to, and do, expect public charity board members and executive staff to:
• Exhibit competence,
• Exercise prudence,
• Do the right thing with the funds entrusted to a charity.
A relevant truism is: “For a nonprofit, reputation is essential.”6
No surprise there.
Based on academic research, however, it appears many nonprofits face serious competency and credibility challenges:
• Fewer than half of nonprofit directors think that their board has a solid understanding of their responsibilities.7
• One in four people do not trust charities.8
Think about that for a moment. If half of the people in charge of nonprofits don’t understand their responsibilities, then roughly six million board members are not fully conversant with or even aware of the procedures and actions required to manage the $4.9 trillion for which they are responsible.
Perhaps, there is a factual basis for the lack of public trust.

©2023 FiduciaryPath, LLC
5
A relevant truism is: “For a nonprofit, reputation is essential.”
Our review of Form 990s filed with the IRS focused on public charities’ legal obligations to act prudently, to incur only reasonable investment costs, and to verify relevant facts. The data reveal significant opportunities for IRS, CPAs, legal counsel, and advisors to better assist their nonprofit clients overcome these competency and credibility challenges—and fulfill their fiduciary responsibilities.
Where to Start
It is important to note that our research focused solely on investment costs. A complete “prudence analysis” would also include consideration and evaluation of investment objectives, risk, and performance—three factors not specifically addressed in Form 990. Consequently, our research data provide only potential inferences of prudence (or lack thereof) based on investment cost data reported (or not reported) on Form 990.
The key data point in Form 990 regarding investment management costs is Part IX, “Statement of Functional Expenses” which includes line 11f: “Investment Management Fees.” IRS instructions for this item state:
“Enter amounts for investment consulting and portfolio management. Monthly account service fees are considered portfolio management expenses. Don’t include transaction costs such as brokerage fees and commissions, which are included on part VIII, line 7b.”
The two-step process discussed below can help to determine whether a charitable nonprofit is paying reasonable investment management fees:
Step One: Obtain the investment management fee data for each investment.
Step Two: Compare the data compiled in Step One with the fees that other similar organizations and similar investment amounts are paying a comparable benchmark.
Obtaining that information is not always easy. Investment management fees differ widely among providers and are dependent on the type of assets invested (prudent investment portfolios tend to be well-diversified among multiple investment asset classes), the amount invested, and expected risk exposure. Once this information is located and confirmed, a refinement would then be to compare an organization to organizations of similar size, asset allocations and amounts invested.
©2023 FiduciaryPath, LLC
6
A complete “prudence analysis” would also include consideration and evaluation of investment objectives, risk, and performance three factors not specifically addressed in Form 990.
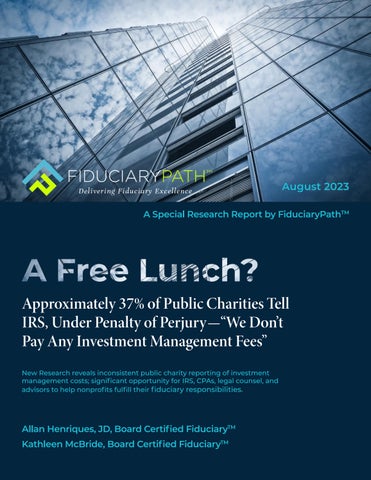
As an initial reference point, below are examples of average annual expense ratios for a variety of investment solutions, ranging from 0.06% for equity index mutual funds to 1.37% for hedge funds (not including additional “incentive” or “carrying fees”).9
So, what did these public charities tell the IRS?
Are Public Charities Paying “Only Reasonable” Investment Management Costs?

GuideStar (www.guidestar.org) provides information on public charities, including electronic data access to 50 data fields from Form 990s charities have filed with the IRS, to promote greater public charity transparency and awareness. Our review of over 15,000 filed Form 990s reported by GuideStar (all responsible for at least $1 million of investments/securities) provides new insights into the amounts and types of assets public charities manage, including investments/securities and investment management fees.10
So, what did these public charities tell the IRS?
©2023 FiduciaryPath, LLC
7
Source: ICI Research Perspective, March 2021, “Trends in the Expenses and Fees of Funds, 2020,” and HFR Microstructure Hedge Fund Industry Report Year End 2020
If we’re to believe what the public charities reported, under penalty of perjury, many believe they are getting a “free lunch” and incur no investment costs:
• Approximately 37%—5,533 managing about $348 billion assets under management (AUM) report they pay no IM Fees; and
• The remaining 63%—9,483 managing about $1.587 trillion, on average, pay a little less than half (30 BPS) of what their private foundation counterparts report paying (64 BPS) for investment management.
An experienced investment manager would generally expect IM Fees, as expressed in basis points (BPS), to be lower for larger investment pools than for smaller investment pools. Form 990 data tends to confirm this for both public charities and private foundations. However, the data fail to show a consistent pattern for public charities.
At each asset range in the table, the Form 990 data reveal that a significantly greater percentage of private foundations report incurring IM Fees than their public charity colleagues. As the invested amounts decline, the percentage of organizations reporting they incur investment management costs also tends to decline. However, for public charities, the decline is precipitous (from 80% to 32%) while relatively modest (from 96% to 85%) for private foundations.
Charities Reporting and Not Reporting Investment Management Fees
©2023 FiduciaryPath, LLC
Number of Organizations Percent of Organizations Total AUM % of AUM Total Fees Reported Percent of Total Fees Reported Avg. Fees % (BPS) Private Foundation Avg. Fees % (BPS) Totals for Organizations Reporting Investment Management Fees 9,483 63.2% $1,587,765,260,823 82.0% $4,828,878,813 100% 0.30% .64% Totals for Organizations Reporting No Investment Management Fees 5,533 36.8% $348,222,938,007 18.0% N/A N/A N/A .64% Totals 15,016 100% $1,935,988,198,830
8
If we’re to believe what the public charities reported, under penalty of perjury, many believe they are getting a “free lunch” and incur no investment costs.
Source: Form 990 Research by FiduciaryPath obtained from Guidestar Database
Source: Form 990 Research by FiduciaryPath obtained from Guidestar Database
Charities
Investment Management
Public Charities Reporting Investment Management Fees Private Foundations Reporting Investment Management Fees Asset Range No. of Organizations Percentage No. of Organizations Percentage Over $500 Million 465 80.0% 248 96.0% $100-$500 Million 1,277 76.1% 1,057 95.3% $50-$100 Million 1,090 72.8% 1,232 94.5% $25-$50 Million 1,584 70.1% 2,256 94.0% $10-$25 Million 2,563 62.6% 5,109 92.8% $5-$10 Million 1,356 54.3% 6,250 90.8% $2-$5 Million 1,034 50.4% 11,536 83.3% $1-$2 Million 114 32.2% 9,699 84.8% Totals 9,483 66.1% 37,387 89.1% 9
©2023 FiduciaryPath, LLC Color Key: Investment Fees Reported No Investment Fees Reported Comparison of Public and Private
Reporting
Fees
Investment Management Fees
Public Charities AUM Range in Millions No. of Organizations % of Organizations Total AUM % of AUM Total Fees Reported % of Total Fees Reported Avg. Fees % (BPS) Private Foundation Avg. Fees % (BPS) Over $500 M 465 3.1% $1,121,775,463,615 57.9% $3,185,659,338 66.0% 0.28% 0.34% Over $500 M 116 0.8% $176,834,550,075 9.1% N/A N/A N/A 0.34% $100-$500 M 1,277 8.5% $275,253,401,935 14.2% $923,502,273 19.1% 0.34% 0.41% $100-$500 M 402 2.7% $80,847,549,798 4.2% N/A N/A N/A 0.41% $50-$100 M 1,090 7.3% $76,800,718,212 4.0% $248,834,110 5.2% 0.32% 0.42% $50-$100 M 407 2.7% $28,486,014,015 1.5% N/A N/A N/A 0.42% $25-$50 M 1,584 10.5% $56,631,413,731 2.9% $199,247,546 4.1% 0.35% 0.47% $25-$50 M 677 4.5% $24,019,908,961 1.2% N/A N/A N/A 0.47% $10-$25 M 2,563 17.1% $44,515,386,908 2.3% $183,625,136 3.8% 0.41% 0.50% $10-$25 M 1,531 10.2% $26,605,146,958 1.4% N/A N/A N/A 0.50% $5-$10 M 1,356 9.0% $8,098,327,178 0.4% $59,110,591 1.2% 0.73% 0.61% $5-$10 M 1,142 7.6% $6,831,907,010 0.4% N/A N/A N/A 0.61% $2-$5 M 1,034 6.9% $4,513,674,812 0.2% $27,074,621 0.6% 0.60% 0.70% $2-$5 M 1,018 6.8% $4,250,836,228 0.2% N/A N/A N/A 0.70% $1-$2 M 114 0.8% $176,874,432 0.0% $1,825,198 0.0% 1.03% 0.85% $1-$2 M 240 1.6% $347,024,962 0.0% N/A N/A N/A 0.85% Totals 15,016 100.0% $1,935,988,198,830 100% $4,828,878,813 100.0% 0.25% 0.64%
Reported by
Source: Form 990 Research by FiduciaryPath obtained from Guidestar Database
A Closer Look at the Five Universities with the Largest Investment Funds

A deeper look into the data raised more questions than answers. For example, why is there so much IM Fee disparity among these five universities—part of the top ten public charities by reported invested assets? All appear to be invested in private equity as well as traditional and other nontraditional vehicles. Is the expected investment risk and performance sufficiently different to warrant Harvard’s and Yale’s fees to be 100% more than Stanford’s fees?
How was the Massachusetts Institute of Technology able to invest for only 20% of what Harvard and Yale paid? Is Princeton such a better manager that it was able to negotiate fees that are less than 3% of Harvard’s and Yale’s? Are Yale, Harvard, Stanford, and Massachusetts Institute of Technology failing to pay only reasonable fees as required under the Uniform Prudent Management of Institutional Funds Act (UPMIFA)?
Some might be skeptical of the accuracy of Princeton University’s reported investment management fees—perhaps, for good reason.
Largest Investment Funds of Five Universities
Source: Form 990 Research by FiduciaryPath obtained from Guidestar Database
©2023 FiduciaryPath, LLC
Organization Amount of Investments/ Securities Amount of Reported Investment Management Fees Investment Fee Percentage President and Fellows of Harvard College $44,001,345,000 $138,553,750 0.31% Stanford University Board of Trustee of the Leland Stanford Jr. University $35,583,306,718 $55,596,546 0.16% Yale University $32,924,295,946 $115,874,352 0.35% Trustee of Princeton University $25,685,605,000 $1,878,000 0.01% Massachusetts Institute of Technology $20,519,020,000 $13,080,000 0.06% Totals $158,713,572,664 $324,982,648 0.20%
10
Looking deeper into the data often creates more questions than answers.
A review of the Form 990 filed by Princeton University, stating it pays only 0.01% investment management fees, also reveals:
• Combined, the six highest-paid employees of Princo (the university’s investment management arm) received annual compensation of about $18 million; and
• A substantial portion of the university’s investments are held in private equity and hedge funds, which typically are less liquid and have higher IM Fees than other investment vehicles.
Princeton University’s website reveals that approximately 54% of the university’s investments are held in private equity and hedge funds.11 If one assumes the university pays less than the industry average management fee for these investments (1.37%), for example, 1.00%, fees on these investments would be approximately $138 million (54% of $25.685 billion x 1%) before additional incentive fees are calculated.
This would increase the university’s investment management fees to about $140 million or about 55 BPS—which would make Princeton’s investment management costs the highest of this group, not the lowest.
To be fair, Form 990s for Harvard, Stanford, Yale, and MIT also report that each of these institutions holds private equity and hedge fund investments. A closer examination might calculate higher IM Fees than those stated on these filings.12
We reached out to each of these five universities and requested responses to five additional questions.13 Not all responded. Those who did respond indicated that they did not include indirect fees, defined as “fees that are deducted from within the investment, such as mutual fund expense ratios or deducted from private equity, hedge funds, limited partnerships.”
Unexplained Institutional Charitable Gift Fund Reported Investment Expenses
Generally, charitable gift funds do not work like public charities. These are commercial investment institutions to which anyone may donate and obtain a charitable tax deduction in that year. But that money can be granted out to 501(c)(3) charities by that donor, all at once or over time. When there is money left in the donor’s account, donors can invest in the investment options offered by that charitable gift fund. This is different from donations to a community foundation or university, which become part of an endowment and are managed as part of the institution’s assets. Some commercial charitable gift funds allow the donor’s investment advisor to manage their contributed funds until they are granted out to other charities.

©2023 FiduciaryPath, LLC
11
These differences may help to explain apparent IM Fee inconsistencies reported on Form 990 for these charitable gift funds.14 Certainly, that is the case for Vanguard Charitable’s Form 990, which reports no IM Fees—and its website lists investment options with fees ranging from 0.02% to 3.03%.
Additionally, each of these institutional providers allows clients to maintain relationships with personal advisors who may also charge IM Fees. It is certainly possible that a hugely disproportionate amount of these investments was invested in very low-cost investment options and the reported Form 990 investment fee percentage is correct for Fidelity and Schwab. However, in view of the disparities already discussed above, further investigation may be in order.
We reached out to these three institutional charitable gift funds seeking further clarification. Only one responded through a spokesperson that it was not an investment manager for the individual donor-advised funds (DAF) it administered. It also reported that its individual DAF holders pay administrative fees ranging from 0.10% to 0.60%. These administrative fees are in addition to IM Fees for investment options reported on the company’s website.
Charitable Gift Fund Reported Fee Comparisons
Surprising Reports Filed by Paid Preparers
Of the 15,016 Form 990s reviewed, 13,745 (91.5%) were filed by 2,619 paid preparers (many filed Form 990s for multiple clients). No paid preparer was disclosed for 1,271 (8.5%) Form 990s. Disclosed paid preparers were predominantly certified public accounting firms.
©2023 FiduciaryPath, LLC
Organization Amount of Investments/ Securities Amount of Reported Investment Management Fees Investment Fee Percentage Range of Investment Options Fees Reported on Charity’s Website Number of Investment Options Reported on Charity’s Website Percentage of Investment Options Reported on Charity’s Website with Fees Higher than Investment Fees Reported on Form 990 Fidelity Investments Charitable Gift Fund $29,909,258,210 $22,702,755 0.08% 0.015% – 0.99% 25 84% Schwab Charitable Trust Fund $15,219,611,881 $17,852,019 0.12% 0.03% – 0.70% 15 67% Vanguard Charitable $8,576,175,536 – 0.00% 0.02% – 3.03% 20 100%
12
Source: Form 990 Research by FiduciaryPath obtained from Guidestar Database
One of the most significant unanticipated results from this study was the revelation that almost equal proportions (37.0%) of paid preparers reported their clients paid IM Fees as those that reported their clients paid no IM Fees (37.8%).
About 25% of paid preparers reported some of their clients incurred IM Fees and others did not. Paid preparers filing 20 or more Form 990s constituted approximately 15% (102 firms).
Among the remaining 1,271 public charities that filed their Form 990 without the benefit of a paid preparer, 58.4% (742) reported they incurred IM Fees, and 41.6% (529) reported they did not incur IM Fees.
Other Observations
In this study, the largest public charity that stated it pays no IM Fees was Partners Pooled Investment Holdings, LLC (the investment arm of Massachusetts General Brigham Hospital), which reports managing over $10 billion. Although the Form 990s for both Partners Pooled Investments and Mass General Brigham report neither pay IM Fees—they do report owning private equity and hedge funds.
All of this may provide the impetus for further investigation into the 37% of public charities reporting that they pay no IM Fees as well as the remaining 63% who report incurring IM Fees at atypically low rates.
Of the 100 largest public charities reporting to the IRS reviewed in this research, twelve report paying no IM Fees, even though the Form 990s for all twelve appear to indicate each owns private equity and hedge funds.
©2023 FiduciaryPath, LLC
Fees Reported by Paid Preparers How Fees Reported Number of Clients Percent of Clients All Clients Reported as Paying Investment Fees 969 37.0% All Clients Reported as Paying No Investment Fees 991 37.8% Some Clients Reported as Paying Investment Fees and Some Clients Reported as Paying No Investment Fees* 659 25.2% Totals 2,619 100.0% * 102 (15.5%) of these were reported by paid preparers filing 20 or more Form 990s Source: Form 990 Research by FiduciaryPath obtained from Guidestar Database
Almost equal proportions of “paid preparers” reported their clients paid IM fees as those that reported their clients paid no IM fees.
Summary of Investment Management
13
Of course, any costs incurred from these types of investments would be in addition to other investment expenses, such as mutual funds or exchangetraded funds owned by the charities.
What Do the IRS Filings Tell Us About Reported Public Charity Investment Management Fees?
First, it is important to recognize that the IM Fees disclosed on Form 990 are just that—disclosed fees that have been reported. That does not necessarily mean that the disclosed fees include all direct and indirect fees incurred.
Regarding the IM Fees reported by these 15,000 public charities, the data may imply that many public charities may not fully understand their investment costs, and consequently may be failing to act prudently, verify relevant facts, and incur only reasonable investment management expenses.
Again, the data seem to generate more questions than answers:
• Is it reasonable to believe that one-third of public charities pay no IM Fees while two-thirds do?
• Are the public charities that report IM Fees paying “only reasonable costs”? Do their Form 990s fully and accurately report all IM Fees incurred?
• Why are reported public charity IM Fees so much lower than private foundation fees? Are they, in fact, really lower?
• Do the officers of the charities signing Form 990 and reporting that their organizations incurred no IM Fees truly believe “to the best of their knowledge and belief” that their report is “true, correct and complete"? Did they and/or their paid preparers properly verify that they had the “relevant facts” to make such a statement?
• If the signing organizational officer asks the paid preparer:
1. Why did you let me sign this document under penalty of perjury?
2. Did you truly believe we pay no investment management fees?
3. What documents did you review to determine the amount of IM Fees we incurred?
4. Does your organization’s or our organization’s E&O coverage protect us if we make inaccurate representations to the IRS?
5. What would be the paid preparer’s proper responses to these questions?
Among retirement plans, the amount of IM Fees paid has been a major source of retirement plan litigation, which has skyrocketed in recent years. Many public charities also have retirement plans and an increasing number have faced investment fee litigation. Much of the litigation has alleged that IM Fees and other service provider fees paid by the plan, including those paid to recordkeepers and third-party administrators, were excessive.15
©2023 FiduciaryPath, LLC
14
Many public charities may not fully understand their investment costs, and consequently may be failing to act prudently, verify relevant facts, and incur only reasonable investment management expenses.
Based on retirement plan litigation over the last decade (and the subsequent court decisions and out-of-court settlements) and the unexpected, curious reporting by public charities in this study, it’s not unreasonable to suspect that the IM Fees reported on Form 990 may be incomplete and/or understated. Additionally, a closer examination is warranted considering the relatively sizable allocation to private equity and hedge funds (which typically charge higher fees than other types of investments) among many public charity portfolios.
Perhaps another contributing, confusing factor was that early in 2017, the Financial Accounting Standards Board (FASB) Accounting Standards Update (ASU) 2016-14, Not-for-Profit Entities (Topic 958): Presentation of Financial Statements of Not-for-Profit Entities, introduced a new standard for nonprofit financial statement reporting. This new rule required nonprofits to report investment returns, net of related investment expenses, on their financial statements. The standard allowed early adoption and was effective for fiscal years starting after December 15, 2017.16
Did this new FASB rule for financial statements result in some nonprofits using the information on those statements as a basis for reporting on IRS Form 990?
While the new FASB rule may provide a hint to help answer this question, it doesn’t explain the large number of nonprofits that report a very low investment expense number (but not zero) on their IRS Form 990. It also does not explain why so many professional accounting firms report zero investment expenses for some clients and report other clients incurring investment expenses.
Nonprofits are required to understand all costs they incur for their invested assets. These costs include the direct and indirect expenses they pay to advisors, investment managers, mutual funds, hedge funds, private equity, real estate, and any other investments. These are not only the costs for the investments themselves but also include the investment service providers. This requirement is articulated under the Uniform Prudent Management of Institutional Funds Act (UPMIFA).17
Combined, these points suggest an obvious revelation: There is a significant opportunity for CPAs, legal counsel, and advisors to greatly assist their public charity clients to fully and accurately understand, verify, and report investment management costs.
Three Simple Questions Every Public Charity Board Member Should Ask Their Advisors
Gathering and documenting the necessary investment cost information to comply with UPMIFA responsibilities can be involved—but board members don’t have to do all (or even most) of the work.
FiduciaryPath,
©2023
LLC
15
There is a significant opportunity for CPAs, legal counsel, and advisors to greatly assist their public charity clients to fully and accurately understand, verify, and report investment management costs.
Most public charity board members joined their organization because they were committed to its mission—and not because they love to delve into financial disclosure documents. Getting accurate, complete and documented answers to the following three questions will help board members meet their fiduciary responsibilities and promptly get back to doing what they enjoy most.
• How does our organization demonstrate that we are meeting our legal and fiduciary responsibility (as UPMIFA requires) to “incur only reasonable costs in investing and managing charitable funds?”
• How does our organization demonstrate that we have verified and investigated the relevant facts to determine the “accuracy of the information in making our investment decisions?” For example, what documents were reviewed, by whom, and when to determine the accuracy of our organization’s investment management costs?
• Do the answers to these questions promote the trust and confidence of past, current, and future donors?
How Public Charities Can Assure Accuracy of Investment Fee Information and the Opportunity for Advisors
If you’re reading this and you’re a board member, officer, or executive of a public charity, Form 990 paid preparer, or one of the charity’s advisors, the first thing to do is to get a copy of the organization’s most recently filed Form 990 and look up Part IX, Statement of Functional Expenses, Line 11f: Investment Management Fees. Many nonprofits include a link to these on their website.
• What amount is reported?
• Is it accurate?
• Do the reported fees include direct fees, which are fees that nonprofits pay directly to a service provider?
• Do the reported fees include indirect fees, which are fees nonprofits pay but do not see or write a check for because they are deducted from within the investment, such as mutual fund expense ratios or fees deducted from private equity, hedge funds or limited partnerships?
• Who provided the information, and what documents support the amount reported?
• Has the information been verified?
• When was the information verified?
• Who reported that the IM Fees were accurate and verified?
©2023 FiduciaryPath, LLC
16
Most public charity board members joined their organization because they were committed to its mission— and not because they love to delve into financial disclosure documents.
• Are the nonprofit’s service providers (investment managers, advisors, consultants, custodians, and other service providers involved with the organization’s investment management) contractually required to report all direct and indirect fees and expenses incurred with any services or investments they provide annually? If not, why not?
A CPA, attorney, investment advisor, or fiduciary advisor working with a public charity (or who may want to work with public charities) should review the organization’s most recent Form 990 to determine if the reported investment management fee information appears to be accurate. If the information is complete and accurate, the client would welcome your assistance in providing the verifying and supporting data if not previously offered.
If Line 11f seems inaccurate, or if the expense data may be incomplete, confer with the client and arrange to help them obtain the information on investment costs that is missing—before a competitor does. If you’re a board member, officer or executive at a nonprofit, this information is critical to the management of your organization—so seek help to get the detailed information you need to ensure the organization incurs “only reasonable investment management costs.”
Either way, this is an excellent opportunity for an advisor to enhance value by assisting clients in securing the requisite IM Fee data and documenting that their legal and fiduciary responsibilities are being met.
It may be challenging at first to obtain this information from existing service provider documents. This may be true in some instances—and it should not be this way.
However, UPMIFA doesn’t provide an “It’s hard to obtain this data from service providers” exception to the “Pay only reasonable fees and verify relevant facts” requirements.
One direct method for public charities and their CPAs to gather this information is to require all investment service providers to sign and submit the information called for in the Sample Form in the Appendix,“Sample Annual Statement of All Investment Management Fees, Including Direct and Indirect Expenses for Investment Consulting and Portfolio Management.”
To facilitate accountability and transparency, public charities simply need to add a clause to each of their investment service provider’s written contracts requiring timely annual submission of this completed form as part of the service provider’s ongoing responsibilities. The investment service provider is best positioned to fully understand and disclose all investment expenses.
Investment service providers have access to this information and should be forthcoming with direct and indirect IM Fee information. Likewise, they should provide a clear and concise disclosure of which of their services are provided as a fiduciary and which are provided as a nonfiduciary. Similar disclosure statements have been required for over ten years by service
©2023 FiduciaryPath, LLC

17
UPMIFA doesn't provide an “It's hard to obtain this data from service providers” exception to the “Pay only reasonable fees and verify relevant facts” requirements.
providers to employer-provided retirement plans by the US Department of Labor’s ERISA 408(b)(2) requirements. Service providers know exactly what you pay them, and there is no reason they cannot provide this information to you in dollars and basis points.
The inspiration for the Sample Form in the Appendix is the “Template for SB 322 Investment Expense Reporting in Annual Financial Reports” 18 issued in 2019 by the Texas Pension Review Board following 2017 Texas reform legislation to financially shore up several Texas public pension funds.
The Schedules in the Sample Form have been designed to provide public charity board members and executive staff with the information they need to act prudently and incur only reasonable investment costs while holding their service providers accountable and to properly verify the accuracy of relevant facts. When each service provider submits this form, costs can be tabulated and summarized for inclusion in the charity’s Form 990. Annually submitted cost data should also help the board increase the efficiency of its ongoing investment portfolio monitoring.
The Sample Form in the Appendix is composed of three parts:
1. A cover page indicating the name of the public charity and the Form 990 year for which the data has been collected.
2. Schedule 1: Overall Summary of Investment Management Fees and Costs (a compilation of data reported on Schedule 2 for each individual service provider).
3. Schedule 2: Individual Service Provider Expenses: Total Investment Management Fees, Including Direct and Indirect Expenses for Investment Consulting and Portfolio Management, including:

• Schedule 2A – Cash Investments
• Schedule 2B – Public Equity
• Schedule 2C – Fixed Income
• Schedule 2D – Real Assets
• Schedule 2E – Alternative/Other Assets
• Schedule 2F – Other Investment Fees
A competent fiduciary advisor who works with charitable organizations will be able to assist in securing the relevant data that will be documented in the Sample Form.
Once the charity is confident that the stated amount of IM Fees is accurate, the board must then determine that it is “incurring only costs that are appropriate and reasonable in relation to the assets, the purposes of the institution, and the skills available to the institution.”
This process will take expertise and, ultimately, judgment, comparing the charity’s investments and expenses with other comparable public charities and private foundations.
©2023 FiduciaryPath, LLC
18
The schedules in the Sample Form have been designed to provide public charity board members and executive staff with the data they need to act prudently while holding their service providers accountable.
The Missing Link
As previously stated, before a public charity can determine and document that it is incurring “only appropriate and reasonable investment costs,” it must undertake a two-step process:
1. Obtain, and analyze accurate and complete IM Fee information for its own investment portfolios; and
2. Analyze comparable IM Fee information for similar portfolio asset allocations and invested amounts held by other public charities.
The data-gathering process illustrated by the Sample Form included in the Appendix is a strong step forward in completing the first step.
The second step is currently more problematic. We have not been able to find a readily available source to facilitate public charity peer benchmarking to determine if a public charity was incurring only reasonable IM Fees.19
Currently, IRS Form 990 is the only annual reporting system that requires public charities to provide detailed critical financial data designed to inform and promote public confidence as a condition of qualifying for special preferential tax treatment.
However, one could reasonably argue that the current Form 990 IM Fee instructions may be ambiguous—and this might be one further possible explanation for the wide variety of responses to Part IX, Line 11f revealed in this research report.
In essence, many public charities (and their paid preparers) may not have understood exactly what cost information they were required to provide. For example, exactly what does “Enter amounts for investment consulting and portfolio management” mean? Does it include both direct and indirect investment costs? That is the data the public charity would need to properly assess if it was “paying only reasonable and appropriate investment costs.”
Form 990's inclusion of the more specific data points secured through the use of the schedules in the Appendix would further promote public confidence. Equally important, it would greatly assist public charities in meeting their fiduciary responsibility to assure that they are “incurring only appropriate and reasonable costs.”
This missing link would potentially fill the current “investment cost knowledge gap” that appears to exist throughout the public charity universe.
Calls to Action
Despite the significant number of Form 990 filings reporting no IM Fees summarized in this study, the US Securities and Exchange Commission Investor Bulletin published in February 2014, notes20:
©2023 FiduciaryPath, LLC 19
We have not been able to find a readily available source to facilitate public charity peer benchmarking. The IRS can help fill this current “Investment knowledge gap” in the public charity universe.
“As with anything you buy, there are fees and costs associated with investment products and services.”
Most would probably say “Well, that’s pretty obvious!”
IM Fees matter. They directly impact the nonprofit’s bottom line and financial ability to achieve its desired success. For each $100 million invested, an extra 1% in inappropriate or unnecessary investment costs amounts to $1 million drained away from a charity’s beneficiaries—each year. Compounded over time, that charity’s loss can be significantly more than this $1 million per year.
For example, the consequences of a charity’s $100 million investment portfolio incurring an additional annual investment management cost of 1% (reducing the portfolio’s net return from 6% to 5%) would cost the charity more than $55 million over a twenty-year period.21
So why the disconnect with the Form 990 filings signed under penalty of perjury by responsible nonprofit leaders? What’s going on here?
The findings of this study don’t provide a conclusive answer. Instead, they suggest a combination of contributing factors that will likely require combined action by the respective parties involved.
Our Recommendations
For Nonprofit Boards and Executives:
• Immediately initiate an engaging training program designed to promote awareness while facilitating prudent, cost-effective fulfillment of their fiduciary and legal responsibilities focused on prudent delegation and monitoring.
• Institute IM Fee information collection processes illustrated in the Sample Form. Monitor and compare respective investment risk, performance, and costs with peer organizations to ensure reasonable costs are incurred.
©2023 FiduciaryPath, LLC
20 Annual Investment Management Cost of 1% $100,000,000 Initial Portfolio Portfolio Value After 10 Years Portfolio Value After 20 Years 6% Net Annual Return $179,084,770 $320,713,548 5% Net Annual Return $162,889,463 $265,329,771 Difference $16,195,307 $55,383,777
“As with anything you buy, there are fees and costs associated with investment products and services.”
• Enhance donor and institutional trust by communicating the organization’s transparency, accountability, and culture of fiduciary excellence.
For the Internal Revenue Service:
• Review each of the Form 990s filed indicating the reporting charity pays no IM Fees, contact them requesting they verify the accuracy of their reported IM Fees, and report back to the IRS by utilizing the IM Fee data schedules illustrated in the Appendix.
• Identify a statistically significant sample of Form 990s indicating the reporting charity incurs IM Fees, contact each such charity requesting they verify the accuracy of their reported IM Fees, and report back to the IRS by utilizing the IM Fee data schedules illustrated in the Appendix.
• To facilitate easier IM Fee comparison among public charities and their peers, amend Form 990 to include a more definitive summary of the different asset classes of investments, such as currently included on IRS Form 990-PF Part I (Lines 16a, 16b, and 16c) and Part II (Lines 1-2, 10a, 10b, 10c, and 11-13).

• Amend Form 990 and its Instructions to include the IM Fee data schedules illustrated in the Appendix.
For Form 990 paid preparers and CPAs, legal counsel, and other advisors to public charities (and those who desire to provide such services):
• Attend professional continuing education courses emphasizing the legal and financial significance of a nonprofit board’s fiduciary responsibilities. This professional training should include:
• Prudent delegation and documentation,
• Prudent monitoring and documentation,
• Enhancing donor and institutional trust,
• The IM Fee information collection process illustrated in the Appendix.
• Initiate a value-added service program designed to help public charity clients readily document and verify all investment costs they are incurring and ensure only reasonable costs are incurred.
21
©2023 FiduciaryPath, LLC
About the Authors
Kathleen McBride helps nonprofits and retirement plans understand and secure the highest and safest fiduciary protection. Kate is the founder and president of FiduciaryPath™, LLC, the fiduciary consulting and research firm. She is an ERISA 402(a) named fiduciary specialist with Fiduciary Wise. Kate is a Board Certified FiduciaryTM (BCF TM), an Accredited Investment Fiduciary Analyst® (AIFA®), a CEFEX Analyst with the Centre for Fiduciary Excellence, and a qualified educator for Fiduciary Essentials® Training for Foundations & Endowments.

Kate meets regularly with policymakers and is a founder and served as chair of The Committee for the Fiduciary Standard. She is also a founder of the Center for Board Certified Fiduciaries and an author of and Specialty Leader for its Foundations & Endowments curriculum. She holds a BA from New York University and completed the Investment Strategies and Portfolio Management program at The Wharton School, University of Pennsylvania.
Allan Henriques, JD, is a Board Certified FiduciaryTM (BCFTM), an Accredited Investment Fiduciary Analyst® (AIFA®), a CEFEX Analyst with the Centre for Fiduciary Excellence, and a qualified educator for Fiduciary Essentials® Training. He is also an author of and Specialty Leader for the Center of Board Certified Fiduciaries’ Foundations & Endowments curriculum. As a FiduciaryPath consultant, Allan brings over 40 years of legal and fiduciary experience to help investment stewards better understand their financial responsibilities, minimize risk, and ensure proper due diligence.
Previously, Allan has served on the boards of several nonprofits, founded a fiduciary consulting firm to assist nonprofit organizations, and founded a successful fiduciary wealth management firm in Roseville, California. He received a BA in Political Science from the University of California, Davis, and a Juris Doctor from the McGeorge School of Law, University of the Pacific.

©2023 FiduciaryPath, LLC

22
Kathleen M. McBride President & Founder, FiduciaryPath™, LLC
Allan Henriques Accredited Investment Ficuiary Analyst, FiduciaryPath™, LLC
Sample “Annual Statement of All Investment Management Fees, Including Direct and Indirect Expenses for Investment Consulting and Portfolio Management"
This is an example of what a completed form would look like when utilized by a public charity to assist in preparing its annual Form 990 filing. A “clean copy” of the form can be downloaded at: https://fiduciarypath.com/annual-statement-of-all-investment-management-fees-im-fees-tool/
In this example, our public charity, Everybody’s Favorite Nonprofit, is compiling data for filing its Form 990 for 2021.
Everybody’s Favorite Nonprofit has engaged the services of Very Excellent Investment Advisors and Cool Return Advisors to manage its investment portfolios. Betty Certain, Principal Investment Officer of Very Excellent Investment Advisors is the person with primary responsibility in documenting the expense information from all service providers.
• Cover Sheet – Identifies the subject organization (Everybody’s Favorite Nonprofit and the Form 990 reporting year 2021).
• Schedule 1 – Overall Summary of Investment Management Fees and Costs.
In this case, Betty Certain has summarized the information provided from the Schedule 2’s submitted by Very Excellent Investment Advisors and Cool Returns Advisors (note that in this example, the completed Schedule 2 for Cool Returns Advisors is not included). She also signs the declaration indicating who assisted in compiling the data and the number of pages included with Schedule 1. In this example, Betty states Schedule 1 includes 15 pages (7 pages from Very Excellent Investment Advisors – Schedule 2 and 2A – 2F) and (7 pages from Cool Returns Advisors not shown with this example) and the combined summary Schedule 1.
Betty also declares that in preparing Schedule 1, she was assisted by Randall B. Good of Cool Returns Advisors, and Don Smith of Very Excellent Investment Advisors.
In this example, the total investment management fees for Form 990 reporting purposes are $8,570,016 or 1.17% of the investment value.
Schedule 1 also documents that Very Excellent Investment Advisors incurs 51.14% of the investment expenses while responsible for 60.60% of the assets, and Cool Return Advisors incurs 48.86% of the cost while responsible for 39.40% of the investments.
• Schedule 2 – Individual Service Provider Expenses
In this example, on behalf of Very Excellent Investment Advisors, Betty has summarized all investment expenses incurred by the portfolios managed by Very Excellent Investment Advisors as detailed in Schedules 2A – 2F. (A similar report by Cool Returns Advisors is not included in this example). Again, Betty signs her declaration stating the number of pages and who assisted her in compiling the data.
This Schedule illustrates how the respective investment costs are paid, direct or indirect; as well as the value and expense for each asset class of investments managed.
Appendix
©2023 FiduciaryPath, LLC
23
• Schedule 2A – Cash Investments
Note that the ticker symbol, as well as the name of the investment, and amount invested, is listed. In this instance, the investment is a money market fund with fees netted from returns (generally stated in the fund’s financial disclosure).
Don Smith has signed the declaration stating that he alone documented the information on this Schedule.
• Schedule 2B – Public Equity
In addition to the ticker symbol, name and amount invested, the ASC 820 Fair Value Measurement Level is stated to reference the liquidity factor of each respective investment. Note the range of investment fees incurred.
• Schedule 2C – Fixed Income
• Schedule 2D – Real Assets
• Schedule 2E – Alternative/Other Assets
• Schedule 2F – Other Investment Fees
This Schedule lists all other investment expenses not reported on Schedules 2A –2E. Here the management fee for Very Excellent Investment Advisors is reported, as well as amounts paid to Everybody’s Favorite Nonprofit’s legal counsel and related internal staff expense.
24
©2023 FiduciaryPath, LLC

©2023 FiduciaryPath, LLC 25 EVERYBODY'S FAVORITE NONPROFIT Annual Statement of All Investment Management Fees, Including Direct and Indirect Expenses for Investment Consulting and Portfolio Management for Everybody's Favorite Nonprofit 2021 Form 990 Investment Expense Preparation
Schedule 1 – Overall Summary of Investment Management Fees and Costs
Data compiled from Schedule 2 for each individual service provider.
Name of Nonprofit Organization: Everybody’s Favorite Nonprofit
Name of Person Providing Data: Betty Certain
Summary Completion Date: March 23, 2022
Form 990 Year: 2021
If the named investment incurs no fees or costs in Column A, B, C, or D, indicate by stating “0” as applicable.
Overall Summary of Investment Management Fees and Costs
Dated: March 23, 2022
I, Betty Certain, Principal Investment Officer of Very Excellent Investment Advisors (title and organization), state, under penalty of perjury, that I have examined the information provided herewith consisting of 15 (number of) pages, including accompanying schedules and statements, and to the best of my knowledge and belief, it is true, correct, and complete. The following persons assisted me in preparing this information: (list name, organization and title of each person who assisted):
Don Smith, Analyst, Very Excellent Investment Advisors
Randall B. Good, Principal Investment Officer, Cool Return Advisors
Signed by: Betty Certain
©2023 FiduciaryPath, LLC
Column A Column B Column C Column D Column E Column F Column G Name of Investment Services Provider Investment Value Fees Paid Directly from Charitable Organization Fees Netted From Returns Profit Share/ Carried Interest or “Incentive Fees” Brokerage Fees/ Commissions Total Investment Management Fees for Purposes of Completing Form 990, Part IX, Lie 11f (Columns A+B+C) % of Assets % of Fees Very Excellent Investment Advisors $444,179,233 $792,157 $3,100,187 $490,456 $9,472 $4,382,800 60.60% 51.14% Cool Return Advisors (detail data not shown in Sample Form) $288,773,495 $664,179 $1,633,014 $1,890,023 – $4,187,216 39.40% 48.86% – – – – – –– – – – – –– – – – – –– – – – – –Schedule 1 Totals $732,952,728 $1,456,336 $4,733,201 $2,380,479 $9,472 $8,570,016 100.00% 100.00% Overall Total Form 990 Expense Ratio 1.17% Total Expenses (Includes Column D) $8,579,488 Total Expense Ratio (Includes Column D) 1.17%
26
Schedule 2 – Individual Service Provider Expenses
All investment management fees, including direct and indirect expenses for investment consulting and portfolio management.
Name of Nonprofit Organization: Everybody’s Favorite Nonprofit
Name of Person Providing Data: Betty Certain
Name of Investment Service Provider: Very Excellent Investment Advisors
Summary Completion Date: March 18, 2022
Form 990 Year: 2021
If the named investment incurs no fees or costs in Column A, B, C, or D, indicate by stating “0” as applicable.
*Accounting Standards Codification (“ASC”) 820, Fair Value Measurement and Disclosures, provides the following framework for measuring fair value: Level 1 (Quoted prices in active markets for identical assets or liabilities); Level 2 (Observable inputs other than Level 1 prices, such as quoted prices for similar assets or liabilities, quoted prices in active market that are not active, discounted cash flows, or other inputs that are observable or can be corroborated by observable market data for substantially the full term of the assets or liabilities); and Level 3 (Unobservable inputs that are supported by little or no market activity and that are significant to the fair value of the assets or liabilities, including general partner estimates and recent third-party appraisals).
Dated: March 18, 2022
I, Betty Certain, Principal Investment Officer of Very Excellent Investment Advisors (title and organization), state, under penalty of perjury, that I have examined the information provided herewith consisting of 7 (number of) pages, including accompanying schedules and statements, and to the best of my knowledge and belief, it is true, correct, and complete. The following persons assisted me in preparing this information: (list name, organization and title of each person who assisted):
Don Smith, Analyst, Very Excellent Investment Advisor
Signed by: Betty Certain
©2023 FiduciaryPath, LLC
Individual Service Provider Expenses All Investment Management Fees Column A Column B Column C Column D Column E Column F Column G Asset Class Investment Value Fees Paid Directly from Charitable Organization Fees Netted From Returns Profit Share/ Carried Interest or “Incentive Fees” Brokerage Fees/ Commissions Total Investment Management Fees for Purposes of Completing Form 990, Part IX, Lie 11f (Columns A+B+C) % of Assets % of Fees Schedule 2A –Cash Investments $7,822,482 – $15,645 – – $15,645 1.76% 0.36% Schedule 2B –Public Equity $295,340,405 – $1,964,653 – – $1,964,653 66.49% 44.83% Schedule 2C –Fixed Income $8,932,928 – $2,680 – – $2,680 2.01% 0.06% Schedule 2D –Real Assets $33,793,384 – $118,928 – – $118,928 7.61% 2.71% Schedule 2E –Alternative/Other Assets $98,290,034 – $998,281 $490,456 $9,472 $1,488,737 22.13% 33.97% Schedule 2F –Other Investment Fees – $792,157 – – – $792,157 – 18.07% Schedule 2 Totals $444,179,233 $792,157 $3,100,187 $490,456 $9,472 $4,382,800 100.00% 100.00% Service Provider: Very Excellent Investment Advisors Schedule 2 Form 990 Expense Ratio 0.99% Total Expenses (includes Column D) $4,392,272 Total Expense Ratio (includes
D) 0.99%
Column
27
Schedule 2A – Cash Investments
Cash and cash equivalents such as money market securities which are very liquid, stable and have low volatility.
Name of Nonprofit Organization: Everybody’s Favorite Nonprofit
Name of Person Providing Data:Don Smith
Name of Investment Service Provider: Very Excellent Investment Advisors
Summary Completion Date: February 18, 2022
Form 990 Year: 2021
If the named investment incurs no fees or costs in Column A, B, C, or D, indicate by stating “0” as applicable.
*Accounting Standards Codification (“ASC”) 820, Fair Value Measurement and Disclosures, provides the following framework for measuring fair value: Level 1 (Quoted prices in active markets for identical assets or liabilities); Level 2 (Observable inputs other than Level 1 prices, such as quoted prices for similar assets or liabilities, quoted prices in active market that are not active, discounted cash flows, or other inputs that are observable or can be corroborated by observable market data for substantially the full term of the assets or liabilities); and Level 3 (Unobservable inputs that are supported by little or no market activity and that are significant to the fair value of the assets or liabilities, including general partner estimates and recent third-party appraisals).
Dated: February 18, 2022
I, Don Smith, Analyst, of Very Excellent Investment Advisors (title and organization), state, under penalty of perjury, that I have examined the information provided herewith consisting of 1 (number of) pages, including accompanying schedules and statements, and to the best of my knowledge and belief, it is true, correct, and complete. The following persons assisted me in preparing this information: (list name, organization and title of each person who assisted): N/A
Signed by: Don Smith
©2023 FiduciaryPath, LLC
Investments Column A Column B Column C Column D Column E Column F Column G Name of Investment Include Ticker Symbol in Name of Investment as applicable. Investment Value ASC 820 Fair Value Measurement Level* Fees Paid Directly from Charitable Organization Fees Netted From Returns Profit Share/ Carried Interest or “Incentive Fees” Brokerage Fees/ Commissions Total Investment Management Fees for Purposes of Completing Form 990, Part IX, Lie 11f (Columns A+B+C) % of Assets % of Fees Black Rock Liquid Environmentally Aware Fund (LEFXX) $7,822,482 1 – $15,645 – – $15,645 100.00% 100.00% – – – – – – – – –– – – – – – – – –– – – – – – – – –– – – – – – – – –– – – – – – – – –Schedule 2A Totals $7,822,482 N/A – $15,645 – – $15,645 100.00% 100.00% Service Provider: Very Excellent Investment Advisors Schedule 2A Form 990 Expense Ratio 0.20% Total Expenses (includes Column D) $15,645 Total Expense Ratio (includes Column D) 0.20%
Cash
28
Schedule 2B – Public Equity
Equity securities are shares representing ownership interest in a corporation. Examples include domestic, international and emerging stocks, as well as stock mutual funds and ETFs.
Name of Nonprofit Organization: Everybody’s Favorite Nonprofit
Name of Person Providing Data: Don Smith
Name of Investment Service Provider: Very Excellent Investment Advisors
Summary Completion Date: February 18, 2022
Form 990 Year: 2021
If the named investment incurs no fees or costs in Column A, B, C, or D, indicate by stating “0” as applicable.
Public Equity
*Accounting Standards Codification (“ASC”) 820, Fair Value Measurement and Disclosures, provides the following framework for measuring fair value: Level 1 (Quoted prices in active markets for identical assets or liabilities); Level 2 (Observable inputs other than Level 1 prices, such as quoted prices for similar assets or liabilities, quoted prices in active market that are not active, discounted cash flows, or other inputs that are observable or can be corroborated by observable market data for substantially the full term of the assets or liabilities); and Level 3 (Unobservable inputs that are supported by little or no market activity and that are significant to the fair value of the assets or liabilities, including general partner estimates and recent third-party appraisals).
Dated: February 18, 2022
I, Don Smith, Analyst, of Very Excellent Investment Advisors (title and organization), state, under penalty of perjury, that I have examined the information provided herewith consisting of 1 (number of) pages, including accompanying schedules and statements, and to the best of my knowledge and belief, it is true, correct, and complete. The following persons assisted me in preparing this information: (list name, organization and title of each person who assisted): N/A
Signed by: Don Smith
©2023 FiduciaryPath, LLC
Column A Column B Column C Column D Column E Column F Column G Name of Investment List List all investments in this category. If you have none, state “NONE.” Use additional pages as necessary. Include Ticker Symbol in Name of Investment as applicable. Investment Value ASC 820 Fair Value Measurement Level* Fees Paid Directly from Charitable Organization Fees Netted From Returns Profit Share/ Carried Interest or “Incentive Fees” Brokerage Fees/ Commissions Total Investment Management Fees for Purposes of Completing Form 990, Part IX, Lie 11f (Columns A+B+C) % of Assets % of Fees Vanguard 500 Index Fund (VFFSX) $86,439,904 1 – $8,644 – – $8,644 29.27% 0.44% Vanguard Alternative Strategies Fund (VASFX) $103,748,839 1 – $1,327,985 – – $1,327,985 35.13% 67.59% Vanguard Global Equity Fund (VHGEX) $80,573,729 1 – $362,582 – – $362,582 27.28% 18.46% Invesco Emerging Mkts Select Equity (IEMYX) $24,577,933 1 – $265,442 – – $265,442 8.32% 13.51% – – – – – – – – –Schedule 2B Totals $295,340,405 – – $1,964,653 – – $1,964,653 100% 100% Service Provider: Very Excellent Investment Advisors Schedule 2B Form 990 Expense Ratio 0.67% Total Expenses (includes Column
$1,964,653 Total
D)
Expense Ratio (includes Column D) 0.67%
29
Schedule 2C – Fixed Income
Fixed Income include debt securities such as municipal or corporate bonds that provides returns in the form of fixed periodic payments (e.g. interest or coupon payments) and the return of principal at maturity.
Other examples include private debt, Treasury Inflation-Protected Securities (TIPS), US Treasury securities held for longer than one year, fixed income mutual funds and ETF’s, and mortgage-backed securities.
Name of Nonprofit Organization: Everybody’s Favorite Nonprofit
Name of Person Providing Data: Don Smith
Name of Investment Service Provider: Very Excellent Investment Advisors
Summary Completion Date: February 18, 2022
Form 990 Year: 2021
If the named investment incurs no fees or costs in Column A, B, C, or D, indicate by stating “0” as applicable.
*Accounting Standards Codification (“ASC”) 820, Fair Value Measurement and Disclosures, provides the following framework for measuring fair value: Level 1 (Quoted prices in active markets for identical assets or liabilities); Level 2 (Observable inputs other than Level 1 prices, such as quoted prices for similar assets or liabilities, quoted prices in active market that are not active, discounted cash flows, or other inputs that are observable or can be corroborated by observable market data for substantially the full term of the assets or liabilities); and Level 3 (Unobservable inputs that are supported by little or no market activity and that are significant to the fair value of the assets or liabilities, including general partner estimates and recent third-party appraisals).
Dated: February 18, 2022
Very
I, Don Smith, Analyst, of Very Excellent Investment Advisors (title and organization), state, under penalty of perjury, that I have examined the information provided herewith consisting of 1 (number of) pages, including accompanying schedules and statements, and to the best of my knowledge and belief, it is true, correct, and complete. The following persons assisted me in preparing this information: (list name, organization and title of each person who assisted): N/A
Signed by: Don Smith
©2023 FiduciaryPath, LLC
Fixed Income Column A Column B Column C Column D Column E Column F Column G Name of Investment List all investments in this category. If you have none, state “NONE.” Use additional pages as necessary. Include Ticker Symbol in Name of Investment as applicable Investment Value ASC 820 Fair Value Measurement Level* Fees Paid Directly from Charitable Organization Fees Netted From Returns Profit Share/ Carried Interest or “Incentive Fees” Brokerage Fees/ Commissions Total Investment Management Fees for Purposes of Completing Form 990, Part IX, Lie 11f (Columns A+B+C) % of Assets % of Fees iShares Core US Aggregate Bond ETF (AGG) $8,932,928 1 – $2,680 – – $2,680 100.00% 100.00% – – – – – – – – –– – – – – – – – –– – – – – – – – –Schedule 2C Totals $8,932,928 N/A – $2,680 – – $2,680 100.00% 100.00% Service Provider:
Excellent Investment Advisors Schedule 2C Form 990 Expense Ratio 0.03% Total Expenses (includes Column D) $2,680 Total Expense Ratio (includes Column D) 0.03%
30
Schedule 2D – Real Assets
Real assets are physical assets. They include natural resources, commodities, and real estate investments such as real estate trusts (REIT’s), private real estate funds and direct investment in property.
Name of Nonprofit Organization: Everybody’s Favorite Nonprofit
Name of Person Providing Data: Don Smith
Name of Investment Service Provider: Very Excellent Investment Advisors
Summary Completion Date: February 18, 2022
Form 990 Year: 2021
If the named investment incurs no fees or costs in Column A, B, C, or D, indicate by stating “0” as applicable.
*Accounting Standards Codification (“ASC”) 820, Fair Value Measurement and Disclosures, provides the following framework for measuring fair value: Level 1 (Quoted prices in active markets for identical assets or liabilities); Level 2 (Observable inputs other than Level 1 prices, such as quoted prices for similar assets or liabilities, quoted prices in active market that are not active, discounted cash flows, or other inputs that are observable or can be corroborated by observable market data for substantially the full term of the assets or liabilities); and Level 3 (Unobservable inputs that are supported by little or no market activity and that are significant to the fair value of the assets or liabilities, including general partner estimates and recent third-party appraisals).
Dated: February 18, 2022
I, Don Smith, Analyst, of Very Excellent Investment Advisors (title and organization), state, under penalty of perjury, that I have examined the information provided herewith consisting of 1 (number of) pages, including accompanying schedules and statements, and to the best of my knowledge and belief, it is true, correct, and complete. The following persons assisted me in preparing this information: (list name, organization and title of each person who assisted):
N/A
Signed by: Don Smith
©2023 FiduciaryPath, LLC
Real Assets Column A Column B Column C Column D Column E Column F Column G Name of Investment List all investments in this category. If you have none, state “NONE.” Use additional pages as necessary. Include Ticker Symbol in Name of Investment as applicable Investment Value ASC 820 Fair Value Measurement Level* Fees Paid Directly from Charitable Organization Fees Netted From Returns Profit Share/ Carried Interest or “Incentive Fees” Brokerage Fees/ Commissions Total Investment Management Fees for Purposes of Completing Form 990, Part IX, Lie 11f (Columns A+B+C) % of Assets % of Fees Nuveen ShortTerm REIT ETF (NURE) $33,793,384 1 – $118,277 – – $118,277 100.00% 100.00% – – – – – – – – –– – – – – – – – –– – – – – – – – –– – – – – – – –Totals $33,793,384 – $118,277 – – $118,277 100% 100% Service Provider: Very Excellent Investment Advisors Schedule 2D Form 990 Expense Ratio 0.35% Total Expenses (includes Column D) $118,277 Total Expense Ratio (includes Column D) 0.35%
31
Schedule 2E – Alternate/Other Assets
Total investment management fees for purposes of completing Form 990, Part IX, Line 11f (Columns A+B+C).
Other examples include private debt, Treasury Inflation-Protected Securities (TIPS), US Treasury securities held for longer than one year, fixed income mutual funds and ETF’s, and mortgage-backed securities.
Name of Nonprofit Organization: Everybody’s Favorite Nonprofit
Name of Person Providing Data: Don Smith
Name of Investment Service Provider: Very Excellent Investment Advisors
Summary Completion Date: February 18, 2022
Form 990 Year: 2021
If the named investment incurs no fees or costs in Column A, B, C, or D, indicate by stating “0” as applicable.
Alternative/Other Investments
*Accounting Standards Codification (“ASC”) 820, Fair Value Measurement and Disclosures, provides the following framework for measuring fair value: Level 1 (Quoted prices in active markets for identical assets or liabilities); Level 2 (Observable inputs other than Level 1 prices, such as quoted prices for similar assets or liabilities, quoted prices in active market that are not active, discounted cash flows, or other inputs that are observable or can be corroborated by observable market data for substantially the full term of the assets or liabilities); and Level 3 (Unobservable inputs that are supported by little or no market activity and that are significant to the fair value of the assets or liabilities, including general partner estimates and recent third-party appraisals).
Dated: February 18, 2022
I, Don Smith, Analyst, of Very Excellent Investment Advisors (title and organization), state, under penalty of perjury, that I have examined the information provided herewith consisting of 1 (number of) pages, including accompanying schedules and statements, and to the best of my knowledge and belief, it is true, correct, and complete. The following persons assisted me in preparing this information: (list name, organization and title of each person who assisted): N/A
Signed by: Don Smith
©2023 FiduciaryPath, LLC
Column A Column B Column C Column D Column E Column F Column G Name of Investment List all investments in this category. If you have none, state “NONE.” Use additional pages as necessary. Include Ticker Symbol in Name of Investment as applicable Investment Value ASC 820 Fair Value Measurement Level* Fees Paid Directly from Charitable Organization Fees Netted From Returns Profit Share/ Carried Interest or “Incentive Fees” Brokerage Fees/ Commissions Total Investment Management Fees for Purposes of Completing Form 990, Part IX, Lie 11f (Columns A+B+C) % of Assets % of Fees Core Equity and Income Separately Managed Account $63.992,375 2 – $998,281 – $9,472 $998,281 65.11% 67.06% Best Ever Hedge Fund III $34.297,659 3 – – $490,456 – $490,456 34.89% 32.94% – – – – – – – – –Schedule 2A Totals $98,290,034 N/A – $998,281 $490,456 $9,472 $1,488,737 100.00% 100.00% Service Provider:
Excellent Investment Advisors Schedule 2E Form 990 Expense Ratio 1.51% Total Expenses (includes Column D) $1,498,209 Total Expense Ratio (includes Column D) 1.52%
Very
32
Schedule 2F – Other Investment Fees
Other investment fees include amounts charged by investment advisors, managers or consultants, custodians, research services, legal or other expenses.
Name of Nonprofit Organization: Everybody’s Favorite Nonprofit
Name of Person Providing Data: Don Smith
Name of Investment Service Provider: Very Excellent Investment Advisors
February 18, 2022
If the named investment incurs no fees or costs in Column A, B, C, or D, indicate by stating “0” as applicable.
*Accounting Standards Codification (“ASC”) 820, Fair Value Measurement and Disclosures, provides the following framework for measuring fair value: Level 1 (Quoted prices in active markets for identical assets or liabilities); Level 2 (Observable inputs other than Level 1 prices, such as quoted prices for similar assets or liabilities, quoted prices in active market that are not active, discounted cash flows, or other inputs that are observable or can be corroborated by observable market data for substantially the full term of the assets or liabilities); and Level 3 (Unobservable inputs that are supported by little or no market activity and that are significant to the fair value of the assets or liabilities, including general partner estimates and recent third-party appraisals).
Dated: February 18, 2022
I, Don Smith, Analyst, of Very Excellent Investment Advisors (title and organization), state, under penalty of perjury, that I have examined the information provided herewith consisting of 1 (number of) pages, including accompanying schedules and statements, and to the best of my knowledge and belief, it is true, correct, and complete. The following persons assisted me in preparing this information: (list name, organization and title of each person who assisted):
N/A
Signed by: Don Smith
©2023 FiduciaryPath, LLC
Summary Completion Date:
Form 990 Year:
Other Investment Fees Column A Column B Column C Column D Column E Column F Column G Name of Investment Investment Value ASC 820 Fair Value Measurement Level* Fees Paid Directly from Charitable Organization Fees Netted From Returns Profit Share/ Carried Interest or “Incentive Fees” Brokerage Fees/ Commissions Total Investment Management Fees for Purposes of Completing Form 990, Part IX, Lie 11f (Columns A+B+C) % of Assets % of Fees Very Excellent Investment Advisors $444,179,233 N/A $666,269 – – – $666,269 100.00% 84.11% Beaver Badger & Lyon Law Firm – N/A $47,388 – – – $47,388 – 5.98% Everybody’s Favorite Nonprofit InHouse Expense – N/A $78,500 – – – $78,500 – 9.91% – N/A – – – – – – –– N/A – – – – – – –Schedule 2F Totals $444,179,233 N/A $792,157 – – – $792,157 100% 100% Service Provider:
Excellent Investment Advisors Schedule 2F Form 990 Expense Ratio 0.18% Total Expenses (includes Column D) $792,157 Total Expense Ratio
Column D) 0.18%
2021
Very
(includes
33
Endnotes
1. Nonprofit FORT© and Nonprofit Fiduciary Oversight of Responsibilities and Tasks© is used with permission of Fiduciary Wise. https://fiduciarywise.com/
2. Guidestar data column, which aggregates the total amount investments and securities reported on IRS Form 990.
3. Tax exempt organizations file an “information return” annually with IRS. There are some exceptions. https://www.irs.gov/charities-non-profits/annual-exempt-organization-return-who-must-file
4. Center for Board Certified Fiduciaries™ Working paper, “Where are the Lay Fiduciaries Who Have Control and Responsibility for More than $26 Trillion of US Investment Assets?” Last revised June 5, 2021. See https://www.c-bcf.com/
5. The Uniform Prudent Management of Institutional Funds Act (UPMIFA) has been enacted in the US in 49 states (not Pennsylvania), as well as the US Virgin Islands. It incorporates Modern Portfolio Theory and permits total-return investing, updating the Uniform Management of Institutional Funds Act of 1972. https://www.uniformlaws.org/viewdocument/final-act-109?CommunityKey=043b9067bc2c-46b7-8436-07c9054064a3&tab=librarydocuments
6. MIT Sloan Management Review 2014. “How Nonprofit Organizations Use Reputation Risk Management.”
7. Stanford Graduate School of Business, 2015 Survey of US Boards of Directors on Nonprofit Organizations.
8. June 2019 Gallup and Wellcome Trust
9. Asset weighted average expense ratio information on Mutual Fund and Exchange Traded Fund (ETF) assets is from ICI Research Perspective, March 2021, “Trends in the Expenses and Fees of Funds, 2020.” See https://www.ici.org/system/files/attachments/pdf/per27-03.pdf. For information on Hedge Funds, see https://www.cnbc.com/2021/06/28/two-and-twenty-is-long-dead-hedge-fund-fees-fall-further-belowone-time-industry-standard.html for chart showing historical decline of hedge fund fees provided by HFR Microstructure Hedge Fund Industry Report Year End 2020.
10. This research utilizes downloads (drawn during March 2021 through February 2022) from GuideStar’s database gleaned from Form 990s filed with IRS. Information from over 25,000 Form 990s was reviewed to develop a database of 15,016 individual 501(c)(3) public charity’s most recent IRS filings with at least $1 million of investments/securities (the majority of which were for Reporting Year 2018) managing a total of $1,935,988,198,830 of “investments/securities.” Private foundation peer group data was provided by FoundationMark, a private company that continuously tracks Form 990-PF data filed with IRS and provides private foundation trustees with free reports on their foundation’s investment performance, including comparisons to public market indices and a peer star rating system. See https://www. foundationmark.com/#/peergroup
11. See https://princo.princeton.edu/about/investment-strategy/
12. It should also be noted that it’s not uncommon for universities and other large public charities to receive gifts of privately held or restricted stock, with instructions not to sell or to sell only over an extended time period. The management of such transactions could also impact investment fees from year to year.
13. Additional questions asked were: “On the IRS Form 990 filed in 2018, the latest available year in the data set:
a. Are the reported investment management fees accurate?
b. Does this include direct fees (fees that are paid directly to a service provider)?
c. Does this include indirect fees (fees that are deducted from within the investment, such as mutual fund expense ratios or deducted from private equity, hedge funds, limited partnerships)?
d. Are the investment managers, advisors, consultants, and others involved in the investment management for your institution contractually required to report all direct and indirect fees and expenses on the investments to you annually? If not, why not?
e. Do you have any additional comments?
©2023 FiduciaryPath, LLC
34
14. For more detailed information on respective investment options and fees for these charitable gift funds, see https://www.fidelitycharitable.org/giving-account/investment-options/pool-performance. html#single-asset-class and https://charitable.schwab.acsitefactory.com/node/4841 and https://www. vanguardcharitable.org/investments/all-investment-options
15. See https://news.bloomberglaw.com/litigation/suits-over-401k-fees-nab-150-million-in-accords-big-andsmall and https://news.bloomberglaw.com/employee-benefits/flood-of-401k-fee-lawsuits-spur-wave-ofearly-plaintiff-wins
16. Financial Accounting Standards Board (FASB) Accounting Standards Update (ASU) 2016-14, Not-for-Profit Entities (Topic 958), Ali Chalak and Sasha Correnti. https://www.mossadams.com/ articles/2017/march/not-for-profit-presentation-of-investment-return
17. This research report has emphasized key portions of UPMIFA related to a public charity’s requirement to “incur only reasonable costs” and “make a reasonable effort to verify relevant facts.” As additional background, in the last three decades the legal requirements and what a public charity must do to “prudently manage its investments” has evolved. Previously, public charities were governed by the Uniform Management of Institutional Funds Act (UMIFA) that had a more restrictive standard to investment decision making. Beginning in 2008, states began adopting the Uniform Prudent Management of Investment Funds Act (UPMIFA) which provided public charities updated and more useful guidance by incorporating language from the Uniform Prudent Investor Act (UPIA), modified to fit the special needs of charities. UPMIFA spells out the specific factors a Public Charity should consider in making investment decisions, thereby imposing a modern, well accepted, prudence standard.
Among the expressly enumerated prudence factors in UPMIFA is “the preservation of the endowment fund,” a standard not articulated in UMIFA.
In addition to identifying factors that a charity must consider in making management and investment decisions, UPMIFA requires a charity and those who manage and invest its funds to:
a Give primary consideration to donor intent as expressed in a gift instrument,
b. Act in good faith, with the care an ordinarily prudent person would exercise,
c. Incur only reasonable costs in investing and managing charitable funds,
d. Make a reasonable effort to verify relevant facts,
e. Make decisions about each asset in the context of the portfolio of investments, as part of an overall investment strategy,
f. Diversify investments unless due to special circumstances, the purposes of the fund are better served without diversification,
g. Dispose of unsuitable assets, and
h. In general, develop an investment strategy appropriate for the fund and the charity. UMIFA, the predecessor to UPMIFA, did not articulate these requirements. Consequently, UPMIFA strengthens the rules governing management and investment decision making by Public charities and provides more guidance for those who manage and invest the funds.
18. See https://www.prb.texas.gov/investments/investment-expense-reporting/
19. Resources include “The Risk, Reward and Asset Allocation of Nonprofit Endowment Funds” by Andrew W. Lo, Egor Matveyev and Stefan Zeume, MIT Sloan School of Management Working Paper, Last Revised March 2020. See https://papers.ssrn.com/sol3/papers.cfm?abstract_id=3560240. In addition, private foundation peer group data is published by FoundationMark, a private company that continuously tracks Form 990-PF data filed required by IRS for private foundations (not public charities). See https://www.foundationmark.com/#/peergroup
20. See https://www.sec.gov/investor/alerts/ib_fees_expenses.pdf
21. These calculations can be confirmed utilizing the US Securities and Exchange Commission calculator posted at https://www.investor.gov/financial-tools-calculators/calculators/compound-interest-calculator
©2023 FiduciaryPath, LLC
35
For more information:
Kathleen McBride, BCFTM, AIFA® —kmcbride@fiduciarypath.com

Allan Henriques, JD, BCFTM, AIFA®—allan@fiduciarypath.com