

Luxury Homes Index
Data was compiled by the Concierge Auctions team from Multiple Listing Services (MLS) and public property records.

Press inquiries:
Concierge Auctions inquiries@conciergeauctions.com
212.658.1404
Wilmot, Near Lake Sunapee, NH
State of the market — 2025 /04
Sale prices have peaked /08
Seller aspirations grow faster than reality /11
Luxury real estate sells slowly /16
Properties that sell slower, also sell at lower prices /18
Selling slowly is expensive and time consuming /20
About Concierge Auctions /24 Market overview /27
Southern
Greater
New

Lafayette, San Francisco Bay Area, CA
Welcome to the 10th edition of our annual report on the movements within the luxury real estate market
State of the market — 2025
Specifically, we look at the 10 highest-grossing real estate transactions¹ across 56 of the top luxury markets across the United States (US). Our goal is to help buyers, sellers, and real estate professionals better navigate the luxury real estate market by arming them with data to help guide their decision-making.
In addition to our annual analysis, in this 10th edition, we also release 10-year trend lines for many of the top geographies to better show historic patterns.
For the sake of brevity, below are the five most important findings that our data shows generally hold across these luxury US real estate markets in 2024:
I
Sale prices have peaked
On average, sale prices for luxury properties are up 4.7% compared to 2023, following a general 10-year upward trend. Although prices aren’t as high as at their 2021 peak, a general positive trend will likely continue.
There is a large divergence between the listing and the realized price
Sellers list at ambitious or unrealistic prices, and on average sell for 13% below their initial listing price. There is a significant and consistent delta between the price that sellers initially list at and the price the market is willing to pay. For those that sell within 180 days, this jumps to 94%. For those that take longer than 180 days, this drops to only 81%.

Wayzata, Minneapolis Area, MN

Barbara, CA
III
Luxury real estate sells slowly
A median house takes less than 60 days to sell². Luxury properties however average 319 days to sell. A significant fraction of properties that surpass 180 days on the market take upwards of years to sell.
IV
Properties that sell slower, also sell at lower prices
If a luxury property doesn’t sell within the first 180 days, typically it sells at a significantly lower value than their initial listing price. For those that sell within 180 days, average DOM is 89; whereas, for the majority that take longer than 180 days to sell, average DOM is 514.
Santa
Selling slowly is expensive and time consuming
For luxury properties, the costs of selling slowly are substantial. Sellers find that everything from carrying costs to headaches compound over time.

In the next few pages, we first explore the big trends that drove luxury property transactions over the past years in more detail. We then present our annual data in the context of the last 10 years for our top 56 tracked markets³. The data for each market is available beginning on page 27.
Wilson, Jackson Hole Area, WY
Sugar Land, Houston Area, TX

Sale prices have peaked
The past 10 years have seen plenty of turmoil—the pandemic, unusually high inflation, the 2022 stock market downturn, and ever-present natural disaster risks have all had their impact.
Luxury property transaction values saw their peak in 2021, and slightly suppressed in 2022 and 2023. In 2024, prices rose 4.7% compared to the previous year, but not above this 2021 peak. Compared to 2015—10 years ago, and the first year of our reporting—average sales prices are up 44.2%, representing an average 3.7% annualized growth.
We see the strongest growth in regions like Florida, Southern States, and the Northwest Coast, while markets are down on average in Southern California, New England, and the Greater East Coast region.
According to the Federal Bureau of Labor Statistics⁴, in 2024, the inflation rate in the US was 2.9%.
With an average rise of 4.7%, luxury real estate transactions far outstrip this. Other markers, like the S&P 500® Index, see faster growth.
Despite strong YOY price appreciation in some regions, almost all regions are below their peaks as seen in 2020-2022.
Calistoga, Napa Valley, CA

Two factors make it hard for sellers of luxury real estate to set an appropriate listing price for their property:
First, every luxury property is unique and has its charm— almost by definition, there are very few comparable properties to help determine an asking price. Second, the pool of buyers for luxury properties is small and highly illiquid making it more difficult to sell unless priced and marketed appropriately.
As a result, listing prices in luxury real estate are often aspirational. Sellers list for what they hope to sell for. The consequence is that the average realized sales price— the real, revealed market value of the property—is often substantially lower than this aspirational listing price.
Over our 10 years of reporting, we’ve seen this gap to be consistent, and relatively persistent across regions.
On average, 2024 saw properties listed for 15% more than their realized sales price. As average prices rise, seller aspirations consistently outgrow market demand.
Looking across markets, we see some variation in this pattern. Markets that appreciate quickly carry more uncertainty in the appropriate listing price, and thus tend to create larger variances between listing and realized prices.

La Dune
Originally listed for $150M, sold 8 years later for $88.5M

The four-acre beachfront estate in Southampton, New York, known as La Dune was on and off the market since 2016 and unable to attract buyers for its eye-watering $150M list price. It finally was auctioned via Concierge Auctions in January 2024, and fetched a record-breaking $88.5M— the top transaction in the Hamptons for the year.
La Dune is an extreme example that highlights all the troubles of selling ultra-luxury real estate: listing for far above the revealed market price, failing to sell for years on end, and finally stratospheric expectations having to face market realities.
2,750
59%
La Dune
366 & 376 Gin Lane, Southampton, NY
We will likely see a consistent gap with properties initially listing for prices as much as 30% higher than what they will sell for. Market uncertainty means increased disparity between listed and realized prices.
Properties priced too high will struggle to sell quickly and ultimately be costly to sellers—as we’ll see in the next point, below…


Millbrook, NY
Our 2025 expectations
Luxury real estate sells slowly

Selling luxury real estate isn’t like selling ordinary assets: each property is unique, properties cannot change location, and luxury properties are (by definition) expensive.
As a result, each luxury property for sale necessarily has very few relevant buyers that are interested in that particular property, in that particular location, and at that particular moment in time. The market is therefore slow. Finding buyers can be an arduous and exhausting process. Establishing a fair market price is hard because every transaction is so unique.
Whereas, according to The Federal Reserve Bank², a median property in the US generally sold within 60 Days On Market (DOM) in 2024, top luxury real estate transactions took much longer, at an average of no less than 319 days— up slightly from previous years. Across our data set of top transactions in 2024, roughly one in eight properties were sold after more than 600 DOM—almost two years—and ~4% took more than 1,000 days to sell.
Upper East Side, New York, NY

Properties that sell slower also sell at lower prices
Across all markets and years, we see strong correlations where properties that sell slower also on average sell at lower prices (relative to their listing price). In other words: if a property is priced too high, it will struggle to sell quickly. If a property stays on the market for a prolonged period of time, it generally creates negative perception. Buyers may be likely to use this as a point of negotiation leverage, generally for a deal more advantageous to the buyer at the expense of the seller.
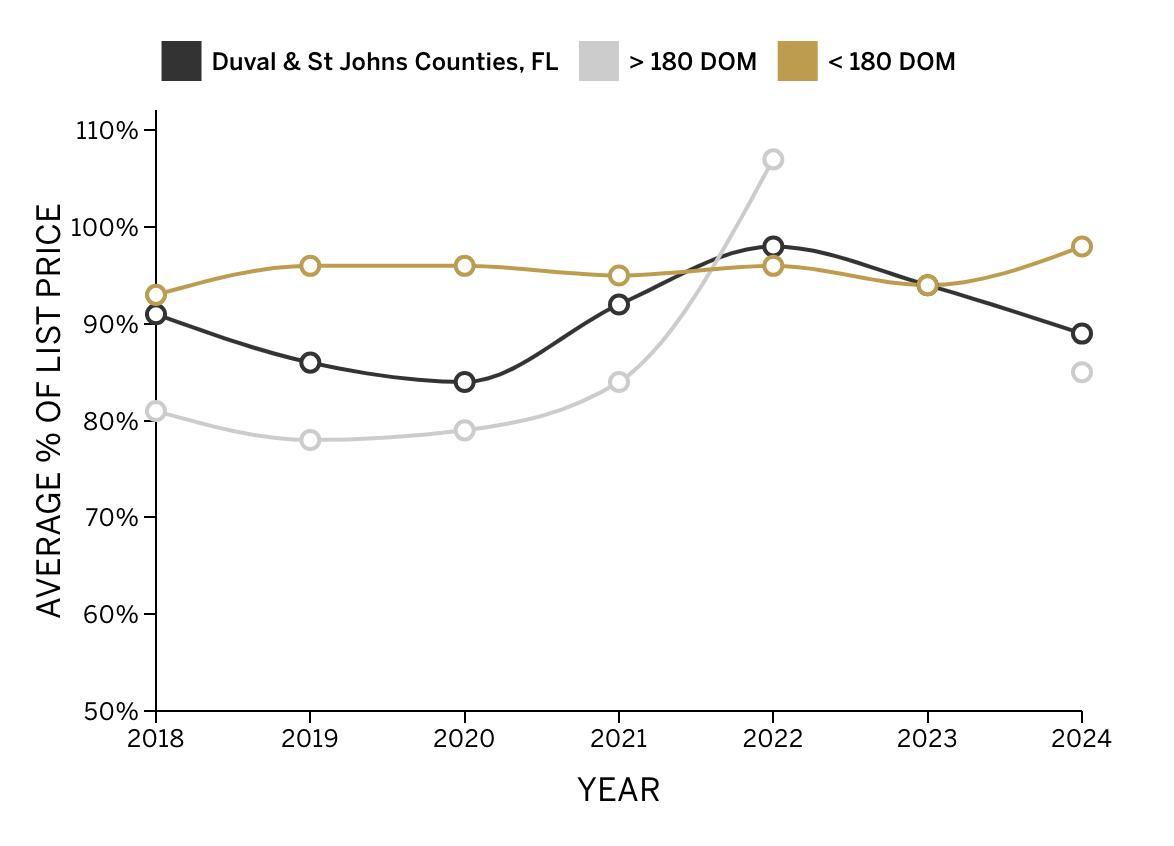
Generally, we see a notable distinction between properties that sell within the first 180 days and those that sell more slowly. Properties that sell within 180 days of their original listing date⁵ typically sell for a much higher percentage of their listing price than property listings that surpass the 180-day threshold.
Below is a graph showing the divergence between realized prices for properties sold under 180 days on the market versus those sold (much) more slowly. In 2024, those selling in less than 180 days from their original list date averaged just a 7% difference to the initial listing price, while those that took more than 180 days to sell also had to accept an average of nearly 20% difference to their initial listing price. Said differently, these properties were listed nearly 25% higher than actual market value.
If you can’t sell within the first 180 days, it might take years, and you’ll end up selling at a fraction of your listing price.
Advice for sellers
Selling slowly is expensive and time-consuming

Once the decision is made to sell a property, most people would prefer the process to be swift. For luxury and ultraluxury real estate, the cost of carrying an unwanted property is often very financially and emotionally burdensome. Such costs include, but are not limited to, mortgage, insurance, taxes, utilities, HOA, maintenance, landscaping, security systems, staff, and property management company fees.
Generally-speaking, the more unique the home, the more these costs increase.

Austin Hill Country, TX
Also, older properties or properties with grounds and/or acreage or multiple structures to maintain generally see higher carrying costs that can substantially exceed this range.
For most sellers, the direct financial burden is not the primary concern—unsold properties are also timeconsuming to manage, creating a constant source of worry, and can be a mental drain. As a result, months or even years of precious time and energy are spent worrying about the state and care of a property that sellers have decided to want to part ways with.
Fisher Ranch | Wimberley,

The One
The largest and grandest house ever built in the urban world

A 105,000-square-foot property for the record books— 944 Airole Way in Bel Air, California, is the grandest house ever built. The first and last of its kind, after 10 years of construction and years of inability to either fully finish, finance or sell it, the dream property had turned into a real estate nightmare.
No market comparables and an ambitious listing price that disregarded reality, meant the property went stale. In 2022, The One was finally sold at auction via Concierge Auctions, and fetched both the highest price ever achieved for a residence at auction, and the highest transaction value for any property in 2022.
1,000+
48%
The One, Bel Air, CA

About
Concierge Auctions
We understand that luxury real estate is a unique asset class with its own particular challenges. Every day, we match sellers of one-of-a-kind properties with the world’s most capable buyers via a state-of-the-art digital marketing, property preview, and bidding platform.
In order for both buyers and sellers to make informed decisions, access to detailed market-specific data and insights is crucial. For this reason, we’re happy to publish this 10th anniversary edition of this Luxury Homes Index. We are proud to offer comprehensive market insights that help all market participants make data-informed decisions.
We’re here to help
Concierge Auctions is backed by Sotheby's, the oldest and most esteemed auction house founded in 1744, along with Anywhere Real Estate (NYSE: HOUS), a residential real estate brokerage that offers the largest global agent network.
If you are interested to discuss the prospect of selling your property through auction in 60 days, then please reach out to us:
(212) 202 2940
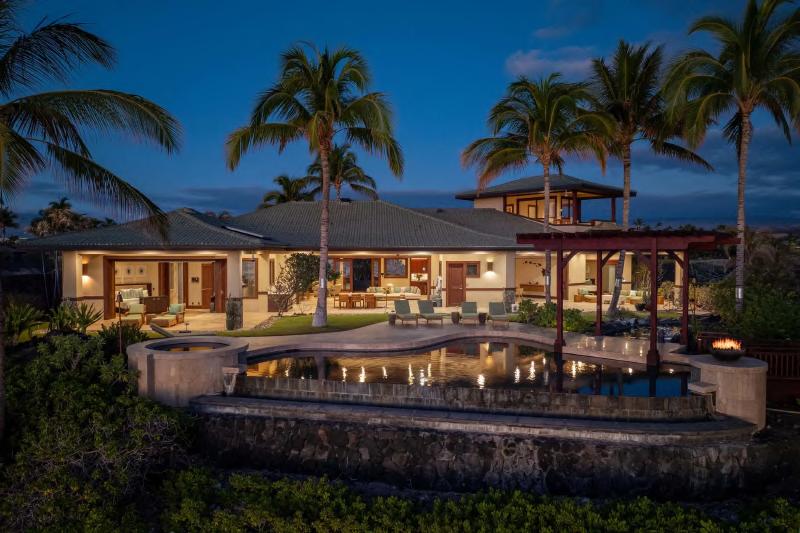
Kona Coast, Big Island, HI
Footnotes
In some markets, not all top 10 highest grossing transactions could be tracked because the data was not publicly available.
Federal Reserve Bank of St. Louis: https://fred.stlouisfed.org/series/MEDDAYONMARUS
Not all 56 markets have data for the past 10 years.
Federal Bureau of Labor Statistics: https://www.bls.gov/news.release/cpi.nr0.htm
Original listing date factors in total Days On Market (DOM) in a given sales cycle, including if the property was re-listed multiple times during the sale period. If a property underwent improvements or significant time passed in between listings without a sale, 8 months or more, that restarted the DOM sale cycle.
Market overview
Southern California
Beverly Hills
Brentwood
Holmby/Bel Air
Malibu
Orange County
Pacific Palisades
Rancho Santa Fe
San Diego
Westlake Village Northwest Coast
Palo Alto
San Francisco
Santa Barbara
Sonoma
Seattle Lake Tahoe Hawaii
Greater East Coast
Fairfield County
Fairfax Greenwich
Hamptons
Morristown + Essex
New York City
Westchester
Philadelphia
Boston
Cape Cod
Martha s Vineyard
Nantucket
New Hampshire
Rhode Island
Vermont
Southern California

Beverly Hills
Brentwood
Holmby/Bel Air
Malibu
Orange County
Pacific Palisades
Rancho Santa Fe
San Diego
Westlake Village
Readcrest Drive, Beverly Hills, CA
The Southern California region includes key luxury markets in the broader Los Angeles and San Diego area.
Markets like around the San Francisco Bay Area and further north can be found in the Northern West Coast cluster. In 2024, the average sales price across all tracked markets is just south of $21M, with some markets like Malibu or Beverly Hills pacing significantly higher.
Most Southern California markets see an uptrend after a disappointing 2023, but below the peaks seen in 2021 and 2022. The average luxury property in the region takes 319 days between the initial listing and the final sales date, comparable to the previous two years.
Beverly Hills
In 2024, the Beverly Hills real estate market continued to adjust from the highs of 2021 and 2022, with average sales prices falling to $31M, down 19% from $39M in 2023. This drop brings prices closer to pre-pandemic levels, aligning with the 10-year average of $31M.
While the decline seems significant, it may reflect a natural correction rather than a cause for concern; time will tell. Beverly Hills remains a standout market for pricing, with average sale prices well above the regional average of $18M.
Prices near pre-pandemic levels at $31M
DOM drops to 515, signaling faster sales; however, is 47% longer than US average
Sellers achieve just 83% of the listing price, and less for those with longer listing periods

Activity is picking up
The market also shows increased selling activity, with the average Days On Market (DOM) dropping to 515 in 2024 from 722 in 2023. While this is still higher than the 10-year average of 434 days, the decrease means that properties are moving faster than they did in recent years. Sellers are also achieving stronger outcomes, with properties selling at 83% of their listing price in 2024, a notable improvement from 69% in 2023. Notably in 2023, none of the top 10 sales sold in under 180 days. This progression indicates that buyers and sellers found common ground around pricing more effectively, contributing to a more balanced market.
Beverly Park Court, Beverly Hills, CA
General market trends
Sales prices over time

Beverly hills, CA Southern California US
On Market (DOM) over time

Beverly hills, CA Southern California US
Sales & list price dynamics
Beverly Hills, CA vs other markets

Beverly hills, CA Southern California Us

Brentwood
In 2024, the Brentwood market grew, with average sales prices rising from $15M in 2023 to $17M, slowly returning to pre-pandemic sales prices. Today’s sales prices are in stark contrast with the market’s 10-year peak in 2022, when properties sold for $31M, very similar to many luxury markets.
Average sales prices rose to $17M in 2024, catching up to pre-pandemic levels
DOM increased to 254, reflecting a slower, more cautious market, but are still 23% less than the US average
Faster sales ( below 180 DOM) achieved 90% of listing price

A market slowdown
In 2024, properties took nearly 30% longer to sell compared to 2023. While sales prices rise, buyers may also take more time to make decisions. Despite this slight slowdown, the market moved faster than the rest of the US (320-day average) as it has for nine of the last ten years. However, top properties only brought in 86% of their initial listing price.
It’s worth noting that properties sold within 180 days achieved 90% of their listing price, while those that took longer sold for 83% on average in 2024. This underscores the importance of strategic pricing and timing for sellers looking to maximize their returns in a market still finding its footing.
Elkins Road, Brentwood, CA
Sales prices over time
General market trends
Brentwood, CA Southern California US

Days On Market (DOM) over time

Brentwood, CA Southern California US year
Sales & list price dynamics
Brentwood, CA vs other markets

Brentwood, CA Southern California Us
and low DOM

Brentwood, CA > 180 DOM < 180 DOM
Holmby/Bel Air
III
The Holmby Hills and Bel Air markets are making a powerful comeback in 2024, with average sales prices rising to $27M, a notable 33% increase from $20M in 2023. This growth brings prices back to their 2018 and 2020 levels.
Average sales prices jump to $27M, matching 2018 and 2020 prices
DOM rises slightly to 378, reflecting a more aspirational market
Sellers achieve just 78% of the listing price, with faster sales hitting 84%

While the market is thriving, it may be slowing down
Properties are taking slightly longer to sell, with Days On Market (DOM) rising from 356 in 2023 to 378 in 2024—a modest 6% increase from the previous year but outstripping the national average. This suggests a more deliberate pace, as buyers carefully evaluate their investments in high-stakes markets Holmby Hills and Bel Air.
Although sellers are seeing better outcomes than in previous years, in 2024, properties sold for just 78% of their listing price on average, up from 69% in 2023. While there was marked improvement year-over-year, this suggests Bel Air ultra-luxury listings are initially listed significantly above market value. For homes that sell within 180 days, this number climbs to 84%. Sellers should consider this when deciding how much time to spend on the market.
Bridle Trail Road, Hidden Hills, CA
Sales prices over time
General market trends
Days On Market (DOM) over time
Holmby/Bel Air, CA Southern California US


Holmby/Bel Air, CA Southern California US
Average Days On Market
Sales & list price dynamics
Holmby/Bel Air, CA vs other markets

Holmby/Bel Air, CA Southern California Us

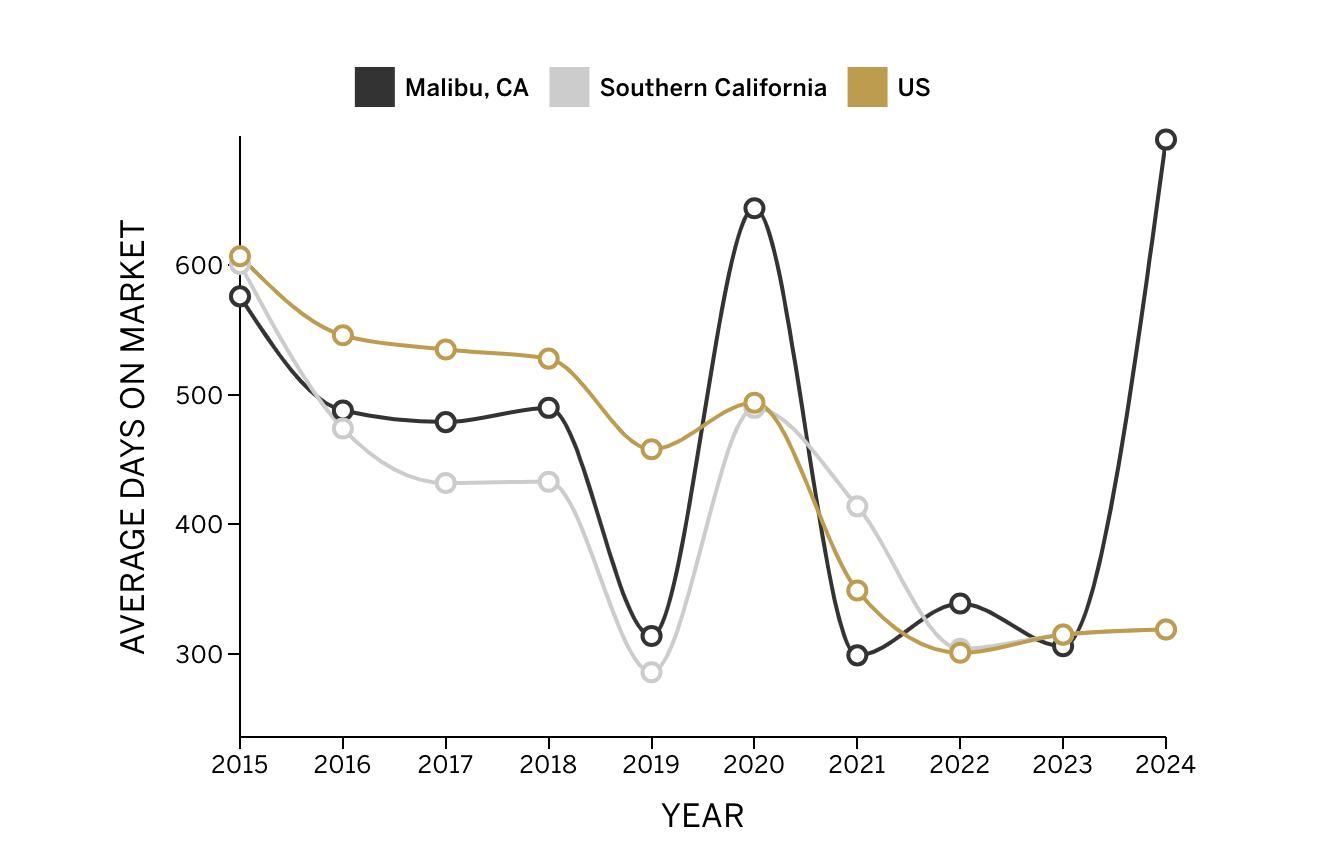
Malibu
Sunny Malibu showed signs of cooling since its record years, 2022 and 2023. In 2024, sales prices dropped to $32M, down from $42M in 2023 and $46M in 2022. Despite this decline, the market remains robust;average sales prices sit well above Malibu’s 10-year average of $26M. It outperformed the broader Southern California region, where the average sales price is $18M.
Average sales prices dip to $32M, but remain above the 10-year average
DOM rises to nearly 2 years, with faster sales still taking about 1 year
III Faster sellers achieve 87% of the listing price, outperforming slower sales by 11%

Land of exclusive properties
One property in 2024 sold for a staggering $75M, highlighting Malibu’s long-standing appeal among highnet-worth buyers. This property skewed the average Days On Market (DOM) to increase by 50% since 2023. In reality, the average time on the market for properties in Malibu is closer to 1 year, in line with the regional average.
In 2024, we also saw that sellers who acted strategically reaped the rewards. Properties sold within 180 days achieved 87% of their listing price, compared to 76% for slower sales. This highlights the importance of pricing competitively to avoid long periods on the market without selling.
Malibu, CA
Sales prices over time
Malibu, CA Southern California US
General market trends
Days On Market (DOM) over time
CA Southern California US
Average Days On Market

Sales & list price dynamics
Malibu, CA vs other markets

Malibu, CA Southern California Us
and low DOM

Malibu, CA > 180 DOM < 180 DOM
Malibu,
Orange County
Orange County’s luxury real estate market continues to thrive, with average sales prices reaching $26M in 2024, down slightly from $27M in 2023. Sale prices in Orange County are 21% higher than the Southern California average.

A strong market with faster sellers
Orange County is among the first in class among our Southern California markets. With Days On Market (DOM) dropping to 242 in 2024, well below the 10-year average of 411 days.
What’s more? Sellers who act quickly are seeing strong results, with properties sold within 180 days achieving 87% of their listing price, compared to just 63% for slower sales. These are some of the best examples of faster selling paying off in higher sales prices. This metric also signals Orange County sellers may not want to stay on the market too long before making the sale.
San Juan, Capistrano, CA
General market trends

Orange County, CA Southern California US
On Market (DOM) over time Orange County, CA Southern California US

Sales & list price dynamics
Orange County, CA vs other markets

Orange County, CA Southern California Us

County, CA >
San Diego
III
Will living in the comfortable San Diego weather ever go out of style? It doesn’t seem so. In 2024, top luxury real estate sellers fetch an average of $17.7M for their properties, only marginally lower than peak average prices of $20M, seen in 2020 and 2021. After a slow year in 2023, San Diego is on the upswing again. This is a market to watch.
Average sales prices were only 10% below their 2020 and 2021 peak
San Diego properties now sell faster than US and California averages
Beware: selling slowly translates to generally worse economic outcomes

Prices are up again, and the market is alive
Where other markets in the Southern California regional cluster have struggled in the last years, with valuations down 22% from their 2022 peak, San Diego is faring much better. Valuations peaked in 2020 and 2021 and have since compressed by only about 10%. Now, they appear to be on the rise again. Alongside rising sales prices, we saw a 10year trend of ever-shortening sales cycles.
San Diego properties now sell faster than Southern California and US averages by a meaningful margin. Seller beware: while those that manage to sell in under 180 days can hope to fetch 94% of their original listing price, slower sales settle at just 77% of the listing price, on average. For example, the highest grossing transaction in 2024 sold for $35M after originally asking $55M, representing a $20M discount. This property took 844 days to sell. It generally pays to sell quickly, and not get stuck with a stale property.
Biscayne Place, San Diego, CA
San Diego, CA Southern California US
General market trends

On Market (DOM) over time San Diego, CA Southern California US

Sales & list price dynamics
San Diego, CA vs other markets

San Diego, CA Southern California Us

Pacific Palisades
In 2024, Pacific Palisades' average transaction reached over $19M, up 25% compared to the previous year, but well under the 2022 market peak. Overall, the market has seen dramatic price movement along with other markets in the greater Los Angeles region. Compared to the first year of our reporting, prices have risen 56% over 10 years.
sales prices are up 25% YOY
DOM are up 50% compared to the previous year III If sold after more than 180 DOM, sellers sell at large discounts to the listing price

In Pacific Palisades, it pays to sell faster
Compared to other Southern California luxury markets, top properties in Pacific Palisades are a little less expensive. They also tend to sell somewhat faster than the regional and US average, with Pacific Palisades properties spending an average of 251 Days On Market (DOM).
Despite this, the market sees a clear divide between sellers who sell their property rapidly and those who wait longer. Those selling in under 180 days can expect to sell at 93% of their initial listing price. Those who wait longer, however, don’t only take longer to sell, but will also settle on lower valuations, at an average of 25% less than the listing price.
Seaboard Road, Malibu, CA
Sales prices over time
General market trends
Days On Market (DOM) over time
Pacific Palisades, CA Southern California US


Pacific Palisades, CA Southern California US
Average Days On Market
Sales & list price dynamics
Pacific Palisades, CA vs other markets

Pacific Palisades, CA Southern California Us

Rancho Santa Fe
In 2020 and 2021, Rancho Santa Fe saw impressive growth in average property values, jumping from around $7-8M to ~$14M. Since then, prices remained steady over the past few years. Since the peak of 2021, the market moved sideways, and 2024 clocks in at $14M, comparable with the previous year.
Compared to pre-pandemic years, Rancho Santa Fe retains its elevated valuations
II
Average sales prices are $14M in 2024, comparable to previous years
III Rancho Santa Fe properties average 187 DOM, significantly less than the US average

Steady prices in an active market
Although a steady market sounds somewhat unremarkable, this is great news in the broader context of Southern California. Where adjacent markets saw prices drop 23% compared to 2022, Rancho Santa Fe is holding steady.
Interestingly, Rancho Santa Fe properties sell significantly faster than the US or Southern California averages, with an average of 187 Days On Market (DOM) in 2024, continuing a 10-year downward trend which signifies appropriately priced listings, on average. Homeowners looking to sell their property can expect to transact quickly and sell at a final sales price as high as 88% of original listing prices. Across all metrics, Rancho Santa Fe is one of the strongestperforming markets in 2024 in Southern California.
Rancho Santa Fe, CA
Sales prices over time
General market trends
Days On Market (DOM) over time
Rancho Santa Fe, CA Southern California US


Days On Market
Rancho Santa Fe, CA Southern California US
Sales & list price dynamics
Rancho Santa Fe, CA vs other markets

Rancho Santa Fe, CA Southern California Us

Santa Fe, CA >
Westlake Village
Westlake Village’s luxury real estate market is rising, with average sales prices climbing to $7M in 2024, up from $6.2M in 2023. This steady growth reflects a decade-long upward trend, offering an attractive alternative to pricier markets like Malibu or Beverly Hills.

An efficient, approachable market
The market is also highly efficient, with Days On Market (DOM) at 197 in 2024, 43% lower than the regional average of 343 days. Sellers are thriving, achieving an impressive 94% of their listing price on average, making it one of the most seller-friendly markets in the region.
Westlake Village’s success stems from its scenic beauty and family-friendly appeal. The area offers a serene, yet convenient, lifestyle just a short drive from Los Angeles. Toprated schools, a strong local economy, and a tight-knit community further enhance its appeal, consistently attracting buyers seeking luxury without the premium price.
Lakeview Canyon Road, Westlake Village, CA
General market trends
Sales prices over time

Westlake Village, CA Southern California US
Days On Market (DOM) over time

Westlake Village, CA Southern California US
Sales & list price dynamics
Westlake Village, CA vs other markets

Westlake Village, CA Southern California Us

Northwest Coast

Palo Alto
San Francisco
Santa Barbara
Sonoma
Seattle
Lake Tahoe
Hyde Street, San Francisco, CA
The Northwest Coast tracks markets from Seattle to the San Francisco Bay Area (markets further south can be found in the separate Southern California region).
After aggressive sales price appreciation in 2020 and 2021 and a subsequent drawdown in 2022 and 2023, most markets saw an uptick again in 2024. Across markets, the average transaction value of the top 10 properties was $18.4M in 2024.
Compared to 2022 and 2023 averages which were in the $14M to $15M range, 2024 sales prices show a significant uplift. Due to macroeconomic factors, the region saw a drawdown in 2022 and a much faster recovery this year. Palo Alto, for example, has the lowest DOM of all 56 markets in 2024 at just 76 days. The charm and economic appeal of many markets in our Northwest Coast analysis have stood the test of time.
Palo Alto
After an unusual peak year in 2021—where all top-10 properties fetched over $23M each, with four sales over $30M—Palo Alto has reverted to its long-run trend. In 2024, average sales prices are at $11.3M, up a modest 15% since we started tracking in 2017. Palo Alto is unusual as a luxury market, exhibiting fast sales cycles of just 75 days on average in 2024.
Average sales prices at $11.3M in 2024, up 8% compared to the previous year
Properties sell unusually fast: 75 Days On Market (DOM) on average, the lowest of all 56 markets in 2024
9 of 10 top properties in 2024 were sold in under 180 days

Palo Alto properties can sell quickly
The trends observed in Palo Alto significantly run against the usual patterns seen across US luxury markets. On average, properties sell in just 76 days from initial listing to date of sale—the lowest of all 56 markets—and 9 of the 10 top properties in 2024 were sold in under 180 days. This is very unusual. Neighbouring San Francisco sees an average DOM of 268 days with sellers accepting larger discounts on their initial listing prices.
In Palo Alto properties move quickly, and generally fetch 95% of the initial listing price, the third highest of all 56 markets. This is because the market has a large volume of potential buyers available. This means Palo Alto behaves more like a regular real estate market for generally wealthy buyers.
El Cerrito Avenue, Palo Alto Area, CA
Sales prices over time
Palo Alto, CA Northwest Coast US
General market trends

Days On Market (DOM) over time

Palo Alto, CA Northwest Coast US
Sales & list price dynamics
Palo Alto, CA vs other markets

Palo Alto, CA Northwest Coast Us

San Francisco
San Francisco's luxury real estate market in 2024 shows a mix of steady recovery since its peak in 2023. While the average sales price has held steady YOY at over $18M, up from $14M in 2022, it still lags behind the Northwest Coast average sales price of $22M.

Selling faster equals selling for higher prices
Unsurprisingly, properties in San Francisco continue to command higher prices compared to the national average sales price of $16M. The San Francisco market saw a slight slowdown in 2024, with the average Days On Market (DOM) increasing from 135 days in 2023 to 268 days in 2024, indicating properties are taking 66% longer to sell.
Remarkably, properties that sold within 180 days achieved 102% of the list price in 2024, compared to just 84% for properties that took longer to sell. This highlights the impact of extended market time on final sale prices. As a result, the percentage of list price met rose to 93% in 2024, the highest since 2017. This should inform sellers’ decisions to wait too long before selling.
Broadway, San Francisco, CA
Sales prices over time
San Francisco, CA Northwest Coast US
General market trends

Days On Market San Francisco County, CA vs other markets
On Market (DOM) over time

Francisco, CA Northwest Coast US
Sales & list price dynamics

San Francisco, CA Northwest Coast Us

Santa Barbara
Santa Barbara's market has seen impressive growth in average sales prices in 2024, rising to $36M, up 72% since 2023. This notable growth has solidified Santa Barbara’s position as the regional leader in market value over the past few years.
Sale prices surged 72% to $36M in 2024, up from $21M in 2023
Average DOM in 2024 doubles YOY to 330 days, with slower sales fetching an average of just 76.7% of the list price
III Percentage of original list price is lowest of all Northwest Coast and third lowest of all 56 markets, at just 75.6%

High selling prices in a slow market
Despite seeing a surge in average sales prices, the percentage of original list price achieved decreased substantially YOY by 11%. This is in large part due to the average Days On Market (DOM) for properties in Santa Barbara doubling to 330 days in 2024, up from 151 days in 2023. This suggests original listing prices were aspirationally high leading to properties sitting on the market longer while buyers waited for them to reach market value via price reductions..
In 2024, properties sold for 75.6% of their listing price, the lowest it has been in 10 years. This indicates that properties in Santa Barbara are sold for a lower percentage of their listing price relative to the long-term average. Buyers may have the upper hand.
Deer Lodge, Santa Barbara, CA
Sales prices over time
General market trends

Santa Barbara, CA Northwest Coast US
Days On Market (DOM) over time

Santa Barbara, CA Northwest Coast US
Sales & list price dynamics
Santa Barbara, CA vs other markets

Santa Barbara, CA Northwest Coast Us

Barbara, CA > 180
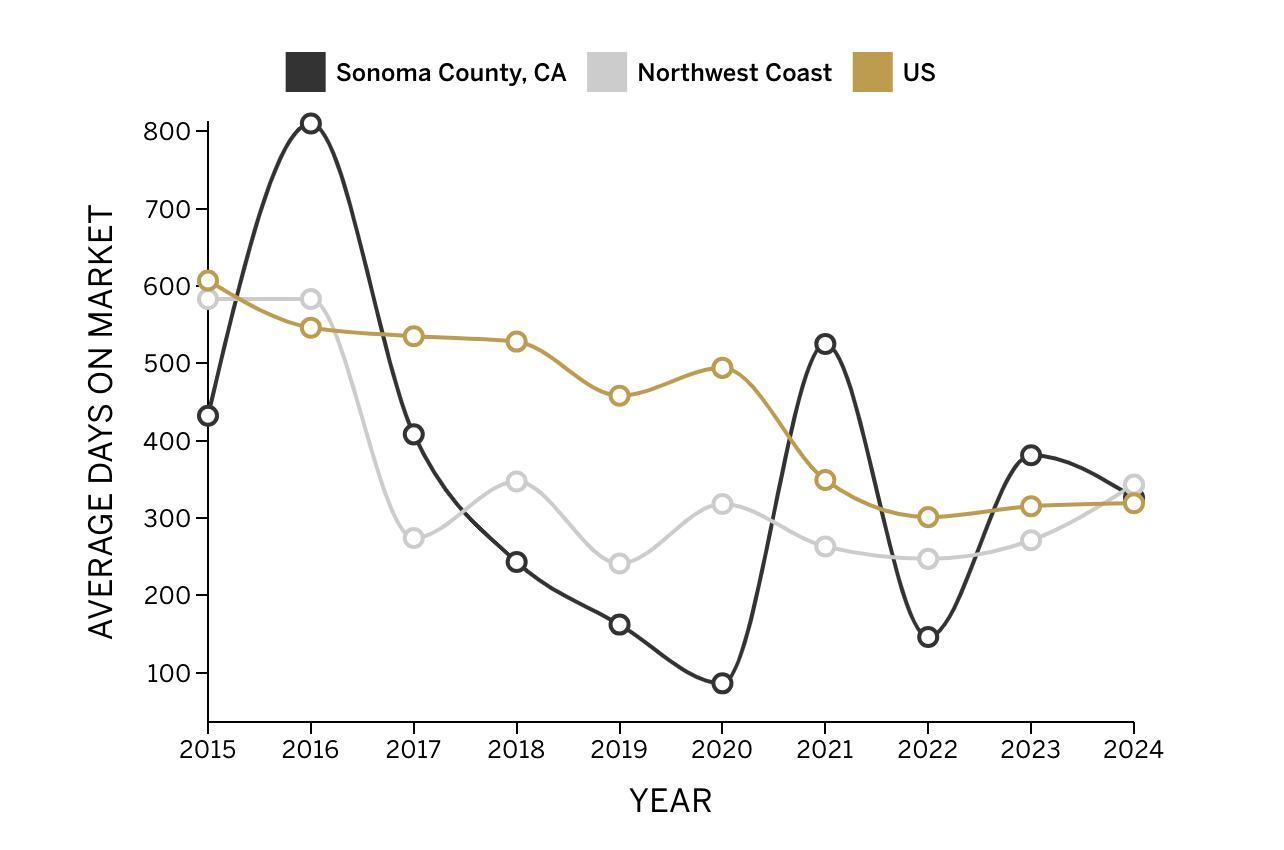
Sonoma
Just an hour’s drive north of the hustle and bustle of the San Francisco Bay Area, Sonoma real estate patterns are completely unlike San Francisco or other satellite markets like Palo Alto. Average sales prices in Sonoma are down to $8.1M in 2024, a 29% decline since its peak year of 2023.
2024 average sales prices are down to $8.1M, the lowest of all Northwest Coast markets
There is no clear pattern of price movement, either positive or negative, over the last years
Sellers take 327 days to sell on average
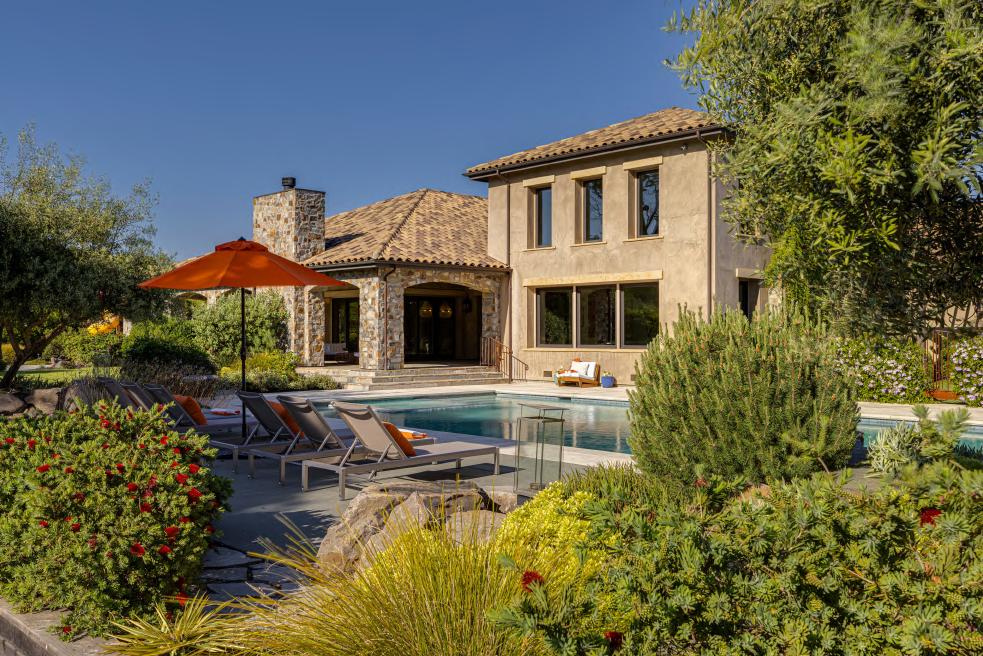
Sonoma luxury real estate may cause headaches for sellers
Sellers in Sonoma, on average, hold their property for 327 days between the initial listing and the sales date and fetch only 84.5% of their initial listing price.
Those that sold faster (under 180 Days On Market) could expect to achieve a bit better economic return of 90% of their initial listing price. Sonoma sellers should conclude that it pays to sell earlier whenever possible.
Broadway, Sonoma, CA
Sales prices over time
Sonoma, CA Northwest Coast US
General market trends
Days On Market (DOM) over time
Average Days On Market

Sonoma, CA Northwest Coast US year
Sales & list price dynamics
Sonoma County, CA vs other markets

Sonoma, CA Northwest Coast Us
and low DOM

Sonoma, CA > 180 DOM < 180 DOM
Seattle
The past two years have shown stronger sale prices in Seattle, reaching over $14M and $17M, respectively, albeit slightly below the regional average of $18M in 2024. However, selling in Seattle in 2024 required patience, with an average of 348 Days On Market (DOM). *This number was adjusted by removing an extreme 9-year outlier to reflect a more accurate picture. Despite the lengthy sales process, top sale prices remain consistent, with properties fetching about 83.5% of list prices in 2024.
Prices are on a 3-year growth trajectory from $8M in 2022 to $17M in 2024
Seattle is the slowest market in the region with 348 DOM on average*
The 83.5% of original list price achieved in 2024 was the lowest it has been in 10 years

Days are long
Even without accounting for the outlier property that took nine years to sell, Seattle's sales timeline exceeds that of the Northwest Coast region. Seattle's top sales are impressive, outperforming the overall U.S. market. However, the Northwest Coast has many strong markets and Seattle falls slightly short of the regional average of $18M.
Sellers who secure faster sales have a clear advantage, with properties selling within 180 days achieving nearly 10% higher sales-to-list price ratios. Specifically, compared to their slower-selling counterparts, which only achieve 79.5%.
West Highland Drive, Seattle, WA
Sales prices over time Seattle, WA Northwest Coast US
General market trends

Days On Market Seattle, WA vs other markets Seattle, WA Northwest Coast Us
On Market (DOM) over time Seattle, WA Northwest Coast US

Sales & list price dynamics


Lake Tahoe
Lake Tahoe remains a highly sought-after luxury market, but a tumultuous one. 2024 saw a recovery after the extraordinary 2021 spike where the average top sale equaled $35M. After bottoming out at $12M in 2023, the average sales price in 2024 has rebounded to a healthy $20M. The years after 2021 were not only marked by lower average sale prices, but also higher Days On Market (DOM). The top 10 properties in 2023 were on the market for 677 days, on average. *This is skewed by one outlier that took almost 10 years to sell. Even without this outlier, the rest of the market took 490 days to sell, on average. In 2024, this was reduced to 388 DOM.
recovery in average sales price from 2023 to 2024
.4% sales to list price ratio in 2024, the lowest in the past 6 years

Back from a dip
With the decline in DOM comes an unexpected decline in the sales-to-list price ratio, but an increase in average sale price. Lake Tahoe properties fetch lower percentages of their list prices than the Northwest Coast region and the broader US market. On average, Lake Tahoe achieved only 81.6% and 79.4% of list price in 2023 and 2024 respectively. Compared to the US market average of approximately 87% during the same period. The massive price spike in 2021 likely contributed to sellers maintaining optimistic pricing expectations, even as the market had already begun its downward trend.
North Lake Blvd, North Lake Tahoe, CA
General market trends
Sales prices over time

Lake Tahoe, CA & NV Northwest Coast US
Days On Market (DOM) over time

Lake Tahoe, CA & NV Northwest Coast US
Average Days On Market
Sales & list price dynamics
Lake Tahoe, CA & NV vs other markets

Lake Tahoe, CA & NV Northwest Coast Us


Makena Road, Kihei, HI
Kona
Oahu
Kauai
Maui
Surfers’
Paradise Hawaii contains 4 luxury markets in our analysis, the 3 islands of Oahu, Kauai, and Maui, and the coastal town of KailuaKona on the main island.
The Hawaii markets have experienced major effects of the pandemic housing surge, where 2021 and 2022 have been massive years in terms of sales prices, whilst in the years after, the market has cooled down a bit. Compared to the US market, Hawaii had a higher average sales price in 2022, whilst in 2024, this was down to $15.8M when the US averaged $17.5M.
The luxury markets in Hawaii are also volatile in terms of Days On Market (DOM) and sales-to-list price ratios, experiencing many highs and lows. The last few years show a relatively slow market, on par with the US, where properties averaged nearly one year in 2024 at 336 days, compared to the rest of the country at 318 days. The sales-to-list price ratio is also only 82% in 2024, 5% lower than that of the rest of the US—and, Kauai, in particular, ranks the second lowest of all markets, at just 73.02%.
Kona

In 2024, Kona maintained its No. 1 spot with the highest average sales price in Hawaii. At nearly $20M, the market remains 25% above the state’s average. All Hawaii markets have seen strong growth in the last year, with Kona’s sales prices rising about 10% compared to 2023 and almost doubling the averages of 5 years ago.
Favorable seller conditions
Besides growing valuations, Kona holds more favorable conditions for sellers looking to transact on the market. On average, Kona sees luxury properties move significantly faster than even a few years ago—2024 shows a record low of 197 days average Days On Market (DOM), on a steady decline over the past few years. Along with faster sales cycles, the divergence between list prices and realized prices has steadily increased upwards of 15% over the past 2-3 years, from a low of just 1.5% in 2022.
Kailua Kona, HI
Sales prices over time
HI HAWAII US
General market trends
Days On Market (DOM) over time

HI HAWAII US
Average Days On Market

Sales & list price dynamics
KONA, HI vs other markets

KONA, HI HAWAII Us

KONA,
KONA,
Oahu

The top sales in Oahu in 2023 had a staggering 934 average Days On Market (DOM), nearly double that of just two years prior. Although in 2024, Oahu (along with other Hawaii markets) returned to a more normalised environment, top sales had a longer-than-average time on the market with 411 DOM, with only a couple selling in less than 180 days. For these, DOM averaged only 56 days, whereas for the majority, DOM jumped to an average of over 500 days. Despite this, Oahu is achieving slightly above-average sales prices compared to list prices with only a 12% differential compared to a Hawaii state-wide average of 18%. For the properties that sold in less than 180 days, this delta was less than 3%.
Oahu is normalizing again
In recent years, Oahu has experienced more frequent market lock-ups. For example, in 2018, before COVID, the market saw 981 Days On Market (DOM), which is over 2.5 years! In 2024, the market returned to its trend lines. However, we may see higher DOM again in the future compared to the rest of the region.
The average sales prices over the last 3 years have been surprisingly constant, while other Hawaii markets have picked up. With an average sales price in the region of $14.4M in 2024, the top properties in Oahu are no longer comparable to markets like Kona, where average prices are around $20M. Despite not being a big growth market, Oahu is stable: prices see somewhat fewer fluctuations, and listing prices tend to be realistic. Compared to other Hawaii luxury markets, Oahu is the steady horse in the stable.
Farrington Highway, Waialua, HI
Sales prices over time
Oahu, HI HAWAII US
General market trends

Average Days On Market
Days On Market (DOM) over time

Oahu, HI HAWAII US
Oahu, HI vs other markets
Oahu, HI HAWAII Us
Sales & list price dynamics


Kauai
The Westernmost luxury market in the United States is recovering from a weak year in 2023. Where 2023 saw average sales prices at just $7.2M, 2024 clocks in an improvement: top properties sold at an average of a little over $11M, which represents a reversion to the average of the last years, but isn’t quite as high as valuations were in 2020, 2021 or 2022.
Kauai prices are back up from a slow year in 2023, but remain the lowest of all Hawaii markets
Sellers still struggle with a high 361 DOM
As a result, listing and realized prices are far apart at 73%, on average, the second lowest of all 56 markets in 2024

Kauai is recovering from a dip in 2023
All Hawaii luxury markets saw sales tempo and valuations cool down in 2023 and recover in 2024. Kauai has seen stronger swings than other Hawaii markets, with a bigger drawdown compared to 2021 peaks, alongside a quicker recovery in 2024. Whilst Kauai has a history of long sales cycles, 2024 transactions closed in just under 12 months. Days On Market (DOM). Compared to the US average, all Hawaii markets sell relatively slowly—the state’s average is on par with the US average, at 336 and 318 days, comparatively.
Aliomanu Road, Kauai, HI
Sales prices over time
HI HAWAII US
General market trends

Average Days On Market
Days On Market (DOM) over time

Kauai, HI HAWAII US
Kauai, HI vs other markets
Kauai, HI HAWAII Us
Sales & list price dynamics


Kauai,
Maui
The leading market of Maui has seen a great year in 2024, where top properties sold for 26% more than in 2023. The average Days On Market (DOM) for the top sales in Maui was steady, at 301 in 2023 and 339 in 2024. Although sale prices have increased YOY, the market has seen a drop in sales price compared to the list price, which decreased by 12%, from nearly 92% in 2023 to only 80% in 2024, the lowest in seven years, since 2017.
For top sales that took longer than 180 days, DOM jumped to 545 days, with list prices 31% higher than sales prices in 2024
Maui comes in No. 2 as the highest-priced market in Hawaii in 2024
Properties
are listed nearly 20% higher than sales prices in 2024

A market slowdown
The sales price averages follow a very similar trend to the region. The entire Hawaii region saw a 15% increase in sales price from 2023 to 2024. Yet, Maui, in general, is ahead of the trend, where average sales were 4% higher than the regional average in 2023 and 14% higher in 2024. The region appears slow, as Hawaii saw an average DOM of 519 in 2023 and 336 in 2024. For the 66% of properties that took longer than 180 days to sell, this jumped to 545 days, selling for just 69% of list price. This is high compared to the US market, which sat at 315 DOM in 2023 and 319 DOM in 2024.
Lae Place, Maui, HI
Sales prices over time
HI HAWAII US
General market trends

Average Days On Market Maui, HI vs other markets Maui, HI HAWAII Us
Days On Market (DOM) over time

HI HAWAII US
Sales & list price dynamics


Maui,
Maui,
Aspen
Phoenix
Chicago
Denver
Las Vegas
Park City
Sun Valley
Telluride
Vail

Country Club Drive, Mountain Village, CO
The Central markets of the US combine our mountain markets and the big inland cities in the east and north of the US.
This makes the central region a more varied bucket, with the five luxury mountain towns, Las Vegas, Phoenix, Denver, and Chicago. Where Chicago and Denver show a sober and straight valuation trend, Phoenix and Las Vegas prices are rising.
The Mountain towns are also not as homogenous as one would expect. Where Aspen and Park City sale prices peaked in 2023 and dipped last year, Vail and Telluride show the reverse pattern. Combined, all of these markets show a steady and upward trend in sales prices. While 2024 was less exciting and showed a slight dip, the market velocity has steadily increased making these markets an interesting investment for luxury properties.
Aspen
The leading market of our Central region has dipped after a steady 5-year climb in sales prices. Starting at an average sales price of $17M in 2018, prices have grown by a staggering 294% to the peak in 2023 of $50M average. This top luxury market did dip again in 2024 but still averaged $39M in the top 10 sales, ranking it the third highest market of all 56 analyzed. With numbers this big also comes more volatility over the years. The average Days On Market (DOM) was typically over 400, even surpassing 700 in 2020 and 2022. In the last two years, properties started to sell faster at 434 and 266 days, in 2023 and 2024.
Aspen average sale price soared 294% in 6 years from a $17M in 2018 to a $50M peak in 2023, before settling at $39M in 2024, ranking the market the third highest of all 56
II DOM improved dramatically from 700+ days to just 266 in 2024
III
Achieved 100%+ of list price in both 2021 and 2023 before dropping nearly 10% in 2024

Flying high
Aspen stands out in our Central region due to high sales prices and efficient DOM. Aspen’s sale-to-list price also shows some noteworthy dynamics. In two years, many luxury properties in Aspen sold for more than their list prices, making the average sale to list price 100% in 2021 and 101% in 2023. This is unprecedented in the luxury market. Buyers often pay considerably less than the original list price of the property. Because of these irregularly high sales-to-list prices, we don't see a stark difference between the sale prices based on properties’ time on the market. Although, in 2024, as the market began to stabilize, the difference in the sales-to-list price ratio based on DOM began to widen, dropping nearly 10% on average. Properties sold within 180 days were 8% closer to their list price compared to those that took longer to sell.
Stage Road, Aspen, CO
Sales prices over time
ASPEN, CO CENTRAL US
General market trends

Average Days On Market
Days On Market (DOM) over time

Sales & list price dynamics
ASPEN, CO vs other markets

ASPEN, CO CENTRAL Us
Average % of List Price
ASPEN, CO CENTRAL US
High and low DOM

ASPEN, CO > 180 DOM < 180 DOM
Phoenix
The Phoenix market has returned to the pre-2023 pricing levels with a record-high average sales price of $17M. This corresponds to a relatively low average Days On Market (DOM) of only 191 in 2023 and 196 in 2024, which dropped dramatically by 80% from 2020 to 2022 and has remained steadily low since. These more recent levels indicate a departure from the 600+ DOM trend that preceded the pandemic. Looking further at the sale-to-list prices, Phoenix proves to be a very efficient market; sellers are pricing their properties more realistically post-pandemic causing DOM to decline while the sale-to-list percentage increases.
Sales price increased by 21% in 2024, an all-time high, post-pandemic
II Properties are selling fast, taking only 191 and 196 to sell in 2023 and 2024
III Phoenix market is super efficient, with list and sales prices almost equaling each other on average at 101% the highest of all 56 markets in 2024

Phoenix is thriving
The desert metropolis stands out with very efficient pricing dynamics. Phoenix achieved an impressive sales-to-list price of 101% in 2024 and 97% in 2023—a striking departure from previous years. This pricing precision reflects sellers' growing market awareness and buyers' willingness to pay premium prices for desert luxury. Even within the competitive Central cluster, Phoenix establishes itself as a model of market efficiency with realistic pricing and desirable properties; a desirable combination for sellers looking to maximize returns.
Sales prices over time Phoenix, AZ
General market trends


Sales & list price dynamics
AZ vs other markets Phoenix, AZ


Chicago
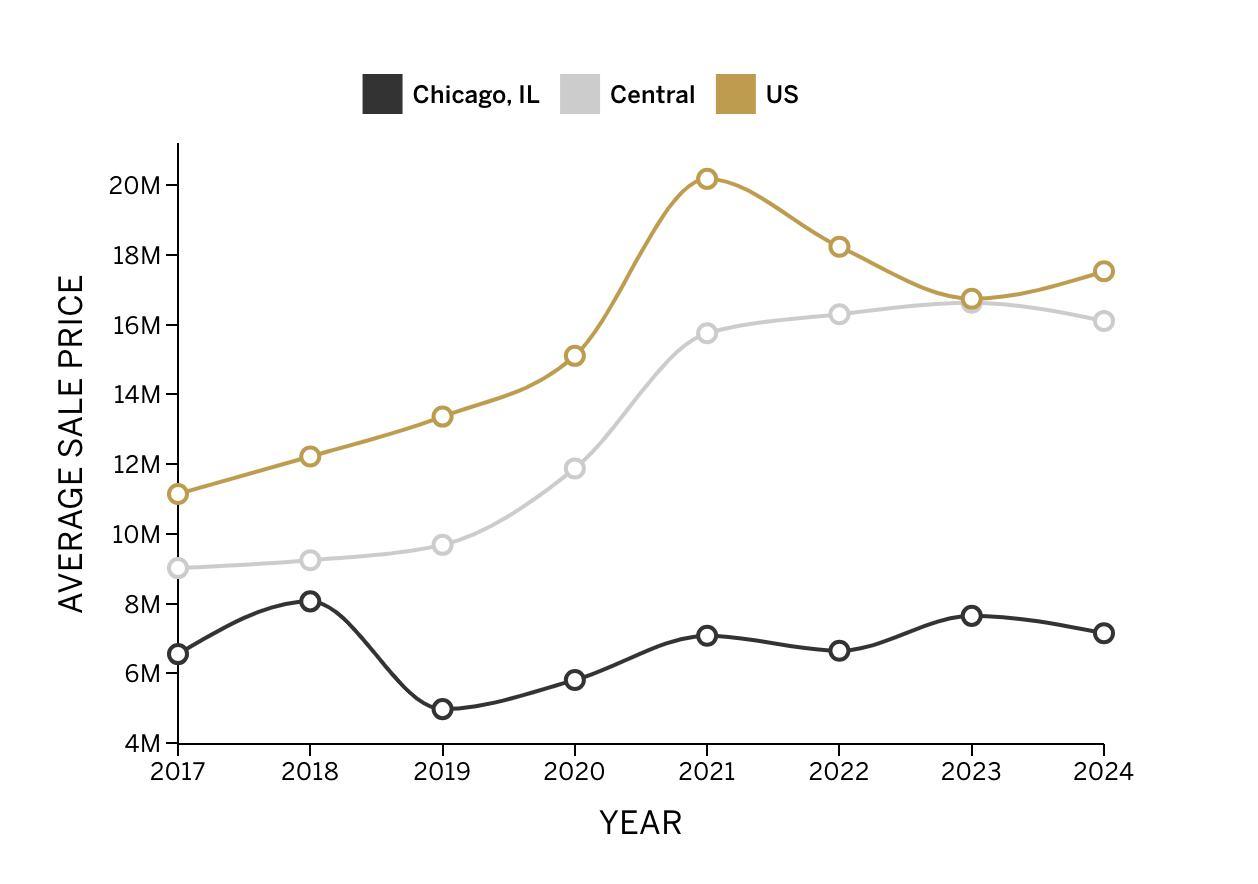
In 2024, Chicago's market showed consistency with some notable shifts compared to previous years. The average sales price was $7.2M, roughly half the regional average of $16M, but above the market’s 10-year average of $6.7M. Chicago proved to be a stable market over the past 8 years, despite a slight decline of 7% in the average sales price in 2024.
Average sale prices have remained steady from 2021 to 2024
Homes selling within 180 days achieve 98% of the list price, while those taking longer to sell achieve only 85%
DOM more than doubled to 323 days compared to 2023, signaling a market slowdown

A big discount for slow selling
A significant trend in 2024 is the impact of time on the market. Properties that remained on the market for more than 180 days had an average list price of $8M, but sold for closer to $6.6M, reflecting a notable difference of nearly 15%. In contrast, properties that sold within 180 days achieved 98% of their listing price on average, a clear advantage for quicker sales.
This is worth noting for sellers in Chicago, as 2024 showed an increase of 64% in average Days On Market (DOM), from 167 days in 2023 to 323 days in 2024—nearing a full year on the market. This market slowdown suggests a more challenging market environment ahead, sellers facing extended sales cycles.
West Van Buren Avenue, Chicago, IL
Sales prices over time Chicago, IL
General market trends
On Market (DOM) over time Chicago, IL CENTRAL US

Sales & list price dynamics


Denver
Denver has maintained remarkable stability over the past four years, with average sales price consistently ranging between $6M and $7M in contrast to the rest of the country. Denver is an efficient market where properties sell quickly compared to similar markets in our Central region and across the US. The average top Denver property in 2024 sold in 108 days, up from an exceptionally short 57 days in 2023. Accurate seller and agent predictions reflect this market’s efficiency. On average, sellers sold for 99% and 97% of their list price in 2023 and 2024, respectively.
Steady sale prices with between $6M and $7M in the past two years I II
Fastest selling years in Denver with 57 and 108 Days On Market (DOM)
Market efficiency (97%) far outpaces both the Central region (76%) and the US average (81%)

Denver properties sell like hotcakes
The Mile High City's market demonstrates impressive pricing practices with minimal discrepancies between list and sales prices—just a 3% differential between sales and list prices in 2024 and 5% in 2023, ranking the market the second highest of all 56 in price-to-list achievement. This outshines the Central region and broader US market, where properties sold for 7% and 9% less than list prices in 2023 and 2024, respectively. Denver maintains this efficiency and affordability compared to peer luxury markets in the Central cluster. The combination of realistic pricing, quick sales cycles, and strong value retention positions Denver as one of the most balanced luxury markets in the country.
Denver, CO
Sales prices over time Denver, CO
General market trends

On Market (DOM) over time

Sales & list price dynamics
CO vs other markets Denver, CO


Las Vegas
II
Las Vegas has experienced a remarkable price rise over the past five years. Starting from $7M in 2019, the market climbed steadily to a record sales price average of $15M in 2023, before sliding to $14M in 2024. The 2023 ‘boom’ year delivered peak pricing and exceptional sales velocity, with properties changing hands in under 100 days on average. Last year, the market normalized with Days On Market (DOM) returning to more typical levels above 200.
Record-breaking $15M average sales price in 2023
Five-year price growth of 103% from 2019 to 2023 peak
III Market correction in 2024 brought a healthier equilibrium

Wrong Bets in 2022
2022 proved challenging for Las Vegas sellers who consistently overvalued their properties, achieving only 61% of the list price on average. This pricing disconnect somewhat corrected in 2023, with the ratio normalizing to 92%, before settling at 83% in 2024. The current market demonstrates typical luxury dynamics where timing significantly impacts price. Properties selling within 180 days sell at a 12% premium in sales-to-list price ratio compared to those lingering longer on the market. The sales-to-list price ratio seems to have stabilized following the unusual dip in 2022. The DOM of 281 days now more closely aligns with the US average of 319 days, suggesting a market that has found its equilibrium after the volatility of recent years.
Las Vegas Area, NV
Sales prices over time
Las Vegas, NV CENTRAL US
General market trends

On Market (DOM) over time Las Vegas, NV CENTRAL US

Sales & list price dynamics
Las Vegas, NV vs other markets

Las Vegas, NV CENTRAL Us

Park City
Utah's legendary ski town, Park City, experienced a dip last year, with the top luxury properties selling at an average price of $14M compared to $18.5M the year prior. This was the first average price drop since a 5-year-long rise, starting in 2018. Utah’s average sales price now scores below our Central region and US markets. In terms of Days On Market (DOM), Park City has done well in the past 3 years, with properties averaging only 200 and 211 DOM in 2023 and 2024. By comparison, in 2021, DOM was a staggering 764 days.
First
price drop in 5 years, averaging $14M for top luxury properties in 2024
Sales to list price ratio declined to 89% in 2024, 10% down from previous years

Past the peak
The sales-to-list price ratio in Park City shows that sellers had to adjust their expectations from previous years. In 2024, the average property sold at only 89% of the list price. Even though properties sold for a higher percentage of their list price than the US average, 2024 was a regression compared to previous years. In 2022 and 2023, properties sold for 97% and 98% of their list price, on average. This decline indicates that Park City's market has cooled down from a few years of heightened popularity. This market cooldown is accompanied by trends like lower realized prices caused by slow-selling properties that take more than 180 days to sell. Park City saw a 12% difference in realized price between those slower-selling properties and properties that sold within 180 days.
Hollyhock Street, Park City, UT
General market trends


Sales & list price dynamics


Sun Valley
In the middle of Idaho, the cities of Sun Valley and Ketchum have slowed down from a 4-year sales price climb in the top luxury segment. The average sales price in 2024 is down to $12.3M from a $12.8M-high in 2023. 2023 was a spectacular year for the market's top properties, as properties sold within 80 Days On Market (DOM). In 2024, DOM rose to 150, which is still significantly faster than in all years prior, and the national average for top sales.
First price drop in 5 years, averaging $12.3M for top 10 luxury properties in 2024
Market velocity remains strong with average of 150 DOM in 2024 III
Sales to list price ratio increased to 94% in 2024, up from 90% the previous two years

Smoothing out
The smoothing out of the Sun Valley sales prices coincides with a similar trend in our Central region, where prices peaked at $12.8M in 2023 and dropped slightly to $12.3M in 2024. Sellers in Sun Valley and Ketchum are very realistic about the value of their properties as indicated by the lower-than-average DOM for top sales. In 2024, properties sold for 94% of their list price, on average. That’s 3% more than in the similar Central markets and 7% more than in the US. The Sun Valley market itself is becoming more stable than before, where we saw some major outliers in 2022, with properties selling after years at only 60%-75% of the list price. In 2024, the difference between slow-selling properties (>180 DOM) and faster selling (<180 DOM) was just 5%.
Goodman Lake Creek Residence, Sun Valley, ID
General market trends


Sales & list price dynamics


Telluride
The tiny mountain town of Telluride is on the rise again. The average sales price increased from $13M in 2023 to $15M in 2024. Like many other markets throughout the US, 2021 was a record year in Telluride, but if you ignore this outlier, the market grew steadily over the past 7 years. The market moves at an average pace, with top properties averaging 304 Days On Market (DOM) in 2024. This is slightly under the national and regional averages for this year.
Average sales price climbed from $13M in 2023 to $15M in 2024
Market shows steady growth over seven years when excluding 2021's record spike
III Properties selling within 180 days achieve 95% of the list price versus just 75% for slower sales

On the rise again
The years 2022 and 2023 looked less promising for the market, as sales prices seemed to plateau at $13M and DOM even rose to an average of 631 in 2023, an anomaly. Last year broke this trend, however; showing a promising and robust market. This wasn't always the case. Prepandemic years were much slower for Telluride and sales prices were much lower as a result—only $5M-$8M sales averages before 2021, half of what they are now.
With the market increasing again, we've noticed a trend in Telluride that persists amongst many other markets: properties that sell within 180 days sell at a much higher percentage of the initial list price than the slower-selling properties. In 2024, this was 95% versus 75%, a 20% difference. In 2023, it was a 30% difference.
Polecat Lane, Telluride, CO
General market trends
Sales prices over time
Telluride, CO CENTRAL US

Average Days On Market
Days On Market (DOM) over time
Telluride, CO CENTRAL US

Sales & list price dynamics
Telluride, CO vs other markets

Telluride, CO CENTRAL Us
High and low DOM
Telluride, CO > 180 DOM < 180 DOM

Average % of List Price
Vail
The popular ski location, Vail, is coming off a major dip in sales prices of the top luxury properties over the past three years. In 2021, the average top sales price was over $21M, which dipped to $13M in 2023, a low not seen since 2017 in the ultra-luxury space. In 2024, Vail did bounce back with a sales average of over $18M. This number is still lower than the $20M and $21M highs of 2020 and 2021, but above pre-pandemic levels. The dip in sales prices coincided with a longer time to sell, with Days On Market (DOM) rising to 322 in 2023 and 411 in 2024.
Average sales price rebounded from $13M in 2023 to $18M in 2024, but were still below 2020-2021 peaks
Market velocity slowed significantly with DOM increasing from 322 to 411 days
Sales-to-list price ratio differed by 11% in 2023

Vail has bounced back
Whilst sales prices in 2023 dipped far below our Central region and US averages, Vail is now back on top. Market velocity is higher than US and Central averages, making it uncertain to predict the coming years. This uncertainty can also be seen in the sales-to-list price ratios, which dipped in 2024. At 89% of the list price, the sales in Vail are still similar to that of the region, but it is 4% lower than in 2023. This is also reflected when looking at the individual sales, where 2024 only witnessed one singular property of the market’s top 10 that sold at 100% or more of the list price, whilst in 2023, there were 4 of 10.
Edwards, Vail Valley, CO
General market trends

On Market (DOM) over time

Sales & list price dynamics


Southern States

Atlanta
Nashville
Dallas
Houston
Atlanta, GA
The Southern states track the luxury four markets of Atlanta, Nashville, and the two major Texan cities of Houston and Dallas.
These markets are not particularly in the same area but show similar trends and price ranges. While other regions show more volatile sales prices, the Southern States have exhibited a consistent upward trend over the past 10 years, indicating steady growth in popularity for these cities.
2024 was a record year for average top sale prices in the Southern region. We see a similar trend across the US markets, where 2021 was a particularly high year, after which we see a dip. Down south, this dip is less deep and we see a more positive trend with the data from last year. The upward prices coincide with a trend seen throughout the US, where faster-selling properties sell at a much higher percentage of their list price.
Atlanta
III
The Atlanta market has stabilized over the past two years, and prices have returned to pre-pandemic levels. Coming from a $10M average sales price, Atlanta bounced back to $9M and $10M in the past two years. In the same period, Days On Market (DOM) have also stabilized to an average of 233 and 222 in 2023 and 2024.
Average prices back to pre-pandemic levels at $10M
Sellers are still aspirational, asking 10% higher than the market
24% variance in sale-to-list price ratio for fast and slow-selling properties

Atlanta is cruising
Atlanta is very close to the average of our Southern region, with average sales prices being similar in 2023 and just $1M lower in 2024. We see a similar trend with DOM of around 200 days.
A common trend we see throughout the markets is found in Atlanta, as well; there is a marked variance in the final sales compared to original list price between fast-selling properties (within 180 DOM) and slow-selling properties (over 180 DOM). In 2024, faster-selling properties sold for 24% more of their asking price, compared to slower-selling properties.
Harris Trail NW, Atlanta, GA
General market trends


Sales & list price dynamics


Nashville
The city of music has been humming along steadily in the past years. After its 2021 high, it dipped slightly. In 2024, the average top sales price returned to $10.2M rebounding from a $7.6M dip in 2023. The same steady fare has been seen in the Days On Market (DOM), which have been very steady over the past four years, migrating from a record low 203 days in 2021 to 238 days, 240 days in 2022 and 2023, and back to 203 days in 2024.
Average sales rebounded to $10M in 2024 after dipping under $8M in 2023
II DOM shows remarkable stability, returning to 203 days in 2024
III Sellers consistently achieve 90% of the list price, outperforming both the US and Southern states

Nashville is humming along
The steady DOM is also reflected in the realized prices that sellers have been getting in Nashville over the past four years. With a steady sales-to-list price ratio of around 90%, Nashville is out-competing the US and Southern states region in sales-to-list dynamics.
Even in this stable market, the pervasive trend of properties taking over 180 days to sell continues. Slow-selling properties went for only 84% of their original list prices in 2024, while faster-selling properties (within 180 DOM) sold at 94% of their list prices in 2024.
Nashville, TN
Nashville, TN Southern States US
General market trends

Nashville, TN Southern States US

Sales & list price dynamics
TN vs other markets Nashville, TN Southern States Us


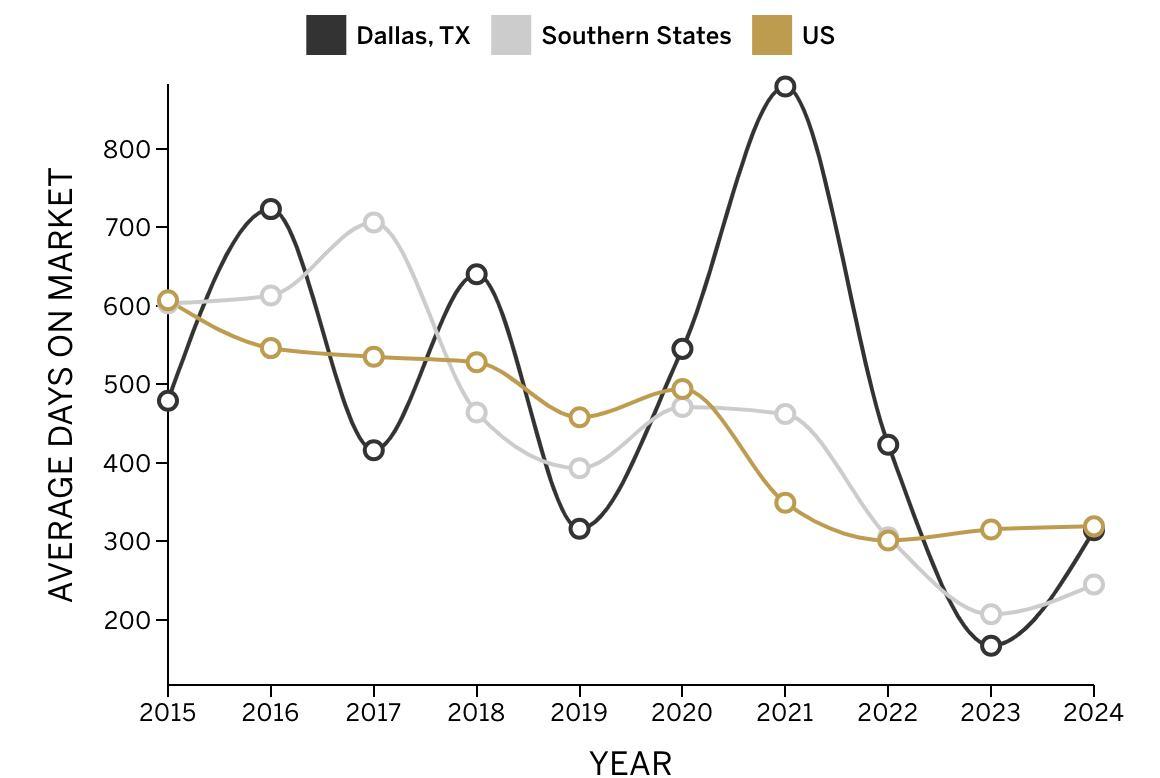
Dallas
III
Dallas has been on an upward trajectory for the last two years, outpacing the other Southern states in our region. With an average sales price of $12M in 2023 and $13.3M in 2024, Dallas is proceeding with its 5-year upward trend. With a slight up and down in 2021 and 2022, which we see more dramatically in many luxury markets throughout the US, the market looks hot. 2024 would have been a record year in Dallas, if it hadn’t been for the extraordinary year of 2018, where the top 10 sales included 10000 Hollow Way Road, a property sold for $39.2M at auction.
Average sales price climbed to $13.3M in 2024, continuing a five-year upward trend
Market velocity fluctuated dramatically from record 167 DOM in 2023 to 341 DOM in 2024
Sellers achieving impressive 93% of list price in 2024, up from historical 80% average

The market's Texas hot
Rising prices in Dallas is resulting in a more volatile market. The average Days On Market (DOM) for the top 10 luxury properties in 2024 is 341 days, putting Dallas slightly above the US average. In 2023, Dallas sold properties at record speeds of only 167 DOM and in the years before that, the average DOM was reaching multiple years.
The average DOM in Dallas coincides with the sales-to-list price ratio movement. We saw a high ratio in the past two years with sales prices coming in at 92% and 93% of the asking price. Years prior to 2022 clocked in average sale prices of only 80% of asking prices. This shows that lingering on the market is undesirable for sellers, as this typically results in a sale that is a lower percentage of their list price, on average.
Fort Worth, Dallas Area, TX
Dallas, tx Southern States US
General market trends

Dallas, tx Southern States US
Sales & list price dynamics
Dallas, tx vs other markets
Dallas, tx Southern States Us


Houston
III
Houston moved up within the Southern States region for the past three years with an average sales price of $12.2M in 2024. This is in contrast with years prior when Houston was a less expensive market than Atlanta, Dallas, and Nashville. 2023 did witness a slight dip in sales prices to $10M on average but also saw the fastest selling average with only 187 Days On Market (DOM). DOM grew again in 2024 to 241, which is still well below the US average.
Average sales price reached $12.2M in 2024, an all-time high
Market velocity is impressive at 241 DOM, well below the US average
Sale-to-list price ratio improved dramatically from 74% in 2022 to 86% in 2024

No problems in Houston
In previous years, we saw a downward trend in average DOM in Houston except for an increase in 2022. This is partly the result of an expensive property that took almost three years to sell and sold at only 71% of its initial list price. Selling at a discount was not a unique situation in 2022, when the average property sold only for 74% of the list price.
Sellers have adjusted accordingly in recent years, where they sold at 91% and 86% of list price in 2023 and 2024. There remains a clear discrepancy in return for faster-selling properties (under 180 DOM) and slower-selling ones (over 180 DOM), where the latter sells for a lower percentage of its asking price.
Houston Area, TX
Sales prices over time
Houston, TX Southern States US
General market trends

Houston, TX Southern States US

Sales & list price dynamics
Houston, TX vs other markets

Houston, TX Southern States Us

Florida

Boca Raton
Broward County
Duval &
St Johns County
Miami
Naples
Palm Beach
Sarasota
Tampa
Vero Beach
Casa Bella Fortuna, Fort Lauderdale, FL
No matter where you are in the Sunshine State, luxury living is never far away.
The sunny environment of Florida has drawn wealth for decades and is unlikely to change anytime soon. In 2024, the average sales price for luxury real estate transactions stood at $21.3M, reflecting a 30% rise over the previous year. After volatility driven by 2022 macroeconomic contractions, Florida looks sunny once more.
Of note, in 2024, properties took an average of 331 days to sell, a considerable increase from the quicker pace observed in 2022 when properties sold in an average of just 211 days. While significant differences are observed between various markets, this potentially indicates a tilt in the scales between buyer;s and seller’s leverage in negotiations.
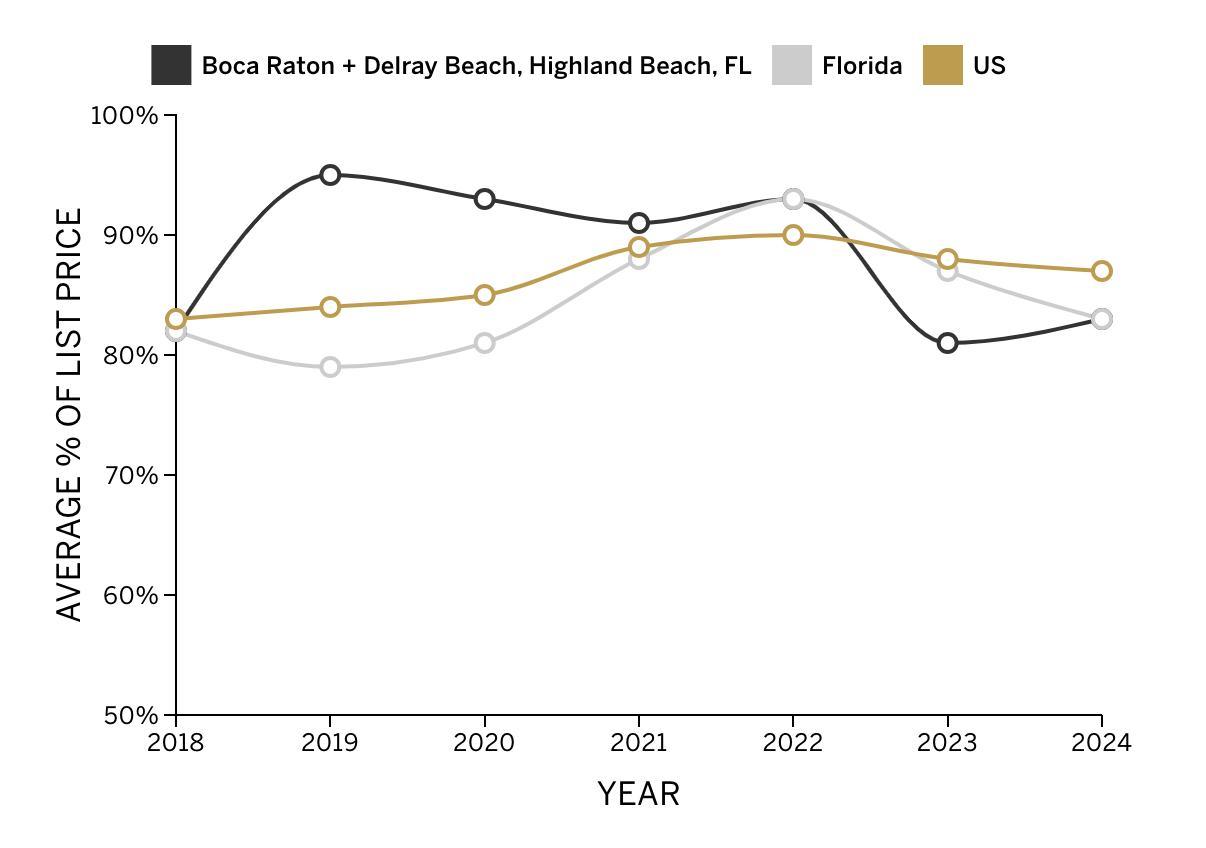
Boca Raton
Boca Raton and surrounding areas like Delray Beach are on a strong long-term upward trend that outperforms Florida and US averages. Although 2021 represents an outlier year with three sales over $75M each, 2024 is very much ontrend; average sales prices are up to $31M and represent a 33% increase over 2023.
In a growing market, pricing well can be complicated

A sunny market, in the middle of the action
The east coast of Florida has some of the most dynamic luxury markets in the United States. Boca Raton and Delray Beach are no exception. Coinciding with strong upward price momentum, the average property moves significantly faster than it did pre-pandemic. The average Days On Market (DOM) were 312 days in 2024. However, with dynamic price action comes challenges in establishing a realistic listing price. On average, ultra luxury properties are sold at just 83% of the initial listing price. For sellers who took over 180 days to sell this number dropped to just 77%. Sellers should be advised to research to define a realistic listing price to capture enough buyer interest.
Twin Lake Drive, Boca Raton, FL
Sales prices over time
Boca Raton, FL Florida US
General market trends

Average Days On Market
Days On Market (DOM) over time

Sales & list price dynamics
Boca Raton, FL vs other markets
Boca Raton, FL Florida Us
Boca Raton, FL Florida US
and low DOM

Boca Raton, FL > 180 DOM < 180 DOM
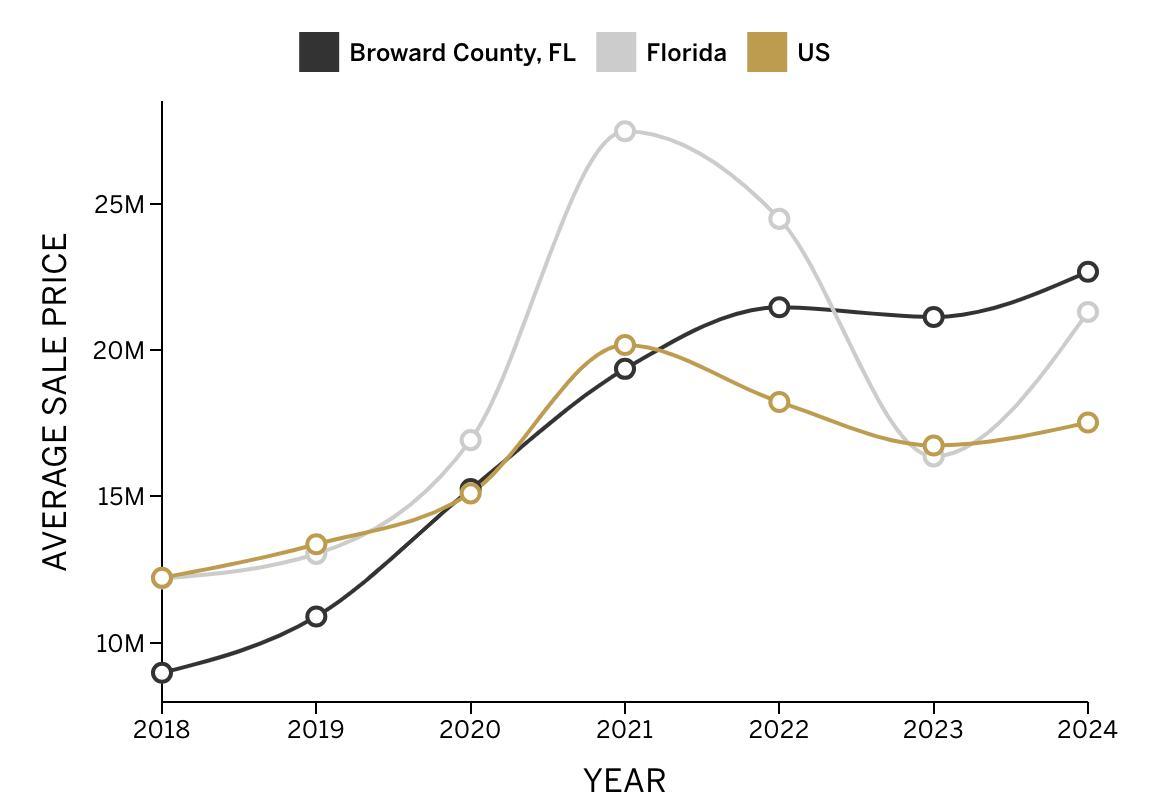
Broward County
Broward County is continuing on a path of strong performance, keeping up the positive trend it started since COVID hit the country. Whilst the top properties were sold for an average of just under $9M in 2018 (~25% below Florida averages), in 2024 that same average stands at $22.7M (~13% above Florida averages). Broward County continues to benefit from strong growth.
Average sales prices have risen 2.5 times since 2018
onger lists (over 180 DOM) sell 32% below listing price

Broward prices keep rising, but list prices are inflated
Whilst Days On Market (DOM) averages remained relatively stable for the last five years (~380 days), Broward County continues to see slower sales cycles than both US and Florida averages. Somewhat worryingly, we saw listing prices grow even faster. As a result, many owners end up selling at a significant discount compared to their listing price.
While Florida averages a 17% discount of sales price compared to listing price, Broward sees an average 29% discount. Properties listed for more than 180 days sold for 32% discount to listing price. Such numbers are indicative of a somewhat overheated and inflated market. For sellers, to close deals quickly is of utmost importance to secure a more favorable outcome.
Broward County, FL
prices over time Broward County, FL Florida US
General market trends

Broward County, FL Florida US
Sales & list price dynamics
Broward County, FL vs other markets

Broward County, FL Florida Us

Duval & St Johns County
The wider Jacksonville area reports a slower year in 2024 for the first time since we started reporting on the market in 2018. Average sales prices are down to $9.1M from an $11.5M peak in 2023, but it is too early to tell if this is a trend reversal or a small correction. Along with shrinking prices, the market also locked up: properties took four times as long to sell than a year earlier, edging much closer to prepandemic levels.
Average sales prices are down for the first time in seven years
DOM have increased from 69 days in 2023 to 297 in 2024
Sellers who take over 180 days to sell recorda 15% discount compared to the original listing price

2024 is a tough year for sellers
2023 looked bright with a steep 35% YOY average sales price increase and ever-shrinking sales cycles (i.e. most properties were sold in under three months). However, 2024 saw a dangerous break from the trend. The worries show up in sales prices, but more so in the dynamics within the sales process itself. Previous years saw properties sell quickly and as a consequence at high percentages of sales price.
In 2024, luxury properties average 297 Days On Market (DOM). While sellers that can sell within 180 days fetch 98% of their original listing price, slower sellers settle at just 85%. There is a strong case to optimize for speed and certainty rather than get stuck with a stale property that doesn’t attract buyers.
Alhambra Drive, Jacksonville, FL
General market trends
Sales prices over time

& St Johns County, FL Florida US
Days On Market (DOM) over time

& St Johns County, FL Florida US
Sales & list price dynamics
& St Johns County, FL vs other markets

Duval
Duval
Duval
Duval
Miami
After a couple of years of post-pandemic strengthening, Miami sales prices are coming down from crazy highs; in 2022, three estates sold for close to $100M each. Both 2023 and 2024 saw the market return to prepandemic valuations. After drawn-out sales cycles in 2023, in the last year it seems Days On Market (DOM) also returned to near decade-long lows.
Average DOM were cut it half

Miami has cooled back down
The crazy days in the Miami luxury segment seem over for the moment. Along with a return to lower sales prices, DOM went down to 248 days—below Florida and US averages. As valuations come down, sales cycles have shortened and there remains a relatively small differential between sale prices and listing prices of just 14%. Miami is unique in that it has fluctuated back and forth the last four years. As sales climbed, so did DOM in 2021. Conversely, as top sales peaked in 2022, DOM plummeted. Now, sale prices have evened out while DOM were cut in half YOY.
Unlike the variation in sale prices and DOM, the percentage of list price achieved has remained much more constant since 2021, hovering in the high 80s, keeping on pace with the US and Florida.Sellers who stay on the market for more than 180 days often price too high, with the average property (under 180 DOM) selling at 82% of the listing price.
The Regalia Penthouse, Miami, FL
General market trends


Sales & list price dynamics


Naples
Naples is amongst the premier markets in Florida with average sales prices of $26.7M—only outdone by Palm Beach. Prices peaked locally in 2022, in line with a general surge in 2021 and 2022 in the rest of Florida. 2024 prices aren’t quite at the 2022 peak levels ($31.8M average sales price), but most of that difference is explained by a single $62M transaction in 2022 that inflated the average. Overall, Naples continues to see exceptional property value appreciation.
Average sales prices are up 90% since 2015
2024, DOM tripled to 360 days
Sales values average 17% discount to listing price

Naples, FL
The premier destination on Florida’s east coast
Ten years ago, Naples average sales prices were around $14M and roughly—on par with other Florida luxury markets. Since 2015, however, Naples has seen explosive growth. Prices are now 90% above 2015 levels and 33% above Florida averages. As a result, Naples has established itself as the premier luxury market on the Florida East Coast.
In the past 5 years, sales cycles consistently shortened and Naples properties were known for selling quickly. This trend has now reversed: 2024 sees average Days On Market (DOM) triple to 360 days, compared to 119 days in 2023. Along with longer sales cycles, sellers also have to accept somewhat higher discounts compared to their listing prices.
General market trends

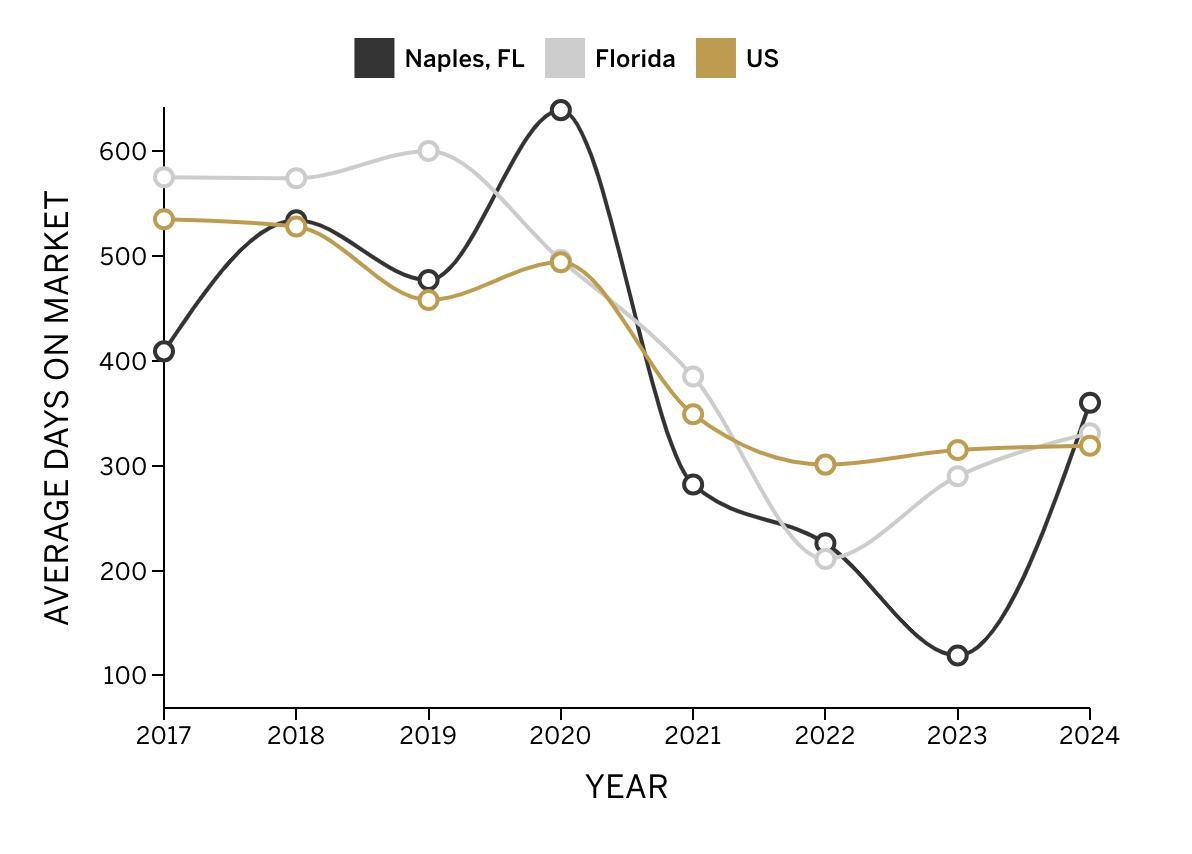
Sales & list price dynamics


Palm Beach
Palm Beach has always been one of the country’s quintessential luxury real estate markets. With average sales prices of top properties at $50.6M, Palm Beach doesn’t disappoint in 2024. Part of its growth is explained by a staggering $152M top transaction. Without this top transaction, the average sales price would have come in at ~$40M, still significantly higher than in 2023.
A $152M transaction is amongst the highest in the country I II Palm Beach properties averaged 472 DOM III Shorter lists sold at a higher percentage of listing price

A presidential place
Palm Beach is as dynamic as it has ever been. Noteworthy, however, is that all top 10 transactions of 2024 were completed before the November election, so one might only speculate what 2025 holds in stock.
Large transactions are not foreign to Palm Beach. 2021 saw two transactions top the $100M threshold, and the general trend certainly seems upward. Along with such high valuations comes a need for an even more select group of buyers and slower sales cycles as a result when they cannot be found. Properties sold in 2024 on average spent 472 Days On Market. Most properties sold in 2024 were already listed in 2022. For those looking to sell faster than that, it is important to realise that listing prices are typically somewhat inflated. The top transaction sold at a discount of $66M compared to its original listing price.
Unit 2B, South Palm Beach, FL
FL Florida US
General market trends


Beach, FL Florida US
Sales & list price dynamics


Sarasota
People didn’t always think of Sarasota as an ultra-luxury market. Only as recently as 2018, top properties were selling for an average of $6.1M. Today, that picture has changed: average sale prices climbed to $16M, representing a 160% increase in just six years. This is closing in on the $20M average for Florida luxury markets. All this makes Sarasota one of the most interesting Florida markets to track.
Average sales prices increase 160% in just six years
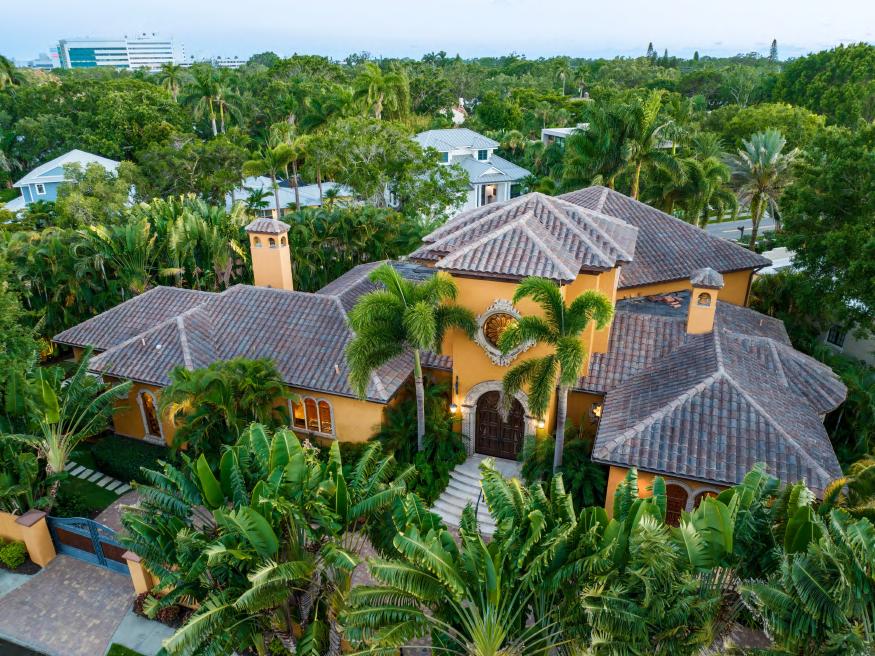
Sarasota shows no sign of slowing down
Compared to 2018, and unlike many other markets that peaked in 2021 and 2022, the increase in average sales prices has continued through 2024 and is not the only improvement that Sarasota has seen. Back then, the market was haunted by one of the longest sales cycles in the country, with properties averaging 1,108 Days On Market (DOM). This situation has meaningfully improved over the years, with a low of 217 days in 2022. Now, it is ticking up again.
In 2024, Sarasota properties took 411 days to sell, meaningfully longer than the 320 US average. Those who want to sell quicker should feel comforted knowing selling within 180 days can often capture sales values close to their listing price. Those that sell more slowly tend to sell at close to 17% discount to their initial listing price. It can pay to price realistically.
Lincoln Drive, Sarasota, FL
Sales prices over time
Sarasota, FL Florida US
General market trends

On Market (DOM) over time
Sarasota, FL Florida US

Sales & list price dynamics
Sarasota, FL vs other markets

Sarasota, FL Florida Us

Sarasota, FL > 180 DOM < 180
Tampa
Tampa represents one of the more modestly-priced luxury markets in Florida, yet many of the second-tier markets are slowly catching up to the frontier luxury markets. Where Tampa sales prices as recently as 2019 were averaging below $5M, they have nearly doubled at just south of $10M, marking a steady (but substantial) appreciation in just five years.
Up from $4.9M sales price in 2019 to $9.8M in 2024
Prices are slightly down from a 2021 peak
Tampa properties average 238 DOM

Prices have doubled, but are now on a plateau
Early pandemic years represented a boom for the Tampa region with prices ballooning from below $5M in 2019 to $12.6M. Two years later, that growth trend is now turning into a new steady state. Since 2021, average sale prices have flattened with each year seeing the top properties trade right around the $10M mark.
Tampa sellers who price their property realistically are typically able to sell within 180 days and capture sales values very close to the listing price. Those that sell more slowly, however, also tend to sell at lower prices. Properties that spend more than 180 Days On the Market (DOM) average a 16% discount to the listing price. As a result, in Tampa, there is a big difference in realized price and initial list price between those selling quickly and those selling more slowly.
Tampa, FL
General market trends


Sales & list price dynamics


Vero Beach
Vero Beach has benefited from a lot of the dynamics that made Florida real estate markets boom during the pandemic. Vero Beach sales prices were on a slow downtrend in 2015-2019, but saw a sharp uptick with prices more than doubling from $5.9M in 2019 to $12.9M in 2021. This pattern is similar to other Florida markets. Since 2021, however, Vero Beach is slipping downwards again, with average sales prices down every year compared to the previous year.
Average sales prices have been down every year since 2021
prices remain elevated compared to pre-COVID years
DOM is comparable to US average, but fast for Vero

Despite strong pandemic-era growth, Vero Beach remains a troubled market
Before 2020, the top properties of Vero Beach were troubled by extremely long sales cycles with a significant portion of them staying on the market for over 1,000 days. In the last few years, this has shrunk to a now comparable level to US and Florida averages (~300 days). This, however, somewhat masks a troubling trend: properties that don’t sell in the first 180 days tend to sell at a very significant 28% discount to their original listing price. While properties that sell in under 180 days sell only at an 8% discount to the listing price—enjoying both a smoother sale and more favorable economics. Coupled with declines in sale prices, it seems prudent for sellers to optimize for speedy transactions instead of sitting things out.
Vero Beach, FL
Vero Beach, FL Florida US
General market trends


Vero Beach, FL Florida US
Sales & list price dynamics
Vero Beach, FL vs other markets

Vero Beach, FL Florida Us

Greater East Coast

Fairfield County
Fairfax Greenwich Hamptons
Morristown + Essex
New York City
Westchester Philadelphia
Sheaff Lane, Near Philadelphia, PA
This region covers everything from Connecticut and the New York metro region in the North to Fairfax County south of Washington, D.C. on the southern end.
Markets in New England and Florida are covered separately. In terms of real estate values, this region is dominated by New York City, where 2024 registered two transactions over $100M and multiple above $50M.
While most other regions in the US saw an increase in average sales prices, the Greater East Coast region saw a slight drawdown. The regional average is down to $20.7M from $23.8M in 2023. A notable exception is New York City, with averages of nearly $76M. Smaller regional luxury markets see a contraction, although average sales cycles are faster than in the previous year.
Fairfield County
Outlier properties are skewing the data for Fairfield County over the past few years. A single $85M transaction in 2023 pushed the annual average of top sales from $14M to $21M that year. 2024, in contrast, is modest: sales prices sat at $11M, which is roughly within the long-run trend.
III
Average sales prices in 2024 are $10.8M, within long-term trend lines
After years of gridlock, properties in 2024 averaged 375 DOM

Fairfield market dynamics follow typical East Coast patterns
With an average sales price growth of 43% since we started tracking in 2017, Fairfield follows patterns seen across East Coast markets. 2022 saw a drawdown, along with wider economic unrest and uncertainty. In 2023, the upward trend continued and in 2024 prices cooled down again.
Time will tell if this represents a temporal adjustment or a more fundamental shift. With an average of 375 Days On Market (DOM), Fairfield is moving faster, but be warned: even in 2024, some properties took upwards of a staggering 1,000 days to sell, and at significant markdowns to initial listing prices. A property in Westport was finally sold last year after 1,368 days and for 20% less than the initial listing price.
North Cedar Road, Fairfield, CT
General market trends
Sales prices over time

Fairfield County, CT Greater East Coast US
Days On Market (DOM) over time

Fairfield County, CT Greater East Coast US
Average Days On Market
Sales & list price dynamics
Fairfield County, CT vs other markets

Fairfield County, CT Greater East Coast Us

Fairfax
After a downward trend in average sales prices since 2021, Fairfax put up great numbers in 2024. One top transaction of $25.5M in October drove much of this price increase. The transaction was almost double the size of the secondhighest sale. An average sales price of $11.2M in 2024 represents a 46% increase compared to the previous year and is more promising than the 2021 peak, which was mostly driven by a single $48M transaction that year.
Average sales prices are up 46% to $11.2M
Fairfax properties move fast, at just 220 average DOM
III Faster sales fetch a significantly higher percentage of their listing price

Fairfax is moving up again
Excluding the top transactions each year reveals a clearer upward price trend than the graphs below indicate. Along with this steady upward momentum, Fairfax properties are also increasingly selling at faster rates—2024 is the best year on record, with properties selling in just 220 days on average. This is 45% below the US average of 319 days.
Still, Fairfax sellers see a divergence between the outcomes of faster and slower sales. Those who manage to move their property within 180 days can expect to capture 95% of their listing price. Properties that take longer see an average of just 79% of their listing price realized in the final sale price. The highest transaction also sold at the lowest price-to-list at just 65% after over 900 DOM.
A cautionary tale!
Doyle Road, Near Fairfax, VA
General market trends

On Market (DOM) over time

Sales & list price dynamics


Greenwich
Beautiful Greenwich is home to a small set of some of the country’s most stunning waterfront properties. As a result, singular transactions can skew the data, as was the case in 2023, when the top property sold for $139M, with the runner-up at only $23M. Removing this outlier, 2023 would have seen an average sales price of just $14.2M. In 2024, we see a comparable average value at $14.7M.
In Greenwich, top-10 properties sell around $15M-20M, with singular outliers being the exception
At 805 DOM, the highest of all US markets analyzed, expect to be extremely patient or price accordingly
Top sales selling under 180 DOM average 100% of their listing price in final sales value

In Greenwich, speed is the crucial factor
Greenwich has a long history of slow sales cycles. Average Days On Market (DOM) was far above US averages in seven out of the last ten years, with 2024 being no exception. On average, it took an astounding 805 days to make a deal come together, making it the market with the highest DOM average of all 56 analyzed across the US. More remarkable and indicative, however, is the 4th graph below. Sellers who closed a deal in under 180 DOM closed their transaction at 100% of their listing value. Those properties which took longer were in for a rough ride—besides the harrowing prospect of extremely drawn-out sales cycles, they also ultimately sold 23% below their listing price. The magical factor in selling a property in Greenwich is to sell rapidly and have a chance to secure favorable terms on the transaction.
Clapboard Ridge Road, Greenwich, CT
General market trends


Sales & list price dynamics


Hamptons
With a $32M average sale price in 2024, the Hamptons once more confirms its standing as one of the quintessential ultra-luxury markets in the world, even though those prices are down significantly compared to 2023 and the peak year in 2021. While most markets peaked in those years, the Hamptons market climbed the highest showing 146% growth from 2019 to 2021, which set up a predictable fall-off.
The top transaction in 2024 was the $89M sale of “La Dune” at auction
sales prices are $32.4M, down significantly
compared to
2023

2024 is a slow year for a market known for $100M transactions
The single biggest transaction in 2024 was the sale of the iconic “La Dune” property, sold at auction by Concierge Auctions. The property had a deeply troubled past and complicated history with 657 Days On Market (DOM) before finally being sold.
Such patterns are not uncommon for the Hamptons. For example, the 2023 top sale was a $112.5M property, sold after 1,027 days and initially listed for $175M. In a market like the Hamptons, it can be hard to know what the true market value of luxury properties is. Generally, properties in 2024 fetched 81% of their initial listing price, significantly below the 88% average across the Greater East Coast and US.
Further Lane, East Hampton, NY
General market trends
Sales prices over time

Hamptons, ny Greater East Coast US
Days On Market (DOM) over time

Hamptons, ny Greater East Coast US
Average Days On Market
Sales & list price dynamics
Hamptons, ny vs other markets

Hamptons, ny Greater East Coast Us

Morristown + Essex
The markets in northern New Jersey see the most stable price action anywhere in the nation. In 2024, average sales prices were up 27% compared to the previous year to $5.8M. This builds upon a baseline with prices trading in the $4-5M range for most of the last 7 years. 2024 represents the first year where the market convincingly broke the $5M threshold and is one of only a few markets in our analysis in which the peak year in the last decade was 2024.
After years of sideways motion, 2024 was the strongest year for top sale prices
sales prices were $5.8M, up 27% compared to 2023
A worrying trend: average DOM is growing rapidly

Pay the price for record averages
With a 27% YOY increase in sales prices, this market is moving against the greater East Coast region trend, which generally saw a drawdown in prices in 2024. However, another place where northern New Jersey moves against the trend is in sales cycle lengths: since 2021, every year has seen properties move slower than the previous year, in what now represents a troublesome trend line.
On average, it took sellers in Morristown and Essex 493 days to sell their property after initially listing, compared to 319 days for the US average. Whilst those who sold within 180 days could expect to match or even top their listing price, those who sold slower averaged a 17% delta to initial listing prices. Combined with the rapidly lengthening sales cycles, it is prudent to maintain momentum as a seller.
Bergen County, NJ
General market trends
Sales prices over time

Morristown + Essex Greater East Coast US
Days On Market (DOM) over time

Morristown + Essex Greater East Coast US
Average Days On Market
Sales & list price dynamics
Morristown + Essex vs other markets

Morristown + Essex Greater East Coast Us

+ Essex
New York City
In 2024, New York City luxury prices kept rising against a general slowdown and contraction on the East Coast. Average sales prices shot up to $76M, with two transactions passing the $100M threshold in 2024. The lowest property in the top 10 sold at $46M, once again demonstrating the depth of the NYC luxury real estate market.
Average sales prices are up to $76M in 2024
Transactions in New York often happen outside of the public eye; data is scarce

Eye-watering prices
To compare New York City data against other luxury markets doesn’t do the city justice—the Big Apple is unique in so many ways. Reflected in the eye-watering prices is the fact that New York City is unique and will never go out of style. Another constant is the New York ambition, reflected in astronomical asking prices which are negotiated down aggressively.
New York, NY
General market trends
Sales prices over time

New York City, NY Greater East Coast US
Days On Market (DOM) over time
New York City, NY Greater East Coast US
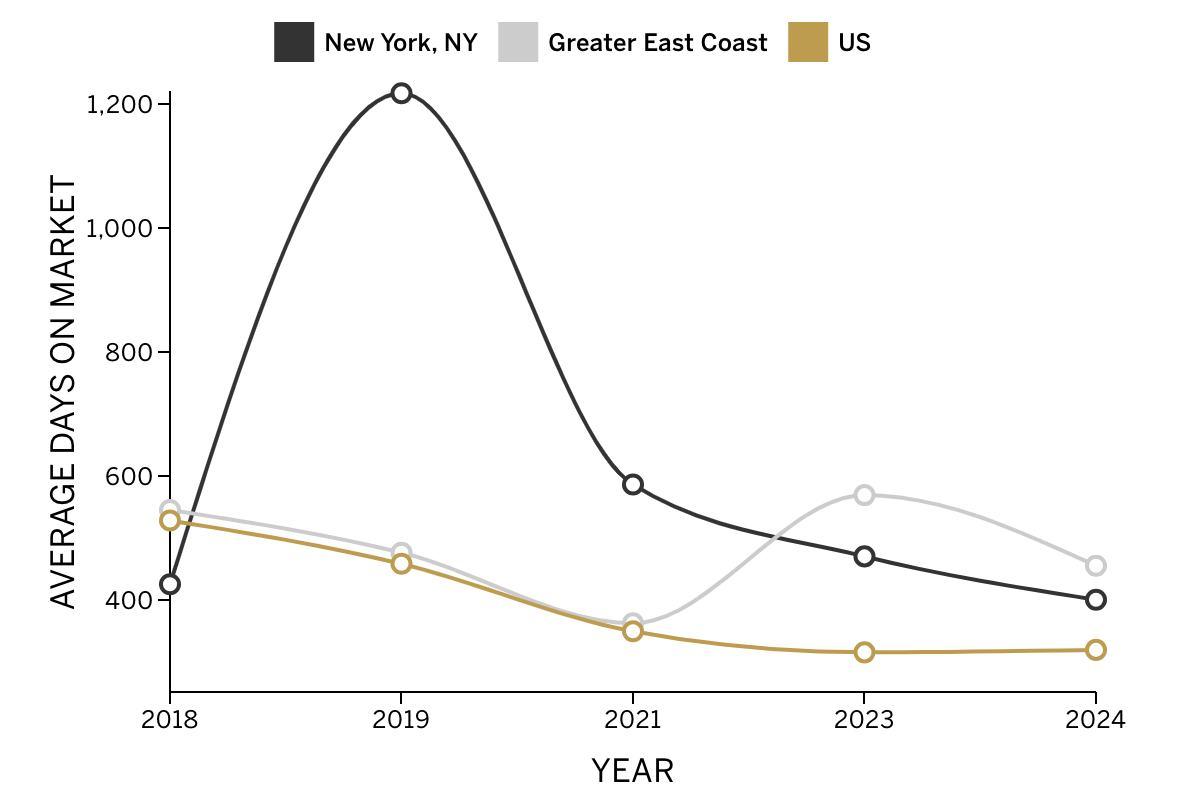
Sorry, for New York this data is not reliably available.
Sales & list price dynamics
New York City, NY vs other markets

New York City, NY Greater East Coast Us
Sorry, for New York this data is not reliably available.

Sorry, for New York this data is not reliably available.
Westchester
With average sales prices at $10.4M in 2024, Westchester seems able to continue a slow 5-year climb out of the lowest years of 2019 and 2020. Along with a handful of other markets in its region, it demonstrates reluctant growth in valuations, but at a rate below the US average. Over the last 8 years, Westchester saw both 2018 and 2022 register higher than average valuations. Whereas US averages see a 55% growth over this period, Westchester moved sideways.
Sales prices are $10.4M on average, up from 2023, but below 2022 and 2018 peaks
At 577 DOM, sellers should brace for very long sales cycles or price accordingly
Selling quickly is far better than selling slowly

In Westchester, selling quickly is the path to riches
Although average transaction values are lower than the regional and national average for ultra luxury markets, it is noteworthy that Westchester sees an enormous divergence between those properties that sell quickly—under 180 Days On Market (DOM)—and those that take longer. Westchester has historically recorded a high average DOM, and 2024 is no exception at 577, almost double the average across all US luxury markets.
Sales that took over 180 days generally settled at 85% of their listing value. Notably, quicker sales were able to secure 108% of their original listing price, meaning final transactions were are at an 8% premium to the listing price. This was 3% in 2023. Such values are unusual in luxury real estate. In Westchester, it pays to optimize for selling quickly.
Westchester Area, NY
General market trends
Sales prices over time

Westchester, NY Greater East Coast US
Average Days On Market
Days On Market (DOM) over time

Westchester, NY Greater East Coast US year
Sales & list price dynamics
Westchester, NY vs other markets

Westchester, NY Greater East Coast Us

Philadelphia
Compared to other luxury markets on the East Coast, Philadelphia is stable and predictable. Relative to virtually any other market we track, average sales prices fluctuated little over the last 8 years of record-keeping, despite macroeconomic considerations like inflation. Days On Market (DOM) significantly increased in 2023, but came back down in 2024. Compared to most markets, the differential between listing prices and realized sales prices is also small, at just 8%.
The average sales price in 2024 is $4.2M, down 35% from 2023, the peak year in the last decade

Little price action, but also little growth
Even though 2024 saw averages shrink by 35% compared to 2023, this does not necessarily predict a downward trend as 2023 top sales were an anomaly within the context of the past decade. The average sales prices are within the usual $4-5M range observed over many of the past years in Philadelphia.
The worrying element here is that unlike in US averages, we don’t observe a clear upward trend. Across all US markets, sales prices are up 55% over the last 8 years. In Philadelphia, however, prices are roughly where they were when we began tracking. An average DOM of 348 days is also not particularly noteworthy. Philadelphia sellers can lock in a high 92% of their list price as a final sale value, with houses under 180 DOM getting an exceedingly high 96% of the original listing price. Waiting for longer doesn’t seem to translate to better economic outcomes.
Near Philadelphia, PA
General market trends
Sales prices over time

Philadelphia, PA Greater East Coast US
On Market (DOM) over time

Philadelphia, PA Greater East Coast US
Sales & list price dynamics
Philadelphia, PA vs other markets
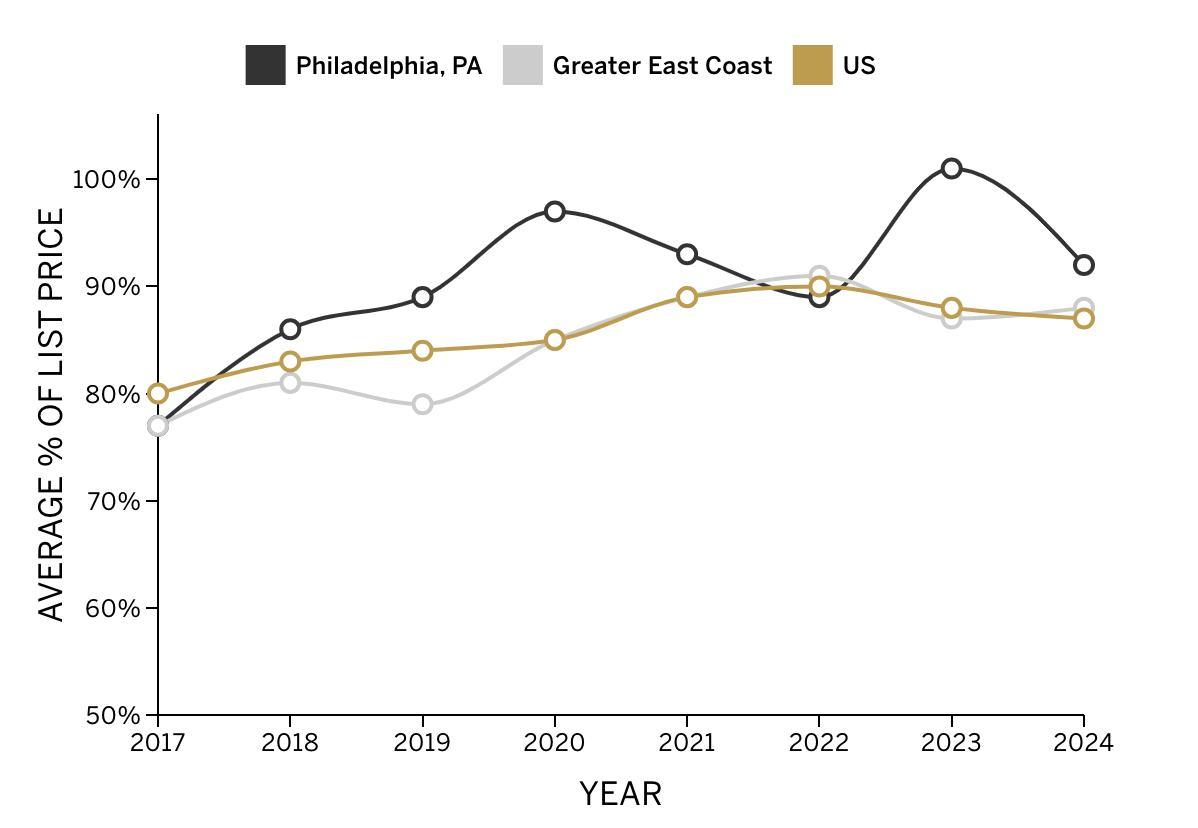
Philadelphia, PA Greater East Coast Us

New England

Boston
Cape Cod
Martha’s Vineyard
Nantucket
New Hampshire
Rhode Island
Vermont
Nantucket, MA
Our New England region houses the 7 luxury markets in the northeastern part of the United States.
It consists of the coastal areas of Massachusetts, including Boston, and the surrounding states of Vermont, Rhode Island, and New Hampshire. The New England region is one of the lower- priced luxury markets in our home index and although some markets experience volatility, they're mostly steady compared to our others.
The stable prices we see in the New England markets also offer more efficiency in listing prices. The region has outperformed the whole US luxury market in terms of sale price as a percentage of list price, indicating that New England sellers price their properties realistically to what the market has to offer.
Boston
Boston's luxury real estate market has seen a notable shift in 2024, with average sales prices dipping to $11M from $16M in 2023. Despite this decline, the market remains remarkably efficient with properties selling at 92% of their list price, on average. Boston demonstrates impressive performance with an average Days On Market (DOM) of just 68 days in 2024, if we take out one outlier sale that took over 2 years to sell. Without that outlier, all markets sold within 180 days.
Sales price dipped in 2024, from $15M average to $11M
Boston sells super quickly, with an average of 68 DOM, compared to the US average of 320 days
III It remains a very efficient market, with an average of 92% sales of list price versus a US average of 87%

Northern efficiency
Boston stands as one of the premier markets in the New England region. It follows regional trends with a price decline in 2024 compared to 2023. This contrasts with nationwide price increases over those 2 years. While the broader New England region has experienced a longer downward trajectory, Boston's dip appears more recent, limited primarily to 2024.
The market demonstrates clear efficiency, with the relationship between DOM and final sales price particularly pronounced, slightly more than the region, and significantly more than country statistics. Properties spending less time on the market consistently achieve closer to their asking price. With an average DOM significantly below many comparable luxury markets, Boston continues to show resilience despite the recent price adjustment, maintaining its position as a top performer in its region.
Boston Area, MA
Boston, MA New England US
General market trends
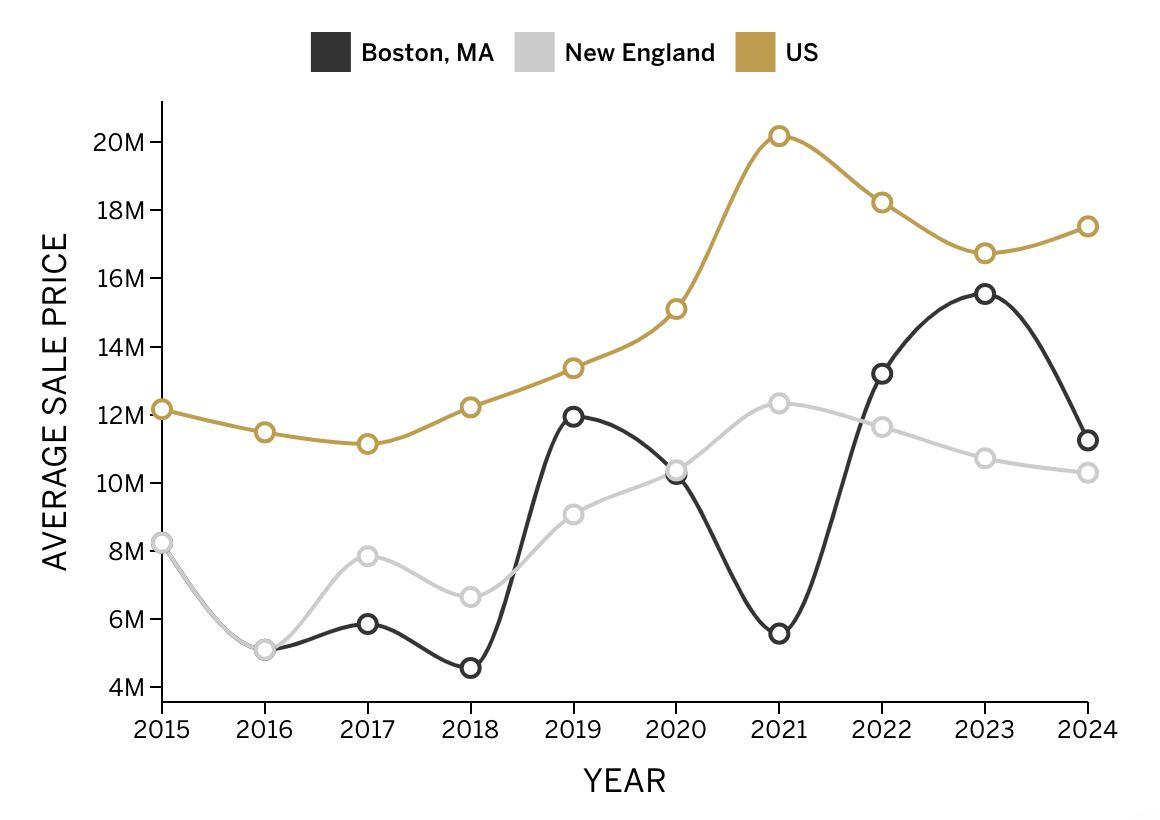

Boston, MA New England US
Sales & list price dynamics
Boston, MA vs other markets

Boston, MA New England Us

Cape Cod
Cape Cod is one of the more stable markets in our list, with an average sales price of around $10-12M for the past 7 years and only a slight bump post-pandemic unlike many markets which skyrocketed. The same goes for Days On Market (DOM), which went from 223 in 2023 to 261 in 2024. The past 4 years have been similar in terms of DOM, which is just below average for the region and US markets.
Stable $10-12M average sales prices over seven years
DOM slightly up to 261 in 2024, below the regional average
Quick sales achieve a 12% higher sale-to-list price ratio

Steady as she goes
Sellers have been pricing the top properties accurately on the coastal town of Cape Cod in the past years with an impressive 97% sales-to-list price in 2023, up from 88% in 2022. Compared to the market to the rest of the region, this is an outlier, and even though 2024 was less extreme with an 84% sales-to-list price ratio, Cape Cod still outperforms the region and US market. It's clear that the longer properties are on the market, the less realized price they attain, compared to the faster-selling properties. In 2024, there was a 12% differential in the sale-to-list price between properties that sold under 180 days and over 180 days; this was a staggering 28% in 2023.
Salt Works Way, Cape Cod Area, MA
Sales prices over time Cape Cod, MA New England US
General market trends

On Market (DOM) over time

Cod, MA New England US
Sales & list price dynamics
Cape Cod, MA vs other markets Cape Cod, MA New England Us


Martha’s Vineyard
III
Martha's Vineyard prices fluctuate slightly more than in other markets, and the trend isn't going upward. The past two years have seen an average sales price of $13M in 2023 and $9M in 2024. The same trend is happening in reverse when it comes to Days On Market (DOM), where the high sales average years coincide with a low DOM, and the low prices with high DOM. The market saw a sharp incline in the past two years, with 191 DOM in 2023 and 511 DOM in 2024.
Prices dipped from $13M in 2023to $9M in 2024
DOM inversely correlates with prices, rising from 191 to 511 days YOY
The market maintains a high sale to list price ratio of 92%, despite fluctuations

Slow, but diligently
While sales prices and DOM fluctuated, sellers tend to price their properties right. The percentage of sale-to-list price ratio is more stable and relatively high compared to the region and US market. With 93% in 2023 and 92% in 2024, these are the most efficient years Martha's Vineyard has ever seen.
Let's compare this to the region where the sale-to-list price ratio was 77% in 2023 and 76% in 2024. Even though the market seems steady overall, when we look at the differences between fast selling (within 180 days) and selling slowly, there is a notable gap in the percentage of the list price sellers achieve for their properties. The percentage of sale-to-list price between those segments differs by 12% and 10% between 2023 and 2024, respectively.
Gunning Point Avenue, Martha’s Vineyard Area, MA
Sales prices over time
General market trends
Days On Market (DOM) over time
Martha’s Vineyard, MA New England US


Martha’s Vineyard, MA New England US
Average Days On Market
Sales & list price dynamics
Martha’s Vineyard, MA vs other markets

Martha’s Vineyard, MA New England Us
Martha’s Vineyard, MA > 180 DOM < 180 DOM

Nantucket
III
Nantucket has declined somewhat from a steep upward trend before 2022, in which the average sales price of the top 10 luxury properties was a staggering $23M. In the past two years, the average only equals $15M and $18M in 2023 and 2024, respectively. This breaks with the timing of these properties. The average Days On Market (DOM) has seen two very low years since the decline in average price. Last year the DOM was 368 days, which is an increase of 154 days from 2023.
Average sales declined from a $23M peak to $15-18M in 2023-2024
DOM catapulted from 214 days to 368 days last year
Quick sales fetched 95% of list price versus 76-85% for longer listings

High times are over
As one of the more high-end markets of our New England region, Nantucket has been trailing the US market quite narrowly. In the past two years, the average sales of the US and Nantucket only varied by $1M. Our New England region is much more affordable, at a $11M and $10M average over the past two years. Despite these variations in sales prices, Nantucket and the New England region are relatively efficient.
The sales as a percentage of the list price have been around 89% for both, over the past two years. Meanwhile, we found a big discrepancy between the properties that sold quickly (within 180 days) and properties that took longer to sell. Faster-selling properties sold, on average, at 95% of the list price. Properties moving in over 180 days, sold for as low as 76% of the original list price in 2023, and 85% in 2024.
Nantucket, MA
Sales prices over time
Nantucket, MA New England US
General market trends

Average Days On Market
Days On Market (DOM) over time

Sales & list price dynamics
Nantucket, MA vs other markets

Nantucket, MA New England Us
Average % of List Price
Nantucket, MA New England US
High and low DOM

Nantucket, MA > 180 DOM < 180 DOM
New Hampshire
One of the more affordable markets in our luxury index, New Hampshire, has seen some growth in sales prices and improved market efficiency. As average top luxury prices sold under $6M before 2022, the years following showed an average of $9M in sales price, albeit slightly declining yearover-year. The same goes for Days On Market (DOM), which saw multi-year sales on average in the past, the last two years have only seen 121 and 210 days in 2023 and 2024.
Average luxury prices rose to $9M after years below $6M
II
DOM improved dramatically from multi-year sales to four to seven months
III Sellers achieve realistic pricing with 91-95% sales-to-list ratio

Very well priced
Compared to the New England region and the US market, New Hampshire sellers are very realistic about their properties. With 95% and 91% sales-to-list price in the past two years, sellers are more than 10% closer than the US average. Luckily for the top sellers in New Hampshire, there have been only three sales that took longer than 180 days in the past two years. Those three sales combined sold at 90% of the list price, slightly lower than the fast-selling properties on the market, which is unique to New Hampshire.
Wilmot, NH
General market trends


Sales & list price dynamics


Rhode Island
Rhode Island has been declining since its massive price hike in 2021. The average prices of the top luxury sales almost show a perfect bell curve around this high and saw an average of $7M and $8M in 2023 and 2024. Although the prices appear steady, the Days On Market (DOM) fluctuate like a sinus wave. While in 2023 properties sold in only 152 days on average, last year more than doubled to 354 days.
Prices stabilized at $7-8M after the 2021 peak, following the bell curve pattern
DOM fluctuates dramatically, more than doubling from 152 to 354 days
III The gap between fast and slow-selling properties narrowed to just 2% in 2024

Steadying out
Most of the fluctuation in the Rhode Island top luxury market has calmed in the past years and sales versus list price dynamics follow suit. At 88% and 90% sales-to-list price, the Rhode Island market has a similar ‘buyer-seller’ dynamic as the rest of the New England region.
The difference between the faster-selling segment (within 180 DOM) and slower selling has always been 10% in the list versus sale price. There is a clear trend that the longer a property is on the market, the lower the percentage of its list price it sells for. This variance narrowed in 2024, where the difference was only 2%.
Brutaliste sur Mer, Little Compton, RI
General market trends


Sales & list price dynamics


Vermont
Vermont, the most affordable market in our New England luxury region, prices have fallen since its 2021 high. Coming from a $8M average in 2021, it has sunk to $6M in 2022 and averaged $5.5 and $5.9M in the past two years. Though in those years, the market has sped up, averaging 199 and 146 Days On Market (DOM) in 2023 and 2024 respectively. This is twice as fast as the rest of the US market on average.
Average sales price stabilized at $6M in 2024, well below 2021's $8M peak
Market velocity is exceptional at 146 DOM in 2024, twice as fast as US average
Vermont sellers are achieving 90%+ of list price, with fast selling properties commanding an 18% premium

Unusual trends
Vermont sellers are more realistic about the market prices than the rest of the US luxury markets. With sales to list price ratios above 90% for most properties, it's a relatively stable market.
A clear trend we see in most markets is apparent in Vermont over the last 2 years. The properties that sell slower than 180 DOM receive a much lower percentage of their list price than the faster selling properties. In 2024, the difference between the fast selling and slow selling properties was 18% of list price; this was 7% in 2023.
Winhall, VT
General market trends


Sales & list price dynamics

