
Overview
I am a visual editor with ±4 years of experience and skilled in motion graphics, graphic designs, and video editing. My editing skill specializes in producing explainer videos, and data visualization (graph and map animation). I have experience working with local and international teams in research institution, NGO, and news media.
Work Experiences
Motion Graphic Designer & Video Editor / Cointelegraph USA / February 2022 - present

Produced in-depth explainer videos related to cryptocurrency, decentralized finance, NFT, and the regulations related to it
Multimedia Specialist / ERIA / July 2021 - February 2022
Transformed economic reports created by international economists and researchers into explainer videos, data visualizations, and infographics
Motion Graphic Designer & Video Editor / Narasi TV / January 2021 - February 2022
Worked within an investigation team (Buka Mata) to edit videos and visualize data from investigative journalists’s findings
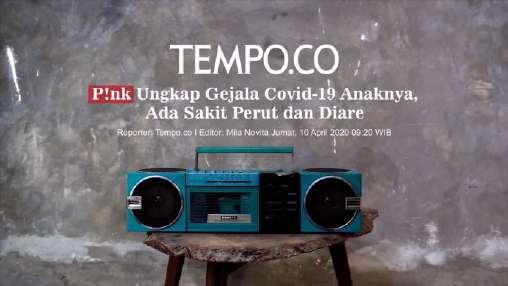
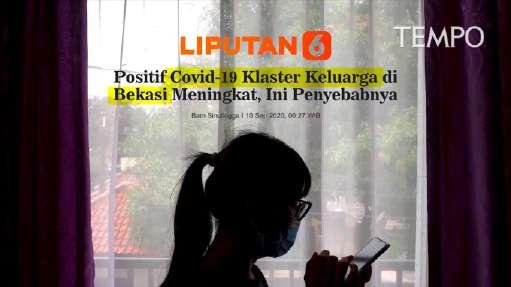
Motion Graphic Designer & Video Editor Intern / Tempo/ July 2020 - November 2020
Worked within an investigation team to cover deep news stories, such as BPJS frauds in hospitals, COVID-19 airborne transmission in Jakarta offices, etc
Multimedia Producer Intern / The Conversation Indonesia/ January 2020 - March 2020
Transformed text-based content from scientific papers into compelling visual content, such as Instagram carousel post, data animation, and illustrative motion graphics
Motion Graphics Designer Intern / Remotivi/ June 2019 - September 2019
Created engaging data animation for in-depth explainer videos that highlight media and press issues in Indonesia
Award
2022 The Best Video Creator in Annyeong Chingu Storytelling Competition
2021 The Best Video Creator in International Asean CSEAS Video Competition
2021 The Best Video Creator in National Core Id Video Competition
2021 Second Best Video Creator in Global Media Competition
2020 The Best Video Creator in National EGSA Fair Ugm 2020
2020 Judge's Choice Award in Global Media Competition 2020
Education
2017-2022 University of Indonesia Majored in Communication Study with Journalism concentration. Grade Point Average (GPA) is 3,65 out of 4,00
Project 1: Southeast Asia Marine Plastic Debris
Type of project: motion graphics
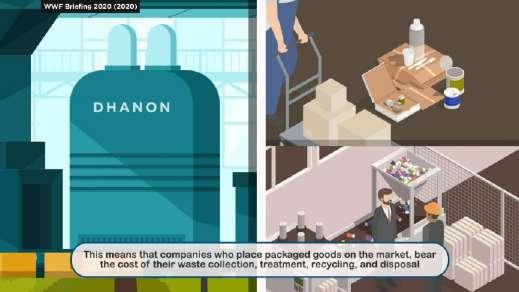

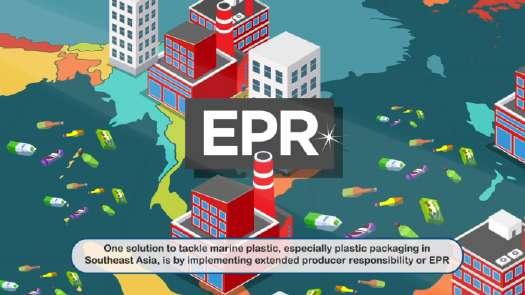
Description: this project depicts the marine plastic debris issue in Southeast Asia. Our team transformed various datasets and scientific findings into dynamic charts and compelling illustration to uncover the fact that Southeast Asia is the largest contributor of plastic debris in the world's ocean. We also highlighted the EPR (Extended producer responsibility) scheme and visualized it in an understandable way as the solution for this issue.
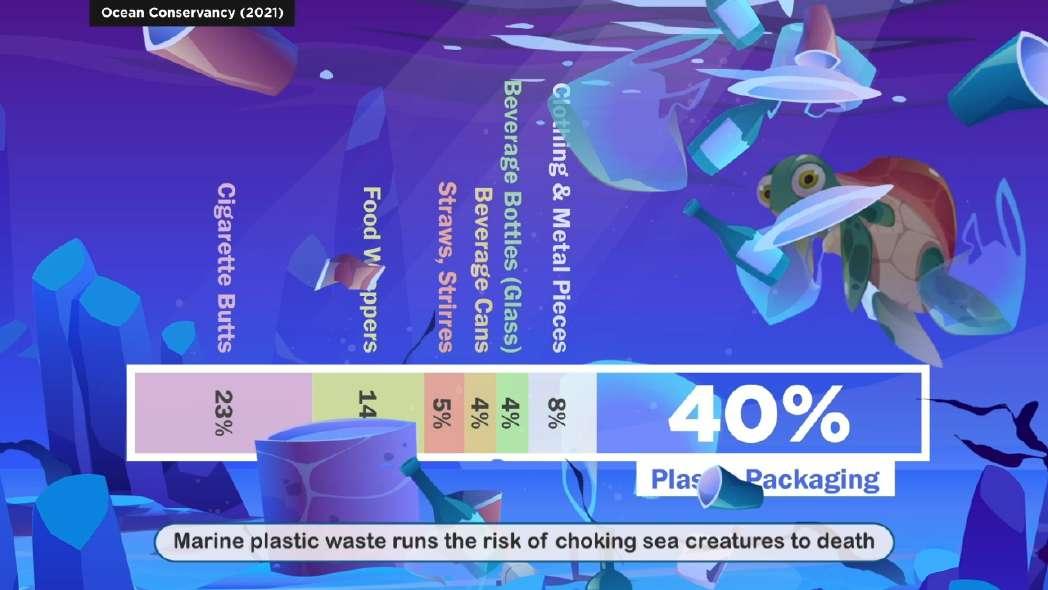
Objective: to raise awareness about the severity of plastic waste in Southeast Asia ocean and introduce EPR as the solution to regular people
1
Click here to watch the video
A glimpse of behind the scene
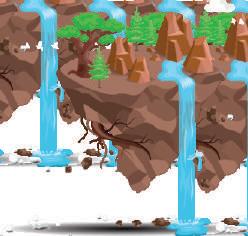
As a motion graphics designer, it is crucial to use dynamic movement in the first scene to catch the audience’s attention. Hence, the scene opens with crane camera movement in the sky toward a flying island with waterfall--which the next scene symbolizes as the source of marine plastic waste. To set up the scene, it requires foreground (cave, plant, and flower), middleground (flying island with waterfall), and background (plain blue sky). By doing so, the audience can be hooked and continue watching the entire video.


Setting up the first scene
 Asset 1: front cave
Asset 2: flying island with waterfall
Asset 3: plant and flower
Asset 1: front cave
Asset 2: flying island with waterfall
Asset 3: plant and flower
2
Project 2: IK-CEPA

Type of project: explainer video
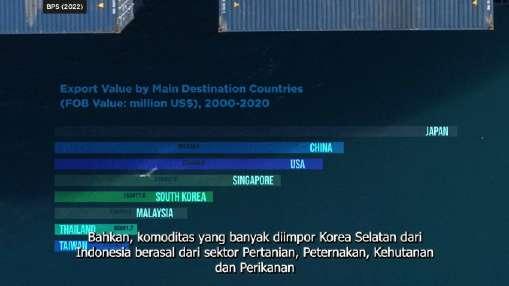
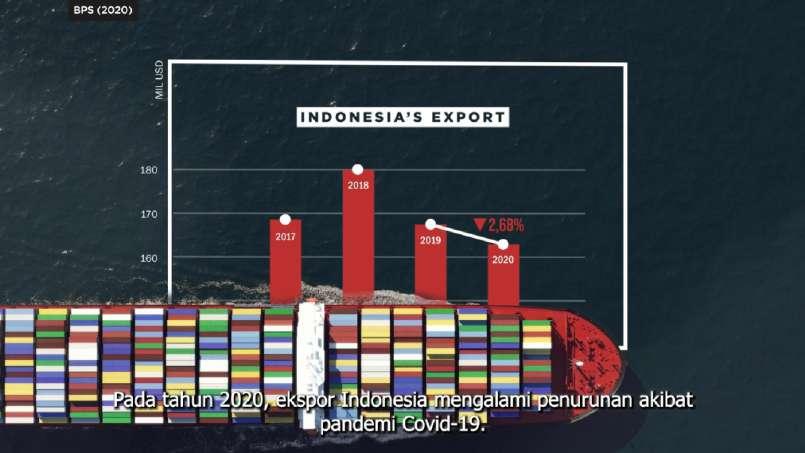
Description: the project explains the concept of IK-CEPA (Indonesia-Korea Comprehensive Economic Partnership Agreement), elaborates the main component that could benefit Indonesia and South Korea in the post-pandemic time, and visualizes the data that supports the narrative.
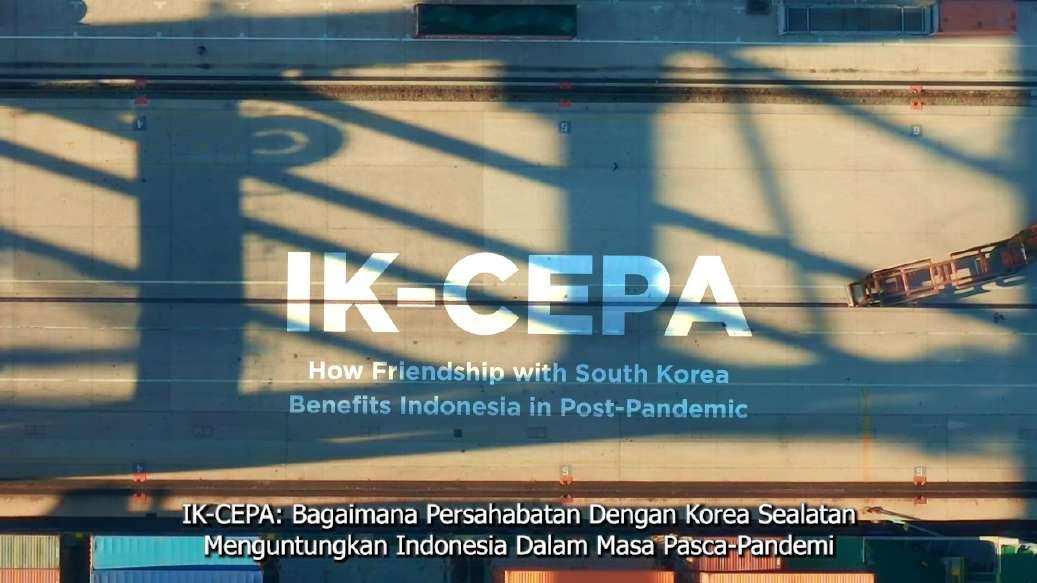
Objective: to explain the benefits of IK-CEPA to the public
3
Click here to watch the video
A glimpse of behind the scene
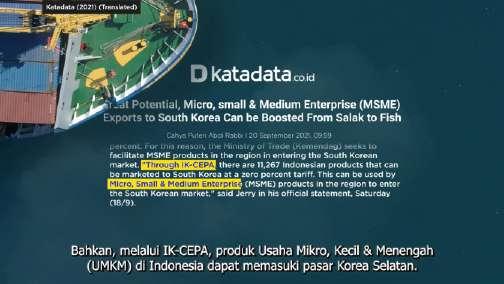
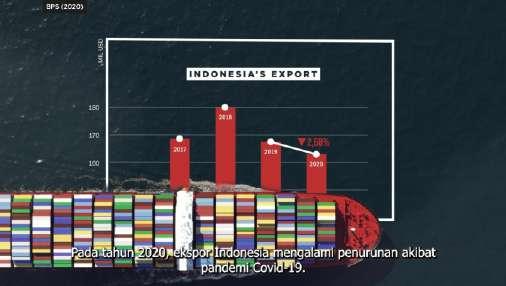
Combining Data Visualization with Footage
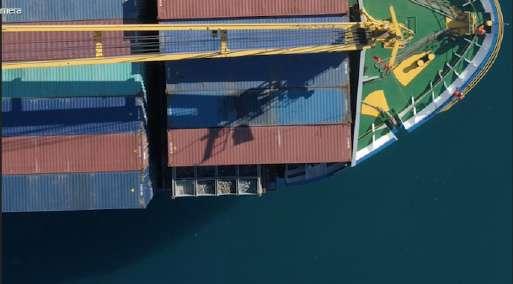
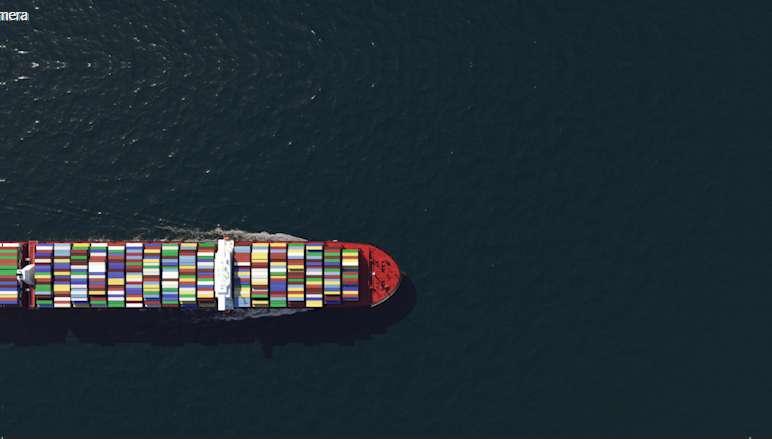
Plain data is boring. Integrating infographics and footage related to the topic could make data more attractive and digestible to audience. Another advantage is the movement from the footage could make the video more dynamic. One of the techniques that we used is masking. It is done by cutting the element layer from footage (the ship, for example), then puts a graph beneath it. The effect makes it look as if the graph is integrated with the footage..

4
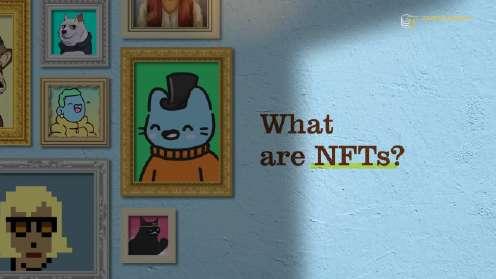
Project 3: What is NFTs?


Type of project: explainer video
Description: the project unravels the concept of NFT as its popularity is often misinterpreted in society. Because NFTs are intangible, we elaborate why such a digital art could cost billions of dollar, while it is still in demand until today
Objective: to elaborate the mechanism of NFT and clarify the public’s misconceptions
5
to
Click here
watch the video
A glimpse of behind the scene
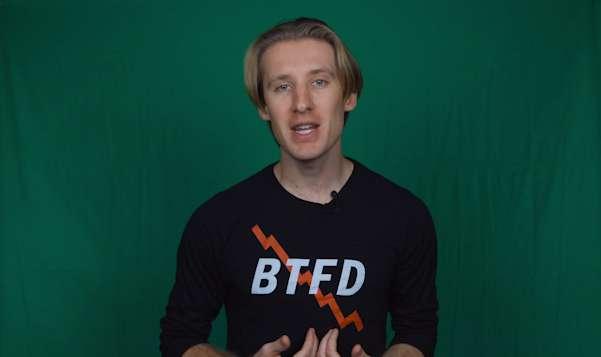
Green Screen Combined with Motion Graphics

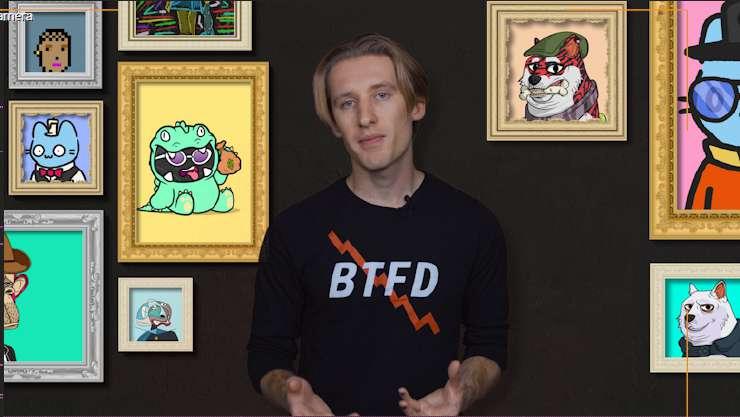

To immerse the presenter within visuals, we included the NFT elements to the scene and placed certain NFTs that match the narrative. For example, when talking about rug pull, we put the “Frosties” NFT on the presenter scene.
Visual Style
As NFTs are perceived as an art, we designed the moodboard to look like fine art in a museum. Hence, the visual assets comprise of textured wall, glossy frame, lighting, and shadow.
In the video, you can see that we played around with shadow effects. The effect makes it look as if there is a spotlight on the fine art.
Green screen footage
6
Setting up the scene
Presenter with “Frosties” NFT
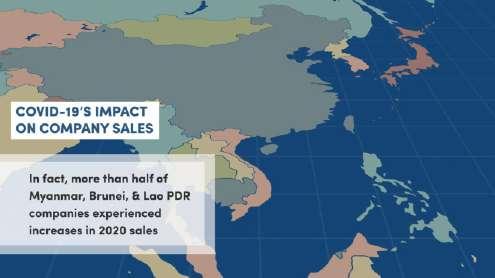
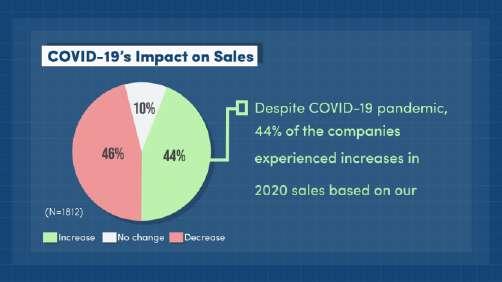
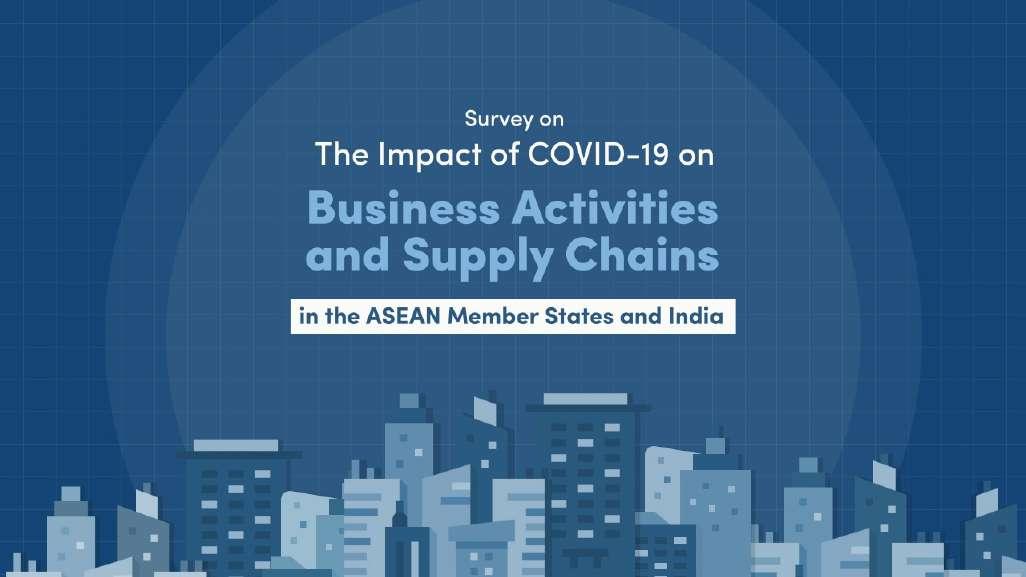
Project 4: The Impact of COVID-19 on Business Activities and Supply Chains in the ASEAN Member States and India
Type of project: motion graphics

Description: this project visualized findings from an economic paper. As the paper is mostly comprised of text-based content with complex numbers, we transformed it into understandable data visualization. This allows audiences to get a glimpse into the substance of that paper.
Objective: to promote a paper titled “The Impact of COVID-19 on Business Activities and Supply Chains in the ASEAN Member States and India”.
7
Click here to watch the video
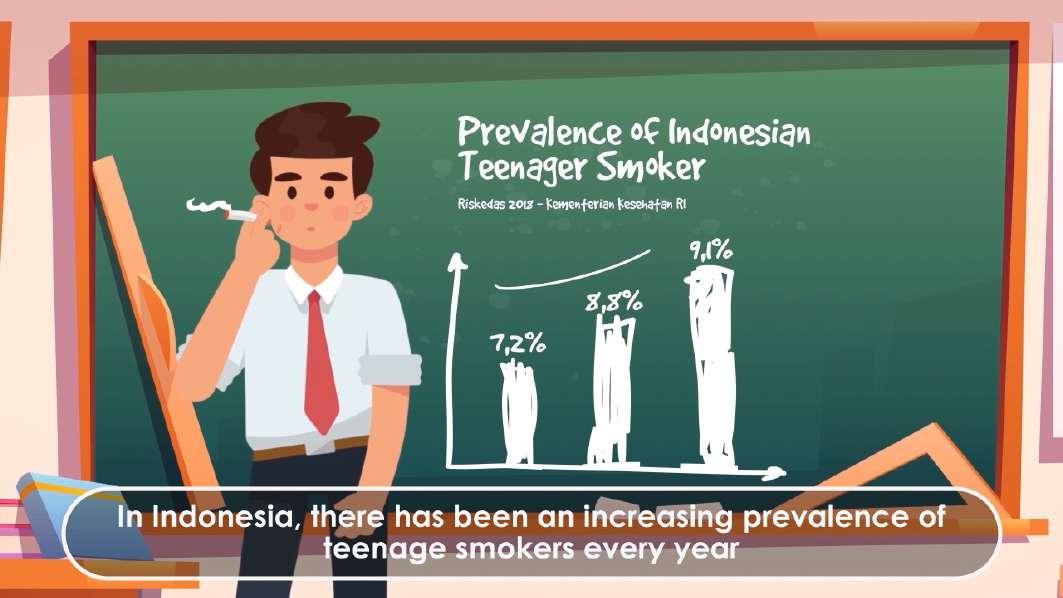
Project 5: Teenagers and Cigarette
Click here to watch the video
Type of project: motion graphics

Description: the project shows how cigarette advertisements target teen consumers through various ways and the main reason why teenagers are preyed on by cigarette companies

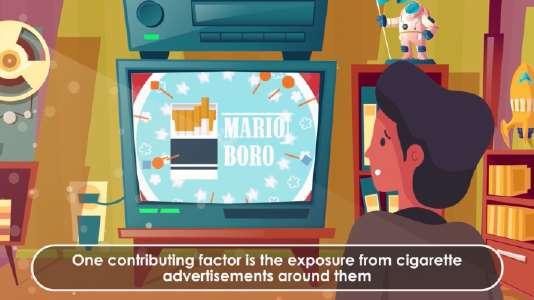
Objective: to advocate the ban of cigarette advertisement to teenagers
8
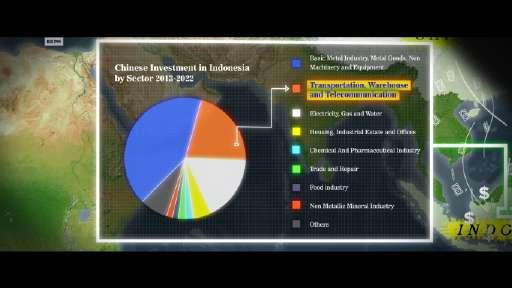
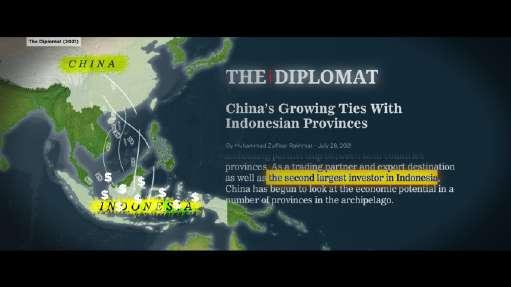
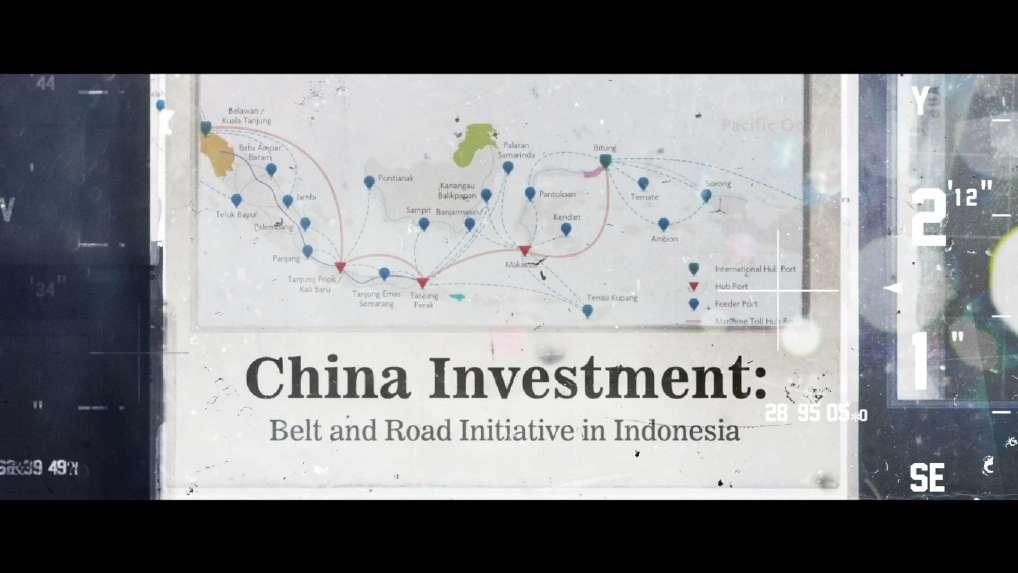
Project 6: China Investment: Belt and Road Initiative in Indonesia
Click here to watch the video
Type of project: short explainer videos

Description: the project reveals how China invests in Indonesia’s transportation infrastructure to fulfill their majestic global ambition: the belt and road initiative. We gathered data and various findings from reports and converted them into strong visual narrative.
Objective: explain thoroughly how China contributes to transportation infrastructure in Indonesia
9
Project 7: COVID-19 and Stroke

Type of project: in-depth news video
Description: the project elaborates the mechanism of COVID-19 in a physiological sense, meaning how it infects the body and causes symptoms related to stroke. We also highlight government policies that prevent the spread of the virus.
Objective: to give a comprehensive understanding of the correlation between COVID-19 and stroke symptoms
10
Click here to watch the video

Check Full Portfolio Motion Graphics Portfolio Link Video Production Portfolio Link Data Visualization Portfolio Link