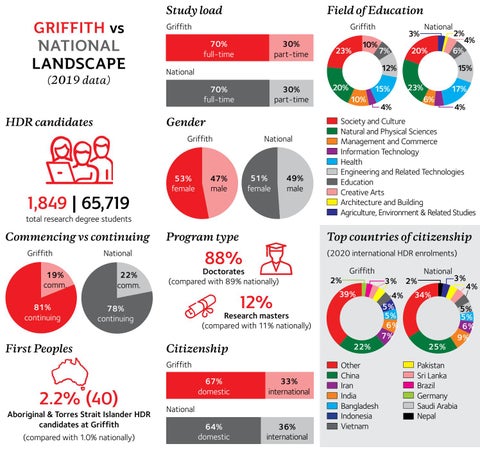
GRIFFITH vs NATIONAL LANDSCAPE (2019 data)
Study load
Field of Education Griffith
Griffith 70% full-time
30% part-time
30% part-time
National
Griffith
53% female
51% female
47% male
49% male
total research degree students
Commencing vs continuing Griffith 19% comm. 81% continuing
Program type
22% comm.
First Peoples
12%
Aboriginal & Torres Strait Islander HDR candidates at Griffith (compared with 1.0% nationally)
20%
15% 10%
4%
23% 6%
17% 4%
Society and Culture Natural and Physical Sciences Management and Commerce Information Technology Health Engineering and Related Technologies Education Creative Arts Architecture and Building Agriculture, Environment & Related Studies
2%
Griffith
Citizenship
39%
22%
67% domestic
33% international
64% domestic
36% international
National
National 3%
Research masters (compared with 11% nationally)
Griffith
2.2% (40)
15%
(2020 international HDR enrolments)
Doctorates (compared with 89% nationally)
78% continuing
20%
2% 4% 6%
Top countries of citizenship
88%
National
7%
National
12%
Gender
1,849 | 65,719
23%
National 70% full-time
HDR candidates
10%
3%
Other China Iran India Bangladesh Indonesia Vietnam
4% 5% 5% 6% 7%
2% 34%
25%
3% 4% 5% 5% 6% 9%
Pakistan Sri Lanka Brazil Germany Saudi Arabia Nepal