
92
A study is conducted to determine if one can predict the price of a stock based on the price-to-earnings ratio. The response variable in this study is:
price of the stock. (True Answer )Correct
the price-to-earnings ratio. Incorrect
the researcher. Incorrect
either the NASDAQ or the Dow Jones Industrial Average. Incorrect
93 A researcher is interested in determining if one could predict the score on a statistics exam from the amount of time spent studying for the exam. In this study, the explanatory variable is:
the researcher. Incorrect
the amount of time spent studying for the exam. (True Answer )Correct
the score on the exam. Incorrect
the fact that this is a statistics exam. Incorrect
94 When creating a scatterplot, one should:
use the vertical axis for the response variable. (True Answer )Correct
use the vertical axis for the explanatory variable. Incorrect
use a different plotting symbol if the explanatory variable is categorical than if the response variable is categorical. Incorrect
use a plotting scale that makes the overall trend roughly linear. Incorrect
95 The height (in feet) and volume of usable lumber (in cubic feet) of 32 cherry trees are measured by a researcher. The goal is to determine if volume of usable lumber can be estimated from the height of a tree. The results are plotted below.
Reference: Ref 2-1
In this study, the response variable is:
height. Incorrect
volume. (True Answer )Correct
height or volume. It doesn't matter which is considered the response. Incorrect
neither height nor volume. The measuring instrument used to measure height is the response variable. Incorrect
96 The height (in feet) and volume of usable lumber (in cubic feet) of 32 cherry trees are measured by a researcher. The goal is to determine if volume of usable lumber can be estimated from the height of a tree. The results are plotted below.

Reference: Ref 2-1
The scatterplot suggests:
there is a positive association between height and volume. Incorrect
there is an outlier in the plot. Incorrect

both a) and b). (True Answer )Correct
neither a) nor b). Incorrect
97 At a large university, the office responsible for scheduling classes notices that demand is low for classes meeting before 10:00 AM or after 3:00 PM and is high for classes meeting between 10:00 AM and 3:00 PM. We may conclude which of the following?
There is an association between demand for classes and the time the classes meet. (True Answer )Correct
There is a positive association between demand for classes and the time the classes meet. Incorrect
There is a negative association between demand for classes and the time the classes meet. Incorrect
The time of the class meeting must cause changes in the demand for the classes. Incorrect
98 The graph below plots the gas mileage (miles per gallon, or MPG) of various 1978 model cars versus the weight of these cars in thousands of pounds.
The points denoted by the plotting symbol × correspond to cars made in Japan. From this plot, we may conclude that:
there is little difference between Japanese cars and cars made in other countries. Incorrect
Japanese cars tend to be lighter in weight than other cars. (True Answer )Correct
Japanese cars tend to get poorer gas mileage than other cars. Incorrect
the plot is invalid. A scatterplot is used to represent quantitative variables, and the country that makes a car is a qualitative variable. Incorrect
The stores of a large retail chain were divided into three groups. While customers were shopping, group 1 played light rock music, group 2 played classical music, and group 3 played show tunes. The daily sales for each day in a 30-day period were recorded. Suppose that, on average, sales were highest in those stores that played light rock music, second highest for those stores playing show tunes, and lowest for those stores playing classical music. We conclude:
there is a positive association between sales and type of music played. Incorrect
there is a negative association between sales and type of music played. Incorrect
there is both positive and negative association present. Incorrect
none of the above. (True Answer )Correct
100 A college newspaper interviews a psychologist about a proposed system for rating the teaching ability of faculty members. The psychologist says, “The evidence indicates that the correlation between a faculty member's research productivity and teaching rating is close to zero.” A correct interpretation of this statement would be:
good researchers tend to be poor teachers and vice versa. Incorrect
good teachers tend to be poor researchers and vice versa. Incorrect
good researchers are just as likely to be good teachers as they are bad teachers. Likewise for poor researchers. (True Answer )Correct
good research and good teaching go hand in hand. Incorrect
101 A student wonders if people of similar heights tend to date each other. She measures herself, her dormitory roommate, and the women in the adjoining rooms; then she measures the next man each woman dates. Here are the data (heights in inches):
Which of the following statements is true?
The variables measured are all categorical. Incorrect
There is a strong negative association between the heights of men and women, because the women are always
smaller than the men they date. Incorrect
There is a positive association between the heights of men and women. (True Answer )Correct
Any height above 70 inches must be considered an outlier. Incorrect
102 Which of the following statements is true?
The correlation coefficient equals the proportion of times two variables lie on a straight line. Incorrect
The correlation coefficient will be +1.0 only if all the data lie on a perfectly horizontal straight line. Incorrect
The correlation coefficient measures the fraction of outliers that appear in a scatterplot. Incorrect
The correlation coefficient is a unitless number and must always lie between –1.0 and +1.0, inclusive. (True Answer )Correct
103 A study found a correlation of r = –0.61 between the gender of a worker and his or her income. You may correctly conclude that:
women earn more than men on the average. Incorrect
women earn less than men on the average. Incorrect
an arithmetic mistake was made. Correlation must be positive. Incorrect
this is incorrect because r makes no sense here. (True Answer )Correct
104 The following scatterplot displays the 1990 per capita income versus number of deaths due to traffic accidents per 100,000 people for each of the 50 states plus the District of Columbia.

Which of the following is a plausible value for the correlation coefficient between weight and MPG?
+0.2 Incorrect
–0.5 (True Answer )Correct
+0.7 Incorrect
–1.0 Incorrect
10 5 Consider the following scatterplot.
The correlation between X and Y is approximately:

0.999. Incorrect
0.8. (True Answer )Correct
0.0. Incorrect
–0.7. Incorrect
106 Consider the following scatterplot of two variables X and Y.
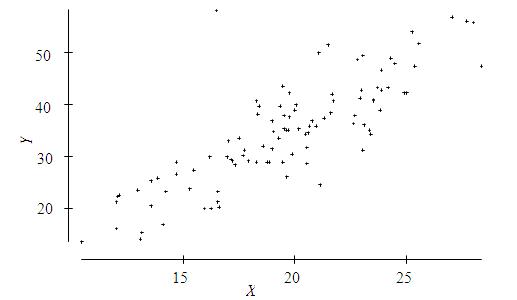
We may conclude that:
the correlation between X and Y must be close to 1
because there is nearly a perfect relationship between them. Incorrect
the correlation between X and Y must be close to –1 because there is nearly a perfect relationship between them, but it is not a straight line relationship. Incorrect
the correlation between X and Y is close to 0. (True Answer )Correct
the correlation between X and Y could be any number between –1 and +1. Without knowing the actual values, we can say nothing more. Incorrect
107 A researcher wants to determine if a man's height and his foot length (measured from the heal to the big toe) are associated. Two men were measured and the results are below. The height and foot length are both measured in inches. Male
The correlation r computed from the measurements on these males is:
1.0. (True Answer )Correct
positive, and between 0.25 and 0.75. Incorrect
near 0, but could be either positive or negative. Incorrect
exactly 0. Incorrect
108 A researcher wants to determine if a man's height and his foot length (measured from the heal to the big toe) are associated. Two men were measured and the results are below. The height and foot length are both measured in inches.
Male #1 Male #2
70 75
length 10 12
Reference: Ref 2-2
The correlation r would have units measured in:
inches. Incorrect
square inches. Incorrect
feet and inches. Incorrect
no units. Correlation is a unitless quantity. (True Answer )Correct
109
Which of the following is true of the correlation coefficient r?
It is a resistant measure of association. Incorrect
–1 ? r ? 1. (True Answer )Correct
If r is the correlation between X and Y, then –r is the correlation between Y and X. Incorrect
The sign of the correlation tells us about the strength of the relationship between X and Y. Incorrect
110 The scatterplot below is from a small data set.
The data were classified as either of type 1 or type 2. Those of type 1 are indicated by o's and those of type 2 by x's. The overall correlation of the data in this scatterplot is:
positive. (True Answer )Correct
negative, because the o's display a negative trend and the x's display a negative trend. Incorrect
near 0, because the o's display a negative trend and the x's display a negative trend, but the trend from the o's to the x's is positive. The different trends cancel. Incorrect
impossible to compute for such a data set. Incorrect
111 A scatterplot of a variable Y versus a variable X produced the scatterplot below. The value of Y for all values of X is exactly 1.0. The correlation between Y and X is:

+1.0 because the points lie perfectly on a line. Incorrect
either +1.0 or –1.0, because the points lie perfectly on a line. Incorrect

0 because Y does not change as X increases. (True Answer )Correct
none of the above. Incorrect
2 The profits (in multiples of $100,000) versus the sales (in multiples of $100,000) for a number of companies are plotted below.
11
The correlation between profits and sales is 0.814. Suppose we removed the point that is circled from the data represented in the plot. The correlation between profits and sales would then be:

0.814. Incorrect
larger than 0.814. Incorrect
smaller than 0.814. (True Answer )Correct
either larger or smaller than 0.814. It is impossible to say which.
11 3 The profits (in multiples of $100,000) versus the sales (in multiples of $100,000) for a number of companies are plotted below.
Notice that in the plot, profits is treated as the response variable and sales the explanatory variable. The correlation between profits and sales is 0.814. Suppose we had taken sales to be the response variable and profits to be the explanatory variable. In this case, the correlation between sales and profits would be:
0.814. (True Answer )Correct
-0.814. Incorrect
0.000. Incorrect
Any number between -0.814 and 0.814, but one cannot state the exact value. Incorrect
114 A large mutual fund company offers sector funds. These sector funds concentrate their investments in narrow segments of the stock market. In this case, the sectors are financial services, technology, and utilities. The company offers a number of portfolios in each of these sectors. In the plot below, the percent return for these portfolios is plotted against the sector each represents.
The correlation between percent return and sector is:

negative. Incorrect
positive. Incorrect
essentially 0 because the columns of points overlap in their values of percent return. Incorrect
none of the above. (True Answer )Correct
115 The following is a scatterplot of the calories and sodium content of several brands of meat hot dogs. The least-squares regression line has been drawn in on the plot.
Referring to the scatterplot above, based on the least-squares regression line one would predict that a hot dog containing 100 calories would have a sodium content of about:

70. Incorrect
350. (True Answer )Correct
400. Incorrect
600. Incorrect
116 The British government conducts regular surveys of household spending. The average weekly household spending on tobacco products and alcoholic beverages for each of 11 regions in Great Britain was recorded. A scatterplot of spending on tobacco versus spending on alcohol is given below.

Which of the following statements holds?
The observation in the lower right corner of the plot is influential. (True Answer )Correct
There is clear evidence of negative association between spending on alcohol and tobacco. Incorrect
The equation of the least-squares line for this plot would be approximately y = 10 – 2x. Incorrect
The correlation coefficient for this data is 0.99. Incorrect
117 The fraction of the variation in the values of y that is explained by the least-squares regression of y on x is:
the correlation coefficient. Incorrect
the slope of the least-squares regression line. Incorrect
the square of the correlation coefficient. (True Answer )Correct
the intercept of the least-squares regression line. Incorrect
In a statistics course, a linear regression equation was computed to predict the final exam score from the score on the first test. The equation of the least-squares regression line was: y = 8.5 + 0.85x
where y represents the final exam score and x is the score on the first exam. Suppose Joe scores a 90 on the first exam. What would be the predicted value of his score on the final exam?
90. Incorrect
85. (True Answer )Correct
80. Incorrect
The value cannot be determined from the information given. We also need to know the correlation. Incorrect
119 John's parents recorded his height at various ages up to 66 months. Below is a record of the results.
Age (months) 36 48 54 60 66
Height (inches) 35 38 41 43 45
Reference: Ref 2-3
Which of the following is the equation of the leastsquares regression line of John's height on age? (NOTE: You do not need to directly calculate the leastsquares regression line to answer this question.)
Height = 12 × (Age) Incorrect
Height = Age/12 Incorrect
Height = 60 – 0.22 × (Age) Incorrect
Height = 22.3 + 0.34 × (Age) (True Answer )Correct
120 John's parents recorded his height at various ages up to 66 months. Below is a record of the results.
Age (months) 36 48 54 60 66
Height (inches) 35 38 41 43 45
Reference: Ref 2-3
John's parents decide to use the least-squares regression line of John's height on age to predict his height at age 21 years (252 months). We conclude:
John's height, in inches, should be about half his age, in months. Incorrect
that the parents will get a fairly accurate estimate of his height at age 21 years because the data are clearly correlated. Incorrect
such a prediction could be misleading, because it involves extrapolation. (True Answer )Correct
all of the above. Incorrect
12 1
A researcher wished to determine whether a company's profits can be used to predict the market value of the company. Based on data from a sample of over 80 companies from the Forbes 500 list, the researcher calculated the equation of the least-squares line for predicting market value from profits to be:
Market value = 388.2 + 13.7(Profits)
The correlation between market value and profits would be:
1/13.7. Incorrect
13.7/388.2. Incorrect
positive, but we cannot say what the exact value is. (True Answer )Correct
either positive or negative. It is impossible to say anything about the correlation from the information given. Incorrect
122 The least-squares regression line is:
the line that makes the square of the correlation in the data as large as possible. Incorrect
the line that makes the sum of the squares of the vertical distances of the data points from the line as small as possible. (True Answer )Correct
the line that best splits the data in half, with half of the points above the line and half below the line. Incorrect
all of the above. Incorrect
123 Which of the following is true of the least-squares regression line?
The slope is the change in the response variable that would be predicted by a unit change in the explanatory variable. Incorrect
It always passes through the point ( , ), the means of the explanatory and response variables, respectively. Incorrect
It will only pass through all the data points if r = ± 1. Incorrect
All of the above. (True Answer )Correct
124 A pediatrician wishes to study how the average weight Y (in kilograms) of children changes during the first year of life. He plots these averages versus the age X (in months) and decides to fit a least-squares regression line to the data with X as the explanatory variable and Y as the response variable. He computes the following quantities:
r = correlation between X and Y = 0.84
= mean of the values of X = 5.69
= mean of the values of Y = 6.26
= standard deviation of the values of X = 3.23
= standard deviation of the values of Y = 2.04
The slope of the least-squares line is:
0.53. (True Answer )Correct
0.64. Incorrect
0.84. Incorrect
2.04. Incorrect
125 Recall that when we standardize the values of a variable, the standardized value has mean 0 and standard deviation 1. Suppose we measure two variables, X and Y, on each of several subjects. We standardize both variables and then compute the leastsquares regression line of Y on X for these standardized values. Suppose the slope of this least-squares regression line is –0.44. We may conclude:
the intercept will be 1.0. Incorrect
the intercept will also be –0.44. Incorrect
the correlation will be 1.0. Incorrect
the correlation will be –0.44. (True Answer )Correct
126 Below is a scatterplot of the world record time for women in the 10,000-meter run versus the year in which the record was set. Note that time is in seconds and the data are for the period 1965 to 1995.

Based on this plot, we can expect:
by 2005, the world record time for women will be well below 1500 seconds. Incorrect
that about every decade, the world record time will decrease
by at least 100 seconds. Incorrect
that about every decade, the world record time will decrease by about 50 seconds. Incorrect
none of the above. (True Answer )Correct
127 In a study of 2005 model cars, a researcher found that the fraction of the variation in the car's miles per gallon (MPG) which was explained by the least-squares regression on weight was about 0.64. For the cars in this study, the correlation between the car's MPG and its weight was found to be positive. The actual value of the correlation is:
0.80. (True Answer )Correct
0.64. Incorrect
0.41. Incorrect
impossible to determine from the information given. Incorrect
12 8 In the same study of 2005 model cars, a researcher computed the leastsquares regression line of miles per gallon (MPG) on weight (in pounds). He obtained the following equation for this line: MPG = 34.941 – .004 × weight
Based on the least-squares regression line, we would predict that a 2005 model car with weight equal to 3000 pounds would have an MPG of:
34.941. Incorrect
30.931. Incorrect
22.941. (True Answer )Correct
26.921. Incorrect
129 The following is a scatterplot of the calories and sodium content of several brands of meat hot dogs. The least-squares regression line has been drawn in on the plot.

Referring to the scatterplot above, the value of the residual for the point labeled x:
is about 40. (True Answer )Correct
is about 1300. Incorrect
is about 425. Incorrect
cannot be determined from the information given. Incorrect
130 Researchers studied a sample of 100 adults between the ages of 25 and 35 and found a strong negative correlation between the annual salary and the number of pounds the individual was overweight. We may conclude which of the following?
This is strong, but not conclusive, evidence that being overweight results in lower salaries. Incorrect
If the annual salary and the number of pounds overweight for each individual in this study was plotted on a scatterplot, the points would lie close to a negatively sloping straight line. (True Answer )Correct
If a larger sample of adults between the ages of 25 and 35 had been studied, the correlation would have been even stronger. Incorrect
All of the above. Incorrect
131 A researcher wished to determine whether a company's profits can be used to predict the market value of the company. Based on data from a sample of 80 companies from the Forbes 500 list, the researcher calculated the equation of the least-squares regression line for predicting market value from profits to be:
Market value = 388.2 + 13.7(Profits)
One company used by the researcher had profits of $36 million dollars and the market value of this company was $885 million. These values were used in the calculation of the least-squares regression line. The residual corresponding to these values is:
$3.6 million. (True Answer )Correct
–$3.6 million. Incorrect
$13.7 million. Incorrect
–$849 million. Incorrect
132 A response Y and explanatory variable X were measured on each of several subjects. A scatterplot of the measurements is given below. The least-squares regression line is shown in the plot.
Which of the following is a plot of the residuals for the above data versus X?
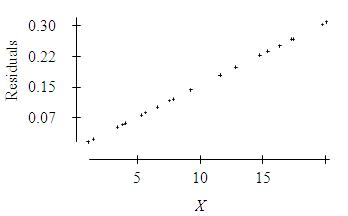


133 The least-squares regression line is fit to a set of data. If one of the data points has a negative residual, then:

the correlation between the values of the response and explanatory variables must be positive. Incorrect
the point must lie below the least-squares regression line. (True Answer )Correct

the point must lie near the left edge of the scatterplot. Incorrect
all of the above. Incorrect
134 Which of the following statements concerning residuals is true?
The sum of the residuals is always 0. Incorrect
A plot of the residuals is useful for assessing the fit of the least-squares regression line. Incorrect
The value of a residual is the observed value of the response minus the value of the response that one would predict from the least-squares regression line. Incorrect
All of the above. (True Answer )Correct
135
The owner of a chain of supermarkets notices that there is a positive correlation between the sales of beer and the sales of ice cream over the course of the previous year. Seasons when sales of beer were above average, sales of ice cream also tended to be above average. Likewise, during seasons when sales of beer were below average, sales of ice cream also tended to be below average. Which of the following would be a valid conclusion from these facts?
There must be an error. There should be no association between beer and ice cream sales. Incorrect
Evidently, for a significant proportion of customers of these supermarkets, drinking beer causes a desire for ice cream or eating ice cream causes a thirst for beer. Incorrect
A scatterplot of monthly ice cream sales versus monthly beer sales would show that a straight line describes the pattern in the plot, but it would have to be a horizontal line. Incorrect
None of the above. (True Answer )Correct
136 A researcher studies the relationship between the total SAT score (Math SAT score plus Critical Reading SAT score plus Writing SAT score) and the grade point average (G.P.A.) of college students at the end of their freshman year. In order to use a relatively homogeneous group of students, the researcher examines only data of high school valedictorians (students who graduated at the top of their high school class) who have completed their first year of college. The researcher finds the correlation between total SAT score and G.P.A. at the end of the freshman year to be very close to 0. Which of the following would be a valid conclusion from these facts?
Because the group of students studied is a very homogeneous group of students, the results should give a very accurate estimate of the correlation the researcher would find if all college students who have completed their freshman year were studied. Incorrect
The correlation we would find if all college students who have completed their freshman year were studied would be even smaller than that found by the researcher. By restricting to valedictorians, the researcher is examining a group that will be more informative than those students who have only completed their freshman year. Incorrect
The researcher made a mistake. Correlation cannot be calculated (the formula for correlation is invalid)