TRENDS



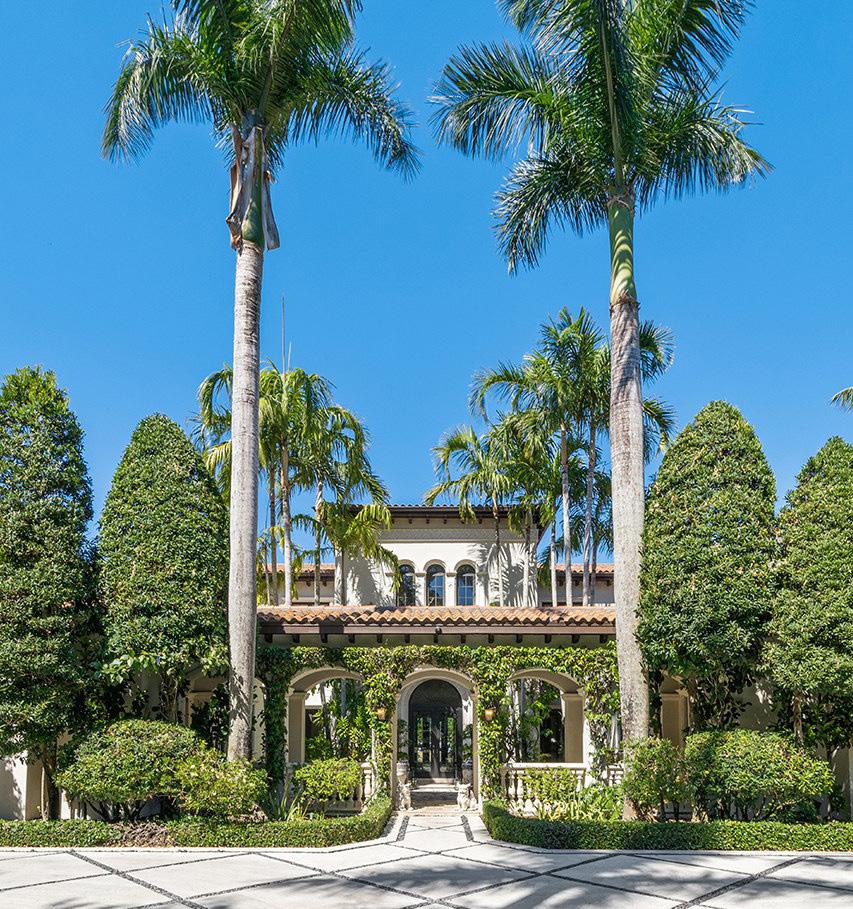
MARKET REPORT MARCH 2023
LOCAL EXPERTISE WITH A GLOBAL PERSPECTIVE
Alena Graff
+1 (305) 775-5587
Hello@AlenaGraff.com www.alenagraff.com
Global Real Estate Advisor ONE Sotheby's International Realty

MIAMI-DADE COUNTY
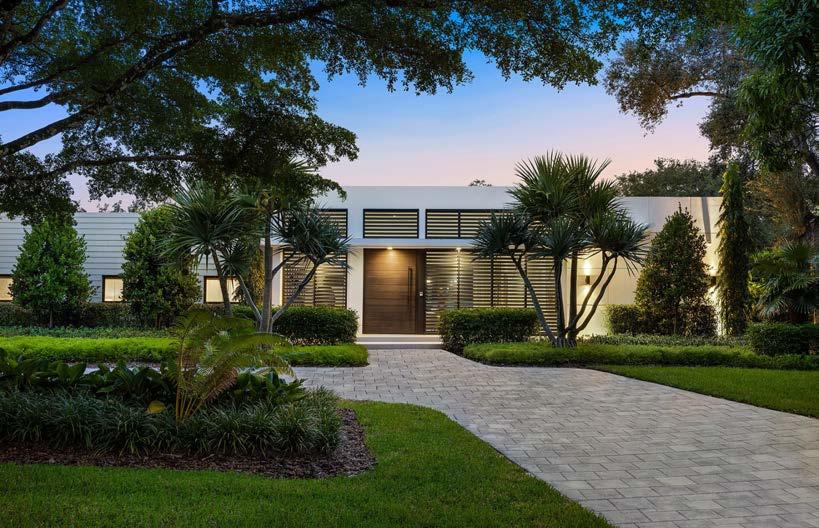
SINGLE-FAMILY HOMES | FEBRUARY PRICING GAINS
The median price increased by 3% in February, driving much of the yearover-year gain of roughly 5%. The median price per square foot remained 10% higher than one year ago.
Neighborhood Snapshots
*ALL PERCENTAGES REFLECT YEAR OVER YEAR CHANGE. 562K 64 3,607 701 338 MEDIAN SALES PRICE AVERAGE DAYS ON MARKET ACTIVE LISTINGS SOLD LISTINGS MEDIAN PPSF ↑ 5% ↑ 36% ↑ 10% ↓ 26% ↑ 78%
MEDIAN SALES PRICE MEDIAN PRICE PER SF CLOSED SALES AVERAGE DAYS ON MARKET FEB 23 FEB 22 YOY% CHANGE FEB 23 YOY% CHANGE FEB 23 YOY% CHANGE FEB 23 AVENTURA $1,175,000 N/A N/A $429 N/A 1 N/A 202 COCONUT GROVE $3,588,000 $2,500,000 43.50% $625 -21.05% 6 -60.00% 98 CORAL GABLES $1,515,900 $1,700,000 -11% $739 23% 28 -15% 86 KEY BISCAYNE $2,400,000 $3,400,000 -29% $1,444 55% 1 -80% 20 MIAMI $560,000 $525,000 7% $338 10% 374 -17% 60 MIAMI BEACH $3,250,000 $2,775,000 17% $981 -10% 16 -20% 141 MIAMI SHORES $1,097,500 $1,250,000 -12% $594 18% 10 -23% 50 PINECREST $2,380,000 $2,375,000 0% $768 16% 7 -50% 102 SOUTH MIAMI $1,035,000 $1,200,000 -14% $547 -12% 6 0% 52 SUNNY ISLES BEACH $1,500,000 $1,240,000 21% $852 30% 3 200% 163 SURFSIDE $7,925,000 $1,125,000 604% $3,546 375% 1 -75% 46
$
$
MIAMI-DADE COUNTY
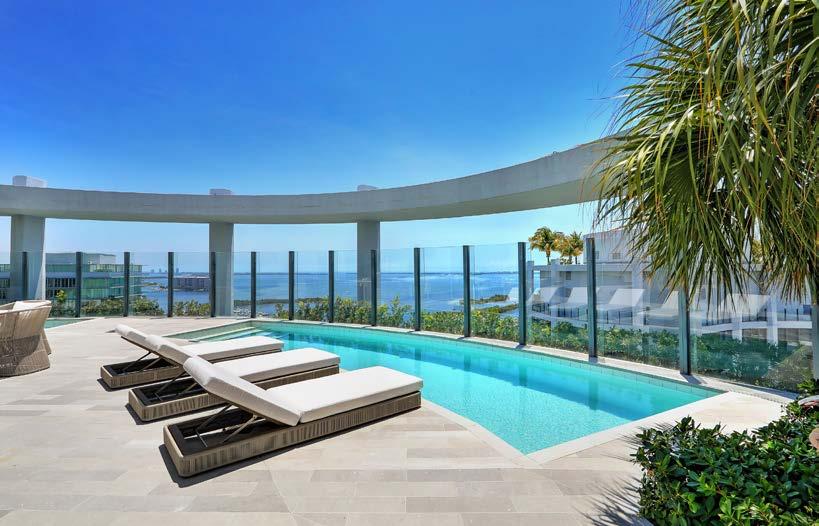
CONDOMINIUMS | UNITS SELL QUICKER THAN 2022
The average days on market for a condo unit was approximately 20% lower than last year.
Neighborhood Snapshots
*ALL PERCENTAGES REFLECT YEAR OVER YEAR CHANGE.
MEDIAN
MEDIAN PPSF ↑ 3% ↓ 19% 0% ↓ 47% ↑ 35%
395K 69 6,580 899 370
SALES PRICE AVERAGE DAYS ON MARKET ACTIVE LISTINGS SOLD LISTINGS
MEDIAN SALES PRICE MEDIAN PRICE PER SF CLOSED SALES AVERAGE DAYS ON MARKET FEB 23 FEB 22 YOY% CHANGE FEB 23 YOY% CHANGE FEB 23 YOY% CHANGE FEB 23 AVENTURA $437,500 $383,500 14% $366 14% 54 -63% 83 BAL HARBOUR $2,500,000 $865,000 189% $962 34% 5 -76% 100 BAY HARBOR ISLANDS $520,000 $652,500 -20% $473 19% 7 -65% 95 BRICKELL/DOWNTOWN MIAMI/EDGEWATER $590,000 $580,000 2% $625 13% 97 -56% 91 COCONUT GROVE $2,225,000 $2,260,000 -1.55% $659 45.55% 10 -52.40% 89 CORAL GABLES $663,000 $541,668 22% $563 20% 12 -72% 74 KEY BISCAYNE $1,050,000 $1,320,000 -20% $743 -13% 11 -39% 66 MIAMI $375,000 $345,000 9% $304 8% 293 -41% 53 MIAMI BEACH $412,500 $432,500 -5% $526 3% 136 -53% 91 MIAMI SHORES $675,000 N/A N/A $391 N/A 1 N/A 22 NORTH BAY VILLAGE $607,500 $315,000 93% $415 34% 12 -29% 64 PINECREST $360,000 $298,700 21% $331 14% 1 -83% 25 SOUTH MIAMI $207,500 $240,000 -14% $392 -4% 3 0% 66 SUNNY ISLES BEACH $660,000 $770,000 -14% $578 7% 57 -42% 99 SURFSIDE $802,500 $465,000 73% $593 26% 4 -69% 81
$ $
BROWARD COUNTY
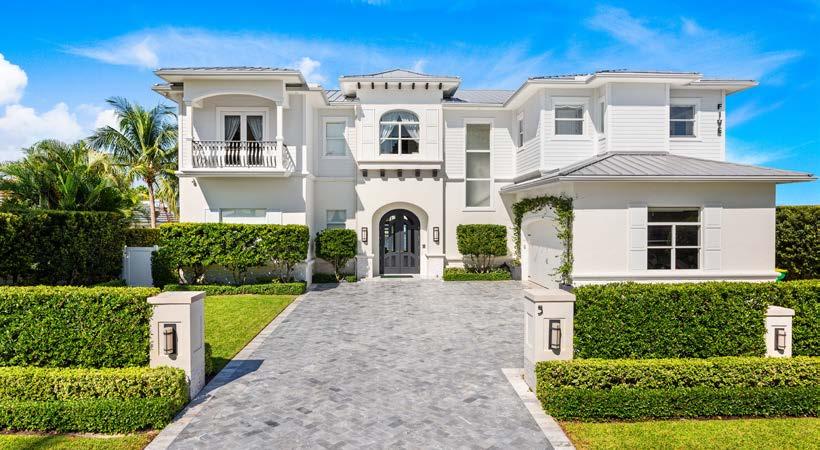
SINGLE-FAMILY HOMES | BUYERS ABSORBED NEW LISTINGS
While active listings remain more than double the level of one year ago, purchase activity reduced the number of homes for sale by 11% from last month.
Neighborhood Snapshots
*ALL PERCENTAGES REFLECT YEAR OVER YEAR CHANGE. 560K 58
801 318 MEDIAN SALES PRICE AVERAGE DAYS ON MARKET ACTIVE LISTINGS SOLD LISTINGS MEDIAN PPSF ↑ 7% ↑ 66% ↑ 8% ↓ 29% ↑ 119%
2,961
MEDIAN SALES PRICE MEDIAN PRICE PER SF CLOSED SALES AVERAGE DAYS ON MARKET FEB 23 FEB 22 YOY% CHANGE FEB 23 YOY% CHANGE FEB 23 YOY% CHANGE FEB 23 COOPER CITY $613,000 $611,250 0% $327 2% 14 -46% 79 CORAL SPRINGS $625,400 $610,000 3% $286 6% 56 -34% 56 DAVIE $685,000 $600,000 14% $352 10% 44 -15% 59 DEERFIELD BEACH $436,500 $449,500 -3% $268 2% 36 0% 55 FORT LAUDERDALE $685,450 $647,500 6% $429 7% 104 -40% 71 HALLANDALE $485,000 $365,000 33% $330 -8% 10 43% 56 HOLLYWOOD $585,000 $480,000 22% $364 17% 61 -35% 56 LAUDERDALE-BY-THE-SEA $1,100,000 $1,300,000 -15% $658 -4% 2 -60% 57 LIGHTHOUSE POINT $1,950,000 $809,450 141% $649 71% 9 -25% 72 MIRAMAR $605,050 $520,000 16% $290 8% 44 -32% 44 PARKLAND $1,200,000 $1,015,000 18% $330 0% 23 -41% 67 PEMBROKE PINES $580,000 $519,500 12% $302 7% 61 -29% 52 PLANTATION $560,000 $626,500 -11% $288 2% 32 -36% 84 POMPANO BEACH $450,000 $398,000 13% $349 15% 44 -31% 59 SOUTHWEST RANCHES $1,650,000 $1,345,000 23% $427 6% 13 30% 67 SUNRISE $415,000 $427,500 -3% $305 10% 33 -21% 49 WESTON $835,000 $900,000 -7% $338 -3% 30 -14% 57 WILTON MANORS $825,000 $689,500 20% $439 -12% 14 -18% 32
$ $
BROWARD COUNTY
CONDOMINIUMS | TIME ON MARKET LOWEST IN REGION
Broward County generated the highest number of condo sales in February, helping to drive the average time on market to the lowest in the region.
Neighborhood Snapshots

*ALL PERCENTAGES REFLECT YEAR OVER YEAR CHANGE. 270K 51 4,381 943 239 MEDIAN SALES PRICE AVERAGE DAYS ON MARKET ACTIVE LISTINGS SOLD LISTINGS MEDIAN PPSF ↑ 15% ↓ 6 % ↑ 12% ↓ 32% ↑ 88%
MEDIAN SALES PRICE MEDIAN PRICE PER SF CLOSED SALES AVERAGE DAYS ON MARKET FEB 23 FEB 22 YOY% CHANGE FEB 23 YOY% CHANGE FEB 23 YOY% CHANGE FEB 23 COOPER CITY $420,000 $385,000 9% $303 15% 8 33% 38 CORAL SPRINGS $210,000 $172,450 22% $225 30% 38 6% 40 DAVIE $285,000 $235,000 21% $228 19% 26 -42% 24 DEERFIELD BEACH $181,500 $167,500 8% $192 8% 69 -18% 50 FORT LAUDERDALE $399,500 $417,500 -4% $379 6% 122 -46% 80 HALLANDALE $332,500 $290,000 15% $299 14% 68 -35% 73 HILLSBORO BEACH $432,500 $540,000 -20% $387 -18% 6 -33% 56 HOLLYWOOD $260,000 $350,000 -26% $258 -20% 71 -41% 58 LAUDERDALE-BY-THE-SEA $475,000 $525,000 -10% $393 -7% 13 -32% 87 LIGHTHOUSE POINT $200,000 $120,000 67% $194 -7% 8 -32% 48 MIRAMAR $420,000 $320,000 31% $253 6% 19 -42% 36 PARKLAND $586,500 $425,000 38% $319 20% 1 -80% 125 PEMBROKE PINES $232,000 $195,000 19% $211 20% 69 -20% 44 PLANTATION $329,000 $206,000 60% $255 40% 39 18% 28 POMPANO BEACH $310,000 $247,500 25% $262 14% 81 -34% 50 SOUTHWEST RANCHES N/A N/A N/A N/A N/A - N/A N/A SUNRISE $183,500 $160,000 15% $192 30% 56 -35% 50 WESTON $367,500 $275,500 33% $283 25% 12 -43% 50 WILTON MANORS $435,000 $206,750 110% $305 9% 13 -7% 22
$ $
PALM BEACH COUNTY
SINGLE-FAMILY HOMES | SALES REBOUND
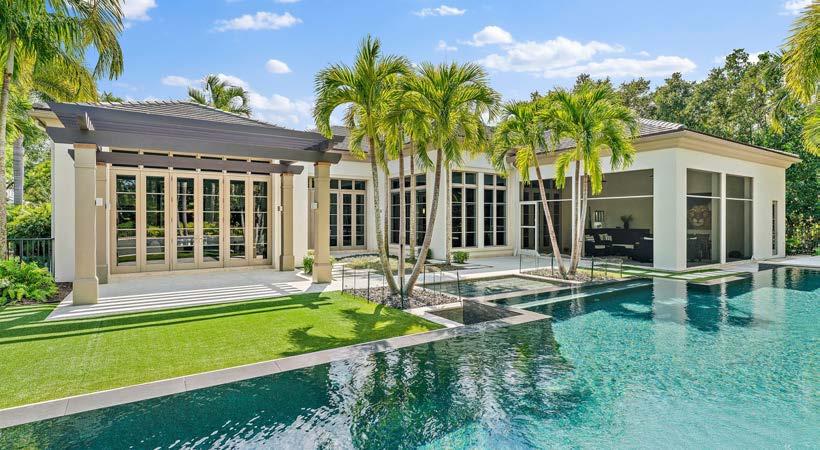
Home sales increased by 21% in February from the previous month, though activity remained lower compared to one year ago. In February, more homes sold in Palm Beach County than in any other county in the region.
Neighborhood Snapshots
*ALL PERCENTAGES REFLECT YEAR OVER YEAR CHANGE. 575K 60 3,544 840 297 MEDIAN SALES PRICE AVERAGE DAYS ON MARKET ACTIVE LISTINGS SOLD LISTINGS MEDIAN PPSF 0% ↑ 76% ↑ 3% ↓ 21% ↑ 164%
MEDIAN SALES PRICE MEDIAN PRICE PER SF CLOSED SALES AVERAGE DAYS ON MARKET FEB 23 FEB 22 YOY% CHANGE FEB 23 YOY% CHANGE FEB 23 YOY% CHANGE FEB 23 BOCA RATON $822,500 $732,500 12% $376 10% 136 -23% 67 BOYNTON BEACH $495,000 $495,000 0% $273 6% 128 54% 51 DELRAY BEACH $583,750 $617,500 -5% $310 -2% 80 -23% 59 HIGHLAND BEACH $2,750,000 $13,875,000 -84% $789 -56% 1 -75% 13 JUNO BEACH $2,125,000 $1,325,000 60% $1,042 122% 1 0% 63 JUPITER $890,000 $720,000 24% $402 7% 49 -18% 58 JUPITER INLET COLONY $4,500,000 N/A N/A $1,184 N/A 1 N/A 100 LAKE PARK $432,000 $375,000 15% $247 -14% 5 400% 29 LAKE WORTH $495,000 $461,250 7% $261 2% 74 -29% 60 LANTANA $427,000 $330,000 29% $308 52% 5 -29% 82 NORTH PALM BEACH $610,000 $3,050,000 -80% $374 -42% 9 29% 59 PALM BEACH $15,000,000 $9,900,000 52% $2,750 9% 1 -91% 290 PALM BEACH GARDENS $775,000 $860,000 -10% $376 -2% 40 -31% 50 SINGER ISLAND $2,875,000 $2,200,000 31% $1,106 31% 2 100% 7 TEQUESTA $1,402,500 $1,372,000 2% $567 4% 4 0% 49 WELLINGTON $700,000 $625,000 12% $283 5% 45 -21% 66 WEST PALM BEACH $460,000 $460,000 0% $283 8% 130 -16% 61
$ $
PALM BEACH COUNTY
CONDOMINIUMS | PRICING MOVES HIGHER
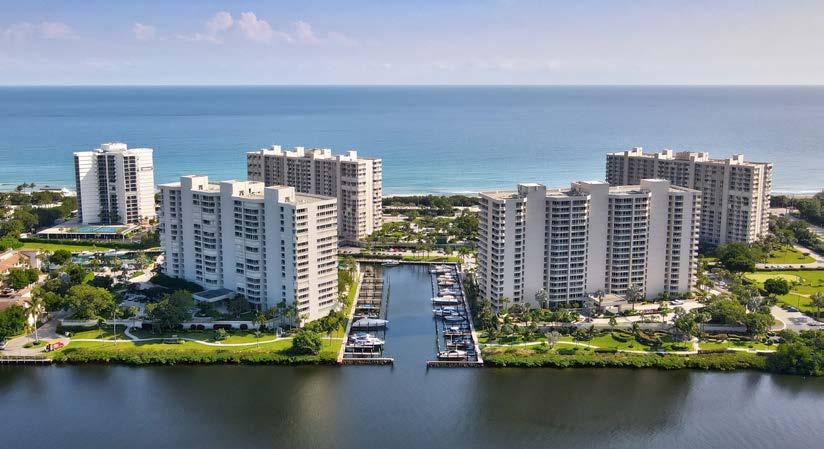
The median price remained roughly 9% higher than one year ago. In February alone, the median price per square foot increased by nearly 2%.
Neighborhood Snapshots
*ALL PERCENTAGES REFLECT YEAR OVER YEAR CHANGE. 300K 54 3,759 785 223 MEDIAN SALES PRICE AVERAGE DAYS ON MARKET ACTIVE LISTINGS SOLD LISTINGS MEDIAN PPSF ↑ 9% ↑ 54% ↑ 10% ↓ 36% ↑ 199%
MEDIAN SALES PRICE MEDIAN PRICE PER SF CLOSED SALES AVERAGE DAYS ON MARKET FEB 23 FEB 22 YOY% CHANGE FEB 23 YOY% CHANGE FEB 23 YOY% CHANGE FEB 23 BOCA RATON $336,000 $340,000 -1% $336,000 6% 128 -40% 50 BOYNTON BEACH $265,000 $250,000 6% $196 17% 75 -46% 45 DELRAY BEACH $230,000 $216,250 6% $193 16% 119 -41% 57 HIGHLAND BEACH $878,750 $635,000 38% $621 30% 10 -57% 68 JUNO BEACH $1,162,500 $776,000 50% $623 22% 10 150% 81 JUPITER $573,500 $485,000 18% $349 14% 52 -2% 56 LAKE PARK $317,000 $247,500 28% $34 -76% 3 -25% 36 LAKE WORTH $197,000 $157,000 25% $156 27% 40 -42% 65 LANTANA $247,500 $279,314 -11% $229 -6% 4 -71% 43 NORTH PALM BEACH $280,000 $418,750 -33% $245 -18% 23 5% 68 MANALAPAN N/A N/A N/A N/A N/A - N/A N/A PALM BEACH $1,550,000 $920,000 68% $768 47% 14 -66% 84 PALM BEACH GARDENS $424,500 $367,500 16% $281 13% 44 -24% 58 SINGER ISLAND $937,500 $915,000 2% $664 30% 8 -65% 83 TEQUESTA $509,900 $350,000 46% $404 57% 5 -44% 67 WELLINGTON $330,000 $322,500 2% $212 -9% 9 -18% 31 WEST PALM BEACH $208,000 $185,000 12% $128 -11% 139 -29% 50
$ $
ONE Sotheby’s International Realty prides itself in being at the forefront of innovation, service, and marketing that push the boundaries within our industry. Our commitment to providing the highest caliber of expertise and dedication sets us apart as we continue to raise the standard of excellence. As real estate’s most trusted brand, our name alone opens the most prestigious doors and creates opportunities to connect sellers and buyers worldwide. That is our mission: to give extraordinary lives a home to thrive.
#1
BEST LUXURY BROKERAGE IN FLORIDA IN 2022 by
PROFILED
Our brand, your advantage Nothing
BEST BROKERAGE WEBSITE IN 2022 by South Florida Agent Magazine

compares.
© 2023 ONE Sotheby’s International Realty. All rights reserved. Sotheby’s International Realty® and the Sotheby’s International Realty Logo are service marks licensed to Sotheby’s International Realty Affiliates LLC and used with permission.
VOTED
VOTED
Luxury Lifestyle Magazine
MOST
LUXURY
ESTATE
#1 Source:
#1
REAL
BRAND IN THE PRESS
Meltwater Jan 2022-Dec 2022 8x AWARD -WINNING MARKETING POWERHOUSE


xFor unmatched © 2022 ONE Sotheby’s International Realty. All rights reserved. Sotheby’s International Realty® and the Sotheby’s International Realty Logo are service marks licensed to Sotheby’s International Realty Affiliates LLC and used with permission. ONE Sotheby’s International Realty fully supports the principles of the Fair Housing Act and the Equal Opportunity Act. Each franchise is independently owned and operated. Any services or products provided by independently owned and operated franchisees are not provided by, affiliated with or related to Sotheby’s International Realty Affiliates LLC nor any of its affiliated companies. The information contained herein is deemed accurate but not guaranteed.


