MARKET REPORT

ANNUAL 2022
LOCAL EXPERTISE WITH A GLOBAL PERSPECTIVE
I’m thrilled to share our annual market report for 2022, offering meaningful insights about the state of the market, comparisons to 2021, and indicators of what we can look forward to in 2023. Florida continued to lead the US residential real estate market, with strong demand and pricing offsetting headwinds from rising interest rates and a shifting global economic landscape. Our state is growing both economically and demographically, which has resulted in record-high prices for single-family homes and condos.
Despite the expectation that rates will fluctuate in 2023, all the data we have points to resiliency in buyer demand and limited supply in Florida, which is a recipe for pricing to remain strong. As our market remains the focus of global attention, I look forward to what we will achieve together in 2023.

Data is sourced from local Multiple Listing Service (MLS) organizations. Written analysis created in partnership with the Rosen Consulting Group, a nationally recognized consulting firm and trusted advisor to top public and private real estate operators and capital providers. Alena Graff +1 (305) 775-5587 Hello@AlenaGraff.com www.alenagraff.com Global Real Estate Advisor ONE Sotheby's International Realty
Miami-Dade County
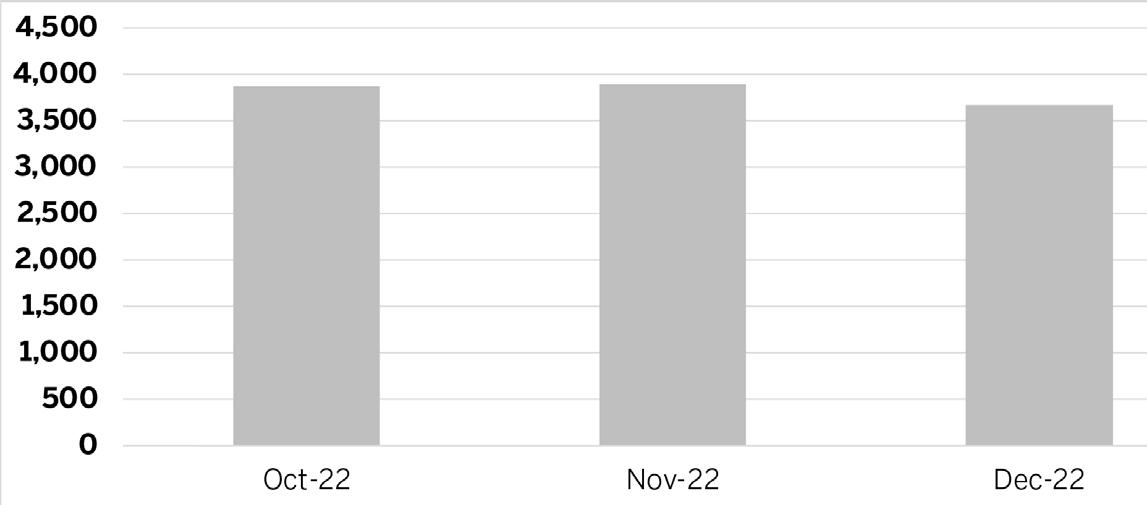
TIGHT MARKET AND FEWER SALES
Sales dropped by the second-lowest amount in the region. Though inventory increased, the market remains tight.
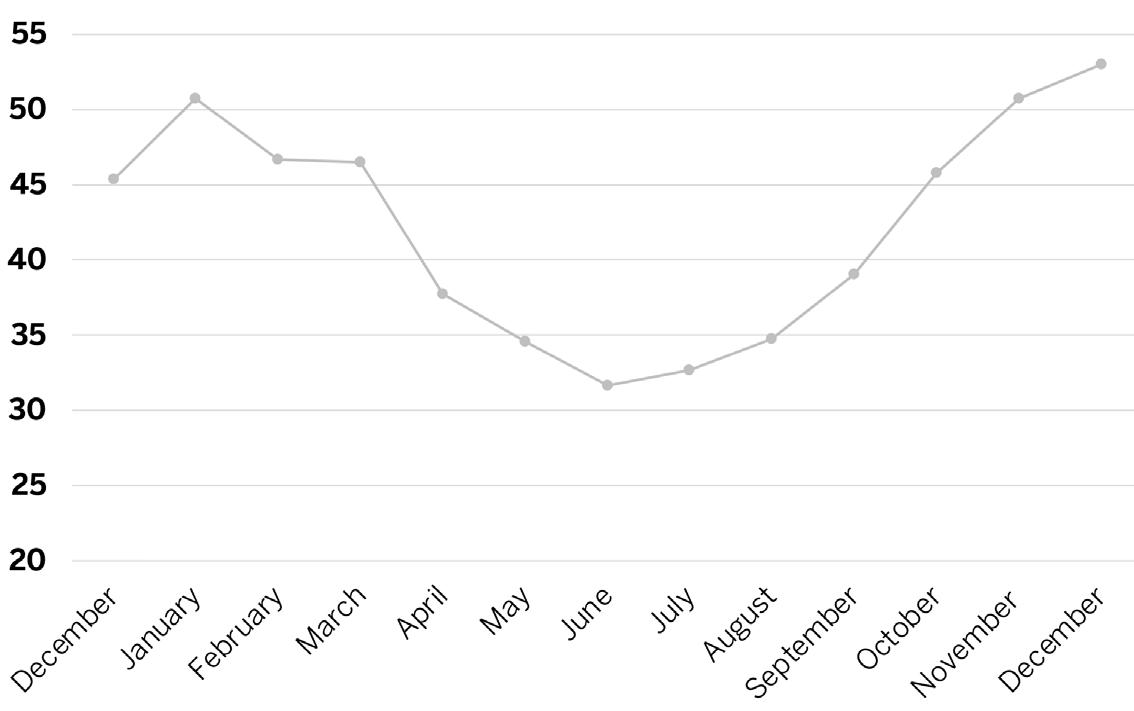
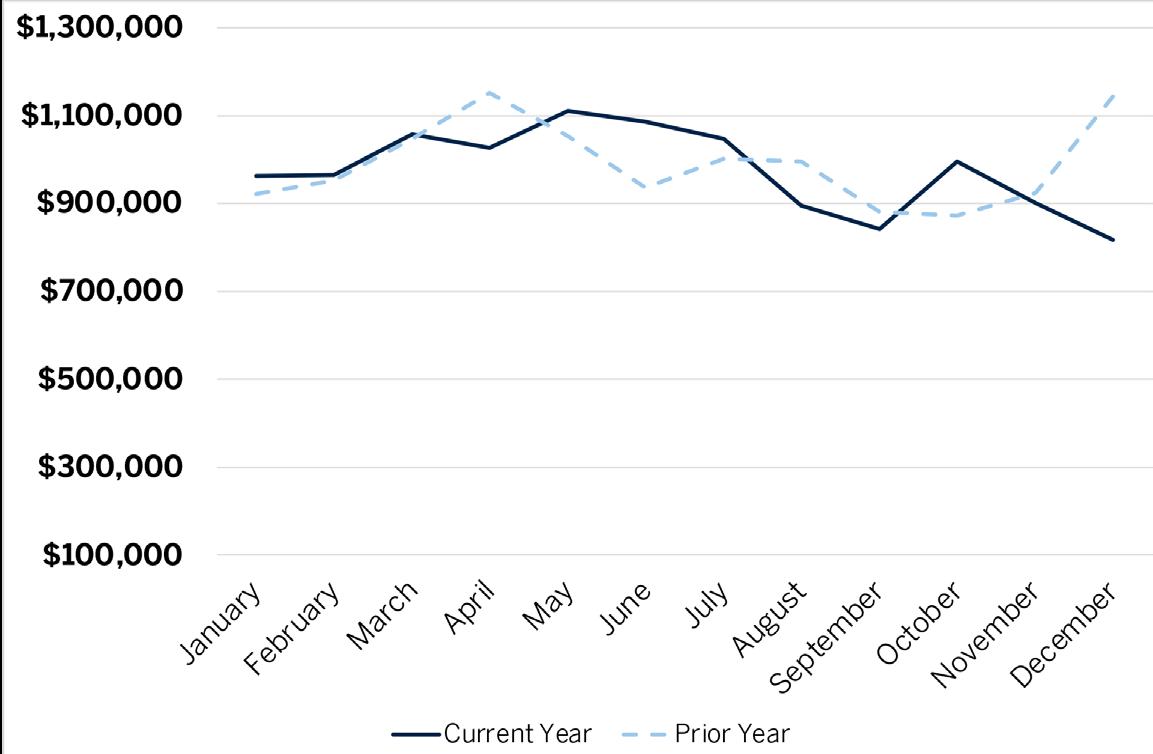
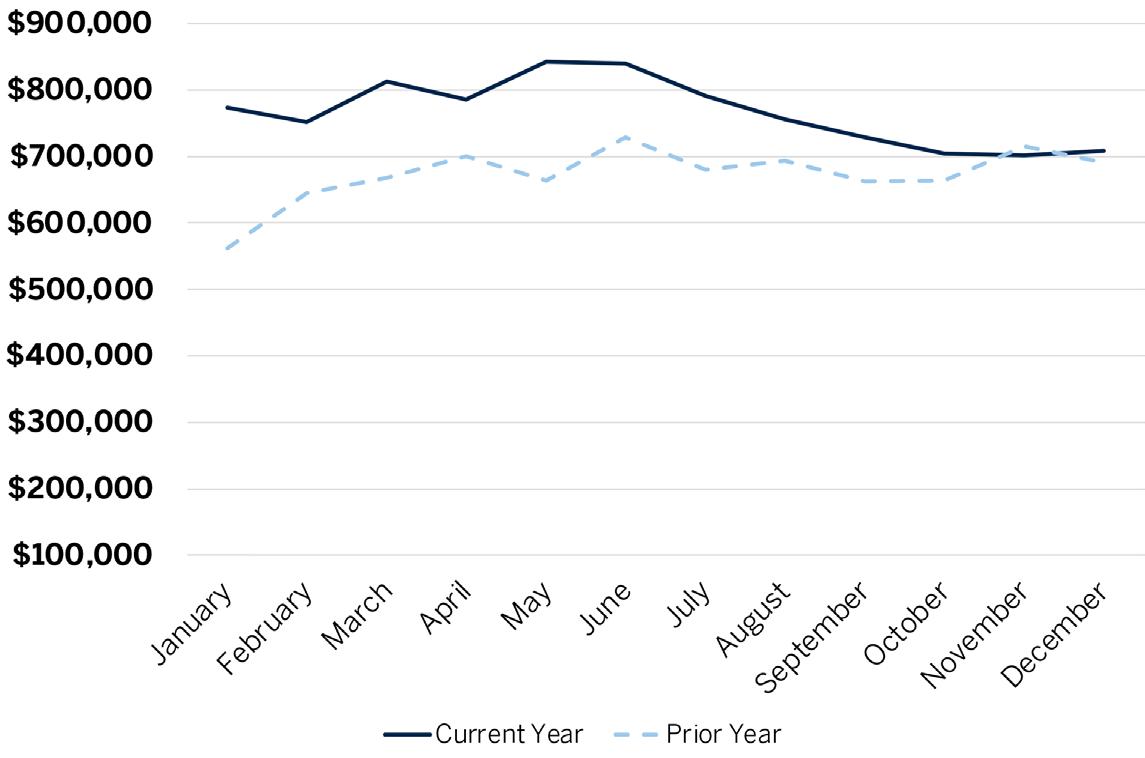
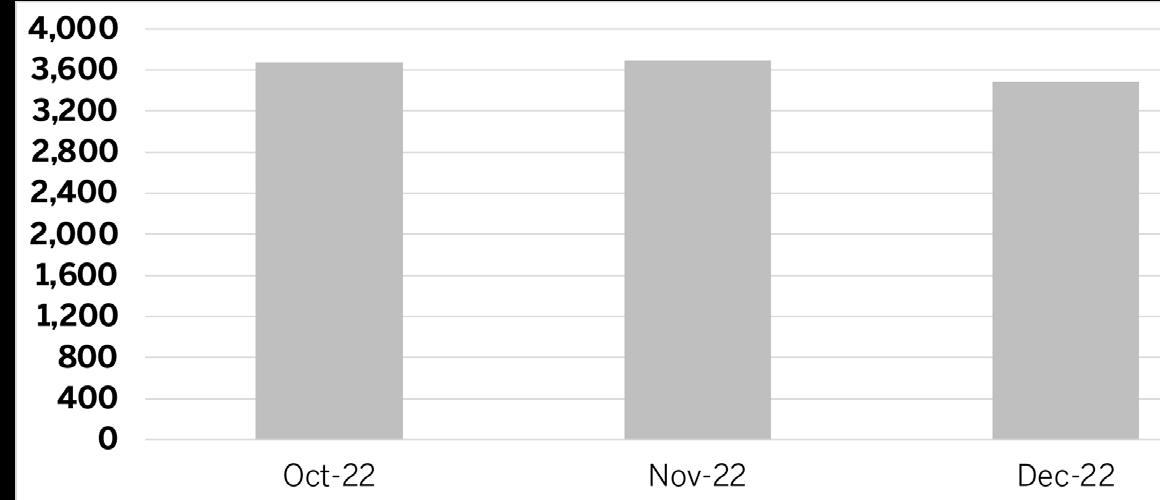
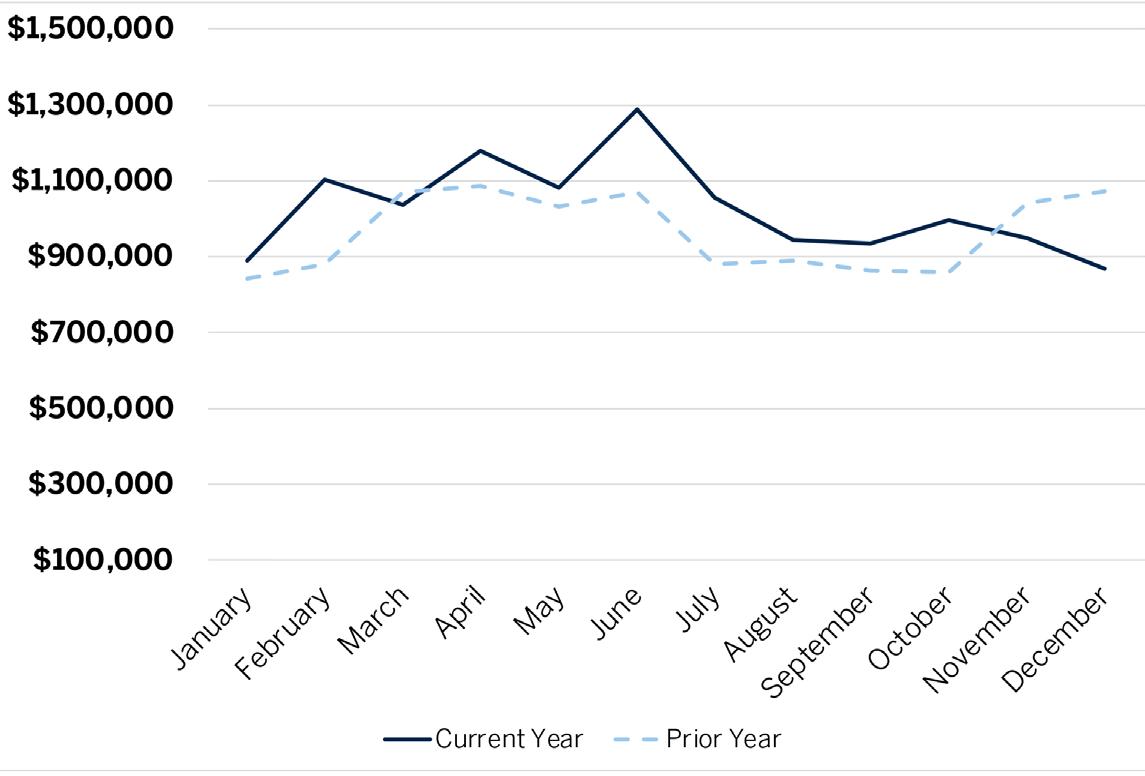
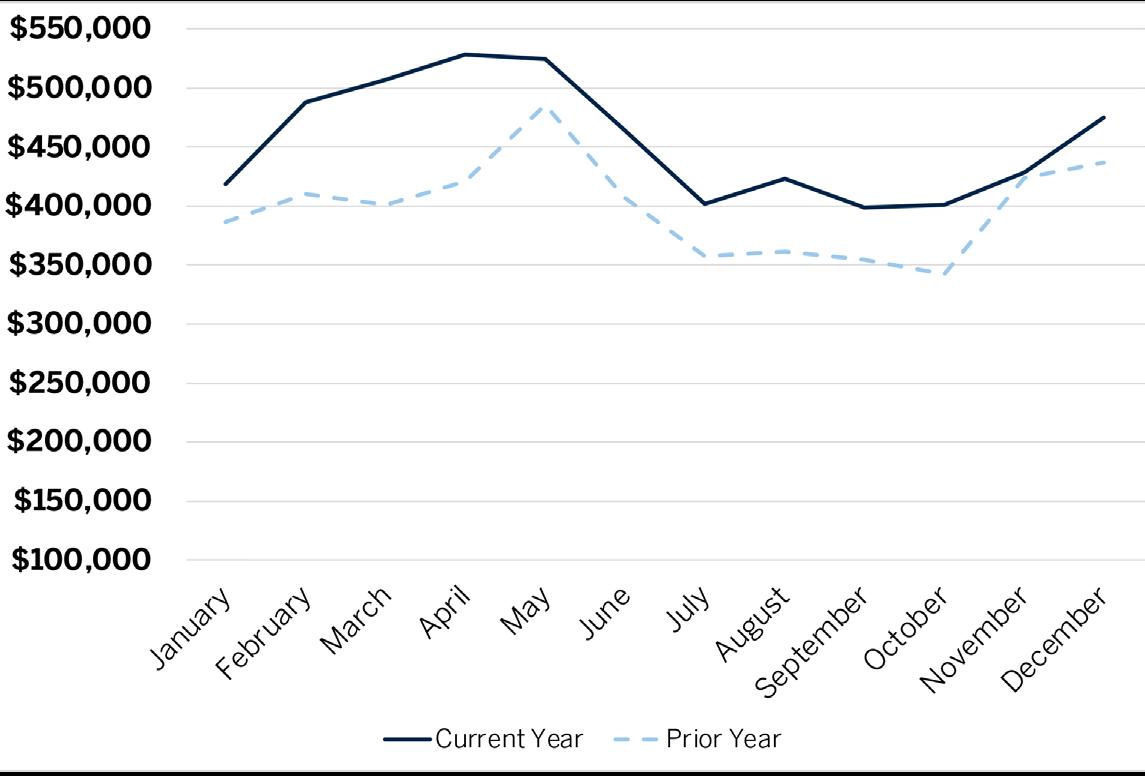
AVERAGE SALES PRICE
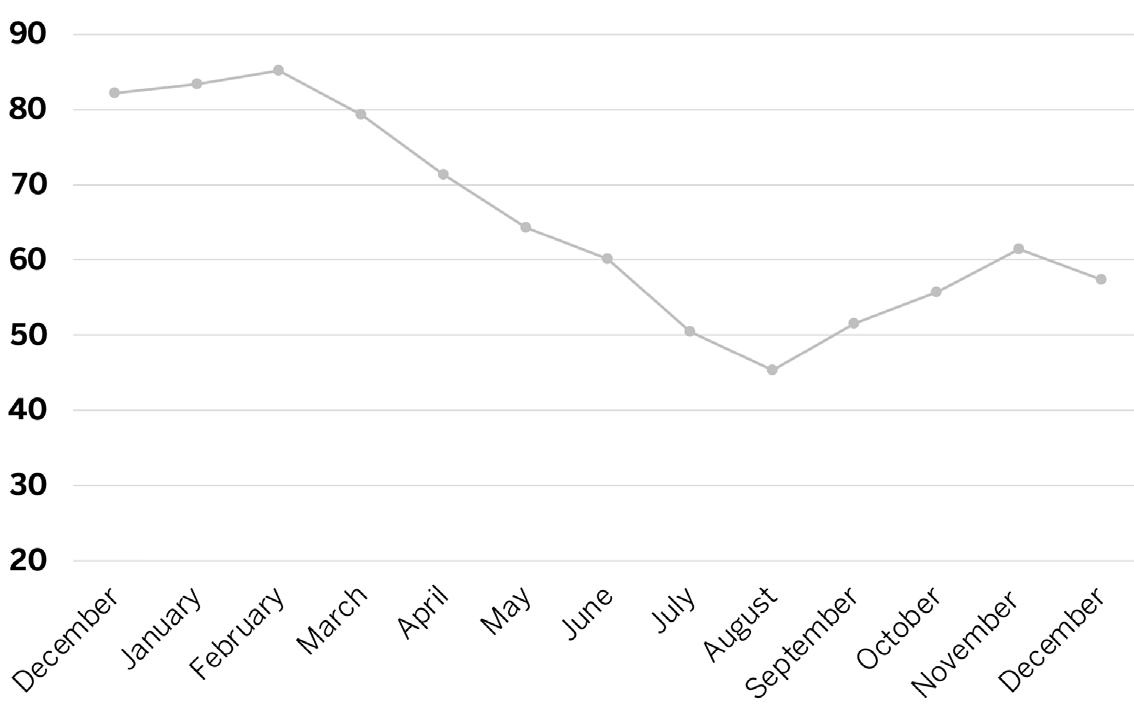
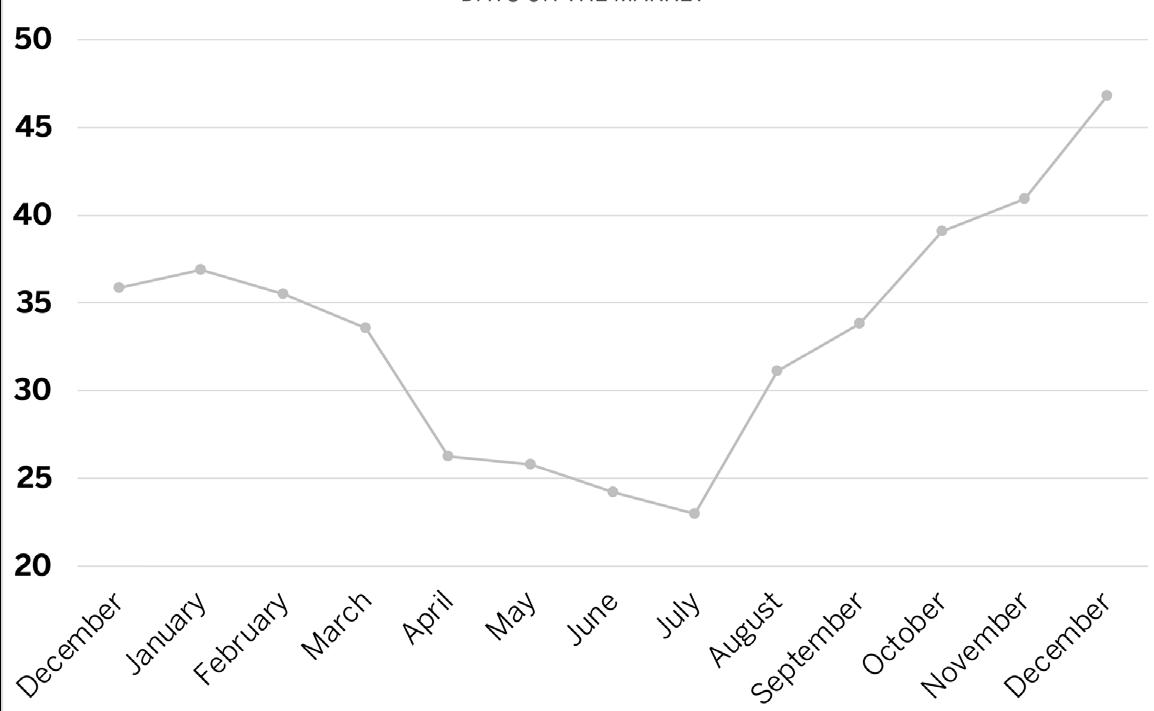
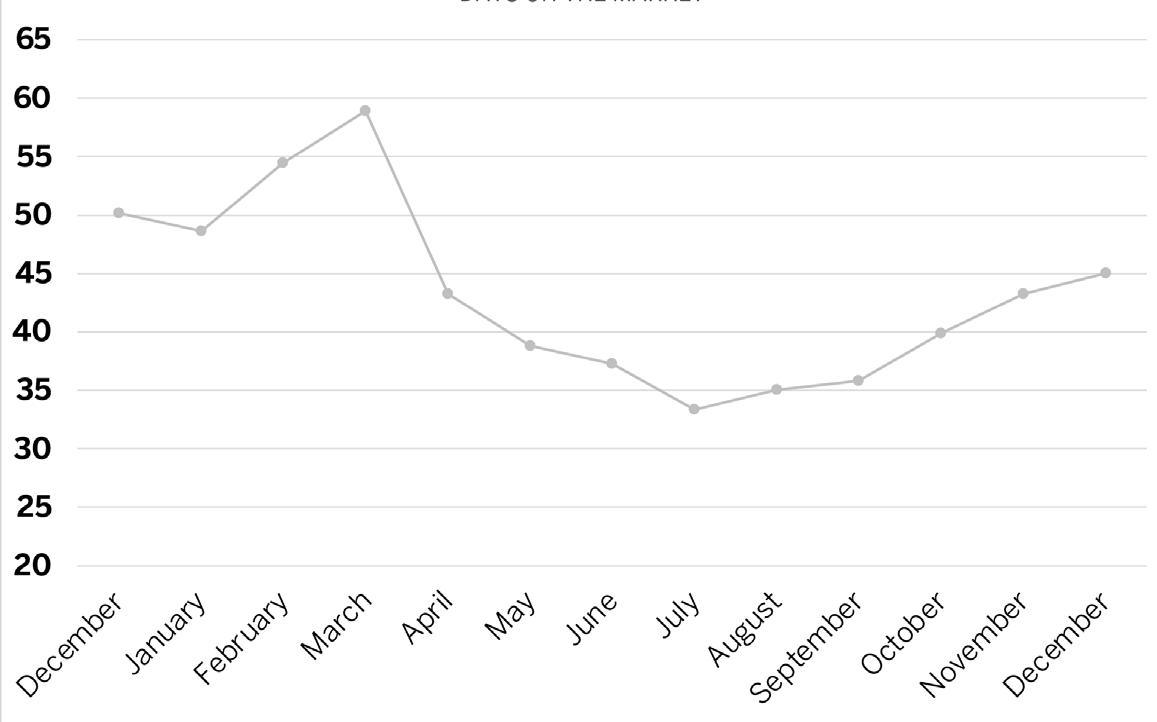
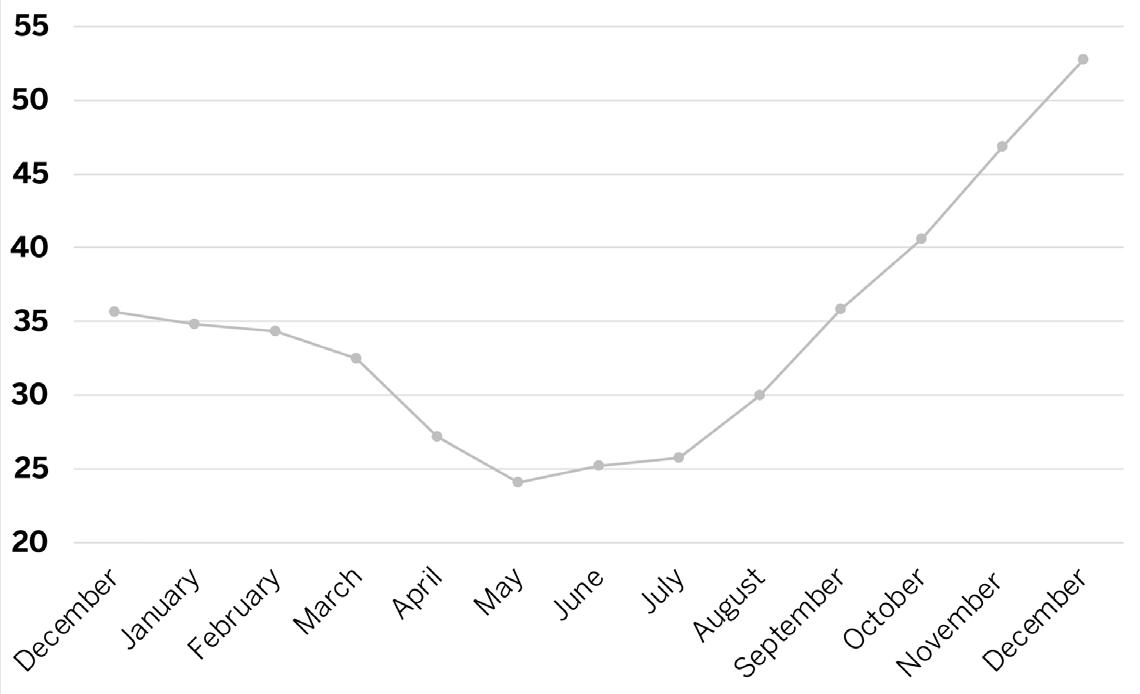
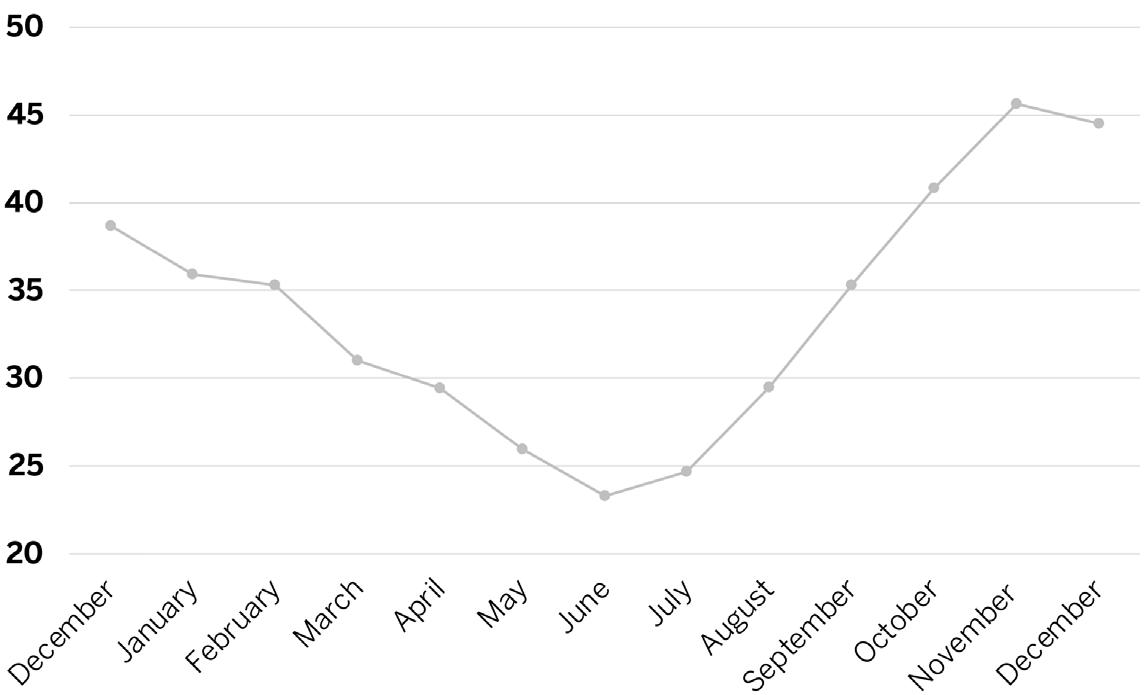
DAYS ON MARKET
SINGLE-FAMILY HOMES
SINGLE-FAMILY HOMES
Miami-Dade County
SALES BY NEIGHBORHOOD
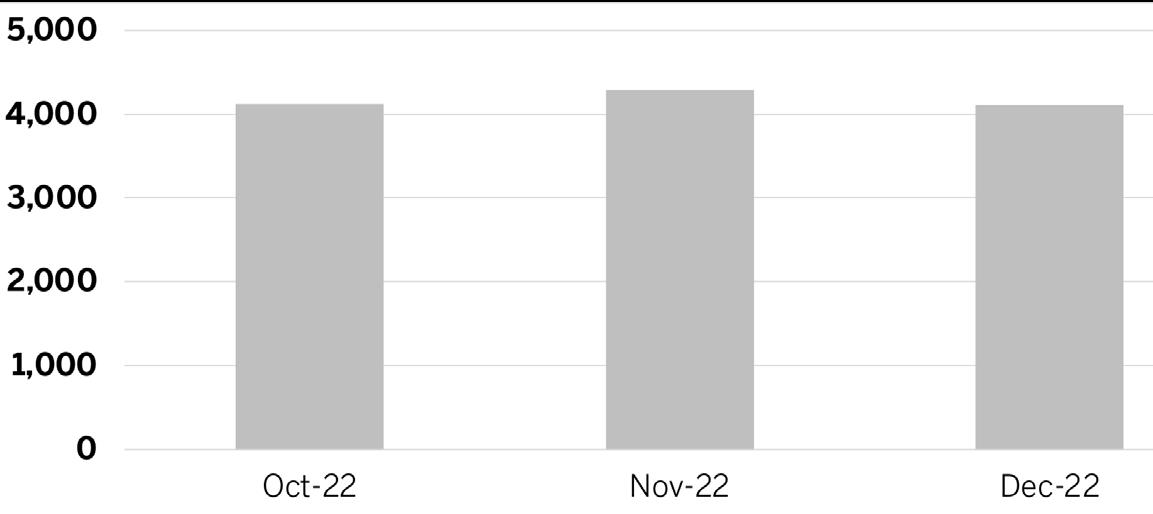
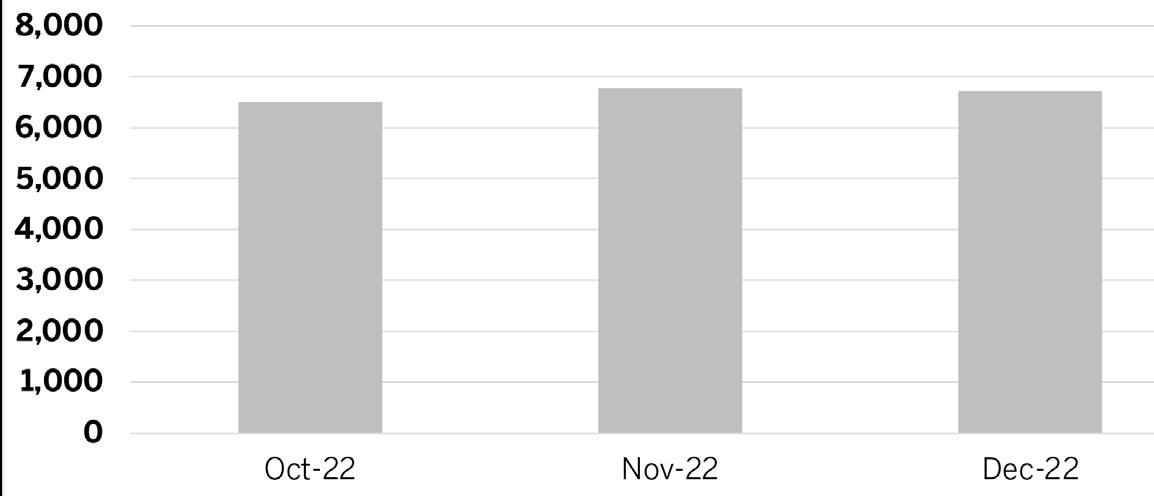
CLOSED TRANSACTIONS
AVAILABLE LISTINGS
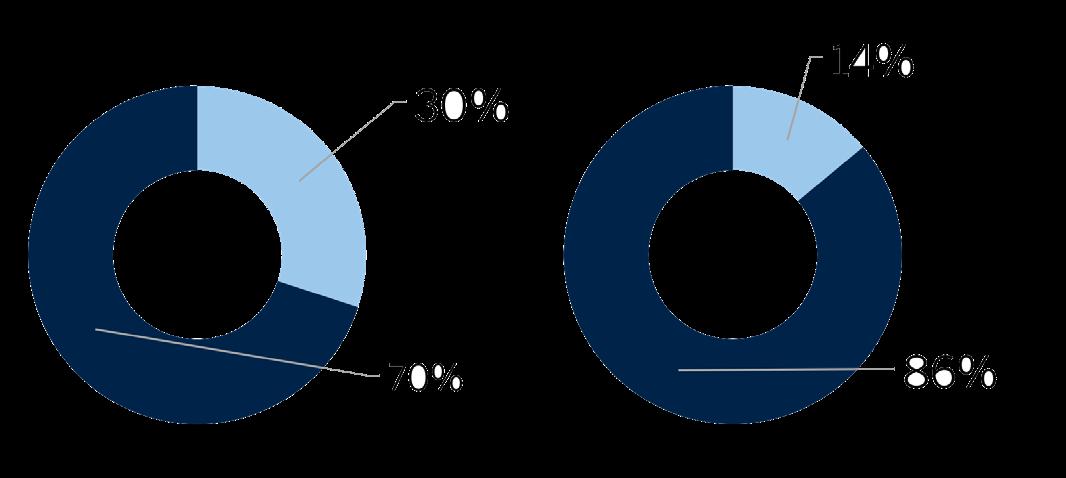
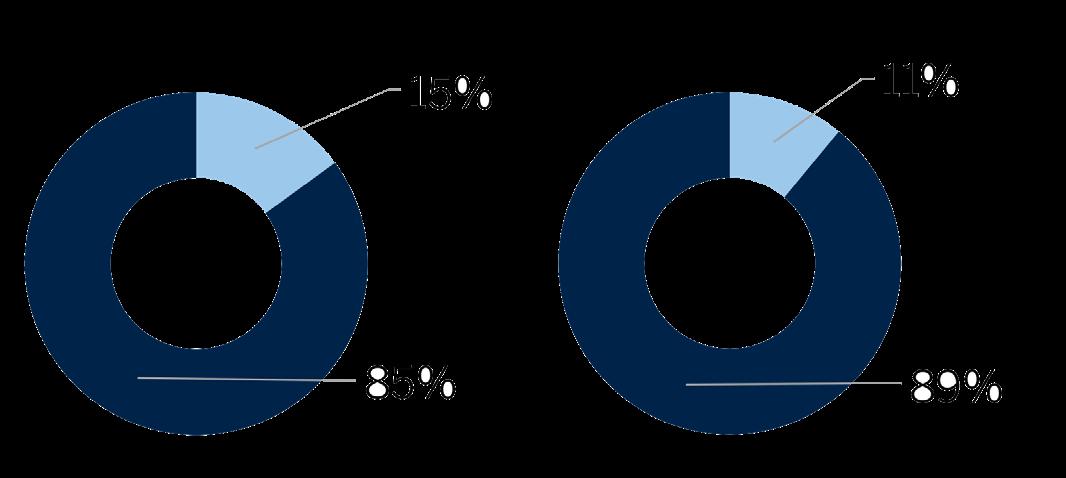
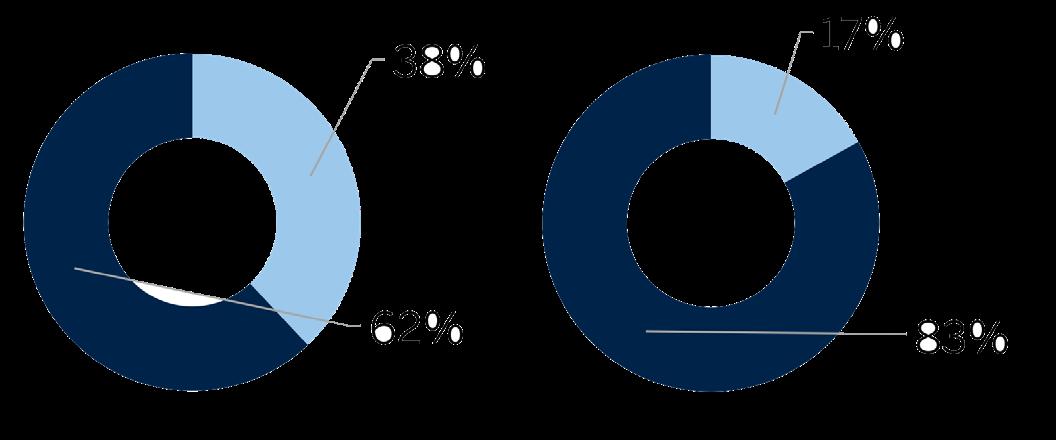
PRICE RANGE DAYS ON MARKET ABOVE LISTING PRICE AT LISTING PRICE OR LOWER
CLOSED TRANSACTIONS 4% DEC 2021 DEC 2022 ↓
2022 2021 YOY% CHANGE 2022 YOY% CHANGE 2022 YOY% CHANGE 2022 <$500,000 $403,633 $381,185 6% $300 16% 4,608 -38% 36 $500,000-$999,999 $670,580 $680,917 -2% $358 9% 4,776 6% 38 $1MM-$4.99MM $1,989,594 $2,032,730 -2% $692 13% 1,981 -21% 53 >$5MM $10,399,878 $11,110,381 -6% $1,796 7% 240 -31% 115 2022 2021 YOY% CHANGE 2022 YOY% CHANGE 2022 YOY% CHANGE 2022 MIAMI-DADE COUNTY $990,951 $1,003,510 -1% $420 13% 11,605 -22% 41 AVENTURA $2,792,577 $1,466,474 90% $668 50% 26 -60% 71 BAL HARBOUR $24,776,300 $4,883,750 407% $3,431 241% 3 -70% 423 BAY HARBOR ISLANDS $4,535,824 $3,668,065 24% $1,275 57% 17 -45% 70 COCONUT GROVE $2,520,955 $1,978,334 27% $1,141 73% 22 -73% 42 CORAL GABLES $2,810,604 $2,186,848 29% $829 36% 416 -46% 48 FISHER ISLAND N/A N/A N/A N/A N/A - N/A N/A GOLDEN BEACH $9,571,000 $6,427,186 49% $1,852 59% 10 -64% 236 INDIAN CREEK N/A $25,216,667 N/A N/A N/A - N/A N/A KEY BISCAYNE $5,181,788 $4,137,709 25% $1,358 26% 57 -54% 117 MIAMI $756,567 $724,378 4% $378 17% 5,497 -17% 40 MIAMI BEACH $5,470,225 $4,926,000 11% $1,351 27% 240 -55% 80 MIAMI SHORES $1,334,629 $1,056,824 26% $631 34% 153 -33% 35 NORTH BAY VILLAGE $1,836,149 $1,562,626 18% $812 38% 26 -38% 36 PINECREST $2,991,252 $2,166,066 38% $700 40% 195 -47% 52 SOUTH MIAMI $1,479,260 $1,154,829 28% $624 36% 102 -34% 43 SUNNY ISLES BEACH $1,924,091 $2,222,087 -13% $1,036 5% 11 -63% 94 SURFSIDE $2,347,652 $1,420,218 65% $1,036 65% 46 -47% 36
AVG SALES PRICE DAYS ON MARKET
SOLD ABOVE LISTED PRICE AVG SALES PRICE PRICE PER SF PRICE PER SF
Miami-Dade County
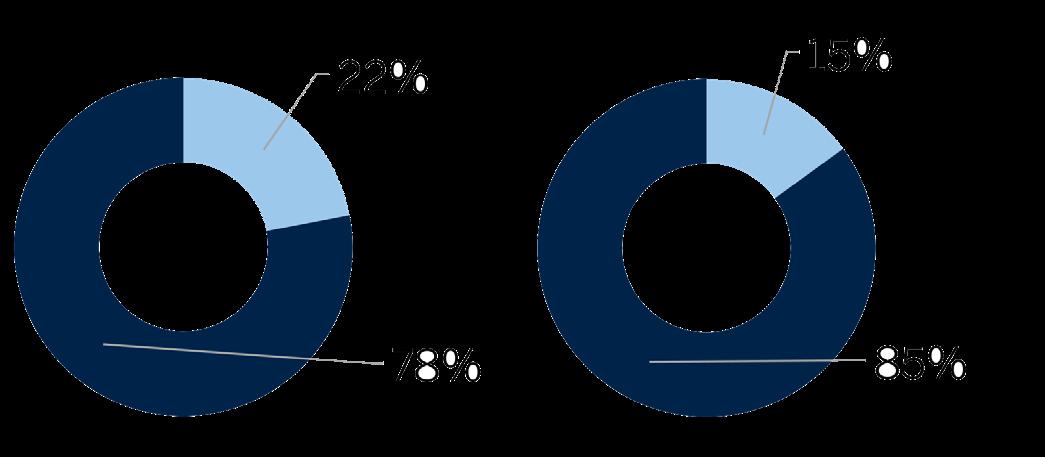
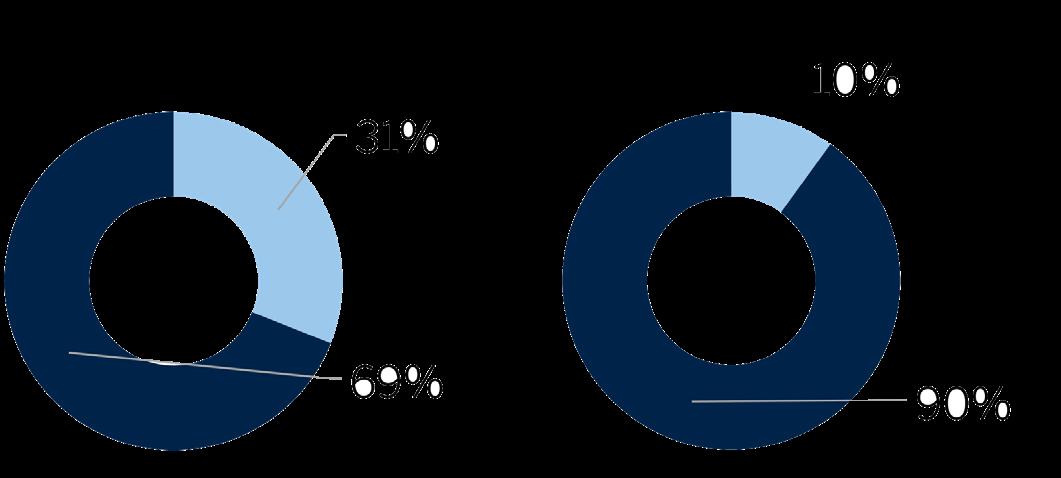
CONDOS SELLING FASTER THAN 2021
The average time on the market for units sold in 2022 fell substantially. During the year, roughly 20% of condos sold for more than the list price.
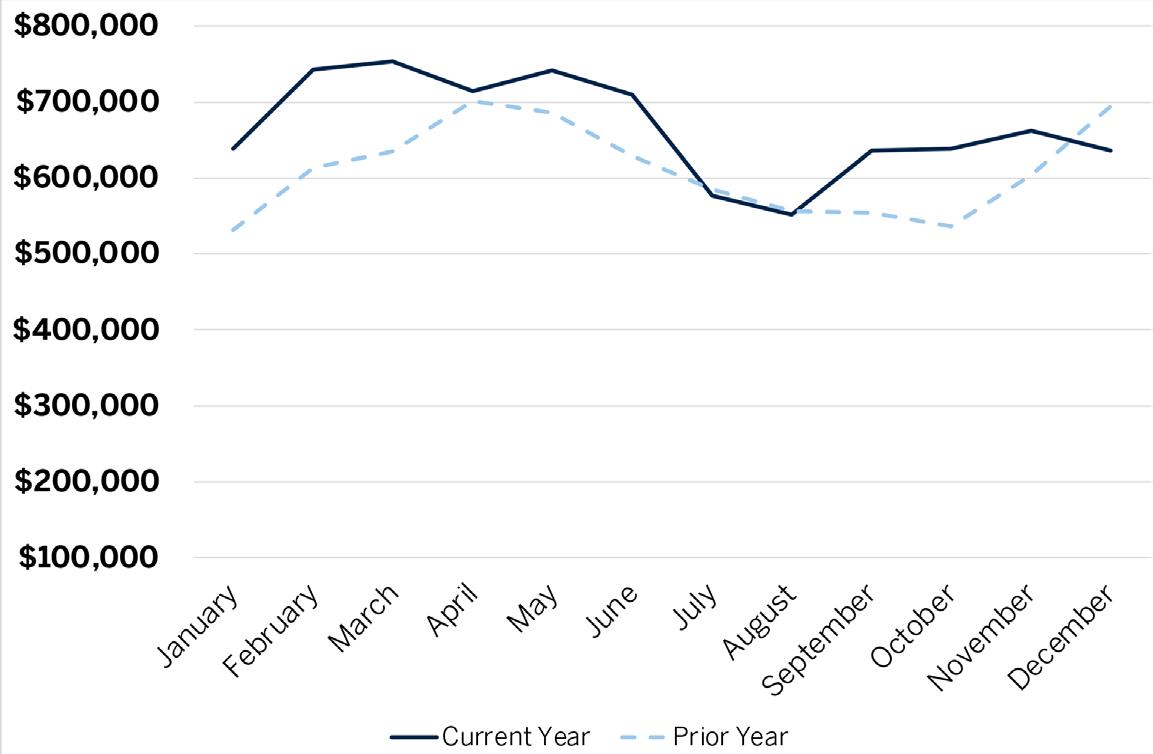
AVERAGE SALES PRICE
DAYS ON MARKET
CONDOMINIUMS
CONDOMINIUMS
Miami-Dade County
SALES BY NEIGHBORHOOD
CLOSED TRANSACTIONS
AVAILABLE LISTINGS
PRICE RANGE DAYS ON MARKET ABOVE LISTING PRICE AT LISTING PRICE OR LOWER
CLOSED TRANSACTIONS 1% DEC 2021 DEC 2022 ↓
2022 2021 YOY% CHANGE 2022 YOY% CHANGE 2022 YOY% CHANGE 2022 <$500,000 $306,023 $277,961 10% $321 17% 11,698 -26% 54 $500,000-$999,999 $688,832 $696,425 -1% $559 11% 4,084 12% 73 $1MM-$4.99MM $1,874,766 $1,903,364 -2% $941 7% 2,071 -9% 103 >$5MM $8,715,281 $8,832,446 -1% $2,218 6% 229 -12% 178 2022 2021 YOY% CHANGE 2022 YOY% CHANGE 2022 YOY% CHANGE 2022 MIAMI-DADE COUNTY $678,657 $616,706 10% $471 19% 18,082 -18% 66 AVENTURA $642,478 $527,131 22% $368 26% 1,420 -24% 73 BAL HARBOUR $2,449,816 $1,823,639 34% $1,066 27% 169 -31% 145 BAY HARBOR ISLANDS $672,468 $539,960 25% $473 27% 172 -27% 82 BRICKELL/DOWNTOWN MIAMI/EDGEWATER $804,974 $626,135 29% $608 31% 2,236 -21% 79 COCONUT GROVE $1,262,097 $1,354,492 -7% $719 10% 49 -33% 75 CORAL GABLES $778,255 $621,984 25% $531 29% 356 -15% 51 FISHER ISLAND $8,640,000 $6,404,549 35% $2,448 43% 5 -83% 31 GOLDEN BEACH N/A N/A N/A N/A N/A - N/A N/A INDIAN CREEK N/A N/A N/A N/A N/A - N/A N/A KEY BISCAYNE $1,814,641 $1,344,266 35% $929 36% 226 -50% 65 MIAMI $462,647 $391,530 18% $380 24% 5,247 -17% 49 MIAMI BEACH $963,433 $1,083,041 -11% $694 7% 2,802 -11% 90 MIAMI SHORES $300,780 $264,691 14% $277 23% 25 -22% 69 NORTH BAY VILLAGE $479,843 $329,042 46% $357 28% 229 -5% 100 PINECREST $484,713 $303,366 60% $348 27% 56 -43% 37 SOUTH MIAMI $362,028 $342,730 6% $358 19% 32 -14% 19 SUNNY ISLES BEACH $1,331,352 $1,064,912 25% $662 24% 1,077 -28% 96 SURFSIDE $2,543,794 $2,068,101 23% $1,021 14% 85 -38% 119
AVG SALES PRICE DAYS ON MARKET
SOLD ABOVE LISTED PRICE AVG SALES PRICE PRICE PER SF PRICE PER SF
Broward County
SALES SLOW MODESTLY
While fewer homes sold in 2022, the decrease was one of the smaller drops in the region. At the same time, competition fell with less homes sold at a premium to the list price.
AVERAGE SALES PRICE
DAYS ON MARKET
SINGLE-FAMILY HOMES
Broward County
SALES BY NEIGHBORHOOD
PRICE RANGE
SOLD ABOVE LISTED PRICE
AVAILABLE LISTINGS
SINGLE-FAMILY HOMES
ABOVE LISTING PRICE AT LISTING PRICE OR LOWER AVG SALES PRICE PRICE PER SF DAYS ON MARKET CLOSED TRANSACTIONS 6% DEC 2021 ↓ DEC 2022
2022 2021 YOY% CHANGE 2022 YOY% CHANGE 2022 YOY% CHANGE 2022 BROWARD COUNTY $361,515 $297,495 22% $269 25% 16,750 -17% 43 COOPER CITY $402,285 $335,443 20% $285 20% 67 -36% 17 CORAL SPRINGS $247,635 $199,267 24% $208 26% 608 -10% 27 DAVIE $286,066 $240,134 19% $221 23% 497 -30% 25 DEERFIELD BEACH $229,862 $194,074 18% $195 24% 1,161 -7% 32 FORT LAUDERDALE $777,857 $557,541 40% $471 38% 2,390 -26% 69 HALLANDALE $376,174 $305,059 23% $314 24% 1,214 -18% 63 HILLSBORO BEACH $794,835 $628,071 27% $482 35% 91 -41% 60 HOLLYWOOD $453,443 $373,261 21% $364 31% 1,423 -15% 60 LAUDERDALE-BY-THE-SEA $790,774 $631,400 25% $454 22% 203 -25% 44 LIGHTHOUSE POINT $230,089 $236,831 -3% $194 14% 120 -8% 26 MIRAMAR $330,073 $278,420 19% $257 23% 390 -20% 26 PARKLAND $537,921 $415,957 29% $313 32% 53 -37% 24 PEMBROKE PINES $268,323 $222,962 20% $220 22% 1,177 -14% 31 PLANTATION $262,314 $222,110 18% $205 17% 460 -28% 33 POMPANO BEACH $354,864 $294,853 20% $277 23% 1,397 -28% 31 SOUTHWEST RANCHES N/A N/A N/A N/A N/A - N/A N/A SUNRISE $218,362 $177,356 23% $188 27% 988 -5% 38 WESTON $369,064 $299,413 23% $274 22% 249 -31% 29 WILTON MANORS $398,659 $317,985 25% $304 24% 162 -16% 32 2022 2021 YOY% CHANGE 2022 YOY% CHANGE 2022 YOY% CHANGE 2022 <$500,000 $388,214 $367,513 6% $287 17% 5,559 -42% 32 $500,000-$999,999 $686,397 $671,390 2% $336 16% 5,918 -2% 27 $1MM-$2.99MM $1,553,991 $1,547,193 0% $521 14% 1,735 4% 42 >$3MM $5,774,785 $5,880,754 -2% $971 7% 262 -10% 98 AVG SALES PRICE DAYS ON MARKET
PRICE PER SF CLOSED TRANSACTIONS
Broward County
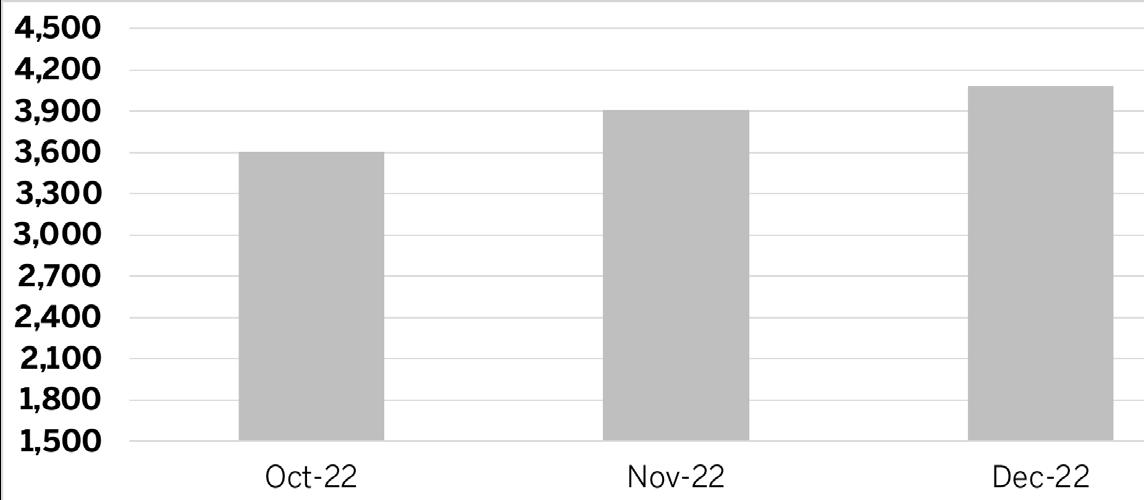
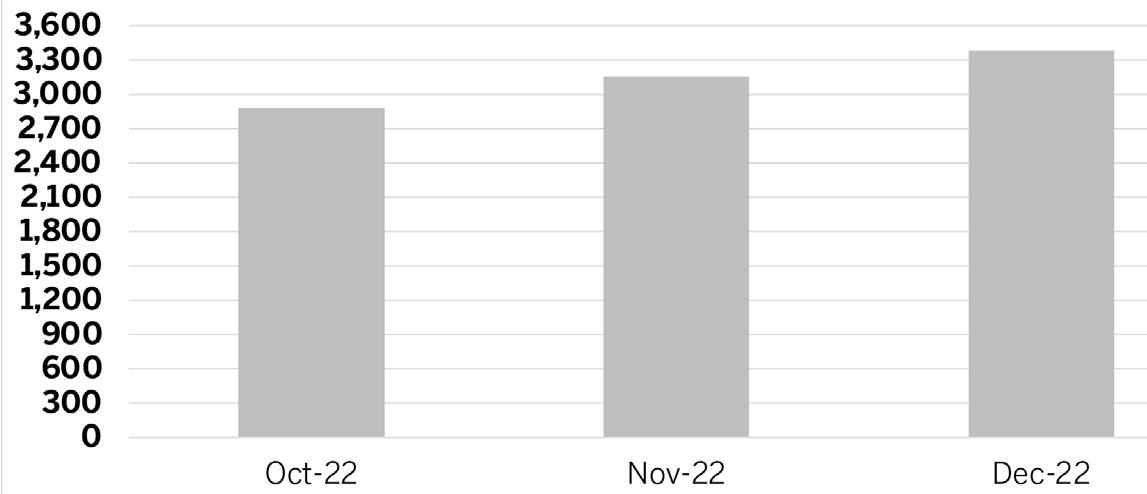
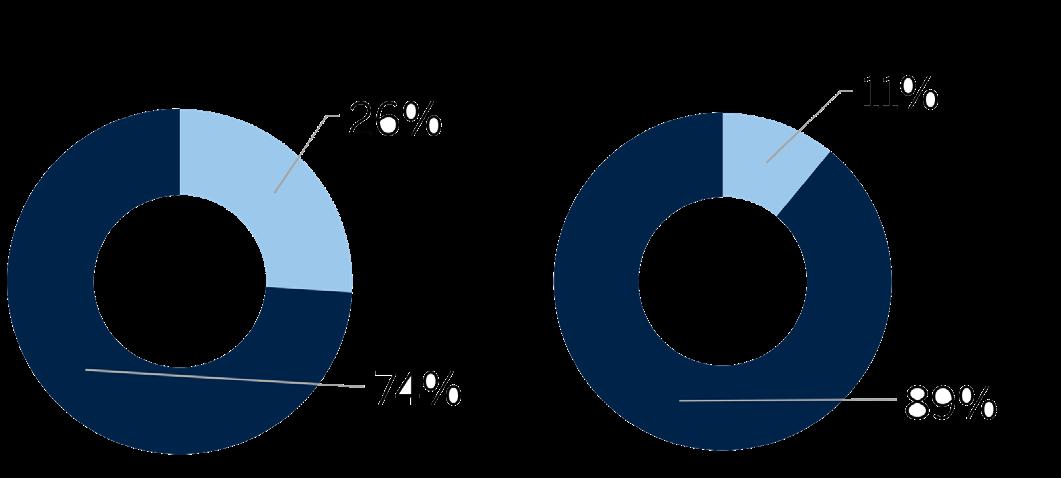
HIGHEST NUMBER OF TRANSACTIONS IN DECEMBER
While annual sales slowed in 2022, Broward County had the most condominium sales in the region for the month of December. The number of sales priced above $3 million more than doubled in 2022.

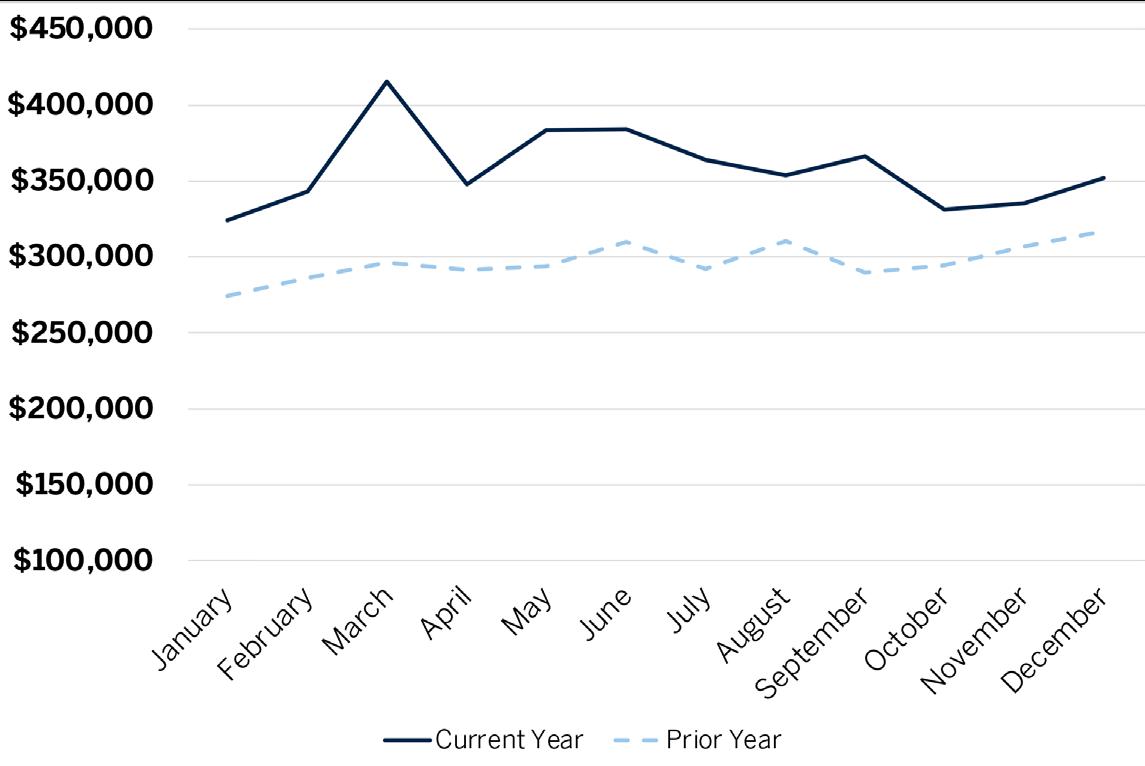
AVERAGE SALES PRICE
DAYS ON MARKET
CONDOMINIUMS
Broward County
SALES BY NEIGHBORHOOD
PRICE RANGE
AVAILABLE
ABOVE LISTING PRICE AT LISTING PRICE OR LOWER
LISTINGS SOLD ABOVE LISTED PRICE
↑4% DEC 2021 DEC 2022 CONDOMINIUMS
AVG SALES PRICE PRICE PER SF DAYS ON MARKET CLOSED TRANSACTIONS 2022 2021 YOY% CHANGE 2022 YOY% CHANGE 2022 YOY% CHANGE 2022 BROWARD COUNTY $361,515 $297,495 22% $269 25% 16,750 -17% 43 COOPER CITY $402,285 $335,443 20% $285 20% 67 -36% 17 CORAL SPRINGS $247,635 $199,267 24% $208 26% 608 -10% 27 DAVIE $286,066 $240,134 19% $221 23% 497 -30% 25 DEERFIELD BEACH $229,862 $194,074 18% $195 24% 1,161 -7% 32 FORT LAUDERDALE $777,857 $557,541 40% $471 38% 2,390 -26% 69 HALLANDALE $376,174 $305,059 23% $314 24% 1,214 -18% 63 HILLSBORO BEACH $794,835 $628,071 27% $482 35% 91 -41% 60 HOLLYWOOD $453,443 $373,261 21% $364 31% 1,423 -15% 60 LAUDERDALE-BY-THE-SEA $790,774 $631,400 25% $454 22% 203 -25% 44 LIGHTHOUSE POINT $230,089 $236,831 -3% $194 14% 120 -8% 26 MIRAMAR $330,073 $278,420 19% $257 23% 390 -20% 26 PARKLAND $537,921 $415,957 29% $313 32% 53 -37% 24 PEMBROKE PINES $268,323 $222,962 20% $220 22% 1,177 -14% 31 PLANTATION $262,314 $222,110 18% $205 17% 460 -28% 33 POMPANO BEACH $354,864 $294,853 20% $277 23% 1,397 -28% 31 SOUTHWEST RANCHES N/A N/A N/A N/A N/A - N/A N/A SUNRISE $218,362 $177,356 23% $188 27% 988 -5% 38 WESTON $369,064 $299,413 23% $274 22% 249 -31% 29 WILTON MANORS $398,659 $317,985 25% $304 24% 162 -16% 32 2022 2021 YOY% CHANGE 2022 YOY% CHANGE 2022 YOY% CHANGE 2022 <$500,000 $241,479 $217,652 11% $219 17% 14,355 -21% 37 $500,000-$999,999 $666,212 $676,609 -2% $453 13% 1,729 16% 56 $1MM-$2.99MM $1,636,357 $1,528,921 7% $729 21% 551 -5% 107 >$3MM $4,655,825 $3,906,832 19% $1,660 68% 115 150% 305 AVG SALES PRICE DAYS ON MARKET
PRICE PER SF CLOSED TRANSACTIONS
Palm Beach County
PRICE LEADER
The median price increase led the southeast Florida region, reaching 21% in 2022. Sales activity in the $1 million to $5 million range were on par with the previous year.
AVERAGE SALES PRICE
DAYS ON MARKET
SINGLE-FAMILY HOMES
Palm Beach County
SALES BY NEIGHBORHOOD
PRICE RANGE
AVAILABLE
ABOVE LISTING PRICE AT LISTING PRICE OR LOWER 6% DEC 2021 DEC 2022 ↓
LISTINGS SOLD ABOVE LISTED PRICE
AVG SALES PRICE PRICE PER SF DAYS ON MARKET CLOSED TRANSACTIONS 2022 2021 YOY% CHANGE 2022 YOY% CHANGE 2022 YOY% CHANGE 2022 PALM BEACH COUNTY $1,039,418 $975,927 7% $383 22% 12,839 -27% 33 BOCA RATON $1,268,418 $1,154,664 10% $423 24% 2,003 -31% 32 BOYNTON BEACH $580,561 $480,170 21% $281 26% 1,922 -10% 26 DELRAY BEACH $1,147,650 $1,123,671 2% $422 25% 1,144 -27% 34 HIGHLAND BEACH $15,325,455 $9,378,513 63% $1,628 29% 11 -50% 75 JUNO BEACH $2,367,250 $1,485,214 59% $781 45% 12 -57% 46 JUPITER $1,376,586 $1,233,962 12% $499 28% 812 -27% 32 JUPITER INLET COLONY $8,786,500 $3,641,562 141% $1,902 58% 6 -14% 63 LAKE PARK $420,475 $347,821 21% $269 30% 48 -16% 34 LAKE WORTH $571,712 $465,574 23% $270 23% 1,229 -28% 30 LANTANA $901,948 $836,341 8% $358 10% 109 -22% 40 NORTH PALM BEACH $2,134,384 $2,643,112 -19% $601 7% 120 -39% 38 MANALAPAN $8,303,571 $1,150,000 -59% $1,764 4% 7 -63% $90 PALM BEACH $15,407,038 $11,981,074 29% $3,366 55% 71 -51% 74 PALM BEACH GARDENS $1,356,055 $1,149,957 18% $439 30% 815 -36% 35 SINGER ISLAND $2,859,615 $1,460,787 96% $940 75% 13 -61% 17 TEQUESTA $1,716,623 $1,462,469 17% $606 19% 63 -26% 33 WELLINGTON $1,244,670 $1,058,062 18% $405 27% 754 -33% 46 WEST PALM BEACH $750,552 $616,391 22% $342 26% 1,634 -28% 36 2022 2021 YOY% CHANGE 2022 YOY% CHANGE 2022 YOY% CHANGE 2022 <$500,000 $386,699 $366,542 5% $246 16% 4,331 -49% 31 $500,000-$999,999 $691,813 $678,402 2% $326 17% 5,805 -3% 28 $1MM-$4.99MM $1,917,032 $1,993,337 -4% $581 11% 2,430 -4% 42 >$5MM $10,974,136 $11,444,902 -4% $1,986 25% 273 -35% 88 AVG SALES PRICE DAYS ON MARKET
PRICE PER SF CLOSED TRANSACTIONS SINGLE-FAMILY HOMES
Palm Beach County
HIGH-PRICED CONDOS PACE COUNTY
Sales of condos priced greater than $5 million increased in the last year while overall sales were lower. The average price per square foot in the upper-price tier increased by nearly 20%.

AVERAGE SALES PRICE
DAYS ON MARKET
CONDOMINIUMS
Palm Beach County
SALES BY NEIGHBORHOOD
PRICE RANGE
AVAILABLE
ABOVE LISTING PRICE AT LISTING PRICE OR LOWER 7% DEC 2021 DEC 2022 ↓
LISTINGS SOLD ABOVE LISTED PRICE
AVG SALES PRICE PRICE PER SF DAYS ON MARKET CLOSED TRANSACTIONS 2022 2021 YOY% CHANGE 2022 YOY% CHANGE 2022 YOY% CHANGE 2022 PALM BEACH COUNTY $463,267 $402,321 15% $254 19% 12,778 -27% 32 BOCA RATON $507,503 $489,092 4% $273 11% 2,293 -32% 37 BOYNTON BEACH $308,843 $224,196 38% $180 33% 1,330 -23% 29 DELRAY BEACH $350,778 $270,734 30% $199 25% 1,948 -23% 29 HIGHLAND BEACH $1,200,741 $939,501 28% $584 29% 201 -38% 45 JUNO BEACH $1,024,869 $675,709 52% $574 58% 86 -48% 27 JUPITER $630,134 $470,765 34% $372 33% 662 -37% 22 JUPITER INLET COLONY N/A N/A N/A N/A N/A - N/A N/A LAKE PARK $266,680 $241,612 10% $165 -3% 66 29% 30 LAKE WORTH $229,500 $180,934 27% $148 25% 717 -18% 31 LANTANA $292,502 $264,408 11% $182 14% 112 -18% 31 NORTH PALM BEACH $602,658 $561,877 7% $288 6% 278 -33% 35 MANALAPAN N/A N/A N/A N/A N/A - N/A N/A PALM BEACH $2,159,913 $1,450,317 49% $923 38% 297 -42% 50 PALM BEACH GARDENS $496,885 $395,712 26% $282 27% 619 -33% 24 SINGER ISLAND $1,165,871 $1,129,171 3% $560 20% 130 -52% 55 TEQUESTA $895,825 $414,723 116% $484 84% 80 -40% 22 WELLINGTON $467,904 $373,985 25% $285 30% 184 -26% 31 WEST PALM BEACH $318,210 $290,515 10% $184 19% 2,182 -26% 32 2022 2021 YOY% CHANGE 2022 YOY% CHANGE 2022 YOY% CHANGE 2022 <$500,000 $256,040 $223,737 14% $165 15% 10,102 -30% 30 $500,000-$999,999 $684,322 $682,862 0% $406 5% 1,769 -8% 32 $1MM-$4.99MM $1,951,369 $1,917,017 2% $865 14% 848 -23% 54 >$5MM $7,928,626 $7,593,153 4% $2,080 19% 59 7% 62 AVG SALES PRICE DAYS ON MARKET
PRICE PER SF CLOSED TRANSACTIONS CONDOMINIUMS
To Live Exquisite is to Live Extraordinary.
Situated along the beautiful coastline of South Brickell, The St. Regis Residences, Miami epitomize elegant living. It mirrors the sensibilities of those who are driven by connoisseurship, demand excellence, respect tradition and value individuality above all else.
St. Regis represents a future propelled by a historic past. It’s a place where new generations will create lifetimes of legendary moments, in one-of-a-kind homes for individuals who perceive their personal legacies innately intertwined with the rich heritage of Miami.
Future Residences Located 1809 Brickell Avenue Miami, Florida 33129
soffits, lighting, countertops, floor plans, specifications, or art are proposed only, and the Developer reserves the right to modify, revise, or withdraw any or all of the same in its sole discretion. Pursuant to license agreements, and for so long as the license agreement governing use of a name is not terminated or expired, Developer has a right to use the trade names, marks, and logos of: (1) St Regis; (2) St. Regis Residences; (3) The Related Group; and (3) Integra Investments, LLC, each of which is a licensor and none of which is the Developer. Marriott International, Inc. is not responsible for the marketing, development, or sales of the Condominium. Consult the Developer’s Prospectus for the proposed budget, terms, conditions, specifications, fees, and Unit dimensions. The Developer is not incorporated in, located in, nor a resident of, New York. This is not intended to
an offer
sell, or solicitation


an offer to buy, condominium units in New York or to residents of New York, or of any other jurisdiction were prohibited

ORAL REPRESENTATIONS CANNOT BE RELIED UPON AS CORRECTLY STATING REPRESENTATIONS OF THE DEVELOPER. FOR CORRECT REPRESENTATIONS, MAKE REFERENCE TO THE DOCUMENTS REQUIRED BY SECTION 718.503, FLORIDA STATUTES, TO BE FURNISHED BY A DEVELOPER TO A BUYER OR LESSEE. The St. Regis Residences, Miami East Tower a condominium within The St. Regis Residences, Miami (the “Condominium”) is developed by 1809 Brickell Property Owner, LLC (“Developer”) and this offering is made only by the Developer’s Prospectus for the Condominium. Sketches, renderings, or photographs depicting lifestyle, amenities, food services, club services, rental services, hosting services, finishes, designs, materials, furnishings, fixtures, appliances, cabinetry,
by
2022 © 1809 Brickell
all rights reserved.
be
to
of
law.
Property Owner, LLC, with

xFor unmatched © 2022 ONE Sotheby’s International Realty. All rights reserved. Sotheby’s International Realty® and the Sotheby’s International Realty Logo are service marks licensed to Sotheby’s International Realty Affiliates LLC and used with permission. ONE Sotheby’s International Realty fully supports the principles of the Fair Housing Act and the Equal Opportunity Act. Each franchise is independently owned and operated. Any services or products provided by independently owned and operated franchisees are not provided by, affiliated with or related to Sotheby’s International Realty Affiliates LLC nor any of its affiliated companies. The information contained herein is deemed accurate but not guaranteed.
