MERRYLANDS MARKET ASSESSMENT

February 2022
Client: ALAND
This report is dated February 2022 and incorporates information and events up to that date only and excludes any information arising, or event occurring, after that date which may affect the validity of Urbis Pty Ltd’s (Urbis) opinion in this report. Urbis prepared this report on the instructions, and for the benefit only, of ALAND (Instructing Party) for the purpose of a Market Assessment (Purpose) and not for any other purpose or use. Urbis expressly disclaims any liability to the Instructing Party who relies or purports to rely on this report for any purpose other than the Purpose and to any party other than the Instructing Party who relies or purports to rely on this report for any purpose whatsoever (including the Purpose).
In preparing this report, Urbis was required to make judgements which may be affected by unforeseen future events including wars, civil unrest, economic disruption, financial market disruption, business cycles, industrial disputes, labour difficulties, political action and changes of government or law, the likelihood and effects of which are not capable of precise assessment.
All surveys, forecasts, projections and recommendations contained in or made in relation to or associated with this report are made in good faith and on the basis of information supplied to Urbis at the date of this report. Achievement of the projections and budgets set out in this report will depend, among other things, on the actions of others over which Urbis has no control.
Urbis has made all reasonable inquiries that it believes is necessary in preparing this report but it cannot be certain that all information material to the preparation of this report has been provided to it as there may be information that is not publicly available at the time of its inquiry.
In preparing this report, Urbis may rely on or refer to documents in a language other than English which Urbis will procure the translation of into English. Urbis is not responsible for the accuracy or completeness of such translations and to the extent that the inaccurate or incomplete translation of any document results in any statement or opinion made in this report being inaccurate or incomplete, Urbis expressly disclaims any liability for that inaccuracy or incompleteness.
This report has been prepared with due care and diligence by Urbis and the statements and opinions given by Urbis in this report are given in good faith and in the belief on reasonable grounds that such statements and opinions are correct and not misleading bearing in mind the necessary limitations noted in the previous paragraphs. Further, no responsibility is accepted by Urbis or any of its officers or employees for any errors, including errors in data which is either supplied by the Instructing Party, supplied by a third party to Urbis, or which Urbis is required to estimate, or omissions howsoever arising in the preparation of this report, provided that this will not absolve Urbis from liability arising from an opinion expressed recklessly or in bad faith.
Urbis staff responsible for this report were:
Director Clinton Ostwald
Associate Director Alex Stuart, Fraser Brown
Senior Consultant Jennifer Williams
Consultant Ryan Wallis
Project code P0038116
Report number 1
© Urbis Pty Ltd
ABN 50 105 256 228
All Rights Reserved. No material may be reproduced without prior permission.
You must read the important disclaimer appearing within the body of this report.
23/02/2022 Merrylands Market Assessment Page 2
COVID-19 AND THE POTENTIAL IMPACT ON DATA INFORMATION
The data and information that informs and supports our opinions, estimates, surveys, forecasts, projections, conclusion, judgments, assumptions and recommendations contained in this report (Report Content) are predominantly generated over long periods, and is reflective of the circumstances applying in the past. Significant economic, health and other local and world events can, however, take a period of time for the market to absorb and to be reflected in such data and information. In many instances a change in market thinking and actual market conditions as at the date of this report may not be reflected in the data and information used to support the Report Content.

The recent international outbreak of the Novel Coronavirus (COIVID-19), which the World Health Organisation declared a global health emergency in January 2020 and pandemic on 11 March 2020, is causing a material impact on the Australian and world economies and increased uncertainty in both local and global market conditions.
The effects (both directly and indirectly) of the COVID-19 Outbreak on the Australian real estate market and business operations is currently unknown and it is difficult to predict the quantum of the impact it will have more broadly on the Australian economy and how long that impact will last. As at March 2020, the COVID-19 Outbreak is materially impacting global travel, trade and near-term economic growth expectations. Some business sectors, such as the retail, hotel and tourism sectors, are already reporting material impacts on trading performance now and potentially into the future. For example, Shopping Centre operators are reporting material reductions in foot traffic numbers, particularly in centres that ordinarily experience a high proportion of international visitors.
The Report Content and the data and information that informs and supports it is current as at the date of this report and (unless otherwise specifically stated in the Report) necessarily assumes that, as at the date of this report, the COVID-19 Outbreak has not materially impacted the Australian economy, the asset(s) and any associated business operations to which the report relates and the Report Content. However, it is not possible to ascertain with certainty at this time how the market and the Australian economy more broadly will respond to this unprecedented event. It is possible that the market conditions applying to the asset(s) and any associated business operations to which the report relates and the business sector to which they belong could be (or has been) materially impacted by the COVID-19 Outbreak within a short space of time and that it will have a lasting impact. Clearly, the COVID19 Outbreak is an important risk factor you must carefully consider when relying on the report and the Report Content.
Any Report Content addressing the impact of the COVID-19 Outbreak on the asset(s) and any associated business operations to which the report relates or the Australian economy more broadly is (unless otherwise specifically stated in the Report) unsupported by specific and reliable data and information and must not be relied on.
To the maximum extent permitted by law, Urbis (its officers, employees and agents) expressly disclaim all liability and responsibility, whether direct or indirect, to any person (including the Instructing Party) in respect of any loss suffered or incurred as a result of the COVID-19 Outbreak materially impacting the Report Content, but only to the extent that such impact is not reflected in the data and information used to support the Report Content.
23/02/2022 Merrylands Market Assessment Page 3
23/02/2022 Merrylands Market Assessment Page 4 Executive Summary 5 Introduction 8 Residential Assessment 12 Demographics 13 Supply 21 Competitor Analysis 25 Demand 32 Retail Assessment 42 Scheme Assessment 43 Trade Area and Spending 50 Competition 55 Case Studies and Success Factors 58 Composition and Performance 67 Office Assessment 72
CONTENTS
EXECUTIVE SUMMARY
23/02/2022 Merrylands Market Assessment Page 5
EXECUTIVE SUMMARY
Project Background
ALAND owns a large development site at 224-240 Pitt Street, Merrylands. ALAND requires market evidence to inform the design of the project and ensure that the offer meets market needs. Urbis has been engaged to assess the market potential for key land uses including residential apartments, retail and office.
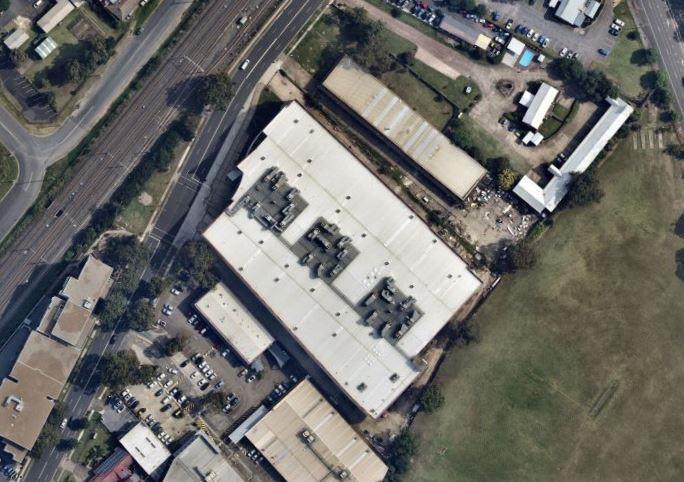
Subject Site
The subject site is located adjacent to the Merrylands railway station. The site is relatively well located in regard to local amenity, including retail/entertainment, public transport and employment centres. The development is proposed to comprise retail and open space which will increase amenity available to future residents.
Residential Assessment
Merrylands is a relatively lower socio-economic area of Sydney. Affordability is, therefore, a key driver of the dwelling market, especially for apartments which compete with older townhouses and houses.
Key residential drivers such as public transport, major shopping centres, hospitals, schools and employment precincts have supported the Merrylands apartment market. Overall, the Study Area has averaged around 840 new apartment sales per year, over the past four years.
Residential apartments are supported on the subject site with key findings/recommendations comprising:
• Take-Up: Based on historical and projected demand and competition, the Subject Site could achieve a sales rate of around 30-40 per year (about three per month) in 2023 and pick up to 5-7 per month as the Sydney population recovers from COVID-19. However, there is a risk that the launch of major master-planned projects around the area could increase competition and impact take-up.
• Buyer Mix: It is anticipated that most buyers will be first home buyers, or investors, followed by downsizers.
• Mix: Recommended that most apartments in the development contain two bedrooms and two bathrooms. This product is attractive to both younger
couples and investors, which are likely to be the major buyer segments for the project. One-bedroom apartments are also attractive to some first home buyers and investors, although the majority would be looking for two bedrooms due to the relative affordability in the market. Three-bedroom apartments should account for under 10% of dwellings, with downsizers likely to account for a smaller segment of buyers and families being attracted to affordable townhouses in the area.
• Apartment Sizes and Positioning: The recommended internal sizes shown below are based on a comparison with recent projects with consideration that smaller sizes would assist with affordability.
• Prices: The prices are indicative and will depend on many factors, such as the final design and quality of the project. The project's projected sales prices in $2022 have been estimated based on recent off-the-plan prices and new apartment resales in the area. The prices also consider competition from older house stock, which are an attractive alternative to buyers of three-bedroom apartments (particularly families). The median price for a house in Merrylands was $1.04M in the year to February 2022 with starting prices at around $775,000 for lower quality stock. As such, keeping three bedroom prices at the lower end of the house scale will be important to maintain affordability.
Mix and Indicative Pricing
23/02/2022 Merrylands Market Assessment Page 6
Type Mix Internal Size (sq.m) Indicative Price ($2022) Studio, 0-1 Car 0-5% 40-45 $370,000 - $410,000 1 Bed, 1 Car 25-35% 55-65 $450,000 - $520,000 2 Bed, 2 Bath, 1 Car 60-70% 75-85 $620,000 - $710,000 3 Bed, 2 Bed, 1-2 Car 5-10% 90-110 $770,000 - $880,000
Source: Urbis
EXECUTIVE SUMMARY
Retail Assessment
Key Findings
The retail trade area population is estimated at 15,240 at 2022 and is expected to add an additional 5,390 people over the next five years at a growth rate of 6.2% per annum. The strong growth is driven by on-site development and other high density apartment stock coming online in Merrylands. By 2037, the trade area is expected to grow to 24,230, including over 2,800 on-site residents.
There is significant provision of retail floorspace within the Merrylands Town Centre, with Stockland Merrylands located directly opposite the subject site. While there are no other strictly defined shopping centres in the primary trade area, the adjacent Merrylands Road and McFarlane Road have a large provision of strip retail.
ALAND is proposing to develop up to 3,500 sq.m of retail floorspace across the site including some floorspace fronting Pitt Street and the majority of tenancies located within the site and away from key pedestrian thoroughfares.
At 3,500 sq.m, the proposed scheme is large given there is no clear anchor, significant competition from Stockland Merrylands and strip retail along Merrylands Road. A large provision of specialties with no anchor presents high leasing risk, particularly for tenants in secondary locations on Site A&B with limited exposure.
Recommendations
Giving regard to ALAND’s proposed scheme, the strengths and weaknesses of the subject site and the competitive context in Merrylands, Urbis make the following recommendations:
• It is recommended that the quantum of retail floorspace is scaled back to primarily occupy Site C. The lack of exposure and large provision of specialty floorspace in Site A&B creates high leasing risk and it is likely these tenants would underperform. Furthermore, the lack of a clearly defined anchor tenant limits the ability for a large retail provision to be supported on the site.
• A national brand tenant (such as Chemist Warehouse) should be targeted to occupy the larger tenancy in Building A to act as a draw card for the rest of the precinct and minimise leasing risk.
• Supporting retail on Site A&B is very challenging. Activation of the public space and a new road linking the site to Neil Street could help increase foot
traffic, particularly for those tenancies fronting the new road in the middle of the site that don’t benefit from patronage on Pitt Street. This would rely on residents in apartments to the north of Neil Street being able to cross the street and walk through the site to the train station.
Office Assessment
Total jobs within the Cumberland LGA are expected to grow from 84,300 in 2021 to 97,800 by 2031, equating to an additional 13,500 jobs. Office jobs are expected to account for 3,300 of these additional jobs over this period. Applying an office job density of 15 sq.m per worker equates to an estimated 55,400 sq.m of office floorspace demand by 2031. Given that the concept plans provide for around 1,225 sq.m of office space at the subject site, this would account for 2.2% of demand for additional office space in the Cumberland LGA in 2031.
A market share of 5% is considered reasonable, given that the subject site lies within the Merrylands town centre and is close to the Merrylands train station. Therefore, the Subject Site should support the proposed amount of office space by 2024-25.
The subject site is not well suited for traditional office-based industries such as finance and insurance or administrative and support services; however, it could attract government service tenants, real estate agents and managers, solicitors and tax agents. There is also potential for alternative uses that could be explored on the site, including education/training or medical tenants.
23/02/2022 Merrylands Market Assessment Page 7
INTRODUCTION
23/02/2022 Merrylands Market Assessment Page 8
INTRODUCTION
Project Background
ALAND owns a large development site at 224-240 Pitt Street, Merrylands (“Subject Site”). ALAND requires market evidence to inform the final design of the project to ensure that the offer meets the market needs.
Urbis has been engaged to assess the market potential for the following land uses:
• Residential apartments
• Retail
• Office.
The table below shows the scheme that is compliant with current planning controls and a proposed scheme based on changing the FSR and height currently allowable for building site J2.
ALAND has advised that they are also considering the potential increase in ground floor retail space across Site A&B to around 2,000 sq.m, which would take total retail floorspace across the site to around 3,500 sq.m.
23/02/2022 Merrylands Market Assessment Page 9 Compliant Scheme Proposed Scheme Site Building Residential Units (no.) Retail (sq.m) Commercial (sq.m) Residential Units (no.) Retail (sq.m) Commercial (sq.m) C A 177 821 1,225 177 821 1,225 C B 165 592 165 592 C C (D) 23 78 23 78 A&B F1 180 180 A&B F2 54 305 54 305 A&B G 32 32 A&B H 127 127 A&B I 95 95 A&B J1 81 81 A&B J2 78 258 230 258 Total 10 1,012 2,054 1,225 1,164 2,054 1,225
The Scheme
SUBJECT SITE
Key Findings
The subject site is located at 224-240 Pitt Street, Merrylands and comprises an area of around 2.4 hectares.
The site is located at the northern gateway to the Merrylands Railway Station.
Surrounding land uses comprise:
• Railway land and the Sydney Trains T2 Inner West and Leppington and T5 Cumberland railway lines to the east and south
• The Merrylands town centre to the west including Stocklands Merrylands on the western side of Pitt Street.
• Retail, commercial and residential apartments to the north
The majority of higher density residential apartments and taller buildings in Merrylands are currently located along McFarland Street, Neil Street, Pitt Street, Dressler Close, Merrylands Road, Treves Street and along the railway line.
Subject Site
23/02/2022 Merrylands Market Assessment Page 10 Site C Sites A&B
DRAFT PLANS
Key Characteristics
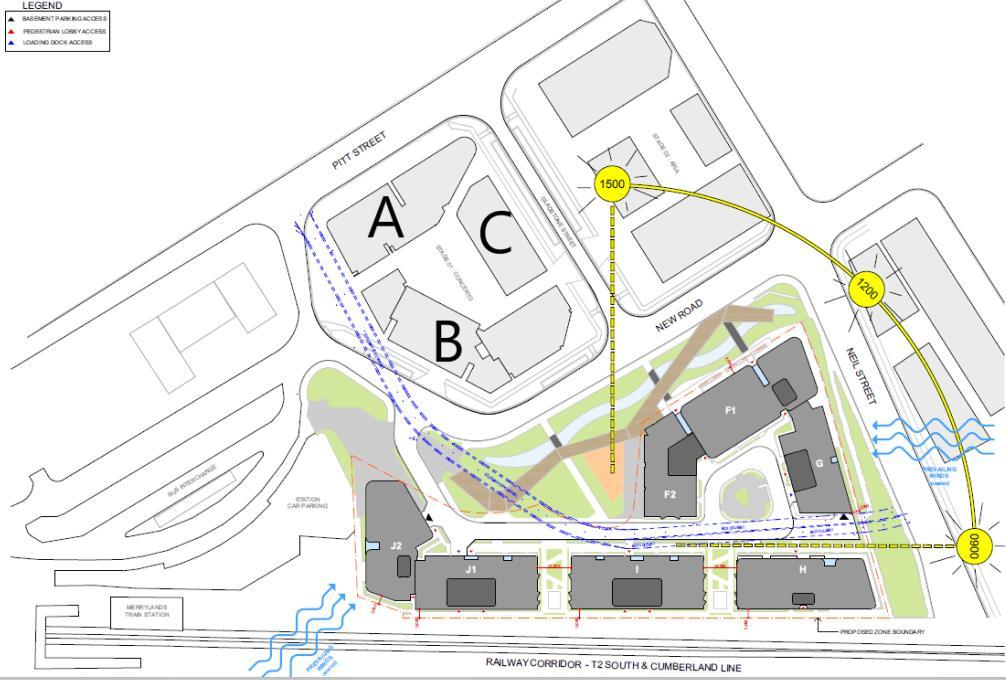
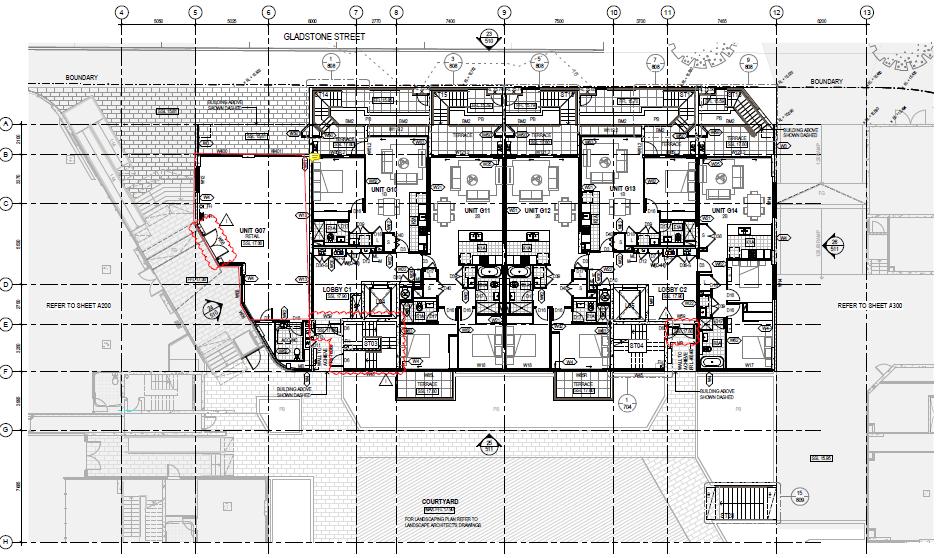
The draft plans for the mixed-use development comprise ten buildings surrounding a new central public park and civic space on the site. Two new roads linking Neil Street to Pitt Street will separate the buildings in Site A&B and Site C.
Site C is proposed to consist of three buildings (A, B and C) with a total of 365 residential units.
• Studio: 4.7%
• 1 Bed: 26.8%
•
2 Bed: 60.0%
• 3 Bed: 8.5%
These buildings will include retail tenancies on the ground floor (1,491 sq.m) above five levels of basement car parking 460 for cars. Building A also contains 1,225 sq.m of commercial office space. The proposed apartment mix includes:
Site A&B is proposed to contain seven buildings including 799 residential units above between 550 – 2,000 sq.m of retail space. The proposed scheme would change the compliant height and FSR for Building J2 from 16 storeys to 25 storeys.
Draft Plans - Ground Level
23/02/2022 Merrylands Market Assessment Page 11 Site Studio, 1 bath, 1 car 1 bed, 1 bath, 1 car 1 bed, 1 bath, 2 car 1 bed + media or study, 1 bath, 1 car 2 bed, 1 bath, 1 car 2 bed, 2 bath, 1 car 2 bed, 2 bath, 2 car 2 bed + media or study, 2 bath, 1 car 2 bed + media or study, 2 bath, 2 car 3 bed, 2 bath, 2 car 3 bed + media, 2 bath, 2 car C 17 43 2 53 19 128 8 51 13 30 1
Site C Sites A&B
RESIDENTIAL ASSESSMENT

12
DEMOGRAPHICS
23/02/2022 Merrylands Market Assessment Page 13
MOVER ANALYSIS
Migration Trends
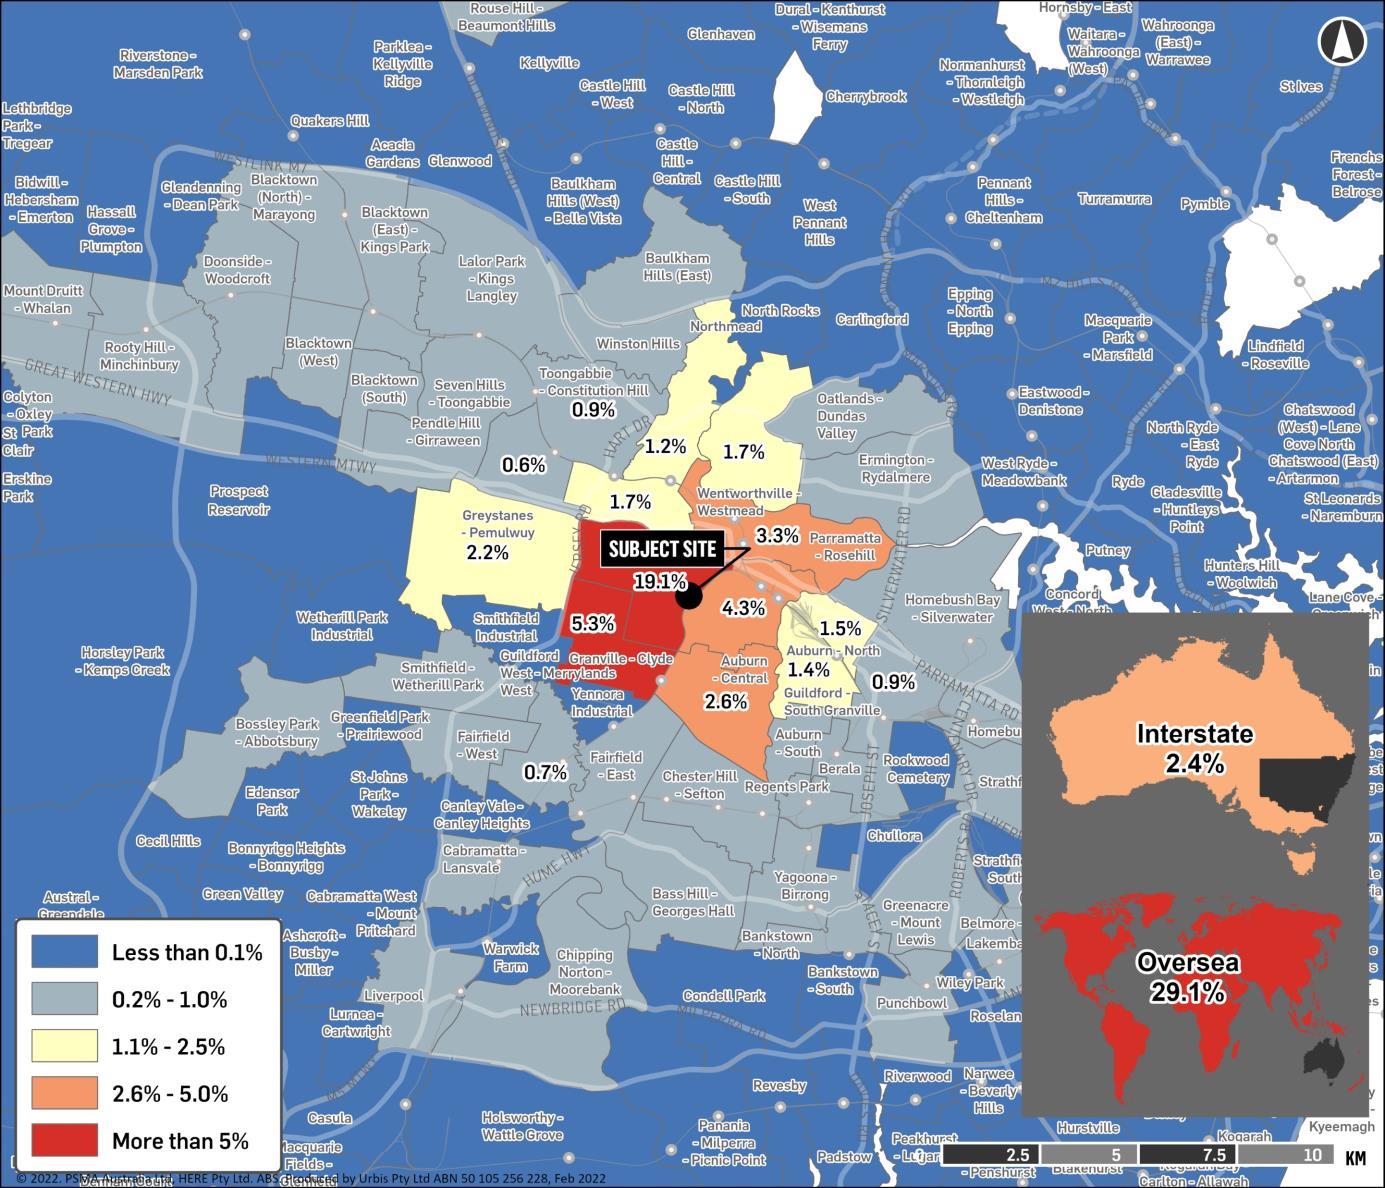
The map outlines migration statistics for the subject site location. Specifically, the map shows the place of residence for current 2016 Merrylands - Holroyd Statistical Area 2 (SA2) residents in 2011. The findings are used to inform the Study Area analysis by indicating where people have moved from and what areas may be considered to be comparable to the subject site. Key findings from the map include:
• Approximately 19.1% of residents who moved to a new address in the Merrylands - Holroyd SA2 in 2016 previously resided in another address within the Merrylands - Holroyd SA2 in 2011. This highlights the propensity for people to move locally as they have established connections to the area.
• Around 29.1% of current 2016 MerrylandsHolroyd residents (that changed address) resided overseas in 2011, which is above the Sydney average and indicates the market will have a high portion of overseas residents.
• The other most common SA2s where 2016 Merrylands - Holroyd residents previously lived include:
• Guildford West - Merrylands West (5.3%)
• Granville – Clyde (4.3%)
• Parramatta – Rosehill (3.3%).
• The majority of local migration to the MerrylandsHolroyd area has come from the surrounding SA2s within the Cumberland and Parramatta LGAs. The map highlights that the migration has been relatively localised. Employment and cost of housing are likely to be key drivers of this movement data.
Migration Data
23/02/2022 Merrylands Market Assessment Page 14
STUDY AREA
Definition
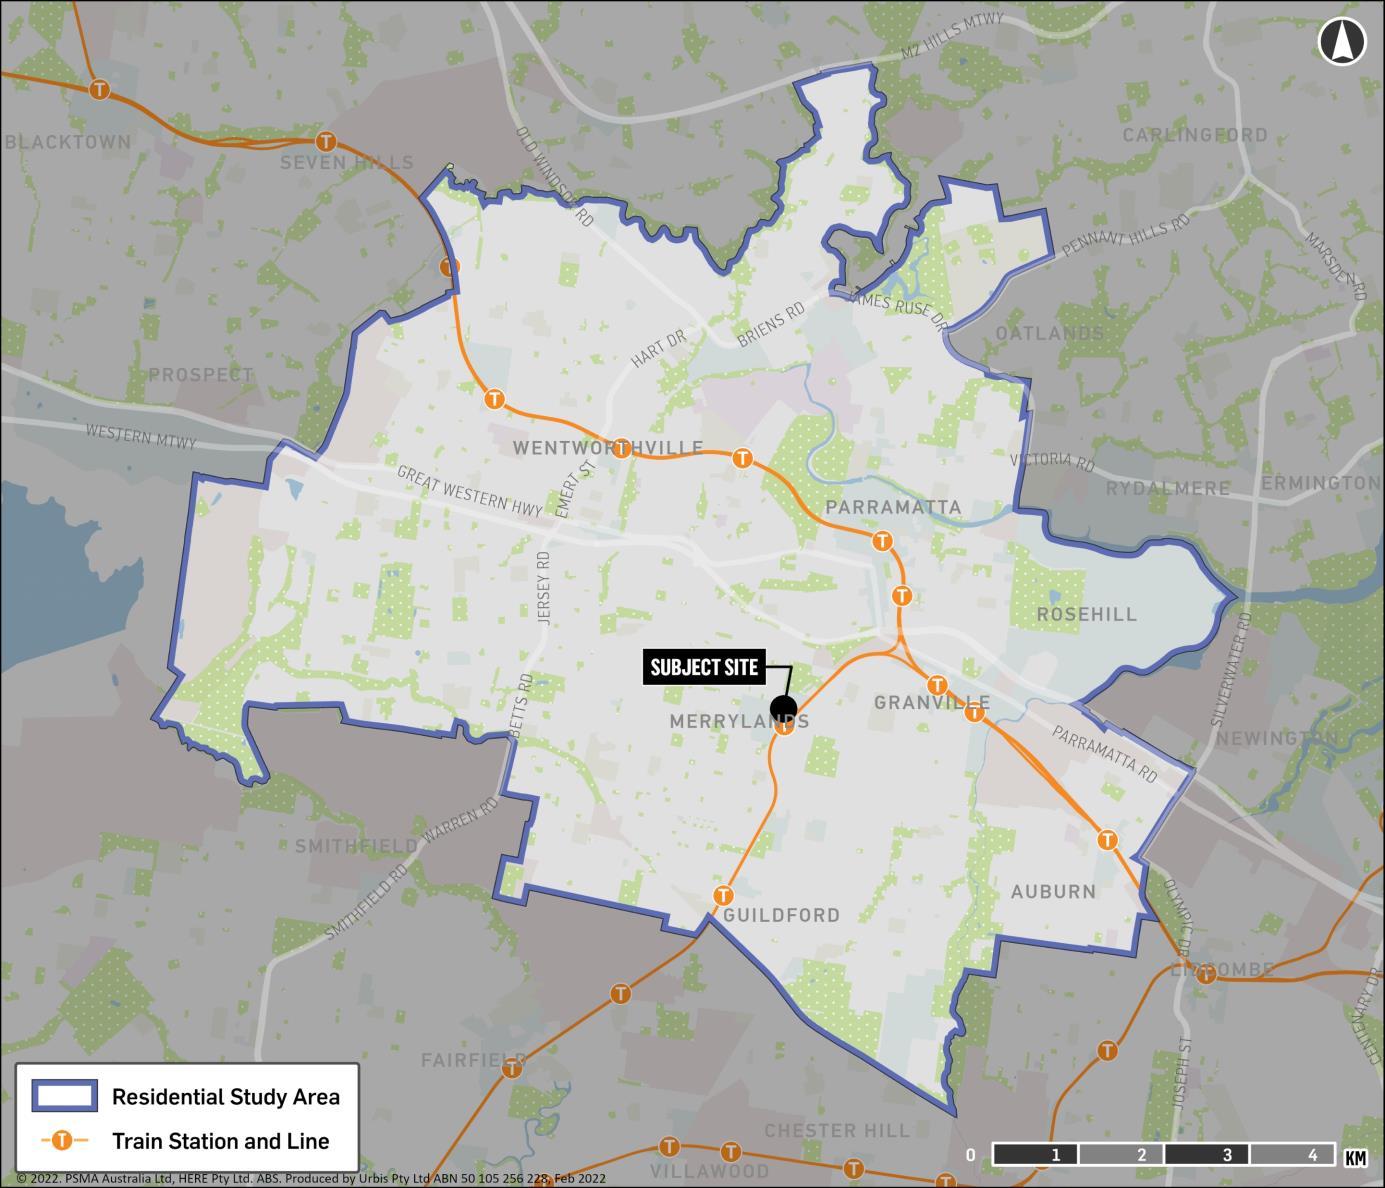
The map opposite outlines the Study Area that has been adopted for the assessment of the residential market. The Study Area is generally bounded by:
• The Smithfield, Wetherill Park and Yennora Industrial areas to the south
• Prospect Reservoir to the west
• The M2 and Seven Hills Industrial Area to the north
• Silverwater Industrial Area, Parramatta and Duck Rivers to the east.
The Study Area indicates that Merrylands is part of the Parramatta residential market, comprising primarily of the Cumberland and Parramatta LGAs (as highlighted by the migration analysis). The Study Area also aligns with the recent buyer profile of apartment projects in the Merrylands Study Area, which have generally attracted a large proportion of local buyers.
Study Area
23/02/2022 Merrylands Market Assessment Page 15
HISTORICAL POPULATION GROWTH
Growth Trends
The rate and extent of future population growth in the Study Area will have a substantial bearing on future demand for residential dwellings.
The population in the Study Area has recorded growth from 249,232 in 2011 to 300,963 in 2020 at an average growth rate of 2.1%.
From 2019-2020, population growth was low at 1,425 people. The Study Area witnessed a net outflow from internal migration. This was more than offset by net overseas migration and natural increase in 2019-20.
The three years prior, from 2016-17 to 2018-19, are more likely to be reflective of the future population components. Over this time approximately 26,591 came from net overseas migration and 10,990 came from a natural increase, net internal migration reflecting households moving from the region, accounted for -17,872 people over the period. This reflected net growth of 26,591 residents. Overall, Metropolitan Sydney records a net outflow of internal migration as households look to move to more affordable locations.
The components of growth in the Study Area differ from the Greater Sydney average, in that it relies more heavily on international migration and experiences a significantly greater net internal migration loss.
With COVID-19 having resulted in the closure of international borders, net international migration was down from 8,472 in 2018-2019 to 5,819 in 2019-2020.
Study Area Historical Population Growth
23/02/2022 Merrylands Market Assessment Page 16 Source:
Source:
0.0% 0.6% 1.2% 1.8% 2.4% 3.0% 3.6% 0 50,000 100,000 150,000 200,000 250,000 300,000 2011 2012 2013 2014 2015 2016 2017 2018 2019 2020 Growth Rate Population Population % Growth -10,000 -5,000 0 5,000 10,000 15,000 2017 2018 2019 2020 Share of Annual Growth Natural
Net
Net
Study Area Population Growth by Component, 2016-2017 to 2019-2020
ABS
ABS
Increase
Internal Migration
Overseas Migration
PROJECTED POPULATION GROWTH
Implications
The rate and extent of future population growth in the Study Area will have a substantial bearing on future demand for residential dwellings.
Prior to the onset of the COVID-19 pandemic, the NSW Government forecast population growth to slow down from 2.2% per annum from 2016-21 to 1.5% per annum from 2026-31. COVID-19 will likely impact population growth in the area in the short term. The Cumberland and Parramatta LGAs are likely to witness a similar impact to Greater Sydney. While the LGAs are more reliant on international migration, they are benefiting from a shift in population from inner city areas to the suburbs and a rising birth rate.
The chart shows the projected age distribution within the Study Area from 2016 to 2036. The proportion of residents aged 40 and above is forecast to increase from 39% in 2016 to 45% by 2036. This cohort is anticipated to represent a growing market segment for apartments in the future as older residents look to downsize and workers look for accommodation close to the growing Parramatta CBD and surrounding industrial areas.
Overall, the population of the Study Area is projected to grow at a slowing rate over the next decade, with the time taken for the COVID-19 recovery having an impact in the short term.
Projected Study Area Population Growth by Age
23/02/2022 Merrylands Market Assessment Page 17
20% 20% 21% 21% 20% 12% 12% 11% 11% 11% 31% 31% 29% 26% 24% 22% 22% 24% 26% 27% 15% 16% 16% 17% 18% 0% 20% 40% 60% 80% 100% 2016 2021 2026 2031 2036 Age Distribution Aged 0-14 Aged 15-24 Aged 25-39 Aged 40-59 Aged 60+
Source: NSW Department of Planning, Industry and Environment
HOUSEHOLD GROWTH
Key Findings
The proportion of couple families with children in the Study Area is projected to stabilise at 40% over the 15 years to 2036. This is in contrast to an increase in the proportion of lone person households from 19% to 21%. This will increase the demand for studio and one-bedroom apartments.
The proportion of couples is expected to fall slightly and single parent families are projected to increase slightly over the 20-year period. The average household size is projected to fall from 2.88 in 2016 to 2.78 in 2036 as a result of the increase in one person households over the period.
Study Area Household Projections
Household Size Projections
23/02/2022 Merrylands Market Assessment Page 18
Source: NSW
of Planning, Industry and Environment Region 2016 2021 2026 2031 2036 Cumberland LGA 3.03 3.01 2.98 2.96 2.93 Parramatta LGA 2.75 2.72 2.71 2.69 2.66 Study Area 2.88 2.85 2.83 2.81 2.78 Metro Sydney 2.78 2.73 2.71 2.69 2.66 20% 20% 20% 19% 19% 40% 40% 40% 40% 40% 10% 10% 11% 11% 11% 5% 5% 5% 5% 5% 19% 19% 19% 20% 21% 5% 5% 5% 5% 5% 0% 20% 40% 60% 80% 100% 2016 2021 2026 2031 2036 Household Type Share Couple Couple with children Single parent Other family households Lone person Group Source: ABS Census; Urbis
Source: NSW Department of Planning, Industry and Environment
Department
DEMOGRAPHIC CHARACTERISTICS
Characteristics
The chart summarises the key demographic characteristics of the Study Area population compared to the Greater Sydney average. It is based on 2016 Census data and illustrates the differing characteristics of residents. The Study Area population in 2016 was characterised by:
• A relatively lower socio-economic area with personal incomes around 21% below the Sydney average. This data highlights that affordability is a key driver of housing demand.
• A relatively higher proportion of families (especially couples with children of 14 years or younger), indicating there will be demand for 2+ bedroom apartments.
• Around 20% of households are single-person households, indicating some demand for onebedroom apartments in the area. However, demand will be lower than in other areas in Sydney where there are more students and lone person households.
• Almost half of the households are renters, indicating there will be some interest from investors in the area.
• Around 30% of households are purchasing their homes, which reflects a significant portion of households looking to enter the housing market in the Study Area.
Key Demographic Characteristics
23/02/2022 Merrylands Market Assessment Page 19 Source: ABS, Urbis -25%-20%-15%-10% -5% 0% 5% 10% 15% 20% 25% Variation from Sydney Average $39,817 $90,155 68% 8% 34.1 3.0 22% 29% 11% 5% 7% 5% 20% 48% 24% 30% 56% Avg. Per Capita Income (15-64 aged) Avg. Household Income White Collar (%) Tertiary Student Average Age Avg. Household Size Couple family with no children Couple family with children < 15 Couple family with children > 14 One parent family with children < 15 One parent family with children > 14 Group Household Lone Person Household Renter (%) Owner (%) Purchaser (%) Born Overseas Merrylands
TARGET BUYER MARKET
Key Findings
In 2020, approximately 31% of people in households within the Study Area were aged between 25-39, which is higher than the Greater Sydney metropolitan area (25%). The area boasts strong demand drivers for younger singles and couples, including proximity to jobs, public transport and amenity. The competitor analysis also highlights that recent projects in the Study Area have attracted a number of local first home buyers due to the relative affordability. This segment will be attracted to the two-bedroom bedroom product and one-bedroom units to a lesser extent.
Approximately 48% of households in the Study Area are renters, which is significantly higher than Greater Sydney (36%). The area boasts solid rental drivers, including proximity to jobs, hospitals, transport and amenity. The competitor analysis highlights that recent projects in the Study Area have attracted local investors. This segment will be attracted to the one-bedroom and two-bedroom products.
The catchment is home to a relatively lower proportion of people aged 60+ than the Sydney average. However, the projected increase in the ageing population will increase demand for suitable units, allowing retirees to free up money by downsizing and selling their homes. This age segment will be attracted to the larger twobedroom and three-bedroom products. The proximity to major local medical facilities, including the Westmead Health District, is also likely to be attractive to this age cohort.
Buyer Segments


First Home Buyers
Investors
Downsizers
23/02/2022 Merrylands Market Assessment Page 20
Source: Urbis
SUPPLY
23/02/2022 Merrylands Market Assessment Page 21
APARTMENT SUPPLY
Key Findings
This section assesses the existing and proposed supply of residential dwellings in the Study Area. Dwelling completions for the Study Area between 2016-17 to 2020-21 averaged around 3,230 per annum. The completion rate spiked considerably in 2016-17 (reaching 4,285 dwellings) before declining to a low in 2019-20. Apartments will continue to dominate development activity in the Study Area due to the lack of vacant land for house development.
New dwelling approvals peaked in 2017-18, although this did not flow through to completions in 2019-2021. This lack of transfer indicates that many projects have not moved to construction as the apartment market softened.
New dwelling approvals decreased in 2018-19 and 2019-20 due to the slowdown in the apartment market and COVID-19 at the start of 2020. This decline indicates that completions are likely to remain relatively low in the short to medium term. Before bouncing-back on the 2020-21 rise in approvals. Overall, with the exception of 2019-20 (due to COVID-19) new building approvals have been fairly consistent over the five years.
Dwelling Completions, Study Area
New Building Approvals, Study Area
23/02/2022 Merrylands Market Assessment Page 22
Source:
Average1,000 2,000 3,000 4,000 5,000 6,000 7,000 8,000 2016-17 2017-18 2018-19 2019-20 2020-21 Number of dwellings obtaining Building Approval Apartments Houses Semi Detached Average 0 500 1,000 1,500 2,000 2,500 3,000 3,500 4,000 4,500 2016-17 2017-18 2018-19 2019-20 2020-21 Number of Dwellings Completed Flats/Units/Apartments Houses Townhouses
Source: ABS Small Area Completion estimates and NSW Department of Planning, Industry and Environment
ABS
Key Findings
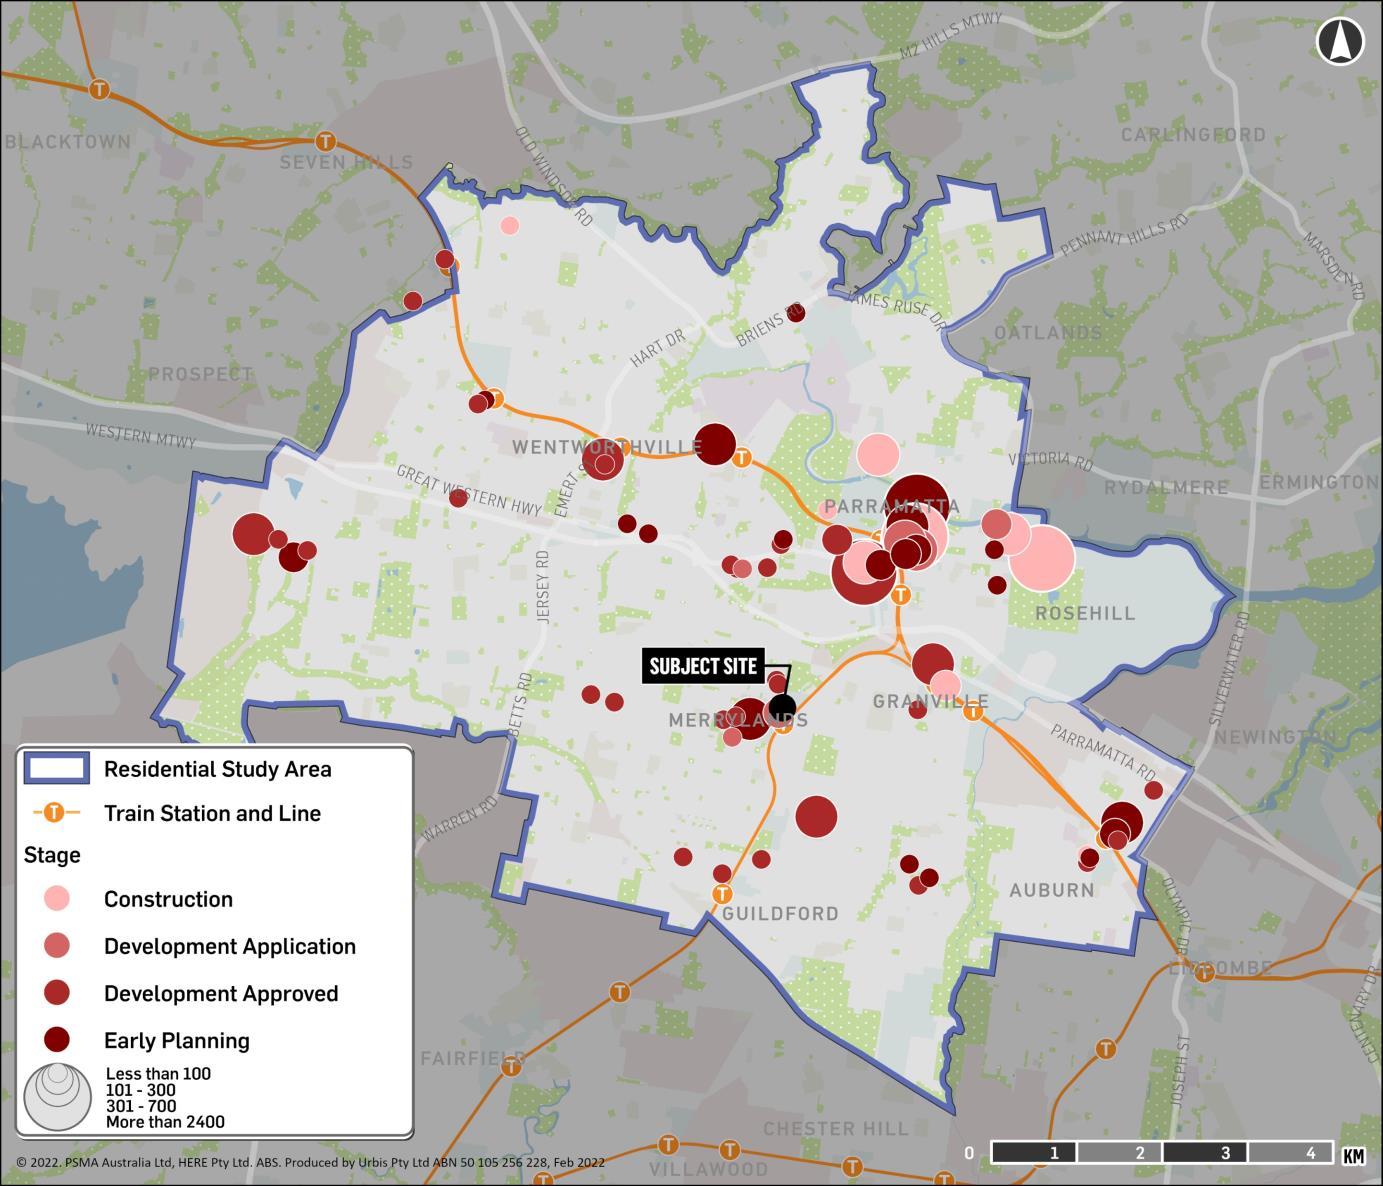
According to Cordell Connect and Urbis research, there are around 96 proposed apartment projects (with 25+ units) within the Study Area that have the potential to be completed over the next eight years, comprising a total of 12,963 units. These projects are either under construction, have achieved development approval or have applied for development approval.
Approximately 4,186 dwellings have commenced construction, with 8,276 having achieved development approval and 1,352 in the development application stage.
There are an additional 5,110 units in the early planning stages which could commence over the next ten years. The majority of these are located in Parramatta, although the largest is located at the James Hardie Redevelopment Site at 181 James Ruse Drive and 1 Grand Avenue, Camellia. This proposal includes approximately 2,400 residential apartments and over 14,000 sq.m of retail/commercial gross floor area. The concept is for 14 buildings ranging from 7-16 storeys. There is considerable uncertainty regarding if and when this project could proceed.
Study Area Proposed Apartments and Status
FUTURE RESIDENTIAL SUPPLY
23/02/2022 Merrylands Market Assessment Page 23
0 500 1,000 1,500 2,000 2,500 3,000 3,500 4,000 2022 2023 2024 2025 2026 Number of Units
Source: Cordell Connect; Urbis Apartment Essentials
Construction Development Approval Development Application
FUTURE RESIDENTIAL SUPPLY
Key Findings
The majority of larger apartment projects in the pipeline are located around the various town centres within the Study Area. This includes strong development activity in:
• Parramatta – Accounts for the majority of supply in the Study Area. Parramatta has a median unit price of $605,000, which is above the Study Area average
• Merrylands - Median unit price of $460,000, which makes the area a relatively affordable option.
• Granville - Median unit price $470,000
• Auburn - Median unit price $550,000
While many projects are also located along major transport corridors, there are a number of projects scattered throughout the Study Area, indicating large development sites are becoming more difficult to source in high demand locations.
Future Residential Apartment Supply
23/02/2022 Merrylands Market Assessment Page 24
COMPETITOR ANALYSIS
23/02/2022 Merrylands Market Assessment Page 25
COMPETITION SUMMARY
KEY COMPETING LOCATIONS PRICING
• Competing locations are those which are competing directly for potential buyers with the subject site. They are:
• Positioned at the affordable end of the market
• Have apartment developments located close to amenity
• Provide easy access to high frequency public transport networks.
• Merrylands is a key competing market for the younger demographic. The high range of amenities (shopping, entertainment, cafes, restaurants and licensed venues) within short walking distance of apartments has proven attractive to young buyers and renters.

• Locations in close proximity to train stations like Merrylands (such as Parramatta, Granville and Westmead) are attractive to investors as there is a strong market for younger people looking to rent in areas with good access to jobs in surrounding town centres, Parramatta and the Sydney CBD.

DWELLING MIX
• The majority of projects in the Study Area comprise primarily of one and two bedroom units. This mix reflects the combination of relative affordability in the region meaning many of buyers are looking for more space and flexibility offered by two bedroom units and the proximity to employment areas attracting a high number of lone person households. Of the profiled projects, the average mix was:
• Studio: 7.3%
• 1-Bed: 32.4%
• 2-Bed: 54.3%
• 3-Bed: 6.0%
• The above mix is consistent with what is generally observed in western-Sydney locations which consist of a mix of families, couples and individuals. Two of the five projects had studio apartments, which is likely due to its proximity to the Parramatta CBD and the Westmead hospital precinct which would generate demand from single person households.
• With a relatively smaller downsizer market in the region, the market historically being a younger demographic and strong competition from townhouse and houses in the surrounding area, 3-bedroom apartments have accounted for only 6% across the projects.
• Understanding pricing in the current market is challenging, as there has been limited sales activity from both off-the-plan and new apartment resales. Quality apartment accommodation (while starting to improve) is still limited which is keeping prices lower.
• Mason and Main represents the closest comparable to the subject site based on location. However, the subject site is considered to be a superior location due to proximity to the Merrylands Train Station. The development is advertising a starting price of $610,000 for two-bedroom, twobathroom units according to the agents.
• The recently completed projects in Merrylands also represent a relevant comparison in terms of location though the subject site development is anticipated to be of a higher quality and provide better onsite amenity. These completed projects have recorded a mix of prices ranging from around $465,000 to $530,000 for a one-bedroom unit and from $515,000 to $699,000 for a two-bedroom twobathroom unit.
• In the nearby suburb of Granville a recently completed unit development (in a comparable location close to the local train station and amenities) recorded one-bedroom prices ranging from $399,000 to $494,000 and two-bedroom, twobathroom units ranging from $645,000 to $777,000
23/02/2022 Merrylands Market Assessment Page 26
MASON AND MAIN
Developer Coronation Property
Location 249-259 Merrylands Road, 52-54 McFarlane Street
Merrylands
Council Area Cumberland
Location
Characteristics
• Located within Merrylands Town Centre
• 50 metres to Stocklands Merrylands
• 500 metres to Merrylands Train Station
• 1.1 km Merrylands East Public School
• 2.6 km Merrylands High School
Completion May 2025
Project Launch July 2021
Status Construction
Total Units 794 (Buildings 1-3: 433 BTR , Buildings 4-5: 361 BTS)
Property Description
• Five mixed use apartment buildings of 13-25 storeys, 23 retail and 11 commercial tenancies, Childcare centre
• Balconies and intercoms
• Delonghi stainless steel appliances, gas cooktop, dishwasher, floorboards, built-in wardrobes and air conditioning.
Parking 936 spaces
Ancillary Facilities Swimming Pool and Outdoor entertainment area including BBQ areas and resort-style cabanas and sun beds.
Gym and workout space
Take-up Rates The project was launched in July 2021. The apartments in buildings 13 are going to be developed as build-to-rent and buildings 4-5 are build-to-sell and are available for sale off the plan.
The agent has not provided take-up rates for the build-to-sell apartments
Buyer Profile Not provided by agent
Note: * Asking starting sales prices as at February 2022.
Note: ^ Advertised rental estimate from https://masonandmain.com.au/residences/.
Source: Sales agents and Mason and Main website
23/02/2022 Merrylands Market Assessment Page 27
Type Mix (no.) Internal Size (sq.m) Expected Price Range* Expected Weekly Rental Range^
129 42 From $394,000 $420-$470
Bed, 1 Bathroom 264 50-60 From $480,000 $490-$560
Bed, 2 Bathroom 379 75-85 From $610,000 $550-$650
Bed, 2 Bathroom 18 98-103 From $879,000 $680-$720
Studio
1
2
3
THE TERRACE, MERRYLANDS
Developer Ham & Sons Pty Ltd
Location Building 1, 84-86 Railway Terrace, Merrylands
Council Area Cumberland
Location Characteristics
• Located on the Eastern side of the railways line from the Subject Site
• 400 metres to Merrylands Train Station
• 700 metres to Stockland Merrylands
• 1km to Merrylands East Public School
• 3.3km Merrylands High School
Completion March 2021
Project Launch March 2016
Status Built Total Units 33
Property Description
• Seven-storey residential development.
• Gas cook top & hot water system
• Timber floor throughout
• Air Conditioning and Air Purifier
• Dishwasher & Dryer
Parking 41 spaces
Ancillary Facilities Basement parking for 36 vehicles and five at grade spaces. Outdoor entertainment area, fully fenced.
Associated landscaping.
Take-up Rates The project launched in March 2016.
From May 2020 to completion sales occurred at an average of around one to two per month.
Buyer Profile Not provided by agent. Based on analysing the properties with rental data or asking rents available, around 20% of the building is owned by investors.
RECENT SALES
Note: * Actual sales prices from 2020 Source: Pricefinder
23/02/2022 Merrylands Market Assessment Page 28
No. Type Sale Date Price 28 2 Bed, 2 Bath, 1 Car 1/011/2021 $600,000 24 2 Bed, 2 Bath, 1 Car 1/11/2021 $595,000 4 2 Bed, 2 Bath, 1 Car 21/05/2021 $570,000 21 3 Bed, 2 Bath 22/04/2021 $635,000 5 2 Bed, 2 Bath, 1 Car 11/03/2021 $570,000 11 2 Bed, 2 Bath, 1 Car 08/03/2021 $570,000 2 1 Bed, 1 Bath, 1 Car 2/03/2021 $465,000 Type Mix (no.) Internal Area (sq.m) Price Range* Recent and Asking Weekly Rental Range 1 Bed, 1 Bathroom 3 50 $465,000-$530,000 $400-$450 2 Bed, 2 Bathroom 27 76-79 $515,000-$600,000 $450-$510 3 Bed, 2 Bathroom 3 106-117 $632,000-$660,000 $545
SKYE AT THE MILLS
Developer Landmark Group
Location Buildings 3 and 4, 1-7 Neil Street, Merrylands
Council Area Cumberland
Location
Characteristics
• Located near the border between Merrylands and Holroyd.
• 500 metres to Merrylands Train Station
• 700 metres to Stockland Merrylands
• 1.3 km to Merrylands East Public School
• 3.5 km to Merrylands High School
Completion 2022
Project Launch February and September 2017
Status Construction
Total Units 311 (Building 3 - 178, Building 4 - 133)
Property Description The property consists of two residential towers of 12storeys, Apartments feature:
• Open plan living spaces
• Kitchen with gas cooktop and dishwasher
• Internal laundry and dryer
• Air-Conditioning and security intercom
Parking Basement car parking for 438 vehicles & 195 bicycles over 3 levels.
Ancillary Facilities Landscaping.
Total communal open space 1,883 sq.m
Take-up Rates The Mills project launched in February 2017 and is estimated to have averaged around four per month.
Buyer Profile From analysing the properties with rental data or asking rents available, around 50% of the building has been purchased by investors.
Note: * Refers to achieved and asking sales prices range from 2020. Source: Urbis Essentials and Pricefinder
23/02/2022 Merrylands Market Assessment Page 29
Type Mix (no.) Internal Size (sq.m) Price Range* Recent and Asking Weekly Rental Range 1 Bed, 1 Bath 118 55-72 $490,000-$507,000 $390-$410 2 Bed, 2 Bath 168 75-104 $625,500-$699,000 $400-$480 3 Bed, 2 Bath 25 95-111 $722,500-$750,000 $490-$570
ARCADIA GARDENS
Developer Special Land Development Pty Ltd
Location 23-27 Paton Street, Merrylands West
Council Area Cumberland
Location
Characteristics
• Located between Merrylands and Merrylands West.
• 2.6 km to Merrylands Train Station
• 1.9 km to Greystanes Shopping Centre
• 900 metres to Merrylands High School
• 1.5 km to Merrylands Public School
Completion June 2020
Project Launch October 2016
Status Built
Total Units 65
Property Description Five storey apartment building with secure underground parking. All apartments come with:
• Gas kitchen with polyurethane and polytec cupboards, 40mm stone bench tops, stone splash back and stainless-steel Westinghouse appliances
• Plush carpet, mirrored and glass built-in wardrobes, LED down lights and air conditioning
Parking Basement & at grade carparking giving total parking for 132 vehicles & 44 bicycles.
Ancillary Facilities Communal roof top terrace and landscaping
Take-up Rates Sold at an average rate of around one per month over 2019.
Buyer Profile Not provided by agent
RECENT SALES
Note: *Refers to properties sold from H2 2019 to current or current advertised sale prices
Agent Discussions, Pricefinder RP Data and Urbis
23/02/2022 Merrylands Market Assessment Page 30
Type Mix (no.) Internal Area (sq.m) Price Range* Recent and Asking Weekly Rental Range Studio 3 57-58 $375,000 $330-$340 1 Bed, 1 Bath 4 48-78 $375,000-$399,000 No rentals 2 Bed, 1 Bath 17 75-83 $500,000-$550,000 $400-$460 2 Bed, 2 Bath 35 71-97 $517,000-$560,000 $400-$490 3 Bed, 2 Bath 6 92-107 $600,000-$665,000 $490-$540
No. Type Sale Date Price 3 2 Bed, 1 Bath, 1 Car 11/12/21 $515,000 15 2 Bed, 2 Bath, 1 Car 3/12/21 $545,000 33 2 Bed, 1 Bath 3/12/21 $515,000 31 2 Bed, 2 Bath, 1 Car 30/10/21 $560,000 39 2 Bed, 2 Bath, 1 Car 16/10/21 $538,000 55 2 Bed, 1 Bath, 1 Car 19/03/21 $500,000 30 3 Bed, 2 Bath, 1 Car 2/02/21 $610,000
Source:
GRANVILLE PLACE
Parking Basement carparking over 5 levels for a total of 730 vehicles & 337 bicycles.
Ancillary Facilities Features include a lawn, outdoor lounging zones, barbeques, playground, hammock grove and a podium oasis.
Take-up
Developer Develotek Property Group and Ausbao Pty Ltd
Location Buildings 1-3, 14-38 Cowper Street, Granville
Council Area Cumberland
Location Characteristics
• Located within Granville Town Centre
• 50 metres to Granville Train Station
• 250 m walk to Granville Swimming Centre
• 230 m walk to Granville Memorial Park
• 4 km to the Westmead healthcare precinct
Completion November 2021 and 2022
Project Launch March 2018
Status Built
Total Units 620
Property Description
• Three towers of 14-storeys, 21-storeys and 22storeys mixed-use building comprising commercial/retail including Woolworths Metro, restaurants, café's, gym, specialty stores, childcare and medical centre. Apartments feature:
• Timber flooring in living room
• Fisher and Paykel appliances and ducted air conditioning.
As of December 2019 the project was 76% sold and only five remain for sale in the building . Equated to a sales rate of around three units per month from launch date to November 2019.
Buyer Profile Not provided by agent
RECENT SALES
Note: * Refers to achieved sales prices range from 2020. Asking prices as at February 2022.
Source: Urbis Essentials, Developers Urban Design Report and Cordells
No. Type Sale Date Price 1305 2 Bed, 2 Bath 1/09/2021 $671,000 801 1 Bed, 1 Bath 2/08/2021 $478,500 306 2 Bed, 2 Bath 30/07/2021 $658,000 1103 3 Bed, 2 Bath 29/07/2021 $852,000 1502 3 Bed, 2 Bath 7/07/2021 $893,000 1204 2 Bed, 2 Bath 25/06/2021 $766,000 1603 3 Bed, 2 Bath 25/06/2021 $920,000
23/02/2022 Merrylands Market Assessment Page 31
Type Mix (no.) Internal Size (sq.m) Price Range* Recent and Asking Weekly Rental Range 1 Bed, 1 Bath 184 49 $399,000-$494,000 Asking: $460,000 $380-$420 2 Bed, 2 Bath 378 86 $645,500-$777,000 Asking: $666,000 $470-$550 3 Bed, 2 Bath 58 94 $770,000-$870,000 Asking $750,000 $560-$680
Rates
SUMMARY OF UNIT MIX AND SALES RATES
*Where lists were not available an indicative average was calculated and checked with agents
^ Internal areas exclude balconies and car spaces
Source: Urbis, Pricefinder, RP Data and Agents
23/02/2022 Merrylands Market Assessment Page 32 Project Suburb Status Yield Type Mix (no.) Average Internal Size^ (sq.m) Sales Prices Indicative Average Price per sq.m* Commentary Mason and Main Merrylands Construction 794 Studio 129 42 $394,000 $9,381 Starting advertised prices as at February 2022. Subject site is similar, but slightly better located in closer proximity to the train station. Includes 433 BTR units 1 Bed, 1 Bath 264 55 $480,000 $8,727 2 Bed, 2 Bath 379 80 $610,000 $7,625 3 Bed, 2 Bath 18 100 $879,000 $8,790 The Terrace Merrylands Built 33 1 Bed, 1 Bath 3 50 $465,000-$530,000 $9,950 Inferior location and amenity to Subject Site 2 Bed, 2 Bath 27 77 $515,000-$600,000 $7,492 3 Bed, 2 Bath 3 104 $632,000-$660,000 $6,176 Skye at The Mills Merrylands Construction 311 1 Bed, 1 Bath 118 61 $490,000-$507,000 $8,074 Inferior location and amenity to the Subject Site 2 Bed, 2 Bath 168 81 $625,500-$699,000 $7,851 3 Bed, 2 Bath 25 101 $722,500-$750,000 $7,292 Arcadia Gardens Merrylands West Built 65 Studio 3 57.5 $375,000 $6,522 Inferior location and amenity to Subject Site 1 Bed, 1 Bath 4 59 $375,000-$399,000 $7,457 2 Bed, 1 Bath 17 78 $500,000-$550,000 $6,658 2 Bed, 2 Bath 35 84 $517,000-$560,000 $6,215 3 Bed, 2 Bath 6 97.5 $600,000-$665,000 $6,410 Granville Place Granville Built 618 1 Bed, 1 Bath 184 49 $399,000-$494,000 $9,388 Closer to Parramatta CBD and, therefore, a slightly superior location to the Subject Site. Similar amenity. 2 Bed, 2 Bath 378 86 $645,500-$777,000 $7,744 3 Bed, 2 Bath 58 94 $770,000-$870,000 $8,191
Key Findings
DEMAND
23/02/2022 Merrylands Market Assessment Page 33
LOCAL AMENITY AND DEMAND DRIVERS
Key Findings
There are four key drivers of residential housing demand relevant to the proposed development at Merrylands.
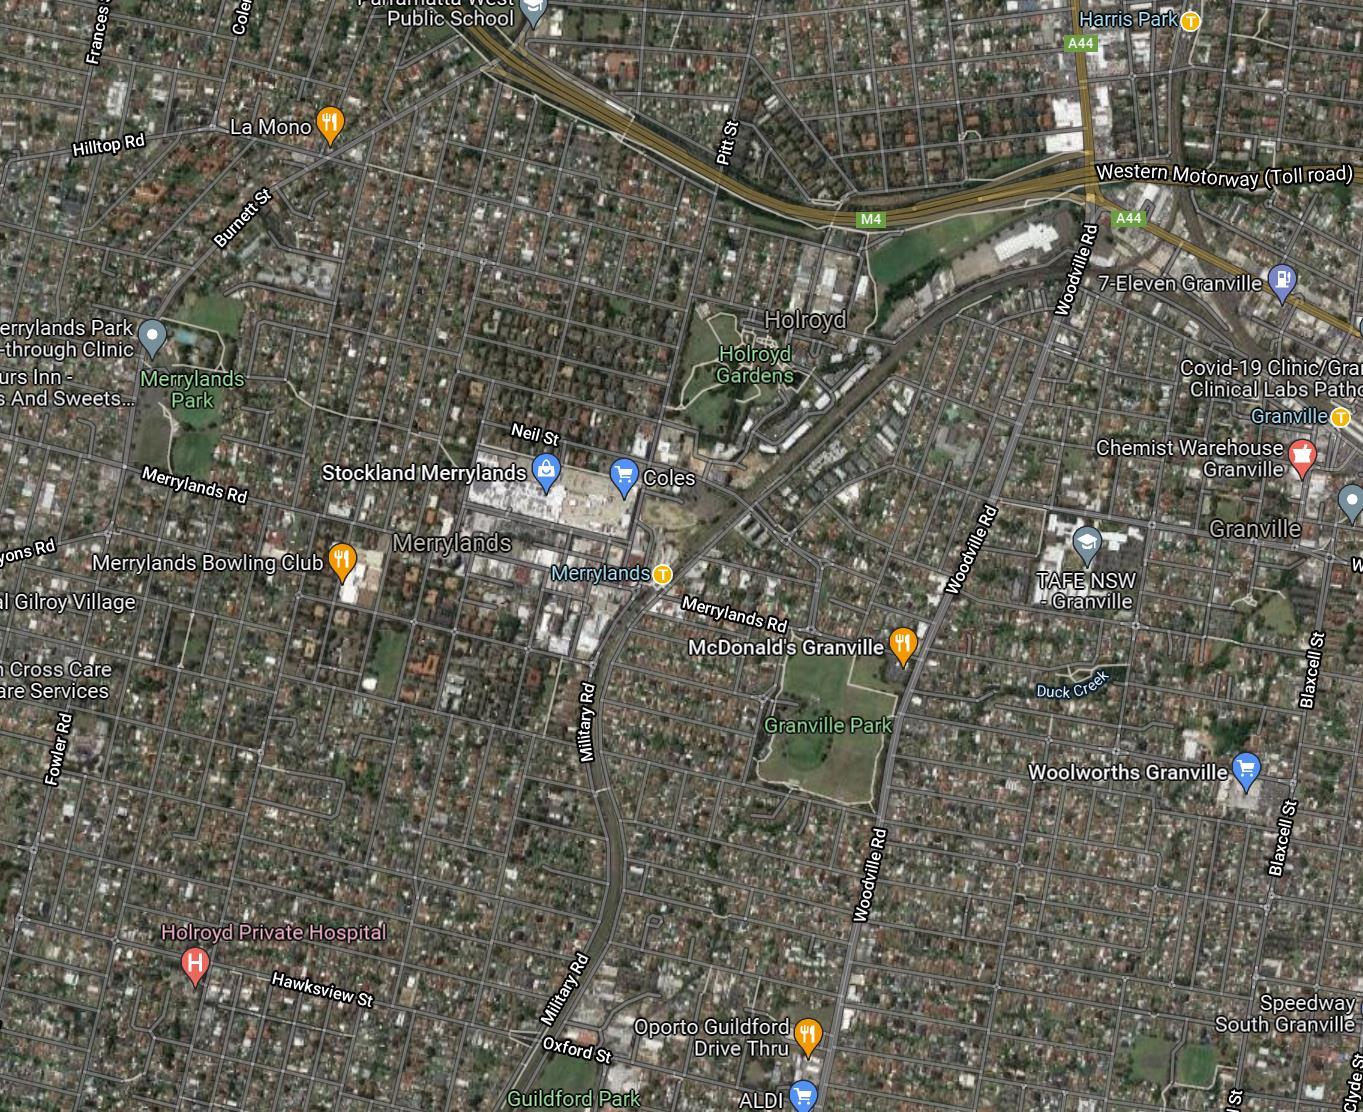
The table on the following page provides a brief description of these drivers and the implications for the subject site. The subject site ranks highly against several of the key success drivers with good proximity to public transport, retail/entertainment, schools and employment centres. The development is anticipated to comprise retail and open space which will increase amenity available to residents. Limited views are a constraint to the site.
Surrounding Amenity
Access to Amenities and Services
Transport Accessibility and Infrastructure
Employment Opportunities
23/02/2022 Merrylands Market Assessment Page 34
View corridor towards Holroyd Gardens
SUBJECT SITE
Merrylands Train Station Granville TAFE
Stockland Merrylands
Granville Train Station
Holroyd Private Hospital
Holroyd Gardens
Granville Park
Merrylands Park
Woolworths Granville
DRIVERS OF RESIDENTIAL DEMAND
Key Demand Drivers for Residential Development Factors Components
1. Attractive Views and Surrounding
A good outlook that includes views of the ocean/ harbour, surrounding region, and northernly aspects that maximise light and climate benefits, increase demand and price point.
2. Transport Accessibility and Infrastructure
Access to good public transport and road infrastructure are important to potential purchasers and renters. Particularly, linkages to the CBD, airport and major employment centres.
Future infrastructure projects can revitalise areas, improve connectivity and linkages, create new jobs and reshape the existing community.
✓ North Aspects
✓ Regional Views
x Premium Views
Implications for the Subject Site
• The apartments on the upper levels will offer views across the region. These regional views will be attractive to some buyers, though unlikely to be a major selling point.
• The proximity to the railway line may impact take-up due to the noise produced by passing trains. As a result, noise minimisation similar to other projects in the area will need to be considered in the design.
✓ Train
✓ Main Roads
✓ Bus
x Future Metro
• Merrylands Station is located approximately 20 metres north of the Subject Site. This station operates on the T2 Inner West and Leppington and T5 Cumberland Railway Lines which offers connectivity to major employment hubs including the Parramatta, Sydney and Liverpool CBDs.
• The Cumberland Highway is a main north-south arterial road servicing vehicles travelling to and from Merrylands towards North-West Sydney and Liverpool.
• The M4 Motorway is the main east-west arterial road servicing people connecting from Blue Mountains to the CBD.
23/02/2022 Merrylands Market Assessment Page 35
DRIVERS OF RESIDENTIAL DEMAND
Factors
3. Amenities and Services
Locations that have easy access to shops, public transport, parks, entertainment and dining options, medical facilities and school will be highly demanded as residential locations. These factors remain high on the priority lists of those looking to rent or buy.
Components
Implications for the Subject Site
✓ Shops, Cafes/ Restaurants
✓ Open Space/ Recreational Space
✓ Schools
✓ University/TAFE
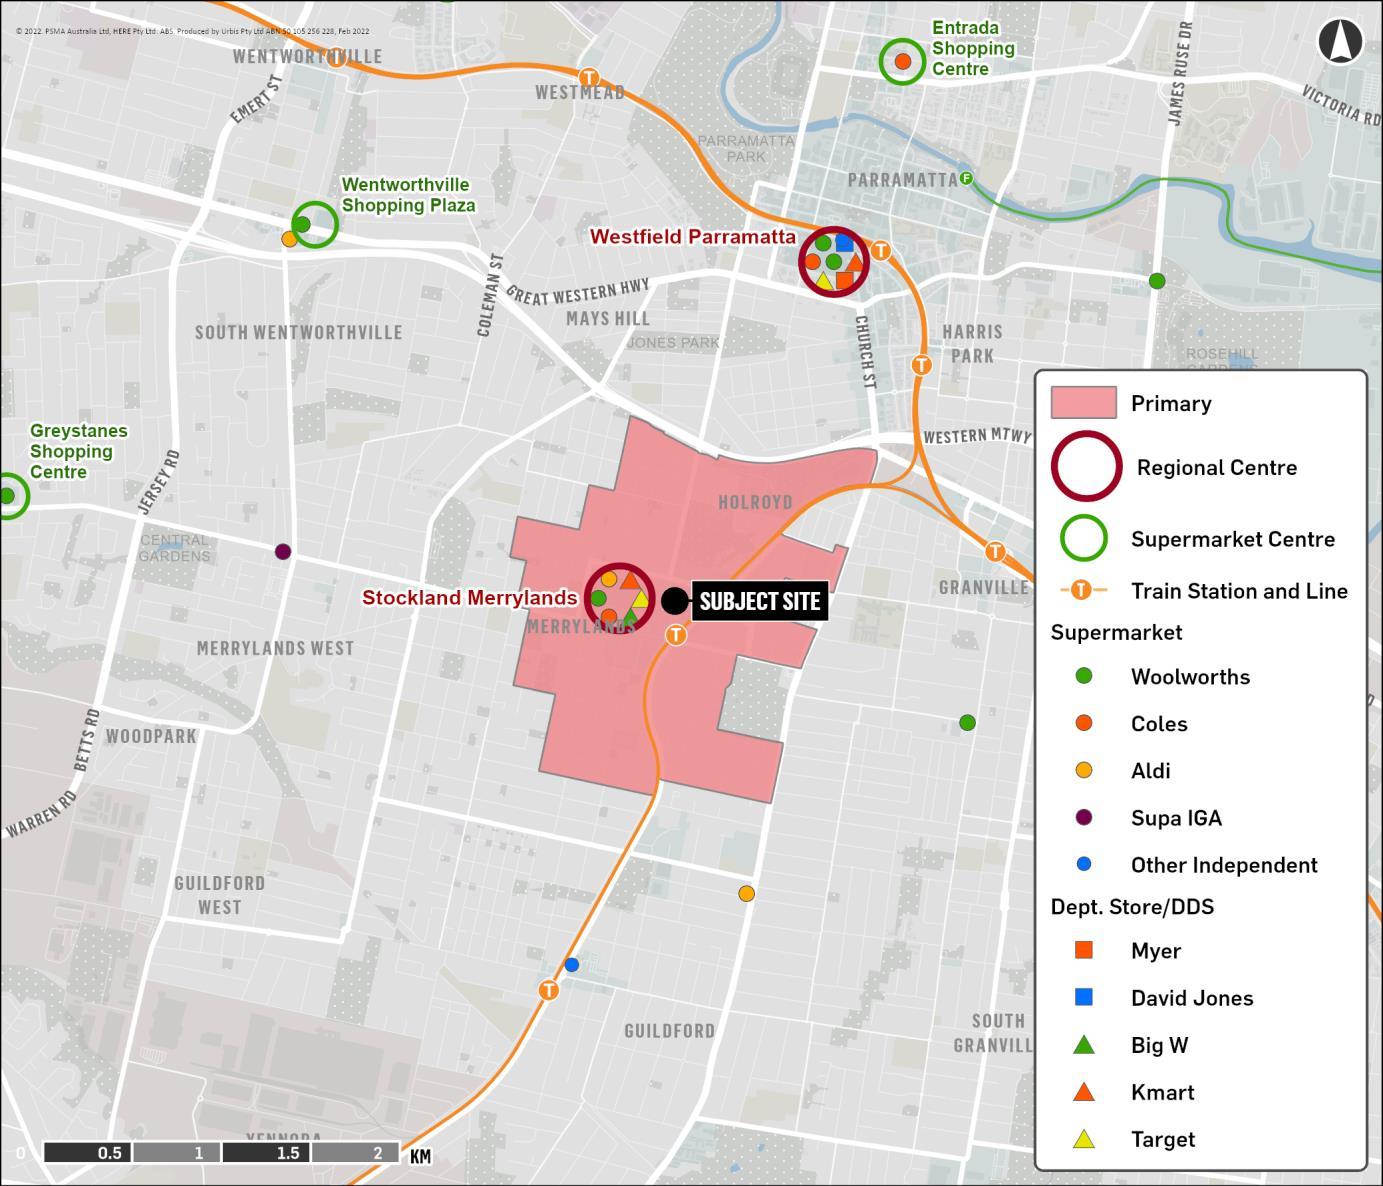
✓ Health Services
• Stockland Merrylands Shopping Centre, the largest shopping centre in the suburb, the closest Super Regional centre is Westfield Parramatta approximately 2.8 km south-west of the Subject Site.
• The subject site is serviced by several schools within a 3.5 km driving distance including Merrylands East Primary School (1.1 km), Parramatta West Public School (2.3 km), Merrylands Public School (2.5 km) and Merrylands High School (3.1 km). However, there are no schools within an easy walking distance
• The WSU International College and Sydney Graduate School Of Management SGSM campuses Parramatta, WSU Westmead and University of New England Parramatta are located within 5km of the site via car or public transport. TAFE NSW Granville campus is located 2.4 km from the Subject Site.
• The subject site is less than 5km drive from the Westmead Health and Education Precinct and 2.2km from Holroyd Private Hospital.
4. Employment Opportunities
Residents often prefer to live close to work, enabling them to minimise travel times and improve work/life balance.
✓ Local jobs
✓ Sydney CBD
✓ Parramatta CBD
✓ Aerotropolis
• A large portion of Cumberland LGA residents work locally within the Council area. There are several employment centres including the Parramatta and Sydney CBDs and surrounding industrial areas where residents also commute to work.
• According to Journey to Work Data, approximately 14.9% of residents within Cumberland travel to the Parramatta CBD for work followed by Sydney CBD (14.3%). The train line provides direct access to these centres.
• The Western Sydney Airport will be a major catalyst for employment growth within the western suburbs of Sydney with potential for around 28,000 people to be employed in the Aerotropolis by 2030. There is potential for a North South Rail Link from Macarthur to St Marys via the new airport, which would improve access to jobs.
23/02/2022 Merrylands Market Assessment Page 36
MEDIAN PRICES & SALES
Key Findings
The Cumberland and Parramatta LGAs cover the majority of the Study Area and have been assessed to understand apartment sales trends.
The median unit price in the Cumberland LGA peaked at $600,000 in the second half of 2017. Prices then declined to $550,000 in the first half of 2019. Activity and prices subsequently rebounded increasing to $575,000 by the end of 2021.
The Parramatta LGA experienced a median apartment price peak in the first half of 2017 and followed a similar trend to Cumberland LGA with the trough in prices occurring during the first half of 2019 with a median of $650,000. Activity and prices have since risen with a median of $706,000 achieved in the first half of 2021.
Average price growth within the LGAs has averaged 5.3% p.a. for Cumberland and 4.7% for Parramatta (off a higher base) over the last decade. The number of yearly unit sales in the LGAs has fluctuated from 3,840 to 9,650 per year with an average of 5,870 per annum since the start of 2007.
Study Area Apartment Price Growth
Note: Data is from December 2010 to December 2021. Sales from 2019-2021 are underreported as does not include off-the-plan sales that are yet to settle.
Source: Pricefinder
23/02/2022 Merrylands Market Assessment Page 37
$575,000 $700,000 $0 $100,000 $200,000 $300,000 $400,000 $500,000 $600,000 $700,000 $800,000 0 1,000 2,000 3,000 4,000 5,000 6,000 Jun-07 Dec-07 Jun-08 Dec-08 Jun-09 Dec-09 Jun-10 Dec-10 Jun-11 Dec-11 Jun-12 Dec-12 Jun-13 Dec-13 Jun-14 Dec-14 Jun-15 Dec-15 Jun-16 Dec-16 Jun-17 Dec-17 Jun-18 Dec-18 Jun-19 Dec-19 Jun-20 Dec-20 Jun-21 Dec-21 Median Sale Price Number of Apartment Sales Cumberland Council Number of Sales City of Parramatta Council Number of Sales Cumberland Council Median Price City of Parramatta Council Median Price
RENTAL MARKET
Key Findings
The rental market provides a good indication of the state of the residential market, with rents and vacancy rates responding quickly to supply and demand dynamics. The rental market throughout Sydney was tight from June 2010 to June 2018, with vacancies remaining between 1.0% and 2.5%. In the following three years, the market softened, with vacancy rates increasing to around 4.0% in May 2020, according to SQM Research. The biggest spike in this period was from 3.0% in March 2020 to 4.0% in May 2020, due to COVID-19 impacting the absorption of new supply and tenants ending leases. The Merrylands rental market has generally followed a similar trend to the broader Sydney market. However, vacancy rates have diverged since the onset of COVID19, as people have moved to suburban locations and new supply has been completed in Merrylands.
A vacancy rate of 3.0% generally indicates the rental market is in equilibrium. A lower vacancy rate suggests the market is undersupplied, and this can result in rental growth. A higher vacancy rate indicates excess rental properties that can result in landlords lowering rents. The chart bottom right depicts median rents in the Cumberland and Parramatta LGAs, compared to Greater Sydney for one and two-bedroom units. Rental growth in apartments has decreased in the LGAs and Sydney region over the past four years. Rents in the four years to September 2021 fell by 14.0% for one-bedroom units in Sydney, with a slightly lower decline for the Cumberland (-8.6%) and Parramatta LGAs (-10.9%). Two-bedroom units were similar, although the decline was more pronounced in the LGAs compared to Sydney; Cumberland (-13.6%) and Parramatta (11.5%). Driven by the vacancy decline, the trend appears to have turned, with growth or stable rents occurring in the September quarter of 2021.
Rental Vacancy Rate
Apartment Rental Growth
23/02/2022 Merrylands Market Assessment Page 38
Source: SQM Research; Urbis
$350 $380 $410 $460 $200 $250 $300 $350 $400 $450 $500 $550 $600 Greater
Greater
1-Bed Cumberland 1-Bed Cumberland 2-Bed Parramatta 1-Bed Parramatta 2-Bed 3.2% 2.6% 0% 1% 2% 3% 4% 5% 6% Dec-11 Apr-12 Aug-12 Dec-12 Apr-13 Aug-13 Dec-13 Apr-14 Aug-14 Dec-14 Apr-15 Aug-15 Dec-15 Apr-16 Aug-16 Dec-16 Apr-17 Aug-17 Dec-17 Apr-18 Aug-18 Dec-18 Apr-19 Aug-19 Dec-19 Apr-20 Aug-20 Dec-20 Apr-21 Aug-21 Dec-21 Residential Vacancy Rate Equilibrium Merrylands Postcode 2160 Greater Sydney
Source: NSW Department of Communities and Justice
Sydney 2-Bed
Sydney
TAKE-UP RATES
Key Findings
The table highlights the take-up of key apartment projects in Merrylands, Merrylands West and Granville launched over the last five years. Of the apartment complexes listed, the subject property is most comparable to Granville Place. Overall, the Study Area has averaged around 840 new apartment sales per year over the past four years. Sales rates have been decreasing over the past four years, with the impact of COVID-19 resulting in sales being below average in 2020 and 2021.
The outlook for apartment sales is positive, with confidence returning to the market, population growth expected to rise as borders reopen, and houses' relative unaffordability pushing first home buyers further west and towards apartment living.
Sales Rates for Projects
Note: * Average take-up over core sales period
Sales in Study Area
23/02/2022 Merrylands Market Assessment Page 39
Development Suburb Launch Total Units Estimated Takeup per Month* The Terrace Merrylands Mar-16 33 0.5 Lumiere Granville Jan-18 44 1.0 Atelier Granville Mar-16 33 0.5 Skye at the Mills Merrylands Sep-17 311 4.0 Acadia Gardens Merrylands West Oct-16 65 1.0 Aurora Granville Oct-16 463 3.7 Granville Place Granville Mar-18 620 3.0 New Apartment
Source: Pricefinder 0 200 400 600 800 1000 1200 2018 2019 2020 2021 Number of New Unit Sales Average
Source: Marketing agents, Pricefinder, Urbis
MARKET DEMAND
Demand and Market Share
It is challenging to estimate Subject Site take-up due to the considerable impacts of COVID-19 and uncertainty regarding the economic and property market recovery.
Before the COVID-19 pandemic, The NSW Department of Planning, Industry and Environment forecast Metropolitan Sydney population to increase by around 1.8% per annum from 2021-2036, equating to the demand of around 38,700 additional dwellings per year. The responses to COVID-19 are expected to result in declining population growth, mainly due to a fall in international migration due to border closures. As a result, Urbis forecasts Metropolitan Sydney population growth to slow in FY2021 and FY2022 before increasing once borders reopen.
In line with recent trends, apartments in Metropolitan Sydney will likely account for around 50% of dwelling demand in 2022, before increasing to 55% in 2035 as land for houses and townhouses is developed. The Study Area could achieve a share of around 8% of
Projected Net Take-Up
future apartment demand in Metropolitan Sydney, which is in line with the historical average of 7.8% from 2011 to 2020. Parramatta is likely to account for 50% of demand, with Merrylands, Auburn and Granville likely to take up the next largest demand shares in the Study Area. Based on these calculations, around 400 units are supportable in the Study Area in FY2022, increasing to 1,680 in 2035.
Given the development's scope, the proposed site will likely complete over several years starting from 2023 based on take-up and anticipated planning and construction timeframes.
Based on assessing the quantum, location and characteristics of the proposed competitive supply in the Study Area, the Subject Site development could potentially achieve a market share of between 4% and 5% of new apartment demand per year from 2023 onwards. The assumed market share is based on:
• The Subject Site is adjacent to the train station,
which is closer than competitive projects, but several are still within walking distance. Including the right mix of retail and amenity within the building will help improve the positioning. Overall, the project is considered of above-average competitiveness within the Study Area.
• There are around 24 projects (with 25+ units) currently under construction in the study area, which would equate to a 4% proportional market share for the subject site.
• The projects proposed to be completed from 20222026 equate to around 22 per year. Actual completion levels will depend on market conditions and the ability of developers to gain pre-sales and finance.
These adopted market shares equate to around 30-65 apartments per year in the low scenario and 40-85 apartments per year in the high scenario.
23/02/2022 Merrylands Market Assessment Page 40
2022 2023 2024 2025 2026 2027 2028 2029 2030 2031 2032 2033 2034 2035 Metropolitan Sydney Dwelling Demand 10,647 19,522 29,009 36,277 39,840 35,246 35,841 36,446 37,062 37,688 36,814 37,419 38,033 38,658 Proportion that are Apartments 50% 50% 51% 51% 52% 52% 52% 53% 53% 54% 54% 55% 55% 55% Metropolitan Sydney Apartment Demand 5,315 9,828 14,725 18,567 20,558 18,336 18,796 19,266 19,747 20,239 19,924 20,408 20,903 21,409 Study Area Share of Apartment Dwellings 7.83% 7.83% 7.83% 7.83% 7.83% 7.83% 7.83% 7.83% 7.83% 7.83% 7.83% 7.83% 7.83% 7.83% Study Area Apartments Demand 416 770 1,154 1,455 1,611 1,437 1,473 1,509 1,547 1,586 1,561 1,599 1,638 1,677 Cumulative Study Area Apt Demand 416 1,186 2,340 3,795 5,405 6,842 8,315 9,824 11,371 12,957 14,518 16,117 17,755 19,432 Cumulative Study Area Apt Supply 1,596 3,083 6,072 9,521 10,258 11,920 12,064 12,660 12,872 12,872 12,872 12,872 12,872 12,872 Supply Demand Gap -1,180 -1,897 -3,732 -5,726 -4,852 -5,078 -3,750 -2,836 -1,501 84 1,645 3,244 4,882 6,560 Market Share of Subject Site Low Scenario 4% 4% 4% 4% 4% 4% 4% 4% 4% 4% 4% 4% 4% High Scenario 5% 5% 5% 5% 5% 5% 5% 5% 5% 5% 5% 5% 5% Annual Subject Site Take-Up Low Scenario 31 46 58 64 57 59 60 62 63 62 64 66 67 High Scenario 38 58 73 81 72 74 75 77 79 78 80 82 84
RECOMMENDATIONS
Demand
The table outlines the recommended mix and indicative pricing ($2022) for the subject site.
Mix
The recommendation is that most apartments in the development contain two bedrooms and two bathrooms. This product is attractive to both younger couples and investors, which are likely to be the major buyer segments for the project. Onebedroom apartments are also attractive to some first home buyers and investors, although the majority would be looking for two bedrooms due to the relative affordability in the market. Three-bedroom apartments should account for under 10% of dwellings, with downsizers likely to account for a smaller segment of buyers and families being attracted to affordable townhouses and houses in the area.
Size
The recommended internal sizes are based on a comparison with recent projects smaller sizes would assist with affordability and likely result in shorter marketing periods.
Prices
The prices are indicative and will depend on many factors, such as the final design and quality of the project. The project's projected sales prices in $2022 have been estimated based on recent off-the-plan prices and new apartment resales in the area. The prices also consider competition from older house stock, which are an attractive alternative to buyers of three-bedroom apartments (particularly families). The median price for a house in Merrylands was $1.04M in the year to February 2022 with starting prices at around $775,000 for lower quality stock. As such, keeping three bedroom prices at the lower end of the house scale will be important to maintain affordability.
Take-up
Based on historical and projected demand and competition, the Subject Site could achieve a sales rate of around 30-40 per year (about three per month) in 2023 and pick up to 5-7 per month as the Sydney population recovers from COVID-19. However, there is a risk that the launch of major master-planned projects around the area could increase competition and impact take-up.
The take-up rates above are based on the adopted price ranges. Discounting prices is likely to result in a higher achievable take-up rate.
Recommended
23/02/2022 Merrylands Market Assessment Page 41
Type Mix Internal Size (sq.m) Indicative Price ($2022) Studio, 0-1 Car 0-5% 40-45 $370,000 - $410,000 1 Bed, 1 Car 25-35% 55-65 $450,000 - $520,000 2 Bed, 2 Bath, 1 Car 60-70% 75-85 $620,000 - $710,000 3 Bed, 2 Bed, 1-2 Car 5-10% 90-110 $770,000 - $880,000
Mix and Prices
Source: Urbis
RETAIL ASSESSMENT

23/02/2022 Merrylands Market Assessment Page 42
SCHEME REVIEW
23/02/2022 Merrylands Market Assessment Page 43
ALAND’S PROPOSED SCHEME
Key Findings
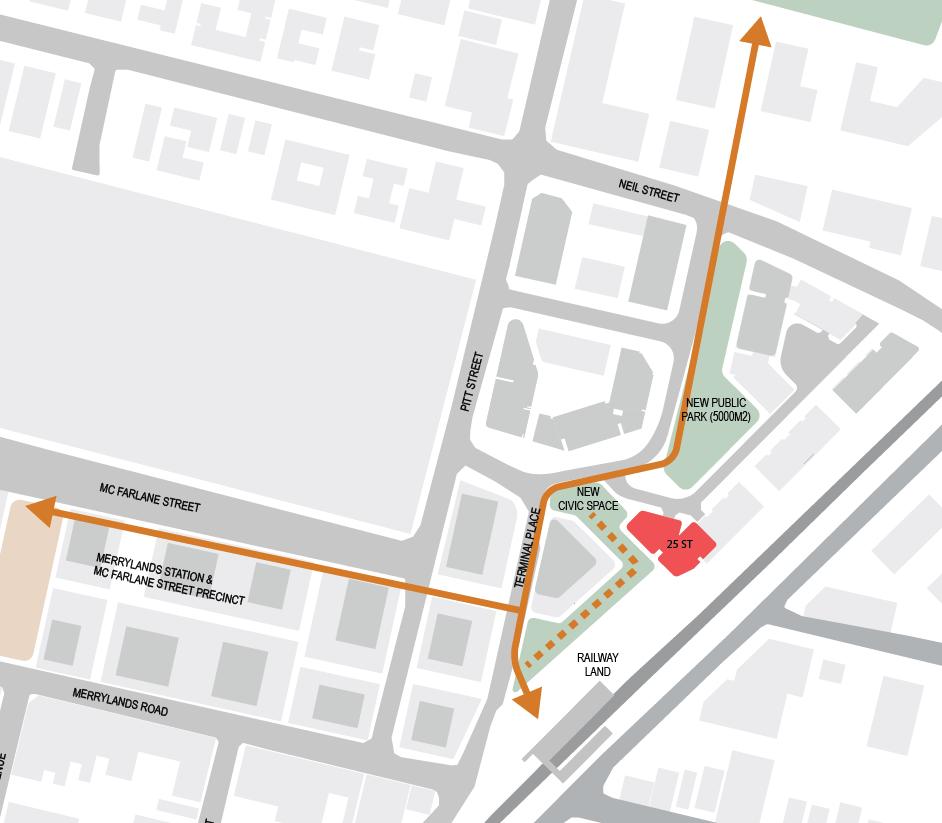
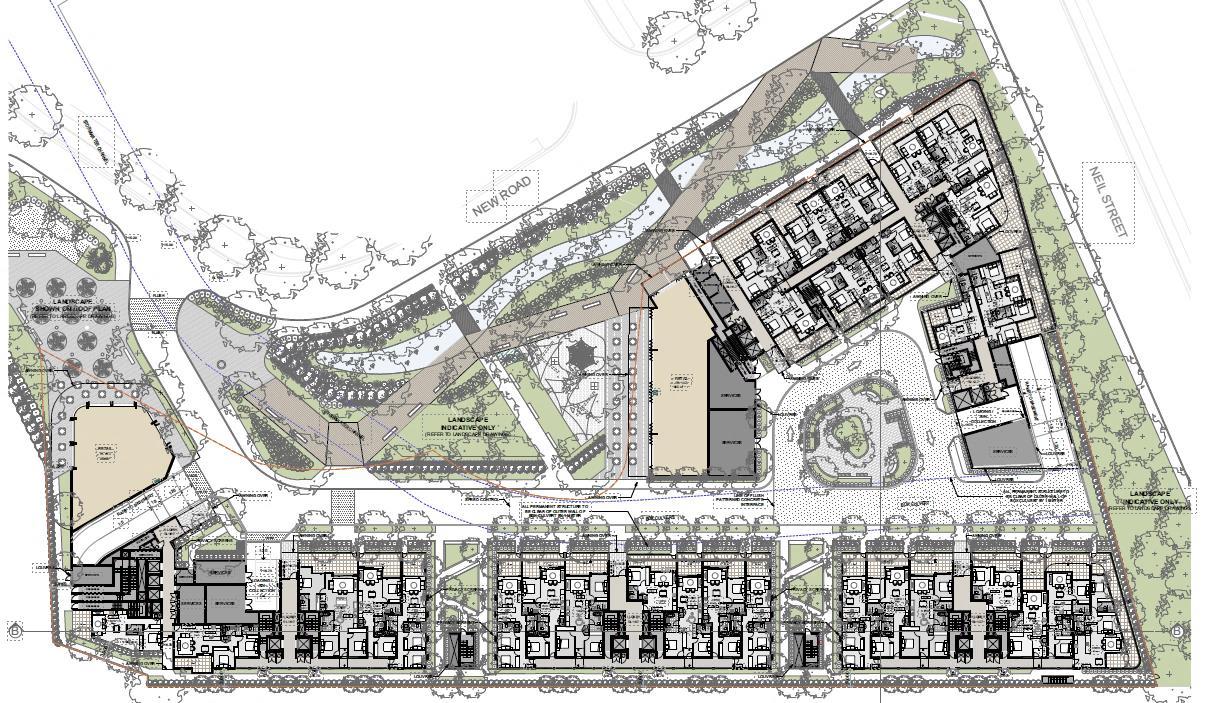
The proposed scheme provided to Urbis outlines the provision of ~2,000 to 3,500 sq.m of shopfront floorspace, split across seven buildings. The development is split into two components, separated by a new road which will allow for a new access point to the Merrylands town centre from Neil Street.
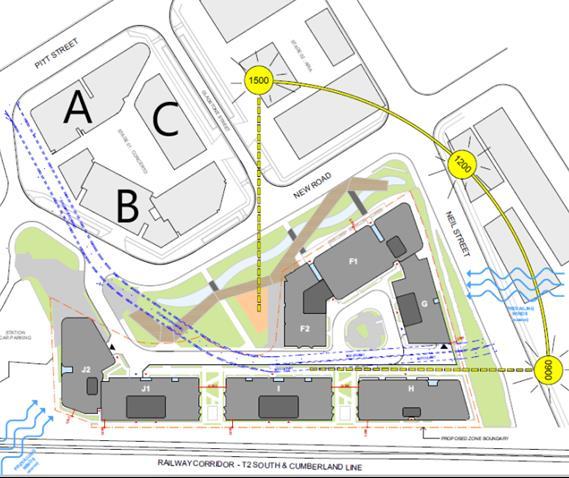
The western part of the development known as Site C (Buildings A, B and C) has exposure to this new road and also to Pitt Street, the main northsouth connection into and out of Merrylands. There is around 1,500 sq.m of retail space within Site C.
The eastern component (Buildings F-J) are more internalised, separated from the new road by public open space. Retail uses have the potential to interface with this new parkland area, allowing for outdoor dining, however suffer from a lack of exposure along Pitt Street. There is currently around 550 sq.m of retail space proposed though ALAND has advised they are considering increasing supply to around 2,000 sq.m.
The schemes are reviewed in detail in the following pages, highlighting the key considerations relating to potential constraints, challenges and opportunities.
Development Plans
23/02/2022 Merrylands Market Assessment Page 44
Source: ALAND
BUILDING A
Limited activation along Pitt Street and Terminal Place. No retail entrances.
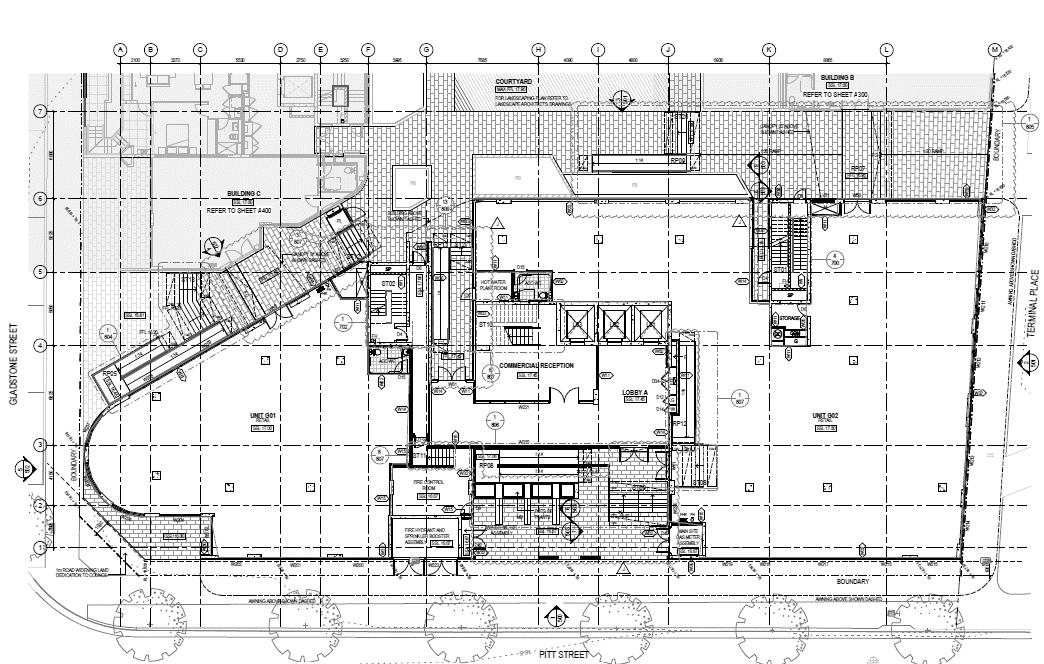
23/02/2022 Merrylands Market Assessment Page 45
a major constraint No exposure to entrance
Level change is
entrance Level change
ALAND
Level change is a major constraint Internalised
Source:
BUILDING B
Centralised lobby and level change are major constraints
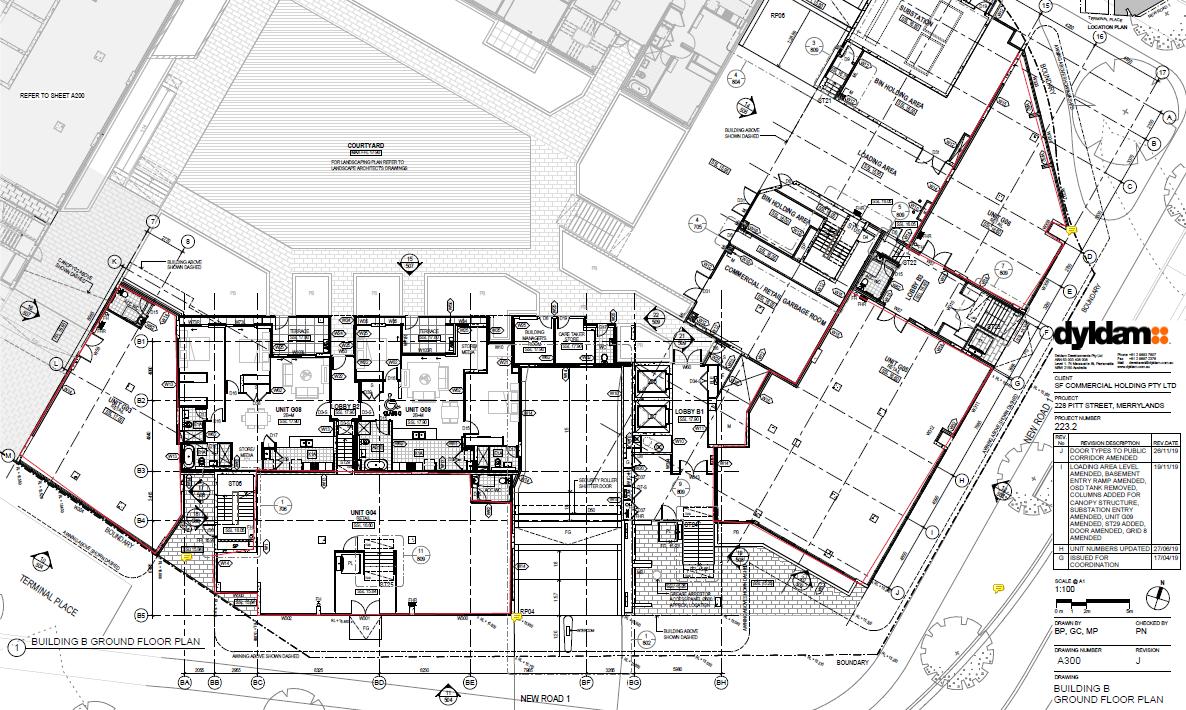
entrance
Level change
23/02/2022 Merrylands Market Assessment Page 46
Internalised
Source: ALAND
23/02/2022 Merrylands Market Assessment Page 47
BUILDING C
Level change Internal entrance with no exposure
Source: ALAND
BUILDINGS F-J (SITE A&B)
Source: ALAND
Limited exposure to the north
Limited exposure to the north
Exposure to the north blocked by tree line
No through road limits passing traffic
23/02/2022 Merrylands Market Assessment Page 48
SWOT ANALYSIS
Strengths
• Buildings B and J2 have reasonable accessibility and exposure to those moving through from the station.
• Building A has a strong frontage to passing trade along Pitt Street.
• Large floor area proposed allows for a critical mass of facilities and precinct development (e.g. a dining precinct, services precinct etc).
• Open space within the development is unique within the Merrylands town centre and is a key strength to be emphasised and built upon.
• Provision of dedicated parking for retail customers
• Proximity to Merrylands Station and public transport interchange
Weaknesses
• The site has varying levels of exposure to Pitt Street. Building A has the greatest level of exposure to vehicle traffic but pedestrian activation at this part of Pitt Street is limited given the Stockland Merrylands carpark entrance on the western site of Pitt Street.
• Other than Buildings B and J2, the other buildings have moderate levels of exposure to passing pedestrians moving through from the station.
• The area is relatively internalised, though the future on-site residential population will drive some level of activity.
Opportunities
• Opportunity to provide a new retail precinct and new community focal point for existing and future residents
• There is currently very limited outdoor dining options in Merrylands. Outdoor dining and public open space would assist in creating a new meeting place for the local community
Threats
• Strong and entrenched competition from Stockland Merrylands limits the potential for retail at the subject site, especially supermarket type anchors.
• The existing retail offer along Pitt Street and Merrylands Road features a broad offer, albeit predominantly independent retailers. There is a risk of oversaturation in particular categories (e.g. grocers, hair and beauty)
• Per capita spending metrics for the trade area are 22% below the average for Greater Sydney.
• Internalised streets may suffer from limited passing trade as they do not connect to other destinations
23/02/2022 Merrylands Market Assessment Page 49
TRADE AREA AND SPENDING
23/02/2022 Merrylands Market Assessment Page 50
TRADE AREA DEFINITION
Key Findings
The trade area for the retail component of the proposed development has been based on a 10minute walk time, reflecting the likely draw of foot traffic around Merrylands. A description of each trade area sector is as follows:
• On Site – captures the on-site residents from the residential component of ALAND’s development. The timing and scale of residential development has been provided by ALAND.
• Primary – covers a 10-minute walking catchment from the subject site, excluding onsite residents. The primary extends to the M4 Motorway in the north to capture Holroyd, Woodville Road in the east, Myall Street in the south and Clarence Street in the west.
It is likely that retail on the subject site would draw business from beyond the trade area such as those using Merrylands Station or in the area to shop at Stockland Merrylands.
Merrylands Trade Area
23/02/2022 Merrylands Market Assessment Page 51
TRADE AREA POPULATION
Key Findings
The chart opposite shows the population forecast for the trade area by calendar year. Forecasts are based on ABS Estimated Resident Population data, Transport for NSW population projections, assumptions relating to the impacts of COVID on short term growth rates and assumptions relating to the short term development pipeline for the trade area, including on-site development.
The trade area population is estimated at 15,240 at 2022 and has only grown by ~160 people since 2017. However, the trade area is expected to add an additional 5,390 people over the next five years, a growth rate of 6.2% per annum. The strong growth is driven by on-site development and other high density apartment stock coming online in Merrylands.
By 2037, the trade area is expected to grow to 24,230, including over 2,800 on-site residents. Over the 10 years to 2037, an additional 3,600 people are expected to move into the area at a growth rate of 1.6% per annum.
New dwelling approvals (NDA’s) within the trade area over the last seven years are illustrated on the chart opposite. Excluding FY21, approvals have averaged ~260 per annum, driven by apartments. The large jump in FY21 of 804 approvals supports the rapid population growth forecast over the next five years.
Given Merrylands is largely built out, future growth is likely to come from high density apartment living around Merrylands Station.
Population Forecast
New Dwelling Approvals 23/02/2022 Merrylands Market Assessment Page 52
Source:
ABS; Urbis
268 103 352 241 377 135 352 804 0 250 500 750 1,000 FY14 FY15 FY16 FY17 FY18 FY19 FY20 FY21 Townhouses & Apartments Houses 15,080 15,240 19,100 20,030 21,410 1,530 2,820 2,820 15,080 15,240 20,630 22,850 24,230 0.0% 2.0% 4.0% 6.0% 8.0% 0 5,000 10,000 15,000 20,000 25,000 30,000 2017 2022 2027 2032 2037 Annual Growth Rate (%) Population (No.) Primary On Site Annual Population Growth (%)
Source: ABS; TfNSW; Urbis
TRADE AREA DEMOGRAPHICS
Key Findings
The key socio-economic characteristics of the Merrylands trade area, as sourced from the 2016 ABS Census, are highlighted below:
• The trade area is less affluent than average with per capita and household incomes levels 30% and 26% below the Greater Sydney average respectively.
• The age profile of residents is younger than Sydney with an average age of 33.0 compared to 36.8. The biggest variation is in the 25-39 years cohort, indicating a majority of residents are in the household formation age.
• The relatively low proportion of trade area residents living in separate houses indicates that apartment living is accepted in Merrylands. Only 27.1% living in a detached dwelling compared to 57.4% for Greater Sydney.
• The proportion of family households is in line with Sydney at 48.5%.
• White collar workers account for a below average proportion of the population, at 12.1% lower than the Metro Sydney average. The trade area’s workforce is largely skewed towards employment in health care, retail trade and construction.
• The proposition of overseas born residents in the trade area is 63.1%, 23.9 percentage points above the Sydney average. The retail offer at the site will need to be tailored to this demographic, particularly given the high proportion of residents of Asian and Middle Eastern backgrounds.
Trade Area Socio-Demographic Profile
23/02/2022 Merrylands Market Assessment Page 53
Trade Area Sydney Var'n to Sydney Income Metrics: Per Capita Income 28,350 40,234 -30% Average Household Income 79,170 106,502 -26% Age Profile: % 0-14 years 19.7% 18.7% +1.0% % 15-24 years 13.0% 13.1% -0.1% % 25-39 Years 34.1% 23.5% +10.6% % 40-59 Years 20.8% 25.9% -5.1% % 60+ Years 12.4% 18.9% -6.5% Average Age 33.0 36.8 -3.8 Household Metrics: % Separate House 27.1% 57.4% -30.3% % Family Households 48.5% 48.0% +0.6% % Owned Outright 19.2% 31.0% -11.8% Average Household Size 2.90 2.78 0.12 Other Metrics: % White Collar Workers 62.6% 74.7% -12.1% % Overseas Born 63.1% 39.2% +23.9%
Source: ABS; Urbis
TRADE AREA SPENDING
As shown in the chart opposite, average per capita spending levels across the trade area are 22% below that of Greater Sydney, with all product groups below average.
Per capita spending on food is 16% below the average and non-food is 30% below average. The two strongest product groups are food & groceries (13%) and food catering (-17%), indicating that retail at the subject site should be food focussed.
The total retail expenditure capacity of the trade area is estimated to grow from $188 million in 2022 to $343 million by 2037 (real terms, inclusive of GST), reflecting an average annual growth of 4.1%.
The strong population growth projections help offset the relatively weak spend per capita figures. The total retail spending market is expected to almost double in real terms over the next 15 years.
Per Capita Spending Variation from Sydney Average Spending Forecast (Real $2022, incl. GST)
Food & Groceries Liquor Food Catering Apparel H'wares E'tronics Bulky Goods Leisure General Retail Services Total Retail Annual Growth = Pop Growth + Spend Per Capita Growth On Site: 2022 0 0 0 0 0 0 0 0 0 0 0 2027 8 1 4 2 0 1 2 1 1 1 20 n.a. n.a. n.a. 2032 14 1 7 4 1 2 3 2 2 1 38 14.0% 13.0% 0.9% 2037 15 1 7 4 1 3 4 2 3 1 40 0.9% 0.0% 0.9% Primary: 2022 75 7 35 18 3 10 16 7 11 6 188 2027 97 9 46 25 5 14 21 10 15 7 249 5.8% 4.9% 0.8% 2032 103 10 50 28 5 16 24 11 17 8 271 1.7% 0.9% 0.9% 2037 112 11 55 32 7 19 28 12 19 9 303 2.3% 1.4% 0.9% Total Trade Area: 2022 75 7 35 18 3 10 16 7 11 6 188 2027 104 10 50 27 5 15 23 11 16 8 268 7.4% 6.5% 0.8% 2032 117 11 57 31 6 18 27 12 19 9 309 2.9% 2.0% 0.9% 2037 127 12 62 36 7 22 31 14 22 10 343 2.1% 1.2% 0.9% 23/02/2022 Merrylands Market Assessment Page 54
1. Spending figures are inclusive of GST and exclusive of inflation
Source
-13% -39% -17% -26% -41% -18% -35% -32% -26% -40% -16% -30% -22% -50% -40% -30% -20% -10% 0% F&G Liquor Food Catering Apparel H'wares E'tronics Bulky Goods Leisure General Retail Services Food Non-Food Total Retail Var.. From Sydney Average (%)
Source : ABS; MarketInfo; Urbis
: ABS; MarketInfo; Urbis
COMPETITION
23/02/2022 Merrylands Market Assessment Page 55
COMPETITIVE CONTEXT
Key Findings
Stockland Merrylands is the competitor located directly opposite the subject site. The centre is anchored by three discount department stores (DDS’) and three supermarkets, acting as the major retail destination in the area south of Westfield Parramatta.
While there are no other strictly defined shopping centres in the primary trade area, Merrylands Road and McFarlane Road have a large provision of strip retail. The following page further details the retail provision for Westfield Parramatta, Stockland Merrylands and the strip retail along Merrylands and McFarlane Road.
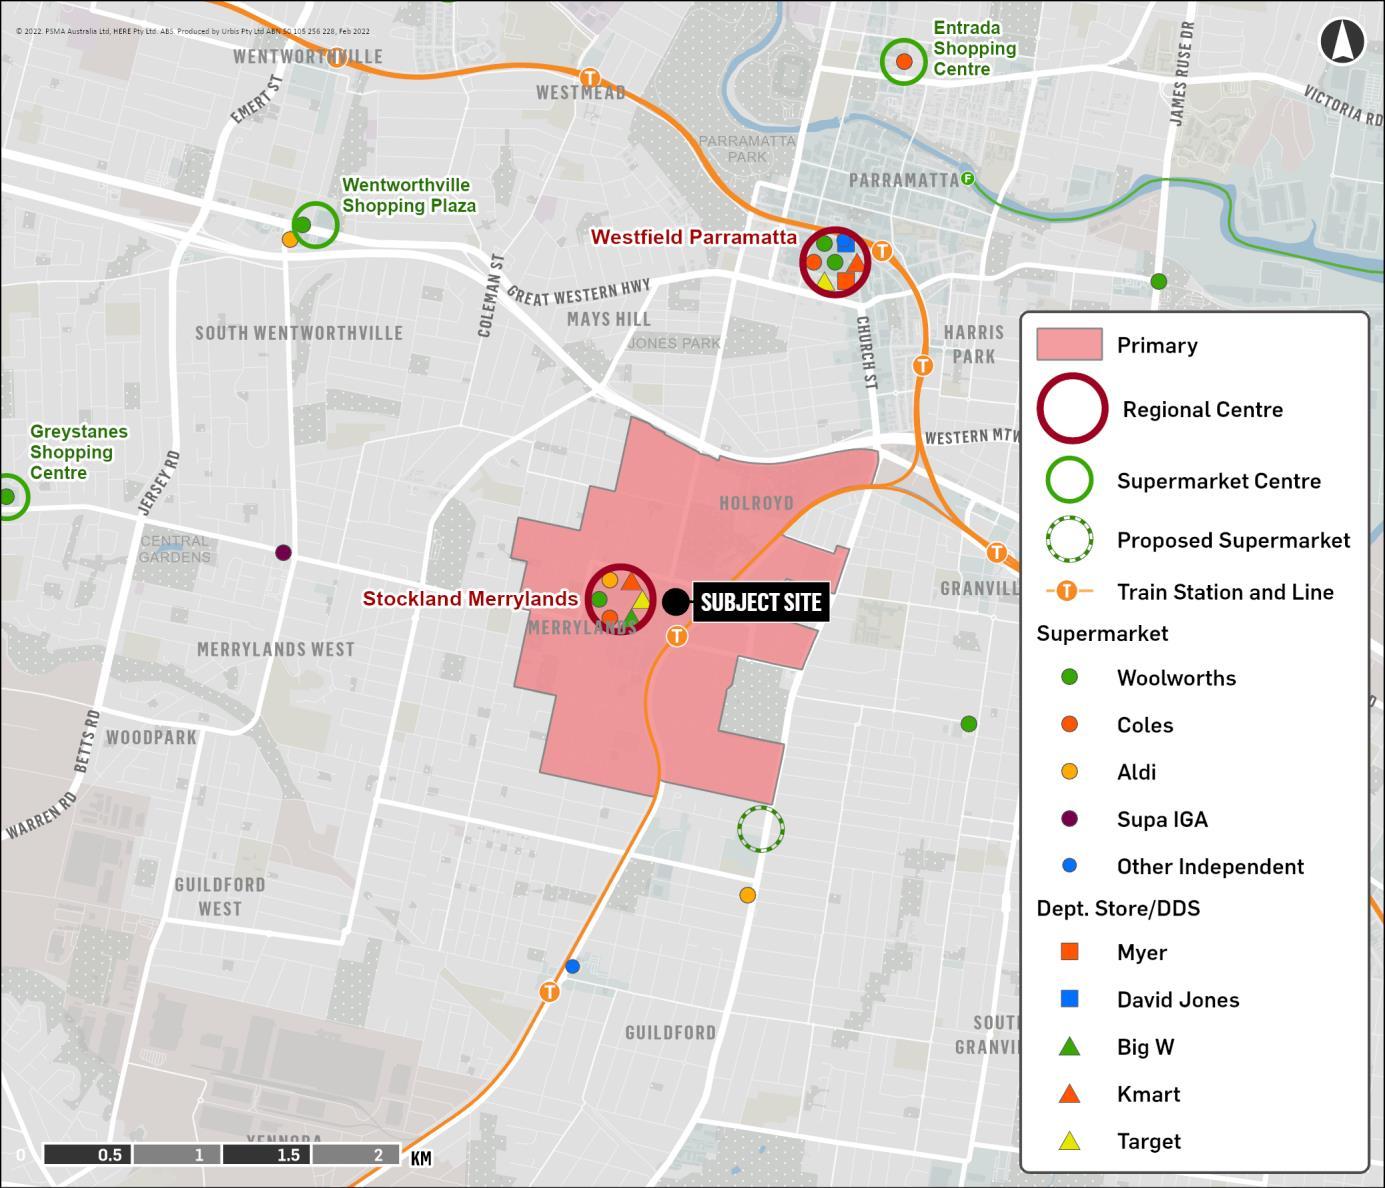
There are several supermarkets just beyond the trade area, namely Aldi Guildford, Woolworths Granville and Supa IGA Merrylands West.
The Merrylands East Neighbourhood Centre is the only proposed development within a 2 km radius of the subject site that includes a supermarket anchor. The centre has received development approval and is expected to be completed in 2026. There is provision for over 10,000 sq.m of retail floorspace including a full-line supermarket and liquor (3,842 sq.m), and specialty floorspace totalling 6,269 sq.m.
Merrylands East Neighbourhood Centre will also comprise a 95-room hotel, 413 apartments, a child care centre and a public park.
Adjacent to the subject site, the 244-252 Pitt Street development will include over 1,100 sq.m of retail floorspace in addition to the 161 apartments, 1,467 sq.m of commercial office, a 500 sq.m gym and a 656 sq.m childcare centre.
Competition Map
23/02/2022 Merrylands Market Assessment Page 56
Source: Urbis
HIGHER ORDER CENTRES
Westfield Parramatta
Centre Class: Regional Retail GLA: 121,094 sq.m
Distance:
2.8 km
Majors: Myer, David Jones, Target, Kmart, Woolworths, Coles
Comment:
Westfield Parramatta is the second largest regional centre in New South Wales, featuring 18 mini majors and 378 specialty stores.
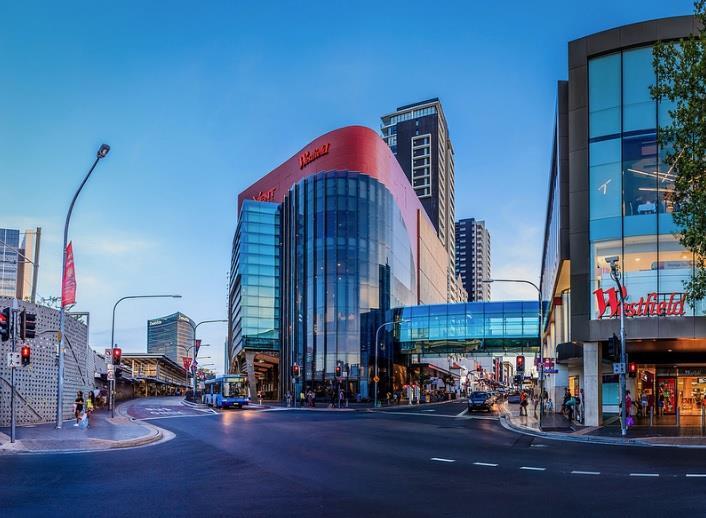
Given the centres large footprint, it serves much of Western Sydney with national brand tenants and a strong focus on apparel. The entertainment and leisure offer includes Event Cinemas and an extensive dining offer stretching down Church Street and integrating with Parramatta Station.
According to Scentre Group, total centre turnover was $714 million in 2020, 18% down on the previous year due to COVID-19.
Stockland Merrylands
Centre Class: Regional Retail GLA: 59,656 sq.m
Distance: 0.1 km
Majors: Big W, Kmart, Target, Woolworths, Coles, Aldi
Comment: Stockland Merrylands is a triple-DDS based regional shopping centre supported by three minimajors and 162 specialty shops.
The centre’s offer is largely targeted towards the mid-market and benefits from its proximity to Merrylands Station and the surrounding population growth from higher density residential development.
According to the Property Council of Australia, Stockland Merrylands achieved turnover of $396 million in calendar year 2020 with footfall in the order of 11 million customers.
Remainder Merrylands
Comment:
The Merrylands town centre extends along Merrylands Road from the station precinct. The town centre also includes McFarlane Street on the southern side of Stockland Merrylands.
Merrylands town centre is largely comprised of older, small scale retail shops and low density commercial offices. Building heights are typically 12 storeys, however, residential development in the area is seeing increased densities and increased building heights.
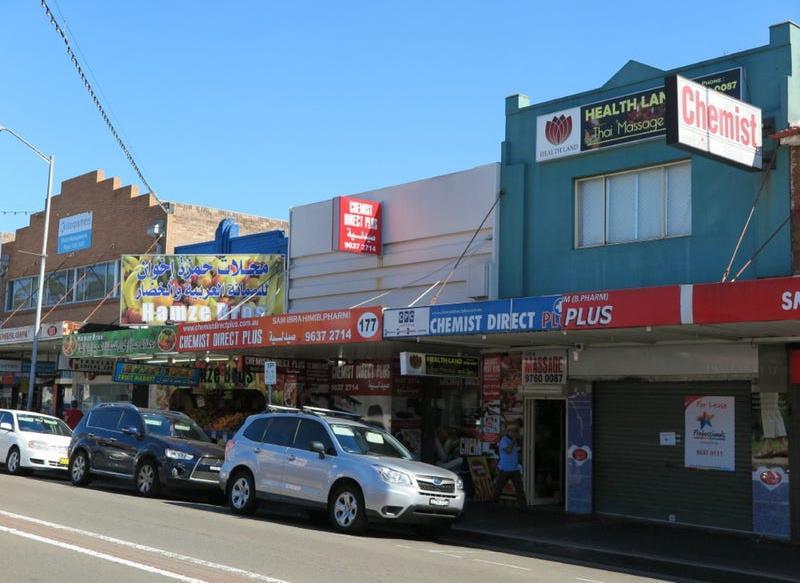
In addition to Stockland Merrylands and Merrylands Road, the Merrylands RSL club is located south of the station and is currently undergoing a redevelopment.
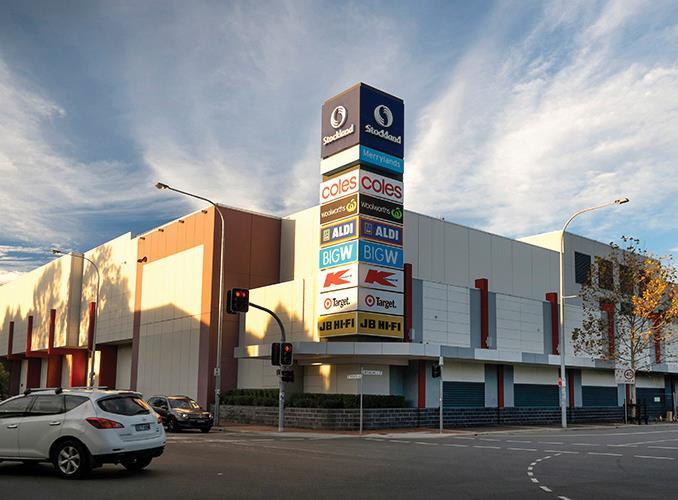
23/02/2022 Merrylands Market Assessment Page 57
Source: PCA Shopping Centres Online, Scentre Group
CASE STUDIES AND SUCCESS FACTORS
23/02/2022 Merrylands Market Assessment Page 58
KEY SUCCESS DRIVERS
Key Demand Drivers for Retail Development
Factor
1. Anchor Tenants
Specialty shops require the activity generated by major tenants.
If they are located off the ‘ant track’ of shopper activity, there can be leasing problems.
Implications for the Subject Site
• It is unlikely a large supermarket chain would locate at the subject site given there are three supermarkets in Stockland Merrylands. Consequently, the retail provision should be modest in scale to prevent high levels of vacancy and low footfall.
• Attracting a name brand tenant will be critical for the success of the retail precinct.
2. Transport Accessibility and Infrastructure
A retail centre needs to be accessible to its catchment by several modes. Car accessibility remains particularly important.
• The site is highly accessible by car, with passing traffic along Pitt Street and Neil Street.
• Public transport access is high given Merrylands Station is located adjacent to the subject site and bus routes run along Pitt Street.
• Retail on the subject site will benefit from the substantial scale of residential development planned on-site and recently completed apartment developments in Merrylands. Given the large retail provision including Stockland Merrylands and Merrylands Road, the area is highly walkable.
3. Car Parking
The co-location of car parking with retail in suburban locations is critical for the success of the precinct.
• While the area is highly walkable, Merrylands is still an area that is car dependent. Sufficient parking should be provided on-site for visitors in addition to parking required for the residential component of the proposed development.
23/02/2022 Merrylands Market Assessment Page 59
KEY SUCCESS DRIVERS
Factor
4. Exposure
The centre needs to obtain the highest level of exposure to passing and local trade to maximise its utilisation by a wide cross section of the community. Specific tenants within the precinct also need to have good exposure to customer foot traffic, with isolated portions of a centre that received limited pedestrian traffic performing at lower levels.
5. Quality of Design
The quality of a retail offer will affect its attractiveness to potential customers and therefore its performance.
As such consideration needs to be given to the choice of finishes that create a theme, differentiate the precinct from its competitors and result in a character that will have enduring appeal
Implications for the Subject Site
• Pitt Street offers the highest levels of passing traffic and pedestrian activity given its linkages to Stockland Merrylands and Merrylands Station. Retail tenancies fronting Pitt Street will likely be more successful than those set back from the main road.
• Retail located in Site A&B would likely suffer from low levels of exposure and passing foot traffic. As such, it is unlikely that dedicating this space to retail uses is the best outcome for the subject site. Instead, retail access points should front Pitt Street.
• Given the quality of shopfronts along Merrylands Road is low, there is potential at the subject site to create an offer of much higher quality than what currently exists in Merrylands.
• Food and beverage tenancies are likely to receive the most benefit from a unique and high quality design.
23/02/2022 Merrylands Market Assessment Page 60
CASE STUDY ANALYSIS – DO THE SIMPLE THINGS RIGHT
Overview
The following case studies have been selected as examples of comparable mixed-use development. These are helpful in informing our review of scale, composition and layout of retail at Merrylands. The case studies include the following Sydney centres:
‒ Mascot Central
‒ East Village
‒ The Mix at Chatswood Place
‒ Lachlan’s Line
‒ Clemton Park Shopping Village
Key Learnings
The case studies highlight a number of common themes that characterise successful mixed-use retail development. The following key lessons emerge for the subject site:
• Integration with public transport: Retail tenancies fronting Pitt Street and Terminal Place will likely benefit from passing traffic by users of Merrylands Station and the bus network. One of Mascot Central’s key strengths is the integration of retail tenancies along the ant track between the station and the apartments.
• Focus on food and daily needs: The specialty retail mix should cater to daily needs such as a convenience store, pharmacy and food & beverage offer, particularly given the subject site is unlikely to secure a traditional anchor tenant like a national supermarket chain.
• Focus retail on a single, connected level: Strong performing retail within a mixed use precinct is often provided on a single level, creating ease of access between retail tenancies, and separation from other uses. The level changes in the current scheme have been highlighted as a limitation in the scheme review. Furthermore, the separation of retail uses across both sites is unlikely to create a well integrated and successful retail precinct.
• Locate retail in external tenancies: Outward-facing restaurants and cafes allow for outdoor seating options that activate the front of the precinct. For the subject site, activation along Pitt Street and Terminal Place will be critical.
• Use a clean and simple internal fit-out: Mixed use retail centres that incorporate unique and high-quality finishes are generally successful if this is aligned to a distinct retail experience (e.g. East Village’s urban marketplace experience), which requires significant scale and investment. For the scale of retail proposed at the subject site, a clean and simple internal fit-out is likely to be more effective. This will allow the subject site to stand out from the existing strip retail in Merrylands which is dated.
23/02/2022 Merrylands Market Assessment Page 61
MASCOT CENTRAL
About
Meriton’s Mascot Central is an open air retail laneway precinct with direct connection through to Mascot train station. Key features include:
▪ Anchored by Woolworths supermarket, all retail tenancies are external facing to a pedestrian thoroughfare
▪ The development includes a childcare centre, two aquatic and leisure centres for residents, and green open space
▪ Approximately 1,400 sq.m of other retail around 150 metres to the east, adjacent to Mascot train station
Strengths
1. Completely external retail precinct with strong outdoor amenity, designed as an open air retail laneway with modern finished, gardens, lighting and public seating
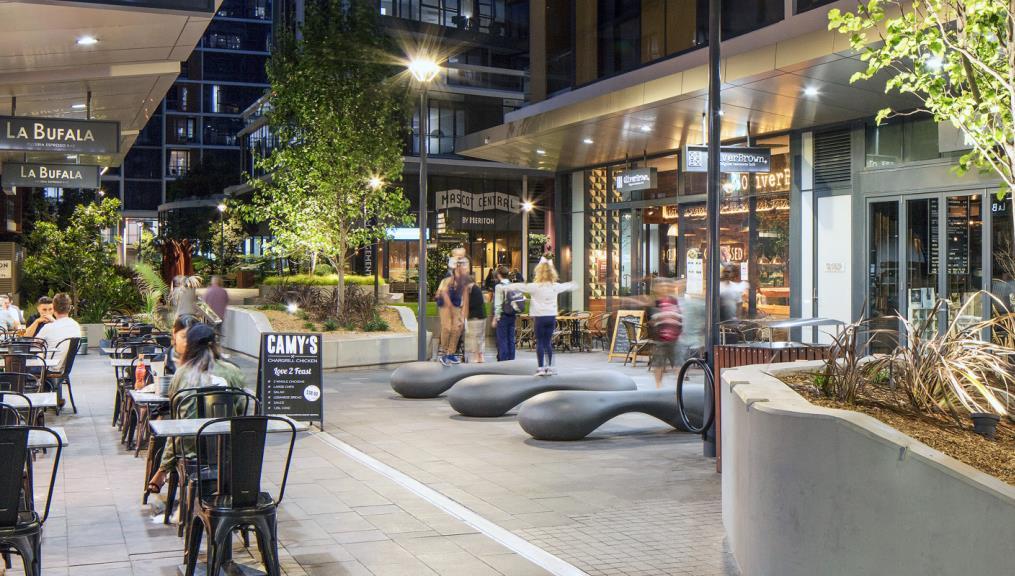
2. External facing tenancies allow for outdoor seating at food and beverage retailers, activating the laneway
3. Strong access to a fast growing resident population due to significant surrounding apartment development
4. Layout encourages a strong pedestrian ant-track of residents between apartments and the train station
5. Retail mix focused on convenience and food retail
Weaknesses
1. Lack of frontages to streets with passing traffic limits exposure
2. Separation from other retail closer to the train station creates competition for trade
3. Small tenancies limit the size of potential tenants
Precinct Overview
▪ Completion Year: 2016
▪ Residential units: 800 units and 386 serviced apartments
▪ Estimated Retail GLA: 5,000 sq.m
Food Retail: Woolworths (3,200 sq.m), BWS liquor, Asian supermarket
Food and Beverage: 8 tenancies – mix of cafes and fast casual dining
Non-Food: 5 tenancies, including Priceline pharmacy, gift shop and a mix of personal services retailers
Non-Retail: Mascot medical centre
▪ Car Parking: Yes available
▪ Residents within 1 km: 16,000 (2020 ERP)
23/02/2022 Merrylands Market Assessment Page 62
EAST VILLAGE, ZETLAND
About
East Village is a mixed use development in Zetland that successfully combines residential units and commercial office space above, with retail and services in the podium level. Key features include:
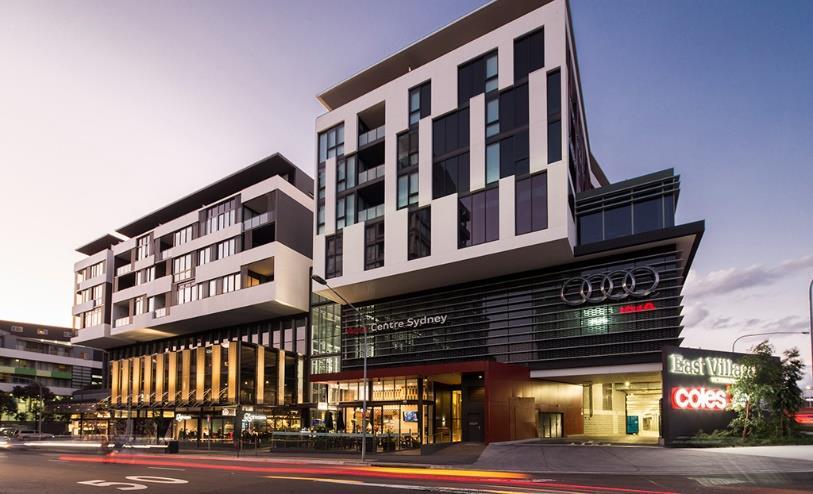
▪ Located in the suburb of Zetland, around 3 km south of Sydney CBD
▪ Ground level retail is anchored by Coles, with internal retail designed as an urban marketplace, and external cafes and restaurants
▪ Upper podium levels include 11,400 sq.m of commercial floor space, a 4,000 sq.m Virgin Active Health Club, and Yum Cha Restaurant
▪ It also contains an Audi car service centre with 48 service bays on the eastern side of the development
Strengths
1. Large and affluent on-site and walk-in population, which has grown substantially since opening 7 years ago
2. The centre has a strong convenience retail focus, but also accommodates destinational F&B (e.g. East Phoenix)
3. External cafes and restaurants with outdoor seating options provide external activation
4. Design and fit-out is high-quality, and the approach is distinct from other retail centres in the use of dark finishes and low lighting
5. Exposure to Southern Cross Drive (M1) and access to the surrounding Victoria Park residential precinct
Weaknesses
1. No train access
2. Potential for traffic congestion with proximity to motorway entry points
Precinct Overview
▪ Completion Year: 2014
▪ Residential Units: 223
▪ Commercial GLA: 20,000 sq.m
▪ Estimated Retail GLA: 10,800 sq.m (53 stores)
Food Retail: Coles (4,250 sq.m), bakery, butcher, seafood, fresh fruit and Asian supermarket
Food and Beverage: 16 restaurants, cafes and fast casual dining
Non-Food: 13 fashion and convenience retail tenants
Retail Services: 5 hair and beauty, 2 automotive services
Non-Retail: 6 tenants including Westpac, medical, massage, and travel
▪ Car Parking: 682 (underground)
▪ Residents within 1km: 43,270 (2020 ERP)
23/02/2022 Merrylands Market Assessment Page 63
THE MIX AT CHATSWOOD PLACE, CHATSWOOD
About
Chatswood Place is a mixed use development that features podium level retail and 5 levels of apartments above. The contemporary village ambiance creates a vibrant retail and dining destination within Chatswood’s CBD. Key features include:
▪ Situated approximately 850 m from Chatswood Station
▪ Ground level retail is anchored by a 1,700 sq.m Aldi and supported by 17 tenancies, including a fresh fruit grocer and pharmacy
▪ External cafes and restaurants fronting Victoria Avenue on the plaza level and restaurant level
Strengths
1. Integrates residential accommodation with retail, an alfresco dining precinct and community facilities (e.g. childcare services) to create an allencompassing offering onsite
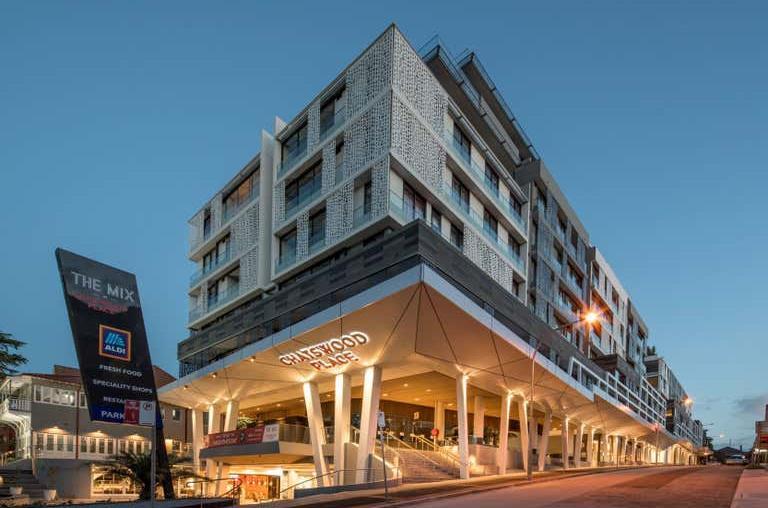
2. External cafes and restaurants with outdoor seating options provide external activation fronting Victoria Avenue
3. Proximity to surrounding residential precinct drives footfall, due to convenience over larger competition such as Westfield Chatswood
4. Location along Chatswood CBD fringe allows proximity to the vibrant centre and transport but retains its quiet, suburban feel
Weaknesses
1. Separation from other retail closer to the train station creates competition for trade
2. Proximity to larger retail offerings in Chatswood CBD
3. Multi-level development due to sloping site. Restaurant offer is split across two levels, with Level 1 restaurants achieving less visitation. Some tenants perform poorly, possibly due to overprovision of space.
Precinct Overview
▪ Completion Year: 2018
▪ Residential Units: 233 across 5 buildings
▪ Estimated Retail GLA: 3,700 sq.m (17 tenancies)
Food Retail: Aldi (1,700 sq.m) and fresh fruit grocer
Food and Beverage: 10 restaurants, cafes and fast casual dining
Non-Food: 2 convenience retail tenants, including a pharmacy
Retail Services: 2 hair and beauty
Non-retail: 1 childcare
▪ Car Parking: 439 (underground)
▪ Residents within 1km: 29,110 (2020 ERP)
23/02/2022 Merrylands Market Assessment Page 64
LACHLAN’S SQUARE VILLAGE, NORTH RYDE
About Precinct Overview
Lachlan’s Square Village, part of the ‘nbh at Lachlan’s Line’ precinct, is a mixed use development in North Ryde that incorporates podium level retail and residential units above. Key features of the development include:
▪ Located within proximity to the North Ryde metro station and adjacent to Macquarie Park’s business corridor
▪ The 5,000 sq.m retail precinct is anchored by Coles and Liquorland, which opened in September 2020
▪ Supported by 11 specialty tenants, including cafes, restaurants, a medical centre, pharmacy and a gym
▪ The precinct features 592 apartments across 6 residential buildings, a community centre, a public amphitheatre, parks and recreation areas
▪ Forms part of the first stage of a much larger urban regeneration precinct
Strengths
1. Proximity to North Ryde metro station with direct access via pedestrian bridge
2. Exposure to Epping Road and M2 Motorway creates high visibility
3. Strong and convenient access to a fast growing resident and employment population, due to significant surrounding apartment development and proximity to Macquarie Park / North Ryde business centre
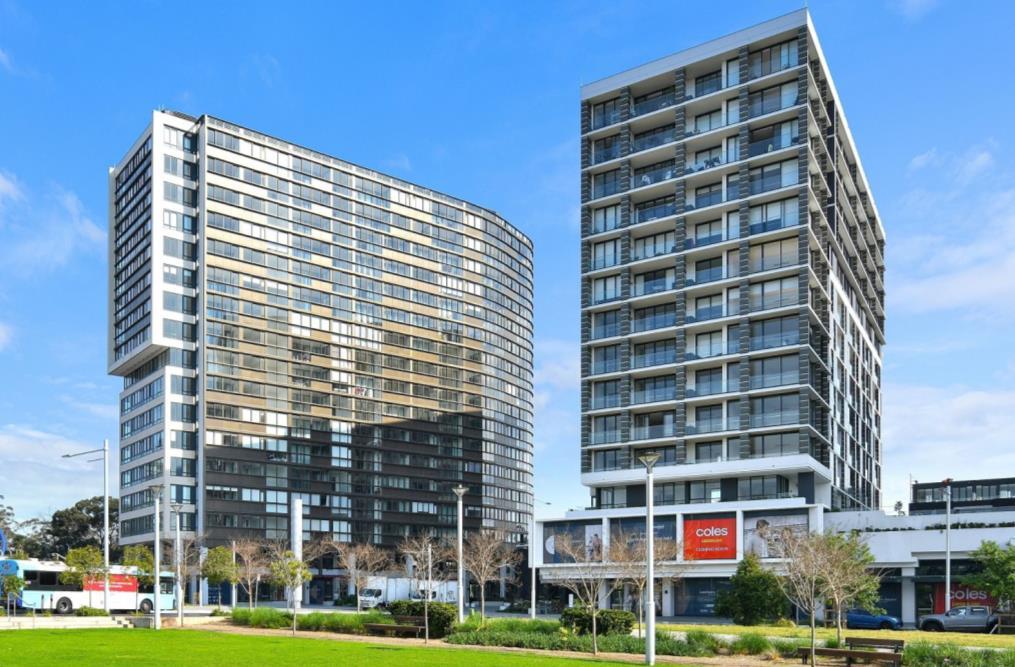
4. External facing tenancies activated by surrounding open community space, public amphitheatre and community centre
5. Significant future residential development in the area will underpin growth. It will not just be reliant on the on-site population base.
Weaknesses
1. Despite site exposure along Epping Road, access is provided via internal streets, which is inconvenient for passing trade.
2. No direct egress from the site onto Epping Road.
▪ Completion Year: 2021
▪ Residential Units: 592
▪ Community Centre GLA: 1,225 sq.m
▪ Estimated Retail GLA: 5,000 sq.m (17 stores)
Food Retail: Coles (2,736 sq.m), Liquorland (136 sq.m),
Food and Beverage: 4 restaurants and 1 café
Non-Food: 1 pharmacy
Retail Services: 2 hair and beauty
Non-Retail: 5 tenants including a gym and real estate agency
▪ Car Parking: 884 (3 basement levels)
▪ Residents within 1km: 9,150 (2020 ERP)
23/02/2022 Merrylands Market Assessment Page 65
CLEMTON PARK SHOPPING VILLAGE, CAMPSIE
About Precinct Overview
Opened in March 2017, Clemton Park Shopping Village is a master-planned residential community situated in Campsie . Key features of the development include:
• Over 700 residential apartments across 11 low-rise residential buildings
• A piazza-style retail precinct featuring a full line Coles and Liquorland as well as both indoor and al fresco dining
• A Bupa aged care facility featuring 144 aged care beds
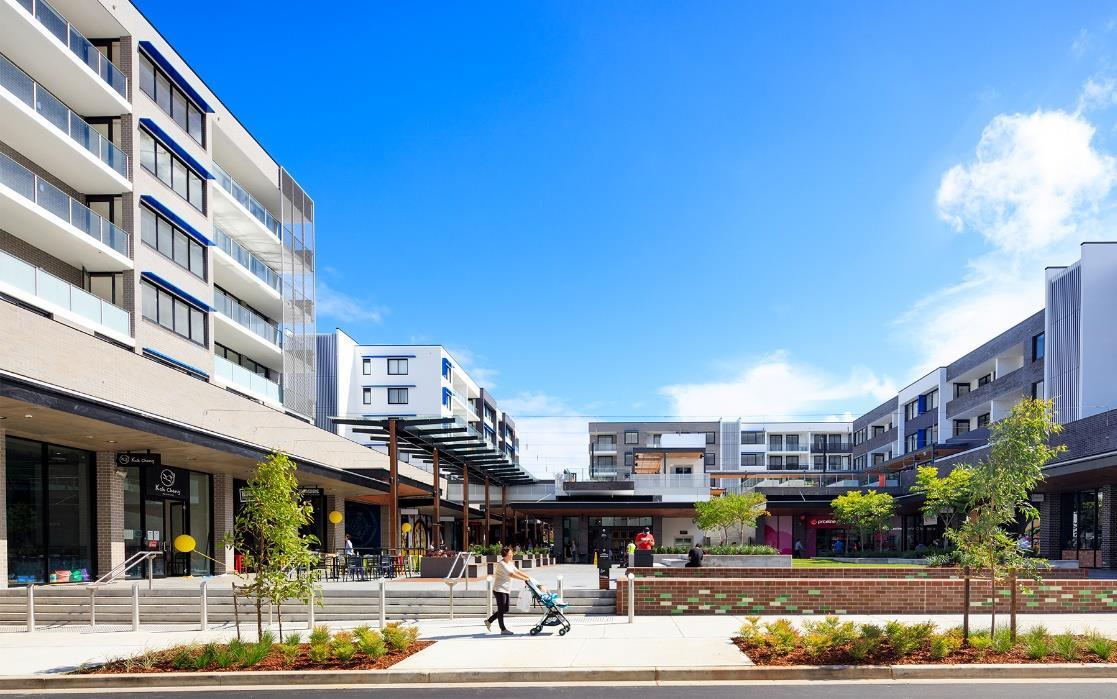
• A child care centre
• Community amenities including a community vegetable garden, children’s play area, community centre, BBQ facilities and several open spaces
Strengths
1. External facing tenancies activated by open air piazza, creating a meeting place for local residents
2. Provides an destinational offer to on-site residents by combining residential living with essential elements of contemporary living, including community amenities and convenience and food retail
3. Ability to leverage off large employment population in the adjacent industrial precinct and established resident population nearby
Weaknesses
1. Less accessible from Campsie station than competing centres within the Campsie town centre
2. Surrounding residential area is relatively low density
▪ Completion Year: 2017
▪ Residential Units: 700+
▪ Estimated Retail GLA: 7,000 sq.m (20 stores)
Food Retail: Coles (2,700 sq.m), Liquorland (136 sq.m),
Food and Beverage: 7 restaurants and cafés
Non-Food: 3 tenants including a pharmacy and dollar store
Retail Services: 3 health, hair and beauty tenants
Non-Retail: 5 tenants including a gym and medical centre
▪ Car Parking: basement parking available on-site
▪ Residents within 1km: 23,800 (2020 ERP)
23/02/2022 Merrylands Market Assessment Page 66
COMPOSITION AND PERFORMANCE
23/02/2022 Merrylands Market Assessment Page 67
INDICATIVE TENANCY MIX – SITE C
Key Findings
The figure opposite shows an indicative tenancy mix for buildings A, B and C (Site C).
It is recommended that the retail tenancies should be fronting Pitt Street where possible given there would be higher levels of exposure to passing traffic.
As such, a restaurant should be located on the north-west corner of the site. Another restaurant or café should occupy the adjacent tenancy to complement the corner site.
A drawcard national pharmacy operator such as Chemist Warehouse would likely suit the south-west corner given the larger tenancy size and visibility from Pitt Street.
Given the lower levels of exposure on the eastern half of Site C, it is recommended that non-retail uses such as a gym, medical and/or allied health occupy these tenancies, noting that similar uses are proposed for 244-252 Pitt Street.
As discussed, retail on this site faces challenges stemming from a lack of exposure and changes in level which can limit the success of the retail precinct.
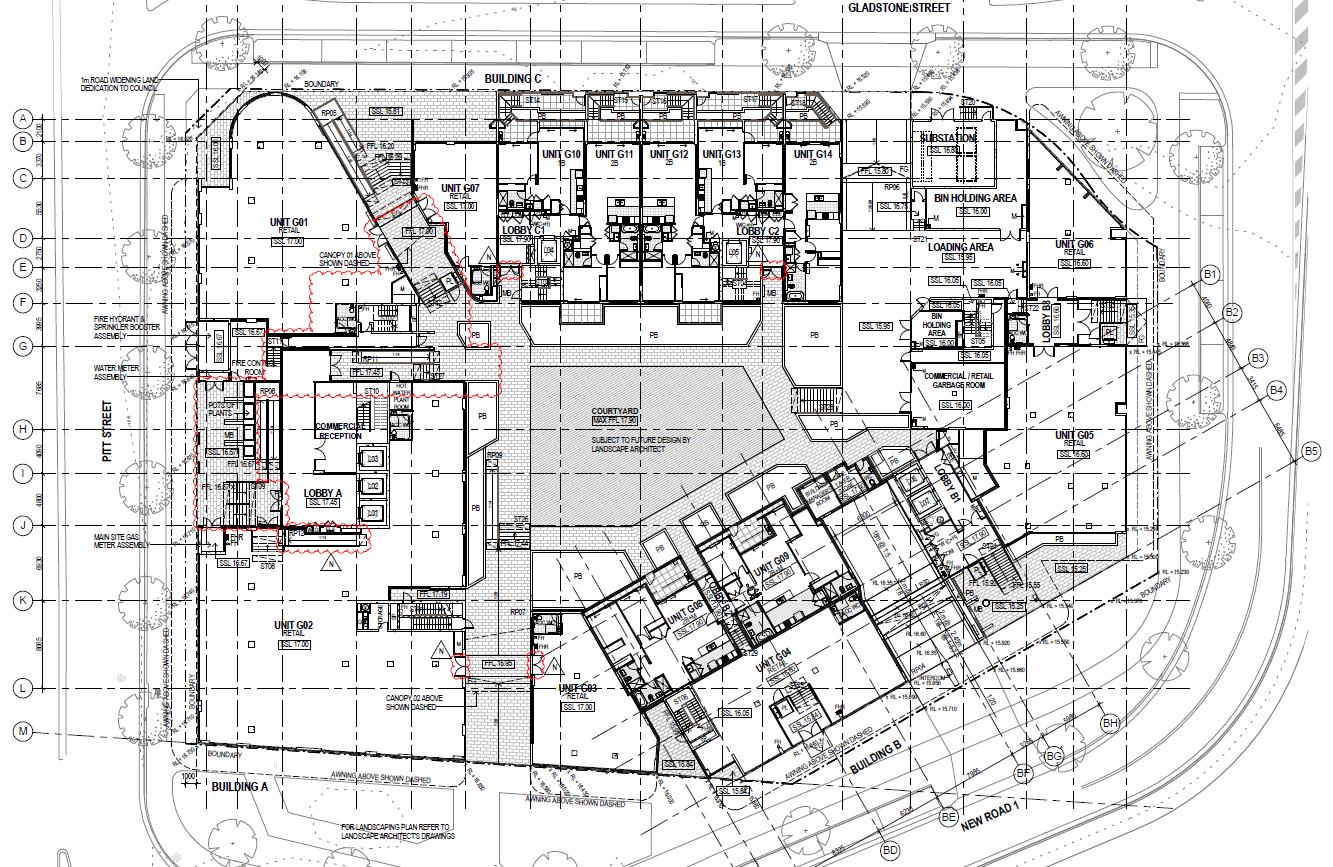
Composition –
C 23/02/2022 Merrylands Market Assessment Page 68 Restaurant
Medical/Allied Health Medical/Allied Health Café/Restaurant Food & Groceries Food catering General retail Non-Retail
Indicative
Site
Chemist Warehouse Convenience Store Gym
INDICATIVE TENANCY MIX – SITE A&B
Key Findings
The figure opposite relates to an indicative tenancy mix for Site A&B. From discussions with ALAND we note that the location of retail on these sites is indicative only. As such, we are referring to general areas within the precinct rather than specific tenancies.
Site A&B generally faces more challenges from a retail perspective than does Site C given the high degree of separation from Pitt Street. The lack of exposure will likely lead to lower turnover levels, higher vacancy and sub-par rents compared to what would be achieved by tenancies in Site C fronting Pitt Street.
If retail is going to be located on this site, it is recommended that more drawcard tenants such as a restaurant and an IGA are located on the southern side to leverage off of foot traffic on the ant track to Merrylands Station.
Given the tenants on the eastern side of the site have limited exposure to passing traffic beyond on-site residents, it is recommended non-retail tenants such medical uses locate here.
Indicative Composition – Site A&B
23/02/2022 Merrylands Market Assessment Page 69 Restaurant Restaurant IGA (Mixed Business) Café/Restaurant Takeaway Hair & Beauty Medical/Allied Health Non-Retail Food & Groceries Food catering General retail Retail services Non-Retail
TURNOVER AND GROSS RENTAL POTENTIAL
Key Findings
The table opposite outlines the estimated turnover potential of the proposed development at the subject site.
Turnover and rent estimates are drawn from the Urbis Shopping Centre Benchmarks and in-house leasing evidence. Consideration is given to the strengths and weaknesses of the subject site. Given no specific scheme has been provided for Site A&B, assumptions have been made around tenant sizes in line with the plans on the previous page. Total floorspace on Site A&B is ~2,000 sq.m, with the scheme totalling 3,500 sq.m.
Key points include the following:
• Total retail on the subject site is estimated to achieve turnover of $15.4 million, with resultant productivity of $5,770 sq.m.
• Low levels of productivity have been assumed across the total scheme given the lack of exposure for the majority of the site and design issues highlighted in the scheme review. Consequently, relatively low rents have been assumed across the site. We estimate the proposed scheme can achieve gross rents in the order of $490-$570, with total gross rent totalling an estimated ~$1.8 million.
• Rents across Site A&B are lower than Site C given these are secondary locations for retail. As such, we expect this component will have sustained, high vacancy rates and low visitation. The tenancies fronting Pitt Street should achieve a premium given higher exposure.
Estimated Turnover and Rental Potential, 2027 (Nominal Dollars)
23/02/2022 Merrylands Market Assessment Page 70 Building Shop Tenant GLA (sq.m) Turnover ($M) Productivity ($psm) GrossRent ($M) GrossRent ($psm) Occ. Cost Ratio (%) A G01 Restaurant 285 $1.4 $5,000 $0.2 $550-$650 12.0% A G02 Chemist Warehouse 526 $3.4 $6,500 $0.3 $500-$550 8.0% B G03 Convenience 122 $0.9 $7,000 $0.1 $600-$650 9.0% B G04 Gym/Fitness 173 - - $0.1 $300-$400B G05 Medical/Allied Centre 209 - - $0.1 $550-$650B G06 Medical/Allied Centre 96 - - $0.1 $550-$650C G07 Café/Restaurant 73 $0.4 $6,000 $0.1 $700-$750 12.0% F2 TBC Restaurant 305 $1.5 $5,000 $0.2 $550-$650 12.0% J2 TBC Restaurant 258 $1.3 $5,000 $0.2 $550-$650 12.0% TBC TBC IGA 500 $3.3 $6,500 $0.2 $300-$350 5.0% TBC TBC Takeaway 100 $0.6 $6,000 $0.1 $700-$750 12.0% TBC TBC Takeaway 100 $0.6 $6,000 $0.1 $700-$750 12.0% TBC TBC Hair/Beauty 200 $1.0 $5,000 $0.1 $450-$550 10.0% TBC TBC Café/Restaurant 200 $1.0 $5,000 $0.1 $550-$650 12.0% TBC TBC Non-retail 200 - - $0.1 $400-$500TBC TBC Medical/Allied Centre 153 - - $0.1 $400-$500Total Retail 2,669 $15.4 $5,770 $1.4 $500-$580 9.3% Non-Retail 831 - $0.4 $440-$540 Total Scheme 3,500 $1.8 $490-$570
CONSIDERATIONS AND RECOMMENDATIONS
Development Scheme Considerations
In considering the proposed scheme at the subject site, we note the following considerations:
• Quantum of floorspace: At 3,500 sq.m, the proposed scheme is large given there is no clear anchor, significant competition from Stockland Merrylands and strip retail along Merrylands Road. A large provision of specialties with no anchor presents high leasing risk, particularly for tenants in secondary locations on Site A&B with limited exposure.
• Design: Ground floor retail in a mixed-use development should prioritise ease of access and front roads and footpaths with high levels of traffic. The proposed scheme has several level changes which inhibit ease of access and can limit the exposure of shop fronts to passing traffic. Also, the centralised lobby for retail in Building B is a design limitation reducing the visibility of the shop fronts.
• Exposure: The tenancies in Site A&B will have low levels of exposure and could potentially suffer from lower levels of activation. Consideration should be given to clustering retail in Site C on the western side of the development fronting Pitt Street. It will be difficult to create a successful ‘eat street’ concept with the current scheme given the cluster of potential food tenants in Site A&B would have minimal exposure to passing traffic.
• Non-retail Uses: Locating non-retail uses such as a medical uses, childcare and small scale office suites in those tenancies with lower levels of exposure is likely a good outcome given they are less reliant on passing foot traffic than traditional retailers. It should be noted that the proposal at 244-252 Pitt Street includes the provision for a childcare facility, gym and other retail uses and a first mover advantage will be important. The success of non-retail uses can also be enhanced with car parking on the site.
Recommendations
Giving regard to ALAND’s proposed scheme, the strengths and weaknesses of the subject site and the competitive context in Merrylands, Urbis make the following recommendations:
• It is recommended that the quantum of retail floorspace is scaled back and primarily occupies buildings A, B and C on Site C. The lack of exposure and large provision of specialty floorspace in Site A&B creates high leasing risk and it is likely these tenants would underperform. Furthermore, the lack of a clearly defined anchor tenant limits the ability for a large retail provision to be supported on the site.
• Shops in Building A could be enhanced with design changes to include entrances on Pitt Street, removing the need for visitors to enter the precinct via the central courtyard.
• A national brand tenant (such as Chemist Warehouse) should be targeted to occupy the larger tenancy in Building A to act as a draw card for the rest of the precinct and minimise leasing risk.
• The site would benefit from bringing the retail space to one level to increase accessibility and reduce the need for visitors to travel up and down stairs, ramps and lifts.
• Tenancies in Building B and C with poor exposure are better suited to nonretail uses such as a gym and medical uses. Sufficient parking should be provided for visitors in addition to the residential provision.
• Activation of the public space and a new road linking the site to Neil Street could help increase foot traffic, particularly for those tenancies fronting the new road in the middle of the site that don’t benefit from patronage on Pitt Street. This would rely on residents in apartments to the north of Neil Street being able to cross the street and walk through the site to the train station.
23/02/2022 Merrylands Market Assessment Page 71
OFFICE ASSESSMENT

72
CATCHMENT AREA DEFINITION
Key Findings
For the purpose of this commercial office assessment, the Cumberland LGA has been defined as the catchment. Most of the demand for office space within the Subject Site is likely to come from within the LGA. The map opposite shows the subject site's location within this office market.
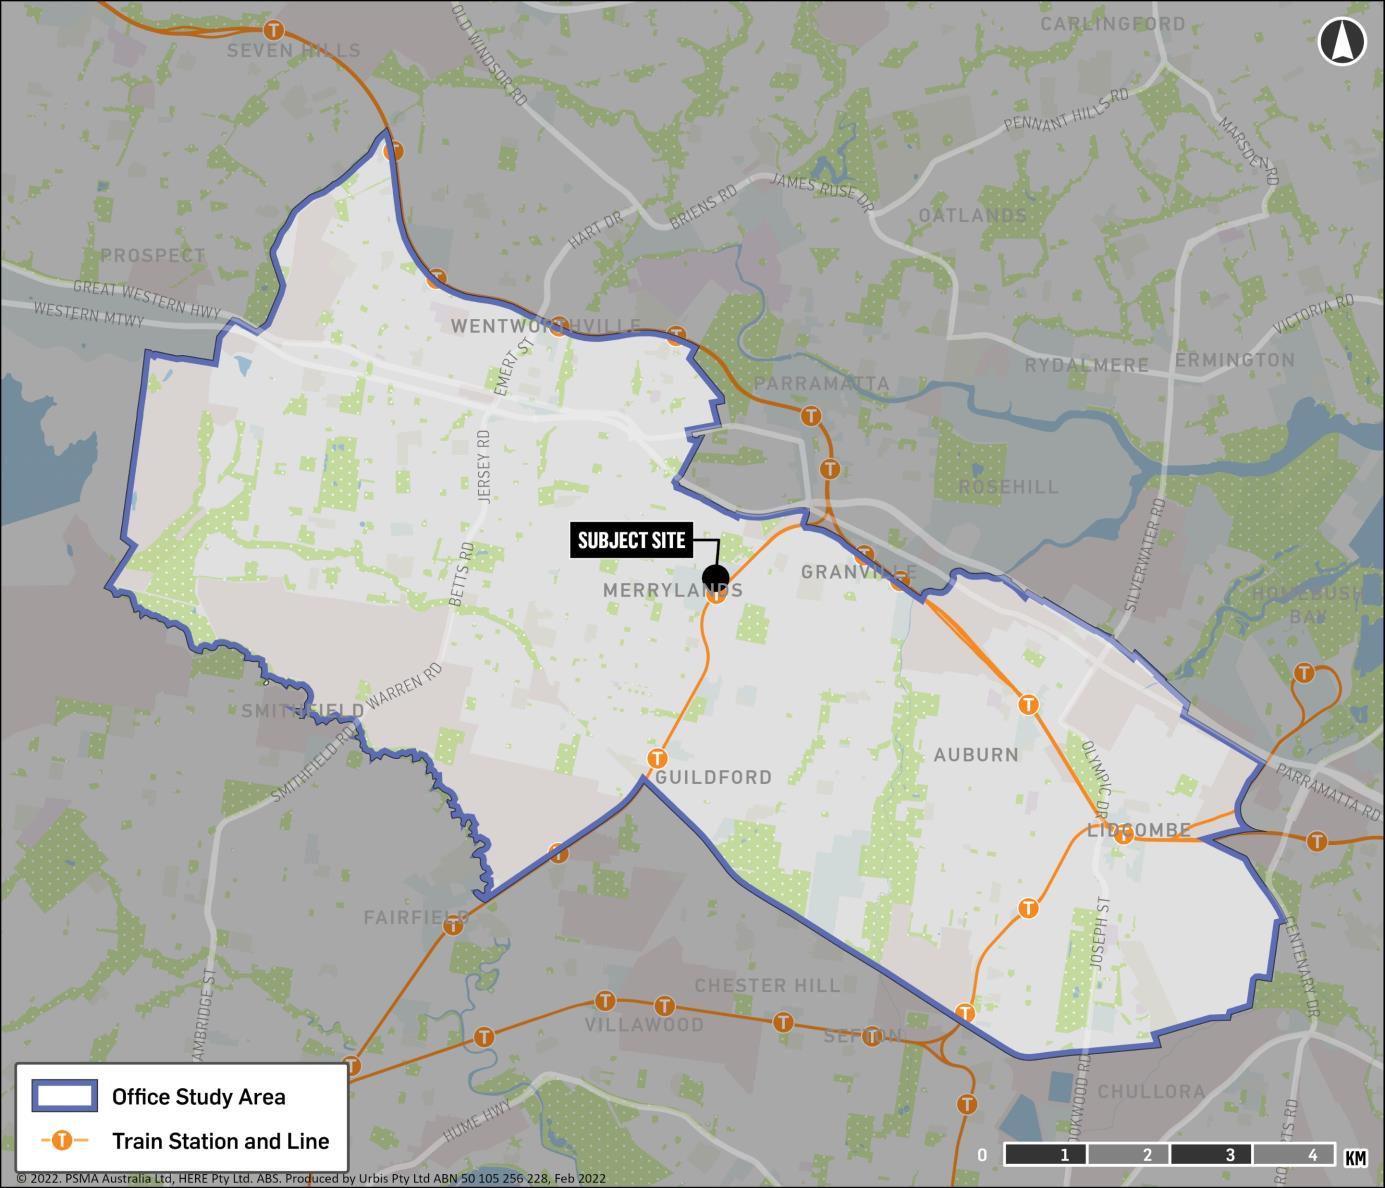
The Merrylands Town Centre is broadly characterised by older, low-scale (1-3 storey) buildings, and commercial space is located on both street level and upper floors. Merrylands’ office development has been predominantly occupied by local services such as real estate agents and property managers, migration and legal services, tax agents and accountants, training and education providers, IT and technology services, and state government services. This mix is consistent across town centres across the broader Western Sydney region.
Office space within the Subject Site is proposed to be 1,225 sq.m and will be located in Building A of Site C, which fronts Pitt Street. Across Terminal Place at 244-252 Pitt Street, leases in the existing buildings are being expired to make way for a new mixed-use building. There are several commercial tenants within these buildings that have benefited from the Pitt Street location and may be prospective options for the Subject Site which should be completed before the site is redeveloped. These businesses can be categorised as Real Estate Agents, Real Estate Managers and Training and Education providers.
Office Context
23/02/2022 Merrylands Market Assessment Page 73
COMPETITIVE CONTEXT
Key Findings
The table right top details the performance of the Parramatta office market from January 2019 to January 2022. While this market is not directly comparable to the Merrylands market, it provides the trends for office space within the area. The key trends are:
• Rising vacancy due to increasing supply levels
• Decreasing rentals due to competition from new supply and the impact of COVID-19
• Firming yields, due to solid investor demand.
A February 2022 Pricefinder analysis shows approximately 2,500 sq.m of vacant office floorspace across Merrylands (excluding buildings being withdrawn for redevelopment). This equates to an estimated vacancy rate of around 5%. While the impact of COVID-19 is in part influencing the level of vacancy, most of the vacancy is in lower quality stock, where demand is weaker. There are no standalone office developments proposed for Merrylands. Four mixed-use projects, however, are proposed to contain commercial floorspace. These are listed in the table bottom right. The development at 244-252 Pitt Street, while at a less advanced stage, is likely to provide competition for later stages of the Subject Sites development. While located directly opposite Merrylands Train Station, the flow of people towards Pitt Street buses and Stockland Merrylands is likely to draw a significant number of people along Terminal Place. The shelter provided by the arcades in 244-252 Pitt Street may increase footfall during inclement weather. Overall, these two developments have similar potential to attract commercial tenants.
Parramatta* Office Market
Proposed Merrylands Commercial Developments
Source: Cordell Connect; Urbis
* Estimated due to size of development and timing of project completion.
Name Estimated NLA (sq.m) Estimated Completion Year Development Stage 233-259 Merrylands Road 117 2022 Construction 327 Merrylands Road 75* 2023 Development Approval 298-302 Merrylands Road / 2-2A Cambridge Street 611 2025 Development Approval 244-252 Pitt Street 3,444 2027 Development Application Total (4) 4,247
23/02/2022 Merrylands Market Assessment Page 74
*Includes Harris Park.
Source: JLL
Unit Dec-18 Dec-19 Dec-20 Dec-22 Total Stock sq.m 719,547 768,421 809,526 887,268 Vacancy Rate % 3.0 3.2 6.1 13.4 Prime Gross Effective Rent $ 489 515 454 418 Prime Gross Effective Rent Growth % 10.4 5.3 -11.8 -7.9 A-Grade Core Market Yield % 5.13% - 6.25% 5.00% - 6.13% 4.88% - 6.00% 4.75% - 5.75%
COMMERCIAL OFFICE DEMAND
Key Findings
The employment forecasts provided by Transport for NSW were formulated in 2016 and have been altered by Urbis to reflect the latest ABS data and the existing and potential impacts of COVID-19. As at 2016, there were 81,097 people employed within the Cumberland LGA, of which a large proportion were in Manufacturing (15%) and Construction (12%). This is largely accounted for by the industrial precincts in Smithfield, Pemulwuy and Guildford.
The number of jobs within the Cumberland LGA is expected to grow to 101,218 in 2031. This equates to 20,121 additional jobs, at an annual growth rate of 1.5%.
Health Care and Social Assistance is expected to record the highest growth in job numbers, accounting for around 4,110 new jobs expected to be added by 2031.
Information, Media and Telecommunications as well as Finance and Insurance are projected to record low growth of around 300-350 new jobs in each sector by 2031. Job growth in Professional, Scientific and Technical Services, Rental, Hiring and Real Estate Services and Administrative and Support Services are expected to drive the majority of future office demand in the LGA.
Professional, Scientific and Technical Services comprise consulting firms, engineers, architects, while Public Administration and Safety includes federal, state and local government administration and services. Real Estate Services and Administrative and Support Services include Property Managers and Agents.
Employment Growth Forecasts Cumberland LGA
23/02/2022 Merrylands Market Assessment Page 75
Total Change Annual Growth Industry Sector 2016 2021 2026 2031 Health Care and Social Assistance 7,763 9,538 10,705 11,873 4,110 2.9% Education and Training 6,065 7,625 8,304 8,983 2,918 2.7% Construction 9,334 10,643 11,424 12,204 2,870 1.8% Professional, Scientific and Technical Services 3,013 4,635 5,153 5,670 2,657 4.3% Transport, Postal and Warehousing 8,697 9,873 10,033 10,193 1,496 1.1% Retail Trade 9,126 9,543 10,081 10,618 1,493 1.0% Manufacturing 12,434 13,411 13,484 13,557 1,122 0.6% Wholesale Trade 6,114 6,048 6,422 6,796 682 0.7% Administrative and Support Services 2,852 2,701 3,080 3,459 607 1.3% Rental, Hiring and Real Estate Services 1,061 1,447 1,481 1,515 455 2.4% Other Services 3,583 3,785 3,899 4,012 429 0.8% Public Administration and Safety 2,891 2,721 3,009 3,297 406 0.9% Financial and Insurance Services 1,912 1,977 2,123 2,269 357 1.1% Information Media and Telecommunications 655 894 924 954 299 2.5% Arts and Recreation Services 722 795 838 881 159 1.3% Accommodation and Food Services 3,964 3,397 3,729 4,060 95 0.2% Electricity, Gas, Water and Waste Services 670 659 670 681 11 0.1% Mining 55 57 58 59 3 0.4% Agriculture, Forestry and Fishing 185 131 134 137 -49 -2.0% Total Employment 81,097 89,880 95,549 101,218 20,121 1.5% Number of Jobs 2016-2031
Source: TfNSW; Urbis
COMMERCIAL OFFICE DEMAND
Key Findings
The table provides an assessment of potential demand for commercial office space in the Cumberland LGA to 2036. The estimate of potential office demand is based on forecast growth in office-based jobs in the LGA, taking into account:
• Employment projections prepared by Transport for NSW and adjusted for COVID-19 impacts
• The number of ‘office’ jobs is estimated based on the expected office-based employment by industry.
Office jobs in the Cumberland LGA are expected to grow by 3,322 between 2021 and 2031. With an assumed office job density of 15 sq.m per worker, the cumulative increase in demand for office space to 2031 is estimated at ~55,400 sq.m. With multiple vacancies in the market, the growth would need to absorb existing space and would place greater competition on new stock.
The concept plans for the development provide for approximately 1,225 sq.m of office space, which would account for around 5.5% of the expected growth in demand for office space in the Cumberland LGA. Merrylands currently accounts for around 21% of commercial space in the Study Area. Being situated close to the train station and within the town centre, the Subject Site is well placed to achieve between 20% and 25% of demand for commercial space in Merrylands, equating to approximately 5% of the Study Area demand. Therefore, the Subject Site is anticipated to support close to the proposed amount of office space by 2024-25.
The subject site is not well suited for traditional officebased industries such as finance and insurance or administrative and support services; however, it could attract real estate agents/managers, solicitors and tax agents. Other alternative uses that could be considered are examined on the next page.
Forecast Office Demand
23/02/2022 Merrylands Market Assessment Page 76
Catchment Office Demand Units 2022 2023 2024 2025 2026 2027 2028 2029 2030 2031 Projected total jobs no. 85,959 87,644 89,362 90,573 91,800 93,044 94,305 95,583 96,684 97,798 Projected office jobs no. 17,026 17,344 17,672 18,010 18,359 18,679 19,007 19,343 19,687 20,041 Projected additional office jobs no. 308 625 953 1,291 1,640 1,960 2,288 2,624 2,969 3,322 Benchmark Office NLA sq.m/ job 15 sq.m per job Demand for additional occupied office floorspace sq.m 4,618 9,382 14,298 19,371 24,605 29,403 34,321 39,363 44,533 49,836 Assumed vacancy rate % 10% 10% 10% 10% 10% 10% 10% 10% 10% 10% Demand for additional office floorspace (sq.m) sq.m 5,131 10,424 15,887 21,523 27,339 32,670 38,134 43,737 49,481 55,373 Office Potential Units 2022 2023 2024 2025 2026 2027 2028 2029 2030 2031 Cumulative firm proposed office space sq.m 1,163 4,436 4,779 10,581 10,581 18,426 18,933 18,933 18,933 18,933 Cumulative Withdrawals sq.m 30 100 100 100 100 100 100 100 100 100 Excess (+) / Deficit (-) of office floorspace sq.m -3,937 -5,888 -11,007 -10,841 -16,658 -14,144 -19,101 -24,704 -30,449 -36,340 Subject Site Market Share % 5% 5% 5% 5% 5% 5% 5% 5% 5% 5% Supportable additional office space at the subject site sq.m 197 294 550 542 833 707 955 1,235 1,522 1,817 Levels @ 1,225 sq.m per level 1,225 0 0 0 0 1 1 1 1 1 1
Source: TfNSW; Cordell; Urbis
ALTERNATIVE CONSIDERATIONS
Education and Training
One of the major commercial uses in the Merrylands Area is Education and Training. Most of the available space in Merrylands is of low quality with a potential for tenants to upgrade to higher quality stock.
The location in proximity to the train station could be attractive to private training organisations looking for a central location in Sydney that is easily accessible by train. This is combined with rents that will be more affordable than the Parramatta CBD.
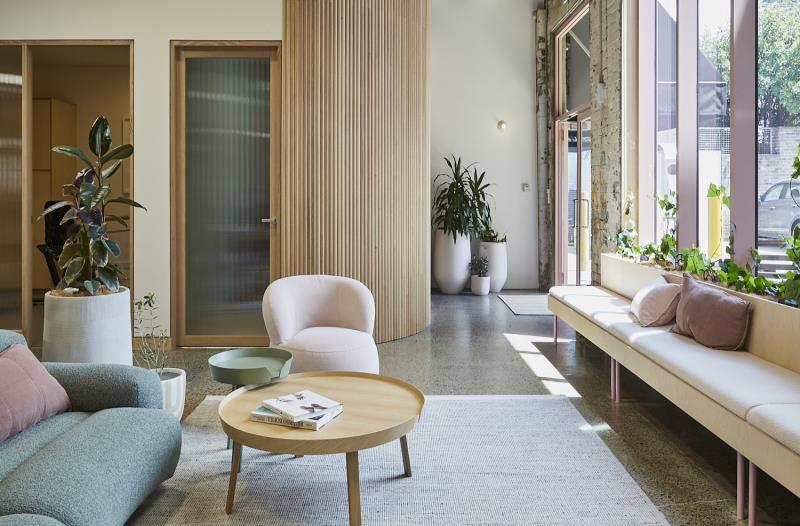
There are currently no language schools in Merrylands, with the closest being at Parramatta. The area could benefit from having a language school tenant, due to demand from
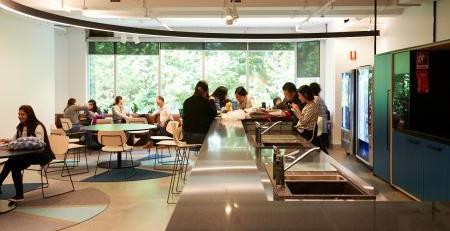
Medical Centre
While there are a number of medical facilities (particularly general practitioner medical centres) within Merrylands, the quality of the existing buildings in which many of these facilities are located is secondary grade. This lower quality of surrounding stock may indicate there is an opportunity at the Subject Site to provide a higher quality offering for local doctors and medical practitioners servicing Merrylands. With the completion of new developments within the area bringing with it additional population growth, there is also likely to be extra demand for medical services than is currently available within the area.
overseas residents. According to the 2016 Census, only 30% of Merrylands residents only spoke English at home. Other languages spoken at home included Arabic 22.5%, Mandarin 5.2%, Dari 3.3%, Cantonese 2.7% and Turkish 2.7%. Within Merrylands Town Centre there are two migration lawyers. This indicates a demand for services from people migrating to Australia and therefore a potential need for English language classes. The multi-cultural nature of the local community may also drive a demand for local residents and workers to also learn a second or third language.
There were a high proportion of people within key childbearing age groups with 35% of the population within the 20-39 year age bracket. There was also a high percentage of children 04 years old (8.3%), which indicates a demand for medical services focused on children and families.
23/02/2022 Merrylands Market Assessment Page 77
Navitas English Language School Hyde Park Sydney
There is potential to deliver quality medical space at the Subject Site.
RECOMMENDATIONS
Recommendation
Co-working Spaces
The subject site is not well suited for traditional officebased businesses such as professional services and financial services. These larger businesses are more likely to locate within CBD locations, with considerable office space available in the nearby Parramatta CBD. Commercial office space of around 750 - 1,000 sq.m is recommended for the site. The 1,225 sq.m that is currently proposed for Building A of Site C is supported though may take longer to be absorbed.
The inclusion of up to 2,000 sq.m of ground floor retail space within Site A&B could also impact the viability of the office space such as attracting potential tenants such as real estate agents and medical professionals.
Across Terminal Place at 244-252 Pitt Street, leases in the existing buildings are being expired to make way for a new mixed-use building. There are several commercial tenants within these buildings that have benefited from the Pitt Street location and may be options to be attracted to the Subject Site. The Subject Site (Site C) should be completed before the redevelopment of 244-252 Pitt Street, which should provide a first move advantage in attracting these displaced tenants.
23/02/2022 Merrylands Market Assessment Page 78