THE RIGHT START INVESTING IN EARLY YEARS OF EDUCATION


Save the Children works in 120 countries globally and across 18 states in India for children's rights –To inspire breakthroughs in the way the world treats children, and to achieve immediate and lasting change in their lives. It is determined to build a world in which every child attains the right to survival, protection, development and participation. We deliver immediate and lasting improvements to children's lives worldwide. Save the Children works for:
A world which respects and values each child. A world which listens to children and learns. A world where all children have hope and opportunity.
Plot no 91, Sector 44, Gurgaon – 122003, Haryana, India. Telephone: +91 124 4752000
Website: www.savethechildren.in
Facebook: http://www.facebook.com/india.savethechildren
Twitter: https://twitter.com/stc_india
The Centre for Budget and Policy Studies (CBPS) has supported Save the Children to conduct this study; and prepare the report.
This publication is protected by copyright. It may be reproduced by any method without fee or prior permission for teaching purposes, but not for resale. For use in any other circumstances, prior written permission must be obtained from the publisher.
We would like to thank all the institutions who have participated in the study and also put forth many ideas regarding the issues discussed with them. Our sincerest gratitude to all the organizational representatives who gave us their precious time and were involved in the study.
This report was guided at every stage by the vision, continuous support and over all leadership of Bidisha Pillai, CEO, Save the Children and Kamal Gaur, Technical Director – Education, Save the Children.
This study was a collaboration between the Centre for Budget and Policy Studies (CBPS) and Save the Children, with CBPS leading the study and Save the Children providing technical support for the same. The research team of CBPS was led by Dr. Jyotsna Jha and we would like to thank her and the research team of CBPS for taking up such a challenging and first of its kind study.

The study has benefited immensely from the participation of several experts from academia and civil society organizations who attended the national workshop on ‘ECCE Programmes in India: Identifying Innovative Models, Pedagogies and Approaches’ and provided their invaluable inputs. We are also extremely grateful to advisory committee members for the study – Prof. Venita Kaul, Prof. Emeritus, Ambedkar University, Delhi; Prof. Zubair Meenai, Director, Centre for Early Childhood Education and Development, Jamia Millia Islamia; Mridula Bajaj, formerly Executive Director, Mobile Creches; Basant Kumar Nayak, Centre for Youth and Development (CYSD), Odisha; Dr. Snigdha Misra, Deputy Director, State Council of Educational Research and Training (SCERT), Odisha and Dr. S. Suresh Babu, Professor, SCERT, Telangana for their guidance and support.
We are grateful for the support for all the field support and inputs received from several resource persons from all the three states -- which included members from Save the Children as well as other organizations who extended their support during the study as well as during the field visits to the three states of Delhi, Odisha and Telangana. We would also like to acknowledge the support from government officials from Department of Women and Child Development, Integrated Child Development Services (ICDS) SCERT and the Municipal Corporation of Delhi. We also extend our gratitude to the Supervisors and Anganwadi Workers of Ibrahimpet block (Hyderabad), Mohana block (Odisha), and Tekhanda village (New Delhi) who supported and facilitated the field visits.
Sincere thanks are due to the state teams of Save the Children in the study locations for their support in the data collection process.
All four research studies have been carried out by Centre for Budget and Policy Studies (CBPS) (www.cbps.in).
Authors: Dr. Jyotsna Jha, Dr. Maithreyi R., Mr. Sharad Pandey, Ms. Ketaki Prabha, and Mr. Madhubhushan B. V. Rao from CBPS, Bangalore.
Suggested Citation: Jha J., Maithreyi R. Ketaki P., S. Pandey and Madhusudan BVR (2018), The Right Start – Investing in the Early Years of Education, CBPS, Save the children, New Delhi
Invaluable support was provided by representatives of different organizations during the study. We appreciate them taking their valuable time out for the study. The contributors for the study on different aspects were : Sudhir Digal, PREM; Sadashiv Swain, CCWD; R.P. Dwivedi, Ruchika; Meenakshi Dogra, CECED; Seema Naz, CECDR; Sonia Sharma, Mobile Creches;Nirmal, Mobile Creches; Geeta Verma, CARE India; Amita Govinda, The World Bank; Sangeeta Day, The World Bank; Md. Saleem, CONARE; Manish Kumar, SEED; KVP Satish, SEED; V. Vijaylaxmi, College of Home Science; Kamala, Andhra Mahila Sabha; Viziendira Boyi, Director, DWCD, Telangana; Jagadishwar, Secretary, DWCD, Telangana; Shilpa Shilde, Director, DWCD, Delhi; B. Seshu Kumari, Director, SCERT, Telangana; Ramadevi, CDPO, DWCD, Telangana; Shanti Sri, CDPO, DWCD, Telangana; Swati Sharma, Municipal Corporation of Delhi; Nakul Nagaraj, CBPS; Mrinalika Pandit, CBPS; Usha P V, CBPS; Vanaja S, CBPS; Ramesh K A, CBPS.
From Save the Children, India we acknowledge the support of the following colleagues: Aparajita Bhargarh Chaudhary, Shivani Parashar, Avijeet Bhadra, Siddhartha Pande, Sree Nagesh Malladi; Sanju, Stephanie Samuel, Alka Singh, Aparajita Sharma, Yogesh Jadav, Vinay Kaushik, Madhurima Malik, Namrata Jaitli and Sandeep Sharma.
Save the Children celebrates its centenary globally in 2019. It gives us immense pleasure to release this research study, The Right Start-Investing in Early Years of Education, which focuses on one our three key centenary commitments – Early Childhood Care and Education (ECCE). Globally, the first six years of a child’s life are recognized as the most critical years for life-long and holistic development of the child. Save the Children is working towards provisioning of ECCE as one of the key strategies that will prepare children in the age group of three to six years with school readiness skills and improve their quality of learning.
Evidence indicates that a high number of children in India will complete elementary education without the required competencies, largely because they enter school with little or no quality preschool education. This inability to thrive in school has a profound impact – children drop-out of school.
Most ECCE programmes in the private sector emphasize on the 3R’s (reading, writing and arithmetic) rather than focusing on the developmental needs of the children below the age of six. The National ECCE policy, 2013 seeks to position the Anganwadis as vibrant “ECCE” centres. To support this vision there is a need to make investments and run social mobilization campaigns to sensitize parents, communities and local administrators on the role of Anganwadi Centres in pre-school education.
Save the Children focuses on four dimensions of school readiness – getting the children ready, making the family ready, making the school ready and ensuring that the system is ready. To bring about a change at scale, collaborations are essential – collaborations between different ministries, government departments, civil society organizations, ICDS functionaries and so on.
For providing quality early childhood education for children living in urban slums, evidence generation is critical to understanding the opportunities and constraints. In this context, Save the Children partnered with the Centre for Budget and Policy Studies (CBPS) to undertake research studies on ECCE to examine the status of implementation of ECCE in India and its gaps, as well as to undertake an analysis of costs of alternative models. The study focuses on the status of ECCE and its implementation, generates evidence from three states (Telangana, Odisha and Delhi) and budget analysis of ICDS and non-ICDS models. This study validates Save the Children’s approach - by investing early, when it matters most, we want all the boys and girls to have access to quality preschool education and to be school-ready when they enter Class 1.
We hope this report which captures different aspects of ECCE in India, goes on to form the basis of further evidence generation, informed advocacy and policy-making to make a lasting change in the lives of all young children in India and beyond.
Bidisha Pillai CEO, Save the ChildrenReport I: Status Report on Implementation and Gaps of ECCE in India (with special focus on Delhi, Odisha and Telangana) 9-56
Report II: Integrated Child Development Scheme (ICDS): An analysis of the national budgets with special reference to three states (Delhi, Odisha and Telangana)
Report III: Selected non-ICDS ECCE models: An analysis of features, costs and revenue
Report IV: Recommendations and Policy directions for ECCE in ndia

85-196
197-212
STATUS REPORT ON IMPLEMENTATION AND GAPS OF ECCE IN INDIA (with special focus on Delhi, Odisha and Telangana)
This section provides a context for the entire set of Research Studies on ECCE. It presents a review of existing national and international literature on the significance of ECCE, the research evidence supporting its impacts, and various types of ECCE models and programmes from across the globe. Research in the field of Neuroscience, Developmental Psychology and Economics have shown the benefits of holistic care for children in their crucial and sensitive early years for cumulative life-long development. In response to such evidence, several countries have begun to adopt varied models of ECCE programmes, many deriving from dominant Eurocentric approaches towards child development, a few also incorporating locally relevant and contextualised practices of child-rearing.
Research in the field of Neuroscience, Developmental Psychology and Economics have shown the benefits of holistic care for children in their crucial and sensitive early years for cumulative life-long development.
India has notably implemented one of the world’s largest comprehensive ECCE programmes fairly early on, in the 1970s - the Integrated Child Development Scheme (ICDS). However, health, nutrition and education- related indicators of child development for 0-6 year olds, though having improved over the years, remain far from satisfactory. Despite the centrally sponsored ICDS scheme having been universalised, around half of India’s undersix population does not participate in any form of pre-primary education. The lack of a regulatory framework for the rapidly expanding private sector, the second largest provider of ECCE, raises matters of concern around quality and equity. There have been several government policies and frameworks reaffirming commitment to developmentally appropriate ECCE services. However, issues of financing, implementation, quality, accessibility and equity remain to be adequately addressed, with there being no legislation for mandatory ECCE provisioning for under-six year olds.
It is against this context that the status report also presents an account of the current status of under-six year olds in India, specifically in the three states of Delhi, Odisha and Telangana, identifying existing provisions as well as gaps and challenges with respect to ECCE. A comparison of the three states shows that trends of health and nutrition indicators and pre-school participation vary widely across states and also when compared to all-India level statistics.
The desk review and secondary data analysis comprised of research papers, reports, evaluations, policy documents, surveys, and other sources of government data. In addition, data was also sourced from various individuals, organisations and institutions engaged in the field of ECCE.
Child development refers to the ordered emergence of interdependent skills of sensory-motor, cognitivelanguage skills and social-emotional functioning (Engle et al, 2007). Research in Neuroscience offers compelling evidence of the significance of the early years of a child’s development, especially from the pre-natal stage to around two years of age, during which the human brain grows most rapidly. Within the first six months, the brain reaches 50 percent of its mature weight, and 90 percent by the age of eight (Woodhead, 2007). The first 1000 days also witness the most rapid period of synapse formation, or growth in the density of the network of neurons in the brain, a process that reduces gradually from two to 16 years of age (Woodhead, 2007). Research has shown that the window of opportunity for addressing a child’s nutritional needs, not only for short-term growth, but also for the generation of healthy and productive adults in the long term, lies between conception to the age of two (Ruel and Hoddinott, 2008).
Dimensions of under-nutrition and its cumulative impact are reflected in stunting (low height for age), wasting (low weight for height), undernourishment and micronutrient deficiencies of iron, Vitamin A, zinc and iodine, which adversely affect growth, cognitive development, increase chances of diseases and infections, and in the worst cases, even lead to death. Moreover, since each sensitive period is associated with specific areas of neurological circuitry, and each stage builds on the previous development in a sequential manner, the consequences of undernutrition have a long-lasting, often irreversible, impact on all domains of future development (UNICEF, 2008).
Several such critical and sensitive periods for cognitive, physical, emotional and psychosocial development are located up to the ages of six to eight and not receiving adequate stimuli during this period reduces the chances of the brain reaching its full potential, often irreversibly (Kaul and Sankar, 2009). Aside from the genetics of an individual child which determine the neural circuitry of the brain, these processes are also highly influenced by one’s experiences. Mutual responsiveness or ‘serve and return’ interaction with adults during childhood play a role in this process (UNESCO, 2015).
A safe, secure and caring environment thus also contributes to positive development outcomes. Several decades of research on psychosocial risks of children growing up in poverty, without adequate parental care or brought up in disadvantaged institutional settings also provide evidence of developmental delays and emotional disturbance (Woodhead, 2007). The educational component of early childhood care, on the other hand, aims to tap into the early crucial formative years of a child’s learning capacity for psychosocial development and school-readiness (UNICEF website, n.d).
Child development refers to the ordered emergence of interdependent skills of sensorymotor, cognitivelanguage skills and social-emotional functioning.
The brain, moreover, is a highly integrated organ with multiple functions, so cognitive, emotional and social competencies are all interdependent and together form the foundation for life-long development (Shonkoff and Phillips, 2002 cited in UNESCO, 2015). These processes emerge in a sequential and hierarchical manner, with increasingly complex neural circuits being formed over simpler ones, and allowing for more complex skills to be inherited over time. Compromising on the simpler circuits during sensitive periods of brain development makes adaptability at higher levels more difficult by reducing its capability for re-organisation and re-structuring, thus affecting a person’s skill acquisition and behavioural adaptation throughout their lives (Heckman et al, 2006 as cited in UNESCO, 2015).
Additionally, aside from the direct benefits of Early Childhood Care and Development (ECD), investments in ECD have also been viewed from the point of view of economic well-being, as a long-term investment in human capital with future returns. There is sufficient evidence from several countries to show that intervention at an early stage is more cost-effective in ensuring future success, rather than spending on mitigating the effects of developmental deficits at a later stage (UNICEF, 2008; as cited in CBPS, 2017). The costs incurred are outweighed by the future benefits for both the participants as well as the general public, in the form of increased employment and earnings and reduced delinquency and crime. A longitudinal study also estimated that for every dollar spent on ECCE, there is a return of approximately 1290 dollars (Kaul and Sankar, 2009). In fact, the World Bank reports that in the case of disadvantaged children, there is no equity-efficiency trade off, because it raises the productivity of the workforce and society at large (cited in Kaul and Sankar, 2009).
Such evidence arising from research in Economics, Neuroscience and Developmental Psychology point at the need to go beyond addressing particular components of development and focus on the child’s overall environment, nutrition, education and interaction with parents, families and caregivers. Such a conception of ECCE has also over time generated the idea of early intervention through institutional or centre-based care, as opposed to parental or family-based care, and pushed towards the emergence of the state as a stakeholder with the moral responsibility of provisioning for ECCE (CBPS, 2017). Further incentives to invest in ECCE have been articulated through arguments that providing ECCE can offset the effects of poverty on children and contribute to breaking the inter generational cycle of disadvantage and foster gender equality by allowing women opportunities to participate in the labour force by reducing the burden of care work (OECD, 2001). Partnering with families and communities in policy-making and provisioning may also contribute to communitybuilding (OECD, 2001).
Based on such evidence-based generation of principles of child development, three key points in planning ECCE programmes have been identified by Kaul and Sankar (2009): child development is continuous and cumulative; all domains of development such as health, nutrition and education are synergistically linked; and that a child is affected by socio-economic status and home environment making it more sustainable and optimal to target the family and community of the child as well. This has implied that child development professionals and research have moved away from narrow definitions of pre-school education or nutritional supplementation to more holistic and integrated approaches under ECD and ECCE, which combine the range of development needs of a child. Further, while ECE focuses only on pre-school education provided through nurseries, pre-primary schools, kindergartens preparatory schools etc, ECCE recognises that childhood itself has sub-categories which have different development priorities.
Table 1: Developmental needs from birth to eight years
1. Pre-natal to birth
Maternal health and nutrition Parental and family education Safe motherhood Maternal support services
Maternal health- postpartum care Exclusive breastfeeding Infant health
2. Birth to six months
Nutritional security Responsive care Early stimulation/play Safety and security Support services
Infant health
3. Six months to three years
Nutritional security, responsive care Early stimulation/Play and learning Opportunities Safety and security
4. Three to six years
Child Health and nutrition Adequate nutrition Day care Play-based preschool education Responsive care Safety and security
5. Six to eight years
Child Health and nutrition Family care Safety and security Primary education
Source: World Bank, 2004. Retrieved from http://earlychildhoodmagazine.org/defining-a-right-to-integrated-early-child hood-development-in-india/ on 23.9.17
Different types of intervention seem to have impacts on different aspects of the child. For example, home visits aid in improving maternal and child health and preventing child neglect and abuse while having relatively lesser effect on cognitive development (Barnett, 1995). Interventions designed specifically for the educational component show gains in cognitive and language development. It has been observed through efficacy trials that improved diets for pregnant women, infants and toddlers, along with food supplementation during the first two-three years of a child’s life can prevent stunting and lead to better motor and mental development (Engle et al, 2007). Iodine supplementation shows effects on cognitive and behavioural development, while prevention of iron deficiencies through supplementation have effects on motor, language and socio-emotional development (Engle et al, 2007).
Research, however, points out a crucial aspect of ECCE, demonstrating that child development outcomes are greater through combined interventions in all aspects of development (UNESCO, 2015). Poor care, health and nutrition impact educational outcomes through impaired cognitive and behavioural capacities, depression, mental retardation and poor concentration, while early health and nutritional interventions have also been shown to directly contribute to improved school attendance and achievements (UNESCO, 2015). Quality ECCE is one that integrates education, health and nutrition. Yoshikawa et al (2013) through a meta-analysis of research evidence on ECCE identify certain crucial components of ECCE. In terms of practices within ECCE, stimulating and supporting interactions between the teachers and children along with an effective use of curricula are critical for quality education and this is further impacted by a careful mentoring and training frameworks for teachers and caregivers.
School readiness, one of the objectives of ECCE, is thought to have three major componentspreparing children or ‘ready children’; preparing families or ‘ready families’; and preparing schools themselves, or ‘ready schools’ (UNESCO, 2016). These three dimensions interact to produce children that are better prepared to enter primary schooling and complete it successfully. UNESCO (2016) mentions the relative number of new students entering primary schools with prior ECCE exposure as an approximate measure of school readiness. Such a figure, however, does not account for the dropout rate at the primary level, which apart from other factors, may be a result of inadequate school preparedness.
School readiness has traditionally been viewed from a maturationist perspective, involving chronological milestones according to a child’s age, which led to the emergence of readiness testing at various stages (Kaul et al, 2017). On the other hand, the empiricist view attempts to determine empirically various sets of skills which are tangible and measurable, and relatively universal (Kaul et al., 2017). The social constructivist and interactionist views further complicate these measures by bringing in the socio-cultural context and the range of factors within the child’s environment respectively, emphasizing the role that these interactions play in the trajectory of the child’s learning. The Education for All Global Monitoring Report (2007) suggests that school readiness should encompass five interrelated domains - the cognitive, physical and motor development, language skills, socio-emotional development and general knowledge (Kaul et al, 2017).
It has been noted that school readiness cannot be measured as a downward extension of primary school curriculum in the form of learning the alphabet and numbers but through supporting a child’s learning through play-based activities which create a conceptual foundation for later learning. Such activities include classification, sequential thinking, pattern-making, phonemic awareness and pre-number concepts for building cognitive skills. Other areas focus on vocabulary development, verbal expression, communication, socialization, self-help and self-regulation skills (Kaul et al., 2017). Further, school readiness needs to be directed by a child’s development priorities, interests
and relevance to their social context and family life (Kaul et al., 2012). There has been evidence to show the harmful impact of age-inappropriate curricula, and practices such as rote memorisation or formal academics, on young children. These weaken the foundation for conceptual learning abilities and may, in the long run, be counterproductive to the objectives of ECCE (Kaul et al, 2012). Since research also shows that school readiness is impacted by disparity in household incomes, this further suggests that the provision of ECCE to disadvantaged children can help address this gap, by equipping them to be better prepared for primary schooling and reducing the chances of dropping out.
It has been observed through research that cognitive achievements are often only moderately stable and tend to taper off in effectiveness over time. This may be due to an excessive focus on academic skills in ECE, without adequately addressing the socio-emotional aspects of school readiness, because of which a child is unable to adapt to new environments (Gill, Winters and Friedman, 2006). Gill et al (2006) point out that this is in part a result of parental expectations from schooling, which demand more tangible forms of learning such as reading and writing abilities, even though they may not be appropriate for the child. The role of communication between parents and the school thus becomes a crucial transition strategy, with parents requiring an awareness of developmentally appropriate activities, a positive attitude towards the child’s learning in school and also actively engaging with their progress to create a healthy learning environment at home. However, the details of such strategies, such as how a parent’s perspective should be incorporated, how often and in what manner communication should take place and how their concerns may be addressed, remain challenges that require further attention. Moreover, another important concern raised is socio-cultural differences among families that not only complicate this form of communication but also imply that not all individual children will arrive at a stage of school readiness at the same age - dimensions of capacity, opportunities, social context and background will all have an impact on their learning environment and in turn on their development progress.

While there seems to be agreement around the importance of ECCE through a recognition of how crucial the early years of a child are for continuous and cumulative life-long learning and development, along with the synergistic interrelation between various domains of development such as physical, cognitive, psychosocial and emotional, there are contestations around what methods are best suited for achieving these objectives. Debates around how best to meet the objectives of ECCE have been shaped by various perspectives and schools of thought. Myers (2007) notes that modern and postmodern thought have greatly influenced this debate. The modern view on education sees practices as objective, absolute and inherent and hence derivable through the application of logical research. The post-modern, on the other hand, emphasizes subjectivity and the diversity of experience and calls for a process of contextualized “meaning-making” with all stakeholders before arriving at needs, definitions or standards of educational processes. The attempts at standardisation of ECCE practices through positivist approaches within psychology have been countered by other movements as well, looking to incorporate diversity, context, equity and relevance. They have been criticised through feminist, post structuralist, postcolonial and postmodern perspectives for their limiting approaches which cannot be universally applicable across cultures and attempts have been
made to reconceptualise early childhood development as sensitive to diversity through inclusive, indigenous practices (Pence & Hix-Small, 2007). There has been an increasing recognition in international and national policy in recent times of the need to balance western principles of child development psychology with indigenous, culturally contextualised practices. However, planning continues to be dominated by the modern perspective on education and development (Myers, 2007).
Melhuish and Petrogiannis (2006) argue that the development of ECCE programmes in various contexts is closely linked to the role of women and maternal employment, among other factors. However, each country’s economic status, social structures and cultural beliefs are to a large extent reflected in the kinds of policies and provisions made for young children, in turn impacting children’s development through varying degrees of quality and experiences. This section examines some of the models that have been implemented in different countries in response to the needs of children within varying contexts. It aims to provide an insight into potential practices that might be explored in countries with similar characteristics.
Some of the earliest and most widely reported models of provisioning have been the Perry Preschool Project and the Carolina Abecedarian Programme in the United States. The High Scope of Perry Preschool Project was carried out between 1962 and 1967 for low-income, African-American children aged three and four, providing them with half a day of quality education and home visits revolving around principles of creating a free learning environment for children while scaffolding their learning process through trained adult supervision. A study following the life-long development of 123 of these children (with randomised control and treatment groups) found better classroom and personal behaviour, lesser youth misconduct and crime, lesser special education requirements and higher on-time graduation. Benefits accumulated up till the age of 40 in the form of increased earnings, reduced arrests and decrease in risky behaviour that may lead to adverse health outcomes (Schweinhart et al, 2005 as cited in UNESCO, 2015). The Abecedarian Programme similarly was carried out on mostly disadvantaged African-American children, but from infancy to the age of five, providing holistic, full-day, centre-based child care, including nutrition, healthcare and play-based activities aimed at school readiness. Positive impacts were found with mothers of children having higher income, increase in IQ levels and achievements in reading and math. IQ levels were, however, found to decline over time. (Campbell et al, 2012; as cited in UNESCO, 2015).
Engle et al (2007) reviewed 20 ECCE programmes from developing countries to study their effects on child development. The centre-based programmes were found to improve non-cognitive skills such as sociability, self-confidence and motivation, while longitudinal studies from Nepal, Argentina, Burma and Colombia also recorded an increase in the number of children entering school, school retention, and impacted age of entry and performance. An evaluation of a community feeding and pre-school programme for disadvantaged children initiated in Peru in the 1980s showed that children who had attended the programme performed better in first grade as opposed to those who did not but did not differ from those in formal pre-schools. Of three World Bank-assisted projects, the two communitybased programmes in Bolivia and the Philippines, one training low-income, urban women to run child care centres and the other training community development workers respectively, with both receiving financial support towards holistic and integrated child development activities, showed benefits in the child’s growth and cognitive development after 6-18 months of exposure to the programme. A third project in Uganda, restricted to information dissemination, conducting Child Health Days every six months for healthcare and immunisation, and providing community grants, while displaying an improvement in childcare practices and behaviour, did not impact cognitive development. This was attributed to the low intensity of the programme.
Rao and Sun (in UNESCO, 2015) note that in low-income and developing countries with resource constraints, quality ECCE also serves as a mechanism to promote equity. Their study on ECCE in Cambodia assessed the three major models of pre-school programmes. State-run pre-primary schools involve the highest cost, have the most highly trained teachers receiving a government salary and offer proper infrastructure and learning material for children, for three-hour sessions daily. Community-based programmes for three to five year olds are provided by a member of the village who receives 10 days of training followed by annual refresher trainings for three to six days. The stipend for the worker is managed by the village itself but there are issues in terms of space available and attendance by younger children. The home-based programme is run by mothers’ groups in villages, and facilitated by a ‘core’ mother who receives two days of training. The costs are again borne by the village itself and mothers meet before heading out to the fields to work every day to discuss issues of nutrition, developmental stages of children and general well-being. All children attending some ECCE programme performed better than those not attending any at all. Perhaps one way forward would be to improve the quality of community and home-based programmes by providing adequate funding and capacity-building activities or to invest further in state-run pre-schools to expand their accessibility.
Parental education and support programmes are one component of ECCE that serve as a medium to create a healthy and nurturing learning environment for the child. Aside from its normative benefits, positive parenting is also known to mitigate the effects of poverty, violence and disease. Stimulating parenting in low income families can counteract the associated risks to create outcomes for children equivalent to economically advantaged families (Britto and Engle, in UNESCO 2015). A review of parent-centred educational programmes by Engle et al. (2007) found them to positively impact child development. However, these benefits were lower when the programmes were limited to information-sharing as opposed to skill-building. In Bolivia, for example, a parent education programme involving information-sharing and skill-building around health, hygiene, nutrition and development, along with a literacy programme for indigenous women and home visits resulted in better cognitive development for children aged around two. Turkey and Bangladesh had programmes involving group sessions with mothers, the former including hands-on skill-building for playing with children and the latter limited to information-sharing. While in the case of Bangladesh, mothers’ knowledge of childrearing was seen to improve, Turkey witnessed improvements in short- and medium-term child development of three to five year-olds in terms of language skills, school achievement and school retention.
The significant role of parenting is stressed on further by Legrand et al (2015) in noting the adverse effects of an over representation of vulnerable children under three in residential institutional care in Central and Eastern European countries/Commonwealth of Independent States (CEECIS). These are often children with disabilities, from Roma/young/single/using drugs or alcohol/HIV positive/ disabled parents. Testimonies from individuals who have grown up in institutional care demonstrate that family or family-like settings are more helpful for integration in society and this is backed up by Neuroscience which stresses on the importance of mutual interactions between children and caregivers and the role of parents in providing care. Countries such as Croatia, Romania, Serbia and Bulgaria have adopted laws and strategies to ban the institutionalisation of young children and focus instead on community-based child and family services. One such measure for eliminating the institutionalisation of young children involves social protection through support services or cash transfers to the most vulnerable families in order to enable them to raise their own children, especially children with disabilities.
Parenting targeted indirectly through poverty alleviation has also served as an intervention to improve parenting practices indirectly, predominantly in Latin America (Britto and Engle, in UNESCO 2015).
Parental education and support programmes are one component of ECCE that serve as a medium to create a healthy and nurturing learning environment for the child.

Several governments in South and Latin America such as Mexico, Brazil and Chile, have implemented cash transfer programmes which aim at poverty alleviation through targeting families below a certain income bracket. These programmes provide cash to families and function on the assumption that those living in poverty are unable to invest enough in human capital despite being aware of its benefits and would be able to do so with monetary assistance and break the intergenerational cycle of poverty in the long term. At times, this cash transfer is conditional on complying with certain requirements, such as participating in health care, nutritional or education programmes, especially for children. Fernald, Gertler and Neufeld (2008) analysed the role of one such conditional cash transfer programme, Oportunidades, in Mexico, in particular, to explore the relation between cumulative cash transfers and effects on child growth health and development outcomes.
Oportunidades provides cash transfers to participating households in two forms. The first is a monthly stipend conditional on preventive health check-ups, with the intention that the money is spent on nutritional needs of the family, and the second is in the form of a scholarship to children attending school regularly from the third grade onwards. The study found that increased cumulative cash transfers resulted in better outcomes in all the domains of development analysed for children between the age of 24 and 68 months who had been exposed to the programme their entire lives.
Doubling of cash transfers were found to be associated with increase in height, lower prevalence of stunting, improvement in endurance, long-term memory, short-term memory and language development. These improvements in physical, cognitive and language development may have been produced via two potential pathways: first, an increased purchasing power which could be spent on food items, household items and material such as books or toys for the child’s cognitive stimulation and second, an overall improvement in the psychological well-being of the family, resulting in a more caring and nurturing home environment for the child.
Several Asian countries such as Mongolia, Bangladesh, the Philippines and Malaysia also experimented with income support for parents through conditional cash transfer programmes. In Bangladesh, the cash transfer was conditional on regular growth monitoring for the child and non-mandatory information- dissemination sessions with mothers on nutrition and health. In a pilot, significant impacts were found in terms of reduced stunting of children and increased awareness on the importance of exclusive breastfeeding of infants (UNESCO, 2016). China introduced a voucher and conditional cash transfer scheme for children from poor households. However, despite an increase in pre-school participation, this did not lead to better child development outcomes due to the poor quality of schooling (UNESCO, 2016). This alerts one to the need to simultaneously invest in the provisioning of quality ECCE.
Coordination and integration of service provisioning between different government entities has been considered one of the most effective means of providing holistic and quality ECCE for children (Kaga et al. 2010 as cited in UNESCO, 2016). The Philippines, for example, set up a national ECD council in 2009 and used ECCE legislation for the expansion of multisectoral initiatives. Further, decentralisation of ECCE has been explored which requires that programmes be managed locally by community and local governments. In Nepal, there is direct funding by international and national organisations, aid donors and non-government
organisations (NGOs) for communities to develop ECCE programmes for children aged between two and three years. The centres are set up in the community and the caregivers are local women who are trained to provide day care and early stimulation. Technical and financial support is also provided by the government’s Department of Education. While there are issues of quality that remain unaddressed, this community-based care and education for younger children has enabled an increase in access to pre-school through an expansion of enrolment in government-run, schoolbased centres at the age of four and entry into primary school at five (UNESCO, 2016).
Soudee (2009) explored the inclusion of culturally relevant indigenous practices in ECCE programmes which were in some cases implemented jointly by international institutions in three West African countries - The Gambia, Mali and Senegal. In The Gambia, the social and emotional well-being of children were seen to be maintained through frequent play, locally produced toys and regular interaction with adult members through storytelling, songs and play, imparting traditional knowledge. While these have not yet been included in any formal ECCE programmes, they have been studied to show benefits in children’s social interactions and emotional health and should be incorporated into formal programmes (Sagnia, 2004 as cited in Soudee, 2009). In Mali, the Clos d’enfants programme implemented in partnership with UNESCO, and Save the Children’s Strong Beginnings are both examples of models which combine local knowledge and resources with Western modes of pedagogy. The communities are involved in deciding whether or not to adopt the model, teachers are hired locally from the community and indigenous languages, beliefs and child-rearing practices are utilised.
As Serpell and Nsamenang (in UNESCO 2015) note, in Africa, various indigenous concepts of human development and socialisation existing along with formal educational models of cognitive growth create tensions and challenges in planning for ECCE programmes. Western tools and indicators to assess children tend to underestimate their progress since they do not adequately adapt to a child’s context. For example, the practice of care-giving by pre-adolescents, contrary to being exploitative, is seen as a participatory component of social integration and staying grounded in the realities of daily life. It was actually successfully incorporated into a primary school curriculum for promoting social responsibility among both boys and girls in Zambia, leading to better academic outcomes as well. Indigenous play, music and dance, given attention only for its cognitive or physical benefits in western ECCE, also serves as a mode of “interactive social enculturation and structuring opportunities for the rehearsal, critique and appropriation of cultural practices” (Fortes, 1970; Schwartzman, 1978; Lancy, 1996 as cited in Serpell and Nsamenang, 2015). Including cultural relevance as criteria for the approval of ECCE services, institutions and training will be a major step towards the incorporation of traditional knowledge, resources and practices for a more inclusive form of child care and education.
Having reviewed international and national literature, describing various practices and models that have beneficial impacts on early childhood, this chapter examines the status of ECCE provisions and children between 0-6 years in India. According to the Handbook of Children’s Statistics, 2014 compiled by the National Institute for Public Cooperation and Child Development (NIPCCD), the total population of 0-6 year olds in India is 165.4 million (16.54 crores), constituting 13.59% of India’s total population. The rural component accounts for over 121 million of children in this age group (73%) with the urban component at a little over 43 million (26 %), similar to the trends in the total urban-rural population divide. The sex ratio for this age group is at a dismal low of 919 females per 1000 males, down from the 2001 figure of 927. This is in spite of the sex ratio of the total population having increased from 933 to 943 in the same period.1
1Source
No. of children in 0-6 age group 165.4 million
0-6 age group share in India's total population 13.59%
No. of children in 0-6 age group (Rural) 121 million
No. of children in 0-6 age group (Urban) 44 million
Source: Handbook of Children’s Statistics, 2014 compiled by NIPCCD
TABLE 3: Health and nutritional status of 0-6 year olds in India
Status of children Under 6 2005-06 NFHS 3 2015-16 NFHS 4
Infant Mortality Rate (IMR) 57 41
Children under five years who are wasted (i.e. low weight for height) (%) 19.8 21
Children under five years who are underweight (%) 42.5 35.7
% of children 12-23 months fully immunised 43.5 62
Children age 6-35 months who are anaemic 69.4 58.4
Source: NFHS 4 India Factsheet (2015-16)
A perusal of data from the National Family Health Survey (NFHS), conducted periodically by the Ministry of Family Health and Welfare (MFHW), Government of India (GoI), reveals that nutritional and health indicators of children below five years has largely improved. However, much is still to be achieved, with infant mortality rates still standing higher than the global average (of 32 in 2015)2 ,and over ten times higher than the average for Organisation of Cooperation and Economic Development (OECD) countries in 2013 (OECD Health Statistics, 2015).
The Neonatal Mortality Rate (NMR)3 is 28, while the Early NMR4 is 22.5 The Under 5 Mortality Rate (U5MR) is 49, again higher than the global average of 43 (WHO, 2015) and India ranks 48th in a list of countries with the highest U5MRs (The State of the World’s Children, UNICEF, 2016).
Rajan, Gangbar and Gayathri (2014) have also noted that compared to its neighbours - Sri Lanka, Bangladesh and Nepal – India still lags behind with respect to child health and nutrition. Malnutrition has been identified as a key factor affecting mortality rates and India is still seen to have high numbers of moderately or severely malnourished children, with 30 percent of new borns being significantly underweight and 60 percent of Indian women anaemic (Claeson et al., 2000).
2 Global Health Observatory Data, World Health Organisation (WHO, 2017). http://www.who.int/gho/child_ health/mortality/ neonatal_infant_text/en/
3The number of children per 1000 live births who do not survive beyond 28 days after birth
4The number of children per 1000 live births who do not survive beyond 7 days after birth
5Source: Sample Registration System, Statistical Report, 2013, Office of the Registrar General and Census Commissioner of India, Ministry of Home Affairs, Government of India, New Delhi, p.86.
Further, there are wide regional variations in health and nutritional outcomes with the southern states of Andhra Pradesh, Karnataka, Kerala and Tamil Nadu showing much greater improvements than eastern states such as Bihar and Jharkhand (Lokshin et al, 2005). NFHS 4 data also shows that children’s nutritional status was directly related to education and wealth indicators, with more children in the lower levels on wealth and educational indices being stunted or wasted. With respect to social category, Scheduled Tribes (STs), followed by Scheduled Castes (SCs) had a larger proportion of malnourished children (see figure 1).
The poor performance in health and nutrition indicators has been attributed to the lack of policy priority afforded to these areas by the state, with Mundle (2011) arguing that there is a serious deficit with respect to medical facilities and transportation to quickly access medical facilities in the country, severe shortage of human resources and inefficient delivery systems (as cited in Rajan et al, 2014).
Percentage of children under five years.
ICDS Private Not attending PSE Don’t know/Not available Total
Hinduism 40.0 30.6 25.9 3.5 100
Islam 34.4 27.6 34.0 4.0 100 Christianity 35.2 38.5 25.6 0.7 100
Sikhism 21.9 52.8 23.3 1.9 100
Jainism 27.4 58.1 12.4 2.1 100
Buddhism 49.1 31.4 18.2 1.3 100
No Religion 25.5 24.8 46.6 3.2 100
Other 39.3 30.2 26.9 3.7 100 Social group
SC 42.3 24.9 29.4 3.4 100
ST 52.0 17.4 26.9 3.7 100
OBC 35.9 31.9 28.3 4.0 100
Others 34.3 39.3 23.6 2.7 100
No Response 49.3 16.9 31.7 2.0 100
Lowest 51.9 8.6 34.8 4.8 100
Second 49.2 17.2 29.2 4.0 100
Middle 42.8 27.9 25.9 3.4 100
Fourth 30.1 42.6 24.5 2.8 100
Highest 16.0 61.6 20.3 2.2 100 Total 38.7 30.7 27.1 3.5 100
Source: Rapid Survey on Children National Report, Ministry of Women and Child Development and UNICEF, 2013-14
The participation of children in pre-school programmes has also shown an improvement but covers just over half the population in the three to five age group. Data in itself is unreliable, since different sources provide varied estimates for the number of children enrolled in a pre-primary school in the first place. While UNICEF data 6 puts the estimate of three to six year olds enrolled in pre-primary schools at 58%, the Ministry for Women and Child Development (MWCD) data suggests that about 70% are enrolled in some form of private or ICDS programme. This high figure is attributed to the crucial step of universalisation of the ICDS scheme along with the rapid expansion of the private sector, not only in urban, but also rural and tribal areas. A NIPCCD study that sampled 748 ICDS projects across the country, found that on average, 37 children per Anganwadi centre (AWC) were registered for PSE and 75% of those registered were attending the AWC (NIPCCD, 2006). According to the Rapid Survey on Children (RSOC) 2013-14, while at the ages of three and four, around 40 percent were registered, it reduces to about 32 percent by the age of five. The reasons attributed for this is due to the early start of primary school, as was also reported by respondents during our fieldwork (discussed in more detail later).
this
3 Age 4
5
Source: Rapid Survey on Children National Report, Ministry of Women and Child Development and UNICEF, 2013-14
Another study conducted by FSG (2015)7 showed that 79% of children in the age group of two to six years were attending pre-school. Of the 21% not attending any pre-school, three-fourths were in the two to three age group. A longitudinal study conducted by CECED similarly finds that close to two-thirds of all children in the villages sampled across three states were participating in some form of ECCE programme, and each village had at least one AWC, along with private facilities in many.
Based on the numbers reported by the MWCD and UNICEF, India perhaps performs no worse than other countries with respect to pre-school enrolment. In fact, it appears to be ahead of the global average (gross enrolment ratio for pre-primary education stands at 48 percent).8 A UNICEF (2015) report on ‘Early Childhood Development: A Statistical Snapshot’, also reveals that fewer than 50 percent of children between 36-59 months are attending some form of early childhood education, and that children from the lowest quintile are the most disadvantaged in terms of access to preschool education.9 However, according to World Bank data (2017), India’s gross enrolment ratio in pre-primary school stands at 12 percent, which is much lower compared to its neighbours such as Sri Lanka (93 percent), Nepal (85 percent), Pakistan (72 percent) and Bangladesh (31 percent).10
Overall, all data sources suggest a large number of children between three to six years not covered under some form of early childhood education programme, both across the world as well as in India. The RSOC 2013-14 pegs this number at 27 percent of the child population between three to five years. This also suggests the need to review existing provisions and step up efforts to ensure education investments and provisions. In the next section, we examine the available policies, provisions and budgets for early childhood education in India before concluding the chapter with an analysis of existing gaps that need to be immediately addressed in order to ensure equitable outcomes for all children.
74299 listing interviews, 2010 structured interviews and 108 customers through FGDs/in depth interviews across 8 urban cities were conducted
8Note: The global average has been sourced from the World Bank dataset on’ Gross enrolment ratio, pre-primary, both sexes (%)’ (https://data.worldbank.org/indicator/SE.PRE.ENRR?locations=US-IN), which reports a corresponding figure of 12 percent for India.
9Note: These figures are based on survey conducted in the African, Middle Eastern, East Asian, Latin American and Caribbean countries only.
10This may however be inaccurate estimates as an analysis of country-wise estimates do not match other data sources.
There is a slightly higher proportion of boys attending private pre-schools (31.7 percent) compared to girls (29.6 percent), a higher proportion of whom are in the AWCs (40.1 percent compared to 37.5 percent boys). The number of boys and girls out of pre-school are almost similar (refer Table 3).
Over half the children in urban areas are enrolled in private PSE, with only 22 percent in AWCs, while it is the opposite in rural areas, with almost half the children enrolled in AWCs. A slightly higher proportion of rural children (28.3 percent) are out-of-preschool, compared to urban children (24.5 percent).
Urban Rural
Source: Rapid Survey on Children National Report, Ministry of Women and Child Development and UNICEF, 2013-14
Amongst Christians, Sikhs and Jains, there are slightly higher proportions of children attending private ECCE centres (38.5 percent, 52.8 percent and 58.1 percent respectively). One possible reason for this could be that children from these communities attend private institutions that are being run by their own religious groups. These institutions (run by specific religious groups) form a small component of ECCE provisioning but are highly competitive with the private sector (Kaul and Sankar, 2009). An analysis of children out-of-preschool by religious category shows that about 46.6 percent children (on the RSOC 2013-14) have given no religion, while children belonging to the Muslim community form the second largest group of out-of-preschool children (at 34 percent).
A caste-wise analysis shows that majority of SCs and STs attend AWCs and less than one fourth attend private centres. Amongst OBCs, roughly equal proportions attend both AWCs as well as private centres. Among other castes, there are slightly more children (close to 40%) attending private centres other than AWCs. This may point at the fact that despite the mushrooming of private PSE institutions all across rural and urban India, the benefits of such education is still skewed along caste lines. The socially marginalised sections, also often economically disadvantaged, possibly continue to depend on government welfare provisioning. This number, however, could be even higher with almost 50 percent children, whose caste status is undetermined, reporting that they attended AWCs. Close to 30 percent of this group was also not availing any form of PSE, while the second highest
group that reported availing no PSE was SCs (29.4 percent). OBCs follow close behind with 28.3 percent out-of-preschool, followed by STs with 26.9 percent out-of-preschool.
Source: Rapid Survey on Children National Report, Ministry of Women and Child Development and UNICEF, 2013-14
Source: Rapid Survey on Children National Report, Ministry of Women and Child Development and UNICEF, 2013-14
A wealth-wise distribution shows similar trends with regard to children attending government and privately run ECCE centres, or rather, makes the disproportionate distribution of ECCE centres even starker. While the two lower wealth quintiles largely attend the ICDS, there is a rapid decrease in availing ICDS services over the next three quintiles. There is simultaneously a huge increase in children attending private services, with an increase in the wealth index of the family. Moreover, the proportion of children not attending PSE also decreases with an increase in household wealth. The trend of higher household wealth correlating with a higher tendency to attend some form
of PSE has been utilised positively to increase participation in PSE programmes, through various cash transfer programmes in Latin America. In one study, a cumulative increase in cash transfers was found to result in better development outcomes in all domains (Fernald, Gertler and Neufeld, 2008), also suggesting concomitantly that lower household wealth may curtail access to ECCE programmes. This trend translating into higher participation in private ECCE programmes may pose a challenge in light of the lack of quality regulation or a monitoring framework for such centres. It also has implications regarding state social sector funds being invested in the private sector, as several commentators have pointed out that this comes at the cost of lesser funds for strengthening and subsequent neglect of government programmes for which huge investments have already been made in terms of infrastructure, human resources, etc.
A closer look at the profile of children under six years of age, as given in Figure 6, shows that while there are an equal proportion of children within each quintile at the all-India level (approximately 20 percent), these figures look very different for urban and rural areas. While close to 70 percent of all urban children under the age of six fall within the two upper wealth quintiles, over 70 percent of rural children are in the bottom three quintiles.
Figure 6: Location-wise distribution of wealth Indices of children under 6
There have been several policies in India that directly address the needs of the young child, creating an enabling framework for the provision of ECCE services. The National Policy on Education (1986 and 1992) recognized ECCE as a critical input in Human Resource Development and as a support for primary education, strongly advocating for the play way method at this stage as opposed to formal teaching methods such as the 3Rs or reading, writing and arithmetic (Kaul et al, 2012). The National Policy for the Child (1974) articulated governmental commitment to provide for the child in a holistic and integrated manner and the need to build the capacities of caregivers, after which the ICDS was initiated in 1975 on a pilot basis. The National Nutrition Policy (1993) and the National Health Policy (2002) identified 0-6 year olds as a vulnerable group and articulated programmatic interventions and the need for improving indicators. The National Plan of Action (NPA) (1992) laid
down time-bound targets and strategies to achieve the overall survival, growth and development of children (Kaul et al, 2012). India is also a signatory to the Convention on the Rights of the Child (CRC) (1989) and Education for All (EFA) (1990) which positions ECCE as the very first goal to be achieved, with these goals being further reaffirmed in the Dakar Framework for Action (2000) and the Moscow Framework for Action (2010) (MWCD, 2013).
The Constitution of India under the Directive Principles for State Policy in the amended Article 45 states that “The State shall endeavour to provide ECCE for all children until they complete the age of six years”. However, the Right of Children to Free and Compulsory Education (RTE) Act which came into effect in 2010, while making education a fundamental right of children from six to fourteen years of age, left children under the age of six out of its scope. Despite recent commitments from the government towards ECCE in the form of universalisation of the ICDS and the National ECCE Policy (2013), it is yet to be recognised as a fundamental right. A sub-committee was set up by the Central Advisory Board of Education (CABE) on the order of the MHRD to examine the feasibility of the extension of the RTE to pre-primary education, which prepared a drafting framework to define boundaries for pre-school education and identified issues of the entry age of children, teacher capacities and qualifications, focus on child-centred and developmentally appropriate pedagogies and coordination with implementation of ICDS as key points for further discussion (CABE, 2013).
Along with a draft framework for including pre-primary education within the scope of the RTE and defining the norms for pre-school education, it was recommended that wider consultations be held with stakeholders prior to preparing a final framework and extending the RTE to pre-primary education.
The National ECCE Policy (2013) reaffirms the government’s commitment towards a holistic and integrated approach to the provision of childcare in the country, drawing on critical evidence and research in the field around the importance of ECCE and the need for developmentally appropriate practices at each sub-stage of a child’s life, following a lifecycle approach. It also notes the previous lack of quality standards and regulatory mechanisms and aims to bring under its purview all types of ECCE models such as AWCs, balwadis, creches, nurseries, pre-primary schools, kindergartens, play schools, preparatory schools, home based care etc, being provided by public, private and NGO service providers. The objective of the policy is to promote free, universal, equitable, inclusive and contextualised learning.
The context and need for the policy arises out the fundamental changes in the family structure that has taken place over the years, with a breakdown of traditional joint families as well as more women participating in the labour work force, leading to the absence of traditional structures that passed on childcare practices through generations. This has come hand in hand with crucial scientific evidence and an emerging global recognition of the need for quality ECCE, entailing a necessary strengthening of capacities of service providers, parents as well as communities to be able to cope with the development requirements of young children within diverse social contexts.
The policy also refers to the various earlier policies that have articulated the importance of ECCE, the latest among them being the RTE, which states under Section 11 that “with a view to prepare children under the age of three years for elementary education and to provide early childhood care and education to all children till they complete the age of six years, the appropriate government may make necessary arrangements for providing free pre-school education for such children.” This, however, is not mandatory under the RTE.
National ECCE policy is supported by a National ECCE curriculum framework, given in Annexure 1
As per the ECCE policy, the government is to be guided by the objectives of universalising ECCE through the provision of a comprehensive childcare support system, services and facilities and capacity-building of all stakeholders, while ensuring that these function within the prescribed quality standards. It is also to bridge the gap between home-based care, institutional care and the transition to schools, by involving the families and communities of children, raising awareness, developing culturally appropriate practices and adopting decentralised and participative strategies.
The main channel for the provision of universal childcare remains the ICDS, within which the AWC is to be repositioned as a ‘vibrant child-friendly ECD centre’ (MWCD, n.d., p.10) and other government schemes are to be realigned with the above-mentioned objectives through linkages and convergence with other departments and programmes. Alongside, various not-for-profit as well as for-profit NGO and private initiatives which adhere to prescribed quality standards will be experimented with, promoted and supported, wherever feasible. The regulatory framework pertaining to infrastructure, teacher-student interactions, curriculum, pedagogy, health, nutrition, parent and community involvement and teacher professional development is to be implemented by different states in phases - from registration to accreditation to regulation. The apex body for implementation, assessment and evaluation of all ECCE programmes is the National ECCE Council and each state is to setup its own ECCE Council as well. Monitoring and supervision should incorporate the latest technology for the collection and analysis of data and be measured against clearly defined outcome indicators. Research and advocacy in the area of ECCE will also be supported and funded as per the policy, with the aim of reaching out to the most vulnerable populations.
While the policy commits to increase investment in the field of ECCE, increase aggregate expenditure on programmes and services, and develop disaggregated child budgets, it very noticeably does not elaborate on the details of budgeting and financing these services.
India is one of the few countries in the world to have recognised the need for a separate çhild budgeting exercise. The Child Budget refers to the total outlays on child-specific schemes within the national budget, and this is categorised into four main sectors - Child Development, Child Health, Child Education and Child Protection. This has been made part of the Expenditure Budget presented with the Finance Bill every year in the form of Statement 22 - Budget Provisions for Schemes for the Welfare of Children (HAQ, 2016). The share for children in the Union budget in 2016-17 has gone up slightly from 3.26 percent in 2015-16, to 3.32%. This figure, however, is still far lower than the share allocated in 2012-13 (which was 4.76%), since when it has been declining, despite a slight increase this year. Further, this does not even meet the conservative estimates made in the National Plan of
Child-related schemes with increased allocations
Sarva Shiksha Abhiyan (SSA)
Midday Meal Scheme (MDM)
Child Development Services (ICDS)
Action for Children (NPAC, 2016), which demands that at least five percent of the Union Budget be spent on programmes directly related to children (Ganotra, 2017).
Analysing the increase in the current budget, Ganotra (2017) notes that the allocations have mainly increased in four schemes (as shown in Table 4), of which ICDS is the only scheme that directly contributes to children between 0-6 years. However, as commentators note, this increase is not as significant as it seems. First, since the increase of INR 12.45 billion is clearly not enough to universalise the scheme (which currently caters to only about 50 percent of the population) and is definitely not enough to convert the vision of ‘Anganwadi-cum-crèche’ into reality as envisaged under the restructured ICDS scheme. Further INR 5 billion from this fund has been actually allocated for women empowerment schemes (Mahila Shakti Centres) (Ganotra, 2017a;b).
It is important to note that the budget for ICDS, while increasing from the previous year, is still lower than between 2012-2015, when it was actually on the rise. While there is an allocation of INR 140 billion for ICDS, this falls more than halfway short of what is required to implement ICDS in mission mode, estimated at INR 303.25 billion. The Rajiv Gandhi National Crèche Scheme (RGNCS) has also seen a reduction in allocation, from INR 2.05 billion to INR 1.50 billion in 2016-17.
TABLE
Year
Source: Budget for Children 2016-17, HAQ
Further, when one analyses the share of child development schemes (which is the sector that caters to 0-6 years, with schemes such as ICDS and RGNCS allocations), a similar pattern is observable. Though the total share of child development budget at 0.77 percent of the union budget is a 67.7 percent increase from the previous year’s budget, it is much lower than the allocations for child development made between2012 and 2015.
The National ECCE policy of 2013 recommends the setting up of national- and state-level ECCE councils, yet to witness allocation in the child budget, as is the setting up of statutory crèches by the Labour Ministry.
Provisions for ECCE in India can broadly be defined as options available under the government, private and NGO sectors. However, even within these different sectors, there is a wide diversity in the kinds of programmes, size, structure, processes, quality and costs, impacting learning outcome levels of children (CECED, n.d.). There are almost 130 publicly sponsored programmes under various ministries and departments which cater to the needs of children from the prenatal stage to the age of six years, most of them directed at disadvantaged communities (Kaul and Sankar, 2009). What is also important to note is that access to various ECCE provisions is influenced by socio-economic differences (as with school education), with high fee-charging institutions, following Western models/ pedagogies mainly accessed by the upwardly mobile, urban middle class (Kapoor, 2006).
According to Kapoor (2006): “...the Integrated Child Development Service (ICDS) is the world’s largest integrated childhood programme, modelled in part on the US Head Start programme (Bhavnagri, 1995).” ICDS is the flagship programme of the central government which seeks to provide a holistic and integrated package of services related to health, nutrition and pre-primary education, following a life-cycle approach. ICDS targets pregnant women, lactating mothers and children from the prenatal stage to 6 years of age. It provides a package of six services: supplementary nutrition, pre-school nonformal education, nutrition and health education, immunisation, health check-up and referral services.
TABLE 7: Services and beneficiaries of ICDS12
(i) Supplementary nutrition
(ii) Immunisation
(iii) Health check-up
(iv) Referral services
Children below 6 years, Pregnant and lactating mothers
Children below 6 years, Pregnant and lactating Mothers
Children below 6 years, Pregnant and lactating mothers
Children below 6 years, Pregnant and lactating mothers
(v) Pre-School education Children 3-6 years
(vi) Nutrition and health education Women (15-45 years)
Source: MWCD website
AWW and Anganwadi helper [MWCD]
ANM/MO [Health system, MHFW]
ANM/MO/AWW [Health system, MHFW]
AWW/ANM/MO [Health system, MHFW]
AWW [MWCD]
AWW/ANM/MO [Health system, MHFW & MWCD]
The nodal agency responsible for the programme is the MWCD. However, due to its integrated nature, other ministries such as the Ministry for Health and Family Welfare (MHFW), Ministry of Human Resource Development (MHRD) and the Ministry for Social Justice and Empowerment (MSJE), are also involved. The convergence between the various services of the ICDS and the different ministries responsible for it is to be operationalized through the creation of AWCs, where each of these services is provided through the coordination between various sectors, departments and ministries. The number of operational AWCs as of 2015 was 1.35 million, of which only 1.25 million provide preschool education. The number of 0-6 year olds availing benefits of the SNC is 82.8 million, while the figure including pregnant and lactating women is 102.2 million. The coverage of ICDS has increased over the years but between 2013-14 and 2014-15, despite an increase in the target and actual number of ICDS projects and operational AWCs, the number of beneficiaries of the supplementary nutrition programme and pre-school education have decreased, which is a cause of concern (for more details on coverage see Annexure 2).
The decline in the population availing ICDS services, despite increase in budgets and provisions made for universalisation since 2001 (Rajan et al., 2014) is attributable to several factors, ranging from problems with implementation, lack of political will as well as a result of changing aspirations among parents, particularly with respect to preschool education. Rajan et al. (2014) argue that a
12Details regarding each of these services is given in Annexure 2.
critical issue has been the continued efforts to expand an inefficient model with a view to ensuring political returns rather than beneficiary improvements. In this regard, they argue, the programme has remained focused on achieving universal targets with a single-minded focus on providing inputs and monitoring outputs (e.g., number of centres established, staff trained, village nutrition days organised, amount of money spent, etc) rather than focusing on issues of quality.
Free conversation 73.1 72.9 83.3 74.7
Storytelling 90.6 91.2 96.7 91.7
Songs 93.9 97.6 95.8 95.1
Counting 89.5 92.4 96.7 91.3
Drawing/painting/colouring 42.1 47.6 45.8 44.4
Outdoor games 71.6 68.8 67.5 70.3
Threading 15.3 24.1 17.5 17.6
Matching colours 62.4 66.5 68.3 64.3 Indoor games 79.5 72.9 77.5 77.7
Others (Picture books, toys, swings, see-saws, dolls, rings, blocks etc) 17.9 17.1 19.2 17.9
N=748 projects; Source: NIPCCD, 2006
Participation in at the Anganwadi level is marred by perceptions of the AWC as primarily a feeding centre for the poor, with the programme still continuing to be perceived mainly as a nutrition programme. Identifying this as the ‘paediatric orientation’ of the programme, with its greater emphasis on nutrition compared to education, Kapoor (2006) notes that this is due to long history wherein preschool education was considered secondary to health education and nutrition, due to the poor survival rates of children prior to the 1990s.
However, even with improvements in child mortality, there is little evidence of a shift towards attention to pre-school education (Upadhyay et al., 1998; Cleghorn and Prochner, 2003; as cited in Kapoor, 2006). These findings were supported even in a recent study conducted by the Centre for Budget and Policy Studies (CBPS-UNICEF, 2017), reviewing the ICDS and its expenditures in Karnataka. Parent respondents across 100 AWCs reported that AWCs continued to privilege nutrition over education and only 15 percent of the respondents reported pre-school education for at least three hours, while AWWs themselves reported less than two hours of pre-school education.
Despite its important place within the ICDS, pre-school education continues to be one of the weakest links in the programme. While there have been several efforts made to monitor the nutritional status of children, little has been done to monitor the pre-school educational component which includes activities for cognitive, social and motor development (CBPS-UNICEF, 2017; Kaul, 2002).This is a tragedy since the ICDS provides one of the best examples of a developmentally appropriate, non-formal curriculum for pre-school children.
An analysis of the pre-school programme of the ICDS, in fact, reveals that the focus of learning in AWCs consists of structured and unstructured play and learning experiences to promote the social, emotional, mental, physical and aesthetic development of the child (Kapoor, 2006). Teaching is often conducted in the mother tongue.
However, despite having a progressive curriculum, implementation of the pre-school education component of the ICDS itself suffers due to several reasons. A study conducted by NIPCCD (2006) has shown that among the range of activities prescribed, those that are less resource-intensive, such
as storytelling, singing or counting activities, are being practiced in more centres, while those such as colouring/drawing, or utilising material considered age-appropriate such as blocks, rings, beads, strings etc are not as prevalent. This has largely been due to the non-availability of material in the centres, due to lack of budgetary allocation. The data on the availability of PSE kits in AWCs, which is supposed to consist of appropriate play material, stationery and teaching aids for pre-reading and writing, shows that 44 per cent of all AWCs sampled in the study did not possess a PSE kit, which is reflected in figures for PSE activities conducted across centres as well (NIPCCD, 2006). The NIPCCD (2006) report also suggests that one way to address the frequency of such activities is through improvisation with locally available material, since this reduces dependence on non-indigenous material for play, increasing familiarity for the children and also turns out to be more cost-effective in light of resource-constraints in several AWCs.
Similarly, a study by CBPS-UNICEF (2017), conducted across 100 AWCs in Karnataka showed that only 38 had at least five different kinds of PSE material. Like the NIPCCD study, this study also reported that there were more centres with academic material such as flash cards to teach colours, numbers, letters, stories, simple puzzles, picture books on animals, vegetables, fruits, and parts of the body) than play materials such as stuffed toys, building blocks, small drums and so on. This is also likely due to lack of budgetary allocations, aside from other reasons. The budgetary allocation under the budget head of ‘pre-school education’ for ICDS was zero between 2010-2012, and INR 1000 between 2012-2014 (Budget Information Series, OBAC, 2013). This has been revised in the 12th Plan, and an amount of INR 3000 per AWC and INR 1500 per mini-AWC has been allocated on PSE kits.
The revised budget for PSE is perhaps reflected in the findings of a more recent evaluation of 605 ICDS centres13 by NIPCCD in 2016. The study showed that 73.9 percent of AWCs reported adequate PSE material and 69.4 percent possessed PSE kits, a marginal improvement from the earlier evaluation (NIPCCD, 2016). Further, 30.7 percent of all AWW were found to be preparing low cost teachinglearning material (NIPCCD, 2016).
Another area which suffers in the pre-school programme is outdoor activities. These are conducted by lesser number of AWCs as there is a lack of availability of space, especially in urban areas (NIPCCD, 2006). Further, the workload of the AWW has been another challenge affecting the PSE component of the ICDS. The CBPS-UNICEF (2017) study showed that only 15 out of 100 AWWs surveyed reported conducting PSE for at least 3.5 hours. According to the study, the average time spent on PSE was one hour and 40 minutes. Discussions with workers shows that tasks such as record-keeping and introduction of additional schemes such as the Arogya Lakshmi in Telangana and the Mathru Poorna and Bhagyalakshmi schemes in Karnataka take away critical time from the PSE programme.
In addition to the internal challenges for the programme, another significant issue that has been growing in the recent years is parental aspirations and expectations from the PSE programme.
Though the ICDS PSE programme adopts activities that are developmentally appropriate for children between three to six years, parents insist on formal education, because of which certain components of formal schooling have also been introduced in PSE. These observations were repeatedly made during interactions with parents on the field (in Orissa, Delhi and Telangana).14
AWWs also reported that parents who sent their children up to the age of four to the AWC (for nutrition) would pull their children out and enrol them in private preschools by the age of five if they could afford it, as this would ensure the child’s continuation in a private, English medium school in the later years and avoid other problems such as the need to pay donations to enrol the child in Class.15
13In 19 States and Union Territories, based on data received by Central Monitoring Units (CMUs)
14Refer to Table 2 for details on stakeholders interviewed
15As reported during an FGD with AWWs in Ibrahimpet block, Ranga Reddy District, Telangana on 11th August, 2017 and during personal interviews with parents of children enrolled in AWC no. 115 in Tekhandvillage, Delhi on 9th August, 2017.
A study conducted by FSG similarly showed that parents’ perceptions of a ‘good’ ECE programme comprised of academic concerns such as learning the alphabet and numbers, getting into the habit of doing homework and performing well at exams. English language skills were also considered another marker of progress by most parents (FSG, 2015). The study sampled middle and low income families (with over 70% with a household income <INR 15,000 p.m.) in cities in India, with at least one child in the ECE (0-6) age group and spending between INR 300-1200 per month as fees. It found that of the 79% of children attending pre-school, 87% of this group was availing private sector services while only 13% were accessing government programmes.
Though the ICDS falls under the MWCD, there has been a push to include under-six year-olds within the ambit of the RTE, in which case shifting the PSE component under the Education Ministry can be considered (CBPS-UNICEF, 2017). However, since there is uncertainty around this inclusion, the ICDS has been preserved the way it is, so as to continue to provide for children from disadvantaged backgrounds. Alternatively, since health and nutrition requirements are also to be made available through PHCs via ANMs and ASHA workers, this component of ICDS creates an overlap of services, wastage of resources and challenges in monitoring. Delinking nutrition/health and PSE services may also provide the AWWs with adequate time to focus on activities related to child development (CBPS-UNICEF, 2017).
To address the programmatic, management and institutional gaps in ICDS, the restructured and strengthened ICDS was approved in the 12th Five Year Plan (MWCD, 2012). While the programme budget allocation was INR 444 billion in the 11th Plan period, it was increased to INR 1,235.8 billion in the 12th Plan period.16 As per the revised cost norms, the centre-state sharing ratio, which was earlier 90:10, is now 60:40 for all budget heads except for the Supplementary Nutrition Programme (SNP), for which it continues to be 50:50.
The programme was to be rolled out in three phases - in 200 high burden districts in the first year (2012-13), in another 200 districts in the second year (2013-14), and the remaining districts from 2014-15 onwards.
The gaps and challenges identified and to be addressed under this scheme were as follows:
• special focus on children under three years and pregnant and lactating mothers
• strengthening and repackaging of services, including care and nutrition, counselling services and care of severely underweight children
• a provision for an additional AWW cum nutrition counsellor for focus on children under three years of age and to improve the family contact, care and nutrition counselling for pregnant and lactating mothers in the selected 200 high burden districts across the country, besides having pilots on link workers, crèche cum AWC
• focus on ECCE
• forging strong institutional and programmatic convergence particularly at the district, block and village levels
• models providing flexibility at local levels for community participation
• improving the SNP, including cost indexation
• provision for the construction and improvement of AWC
• allocating adequate financial resources for other components including monitoring and management and information system (MIS), training and use of information and communication technology (ICT)
• to put ICDS in a mission mode
• revise financial norms (MWCD, Press Information Bureau, 2012)
As evident from the points listed above, the focus of the restructured ICDS still continues to remain nutrition and health. However, efforts have also been made to strengthen the PSE component by the MWCD (with support from NIPCCD) by identifying the Centre for Early Childhood Development and Research (CECDR), Jamia Millia Islamia as one of the technical resource centres for piloting the restructured ICDS curriculum in two projects each in Delhi, Haryana and Rajasthan (CECDR, 2013). The six month-long pilot study comprised of developing the curriculum through a core committee of ECCE experts and ICDS functionaries, implementing it and monitoring and evaluating the implemented curriculum. The revised curriculum, including a detailed daily timetable with activities targeting each development domain using appropriate teaching-learning material was operationalized through training of AWWs, organization of parent and community meetings prior to the implementation, provisioning support of supervisors and Child Development Project Officers (CDPOs) to AWWs and release of the sanctioned funds of INR 3000 per AWC by MWCD for PSE services. The monitoring and evaluation, though conducted in a short time span, was adjudged to have showed positive results in children’s development in the form of improved language skills, cognitive concepts such as colours, shapes, sizes, emergent literacy skills through worksheets, inculcated personal hygiene practices, increased attendance and generated an overall active interest in the new opportunities being provided as part of PSE. Other gains were in the form of parental satisfaction along with increased interest, commitment and positive attitude towards PSE by the ICDS staff.
The RGNCS was introduced by the central government to provide day care facilities to the children in the age group of 0-6 years from families with monthly income of less than Rs.12,000/-. Under the revised scheme of 2016, day care facilities, holistic health care and education are to be provided to children between six months and six years of age of working mothers. The specific services under the scheme are as follows: day care facilities, including sleeping facilities; early stimulation (0-3 years) and pre-school education (3-6 years); locally sourced supplementary stimulation; growth monitoring; health check-ups; and immunisation. The scheme was revised in order to cater to this demographic dividend in the context of growing needs of younger women, changing family structures, urbanisation and migration, after a recommendation by the Steering Committee on Women’s Agency and Child Rights, under the aegis of the Planning Commission, to re-design and relook at the scheme which had failed in providing quality day-care services to the target population previously (Revised RGNCS, 2016). Considering ICDS targets a similar population, provides a larger range of services, and has been universalised, it was also recommended that flexible models, AWC cum creche centres, revision of norms, and other such options be explored in the next (13th) Five Year Plan period for the implementation of the RGNCS.

The scheme falls under MWCD, GoI and the implementation was carried out by three main agencies - the Central Social Welfare Board (CSWB), Indian Council for Child Welfare (ICCW) and Bharatiya Adim Jati Sevak Sangh (BAJSS), in partnership with other civil society organizations as well as private agencies. As of 2008 however, all crèches under BAJSS were transferred to CSWB due to complaints of irregularities in the management, several of which were unable to function. Many crèches were also shut down by the implementing agencies due to non-performance (MWCD, Press Information Bureau, 2013). Moreover, no new crèches were sanctioned in the period between 2010 and 2013 (MWCD, 2013). These have resulted in a decrease in the total number of crèches, as can be seen from Table 9.
The first year of the implementation of the revised scheme is directed towards undertaking intensive inspections of existing crèches to weed out non-performing centres, and also to upgrade the infrastructural facilities of other crèches so as to meet the requirements of the scheme (Revised RGNCS, 2016). The implementing agencies will continue to be CSWB and ICCW, through NGOs, with a cost-sharing pattern of 90: 10 between the central government and the implementing NGO. The funds are released directly from the GoI to the implementing agency, instead of releasing the funds through the state government.
The targeted number of beneficiaries for this scheme has been 6,43,000 since 2014, but a population of approximately 5,82,000 benefitted in 2014-15, which further reduced to 534,000 in 2015-16 (Parliament of India, 2016).
In addition to providing PSE through AWCs, the government also provides it through a limited number of pre-primary sections attached to government primary schools. According to DISE 201314 data, around 15.5 percent of government schools in India have an attached pre-primary section, catering to 3.02 million students (CSF, 2016). 65% percent of these schools do not have a teacher for the pre-primary section and the primary school teachers are probably responsible for these children as well (CSF, 2016). An analysis by CSF (2016) shows that in 12 states, over 50 percent of government schools have an attached pre-primary section, while in 18 states, less than five percent do. Two states, West Bengal and Assam, in particular have a disproportionately higher number of primary schools with pre-schools attached and contribute to 66.6% of all pre-primary sections in primary schools in the country.
Nationally, the enrolment in government pre-primary sections is just over 30 lakhs, while it is 85 lakhs in private pre-primary sections.
After the ICDS, the private sector is the second largest provider of ECCE services. Aside from high end/costing private pre-schools, playschools, nurseries, preparatory schools and kindergartens that mostly cater to children from well-off families, there has also been a rapid expansion of lowbudget, private pre-schools, not only in the urban but even in the rural and tribal areas. Often such
9: Total number of crèches under the RGNCS
Andaman and Nicobar Islands Andhra Pradesh Arunachal Pradesh Assam Bihar Chandigarh Chattisgarh Dadra and Nagar Haveli Daman and Diu Delhi Goa Gujarat Haryana Himachal Pradesh Jammu and Kashmir Jharkhand Karnataka Kerala Lakshwadeep Madhya Pradesh Maharashtra Manipur Meghalaya Mizoram Nagaland Odisha Pudducherry Punjab Rajasthan
Sikkim Tamail Nadu Telangana Tripura Uttar Pradesh Uttarakhand West Bengal
0.07
15.51
43.26 94.12 90.31 10.65 20.77 82.43 73.82 71.6 54.81 1.16 94.37 90.09 67.21 1.13 90.63 1.1 90.91 18.52 41.77 86.03 59.28 8.47 33.77 2.25 51.14 56.38 67.67 1.75 87.66 54.78 55.46 1.17 64.9 3.59 78.77 60.19 0 5.88 43.93 1.07 59.52 3.08 65.78 10.87 76.65 75.59 77.28 24.96 96.43 92.81 67.6 3.15 96.93 89.29 78.74 0.3 47.73 0.61 83.37 67.57 93.18 2.08 15.97 0.18 78.88 0.92 5.02 4.89 50.14 1.25 59.96
Percent
institutions are also attached to elementary schools and, as Kapoor (2006) notes, can also be exploitative due to the heavy load placed on children as a result of a downward extension of the primary curriculum. Pressure is exerted on the children to compete and perform from an early age.
While some of these are registered with state-level educational authorities, many remain unrecognised, vary in quality and it is difficult to estimate the number of such schools (CECED, n.d.). A government estimate places the number of children enrolled in private ECCE centres at around 10 million though the actual figure may vary due to their unregulated nature (Kaul and Sankar, 2009). With a lack of guidelines in their functioning, these schools are marked by inequitable access, uneven quality and growing commercialisation (NECCEP, 2013).
Some of the major private players are running pre-schools through franchise models such as Eurokids (780 branches), Kidzee (550 branches) and Treehouse, which also offer services outside of India (Ohara, 2013). It is further noted however that in 2015, 67% of the childcare industry was dominated by the unorganised sector with no government supervision. The lack of regulatory frameworks, mechanisms and the growing commercialisation of education pose serious threats to quality, curriculum, infrastructure, teacher qualifications and access. Often, the quality of education provided at such centres might be counter-productive to a child’s development, resulting in ‘miseducation’ (Kaul and Sankar, 2009).
In addition to public and private programme, NGOs provide ECCE services either by running their own models or assisting government programmes. These services usually target children from socially and economically disadvantaged settings, such as those in tribal areas, migrant workers or rural children in certain contexts (Kaul and Sankar, 2009). According to government estimates, 3 to 20 million children participate in such programmes (Kaul and Sankar, 2009). While these services have not been evaluated systematically, those attending these programmes report positive outcomes from parents, and are also more likely to go on to study in a primary school (Swaminathan 1998; as cited in Kaul and Sankar, 2009). Several of these NGO models also cater to the diverse needs of communities and tend to demonstrate more innovative and developmentally appropriate teachinglearning practices (Kaul and Sankar, 2009).
The restructured ICDS is an example of collaboration between the NGO sector and the government, wherein NGOs and voluntary groups are recognised as technical support groups for training and capacity- building of communities and ICDS staff. Under the restructured scheme, the government has also proposed to partner with civil society organizations for operating up to 10% of all ICDS projects. The vision is that these models could contribute “to innovation, component enrichment, quality improvement, extending reach to unreached areas and better responsiveness to local contexts” (Planning Commission, 2011, p.8).
Public-civil society partnerships have also been extended in providing crèche services - by converting five percent of all AWCs into AWC cum crèche centres under the restructured ICDS scheme; as well as part of the RGNCS. An example of this is the partnership between MWCD and a Delhi-based NGO, Mobile Crèches, which has been providing ECCE services to children of migrant workers at construction sites and urban slums for nearly 50 years and now acts as a technical resource for the state. Under the RGNCS, NGOs are also invited to set up and manage crèches, and 90% of the expenditure is borne by the central government in the form of grant-in-aid to the NGO.
Overall, considering the high rates of availability and participation in pre-school education, the CECED report suggests that India is well positioned to work towards developing and implementing
quality standards in existing schools (CECED, n.d.). However, the lack of a regulatory mechanism is a critical concern. Market research on pre-school education in India cites precisely this lack of a regulatory framework as the primary reason for the emergence of a lucrative pre-school market in India, with the industry predicted to attract further investment and expand rapidly in the next few years (Technavio, 2016).
Additionally, parental perceptions on comprises good pre-school education has also become a factor contributing to the growing involvement of private sector business models in the domain of ECCE. However, as Nambissan (2012) notes, such models hold implications for quality and access and affect equity at the ECCE level. This also suggests the need for engaging parents to increase their awareness on the components of an appropriate ECE programme and the indicators of learning that they should look out for (FSG, 2015).
This chapter presents a comparison of the status of children across three states: Telangana, Odisha and Delhi. Telangana is a newly formed state (in 2014), which was formerly part of Andhra Pradesh. The new state comprises smaller districts, which have increased in number from 10 to 31 (Government of Telangana, 2015). Odisha (formerly Orissa) is a state in eastern India with 30 districts. It ranks third in the country in terms of Scheduled Tribe (ST) population, and 40% of Odisha’s total population comprises of SCs and STs (Government of Odisha website). The state is also rich in mineral resources such as iron ore, coal and bauxite, making it one of the most popular states for investment in industrial projects, especially in steel and power (Government of Odisha website). The national capital territory of Delhi, with 11 districts, is a union territory of India. However, it functions more like a state, with its own state government. The largely metropolitan area - it the capital of the country - is also among the largest urban cities in the world, and among the most productive in India in terms of per capita GDP.18
A comparison of the three states shows that the child population between 0-6 years is lower in all three than the average child population between 0-6 years for India. However, among the states, Odisha has the highest proportion of children between 0-6 years. Odisha also has the highest proportion of children between 0-6 years living in the rural areas (85.82 percent), which is higher than the national average as well (73.7 percent children between 0-6 years in India live in rural areas, and 26.3 percent live in urban areas).
With respect to child sex ratio, it appears that the sex ratio for Telangana and Odisha for 0-6 year olds is 933 and 941 respectively, higher than the national average of 918, but is lower for Delhi which is abysmally low at 814 (Census of India, 2011).
Source: Statistical Year Book 2013, Primary Census Abstract, Census 2011, Directorate of Census Operations, Hyderabad; Census of India 2011, Population Enumeration Data (Final Population) age data
Delhi, largely an urban state, also has a majority of the population between 0-6 years living in urban areas and has the lowest proportion of children (2.81 percent) living in rural areas, among the three states. Odisha has a mostly rural population and Telangana has a slightly higher rural population.
Looking at health and nutrition indicators, all three states appear to display better indicators than the national average for IMR, U5MR, full immunisation, stunting, wasting and underweight children, according to NFHS 4. Comparing the three states, Odisha still continues to have the highest IMR, U5MR, stunting, wasting and underweight indicators. The only exception is with respect to children between 6-59 months who are anaemic, which is highest in Delhi, followed by Telangana. Both Telangana and Delhi also have a higher percentage of anaemic children compared to the national average, while Odisha has made an improvement in this aspect, bringing down the rate by 20 percent to 44 percent (NFHS-4).
Telangana
Indicator
Infant Mortality Rate (IMR)
Under 5 Mortality Rate (U5MR)
Children aged 12-23 months fully immunised
(2005-06)*
51.8%
43.5%
Children under 5 who Are stunted (height for age) 28.1% 45% 34.1% 42.2% 32.3% 48% 38.4%
Children under 5 who are wasted (weight for height) 18% 19.6% 20.4% 17.1% 15.4% 19.8% 21%
Children under 5 who are underweight 28.5% 40.7% 34.4% 27% 26.1% 42.5% 35.7%
Children aged 6-59 months who are anaemic 60.7% 65% 44.6% 57% 62.6% 69.4% 58.4%
3 data
Source:
for Telangana
Health
There is variation among states in terms of indicators on which they fare better. Telangana has an IMR and U5MR far lower than that of Delhi and Odisha, while Odisha has the highest percentage of
fully immunised children, close to 80 percent, along with a significant improvement in the past decade in IMR and U5MR.
As in the case of all-India reports, data for state-wise enrolment/attendance in pre-school education show variation. According to the RSOC (2013-14), a higher proportion of pre-school age children in Odisha appear to be attending pre-school programmes, compared to Delhi and even all-India figures. Data for Telangana is not available (as the state came into being in 2014), but the figures for Andhra Pradesh shows that 84.4 percent children were attending some or the other form of PSE in 2013-14. Interestingly, the RSOC also shows that in Odisha and Andhra Pradesh a higher proportion of rural children are attending some form of PSE. This may perhaps be as a result of a large number of non-governmental organisations working on education in these states. A higher proportion of children also appear to be attending ICDS centres in these two states which might be the result of more NGO-state collaborations here. The history of NGO-state collaborations and support lent to ICDS by NGOs also came out during our field visits and discussions.
Data for further analysis by caste, religion, income, gender, etc has been limited or absent, and hence could not be undertaken.
TABLE 13: State-wise distribution of AWCs and enrolment as of March 2015
Telangana
Odisha
Delhi
India
Source: NIPCCD Handbook on Children's Statistics
An examination of the working of ICDS across the three states in terms of the number of AWCs sanctioned and operational also shows that Telangana has the smallest deficit in terms of numbers sanctioned, operational and providing preschool education. Odisha, on the other hand, has the highest deficit in terms of the number of AWCs operational and providing PSE.
A look at Figure 9 below shows that there are more private schools with an attached pre-primary section than government schools with an exception of Delhi. These figures, however, do not include the schools run by the local municipal bodies in different cities within these states. Government preprimary provisioning is extremely low in Telangana and Odisha though a large portion of the children attend AWCs in rural Odisha, and a combination of AWCs and LKG/UKGs in rural Telangana. However, as CSF (2016) suggests, investing further in pre-primary sections in government schools could offer an opportunity to provide age-appropriate curricula to three to six year-old children across the country and also contribute to ensuring continuity during the transition to primary schooling. A professional trained on pre-school education trained pre-school teacher would be better qualified to impart this curriculum and focus on the educational component of ECCE. A potential strategy to do this would be to extend the RTE to children under six.
Figure 9 shows that a high number of government run pre-schools in Delhi have a pre-primary section, while this is almost absent in Telangana and comparatively on a much smaller scale in Odisha. Odisha has a high number of private schools with pre-primary sections, which is also seen for the allIndia level. Perhaps this affects enrolment in the AWCs. However, the proportion of children enrolled in AWCs in Odisha is also much higher compared to the other two states (discussed further below), which suggests that there is perhaps a higher load and requirement for ECCE provisions in Odisha, which also has a higher child population between 0-6 years compared to the other two states.
A comparison across the states in terms of proportion of children attending ICDS centres show that highest number of boys and girls in Odisha are enrolled in AWCs (14.6 percent and 14.4 percent respectively), followed by Delhi (8.9 percent boys and 8.4 percent girls), and finally Telangana (8.1 percent of boys and girls). The differences between boys and girls in terms of enrolment in AWCs thus does not seem to be high.18
In rural Odisha, a fairly high number of children aged 3 and 4, over 80%, are attending AWCs or Balwadis, and a few are enrolled in LKG or UKG. At 5 years of age though, close to half the children are attending primary schools, despite the official age of entry to primary school under the RTE being mentioned as 6. Even at age 6, by when the child should have begun primary schooling, around 15% children continue to attend pre-school education.
In rural Telangana, there is a significantly high proportion of three year-olds (around 30 percent), not enrolled in any PSE centre. However, by the age of four, over 80 percent are enrolled in either
All-India Enrolled in balwadi/ AWC
Enrolled in LKG/ UKG
In school
Total Government Private Other
Out of Pre-school or school
Age 3 53.6% 8.2% 38.3% 100% Age 4 52.3% 22.5% 25.3% 100% Age 5 22.5% 17.7% 30.7% 17.5% 0.9% 10.6% 100% Age 6 5.6% 10.3% 53.3% 25.1% 1.0% 4.9% 100%
Age 3 81.8% 3.1% 15.1% 100% Age 4 83.9% 10.8% 5.2% 100%
Age 5 41.0% 8.4% 36.0% 11.2% 0.0 3.4% 100% Age 6 8.8% 5.4% 69.5% 14.5% 0.2% 1.7% 100%
Telangana
Age 3 57.4% 10.1% 32.5% 100%
Age 4 42.7% 42.5% 14.8% 100% Age 5 11.1% 37.3% 29.3% 19.2% 0.1% 3.0% 100% Age 6 1.4% 19.7% 42.5% 34.0% 0.0 2.4% 100%
Source: ASER (Rural), 2017.
Note: For 3 and 4 years, only pre-school data is recorded. Data for Delhi was not available
Figure 10: Age-wise attendance by ECCE provision type for rural Odisha
Source:
AWCs/balwadis or LKG/UKG in equal proportions. As in the case of Odisha, by the age of five many children begin attending either government-run or private primary schools, while even at age six, around 20% continue with pre-primary education. This trend might be because of the differences in the age of entry into primary school among different schools and states. The entry into pre-school in both states also increases from age three to four, perhaps since pre-primary education is not considered an essential requirement for younger children.
Notably, both rural Odisha and Telangana fare better on enrolment indicators for children from 3 – 6 years of age when compared to the average statistics for rural India, according to which 38.3% of three year-olds, 25.3% of four years-olds and 10.6% of five year-olds are not attending any pre-primary or primary education.
Overall, the status report establishes the importance of providing for developmentally appropriate ECCE, particularly for a country such as India which still lags behind significantly in terms of nutrition, health and pre-school education indicators compared to its neighbours. Against this context it also highlights the lack of adequate budgets for implementing the restructured ICDS which was to bring about improvements in quality and efficiency of services. Particularly the status report also presents a dismal scenario with regards to preschool education, with lack of provisions and budgets within ICDS to undertake this successfully on the one hand; and the mushrooming of and demand for developmentally inappropriate interventions focused on reading and writing within private schools. The report stands as a caution against the unregulated growth of ECCE provisions of varied quality and orientation that can further deepen existing inequalities in access and outcomes based on social positions and status.

The National ECCE Curriculum Framework notes that a common curriculum cannot cater to the individualised and contextual needs of children but the lack of a framework is currently leading to all kinds of practices which are not developmentally appropriate for children. ECCE programmes are either minimalist in their approach, with little or no focus on the educational component, or they follow a downward extension of the primary school curriculum, stressing on advanced learning outcomes and adversely impacting the child’s learning potential. This presents certain appropriate norms and practices as part of the framework, specifically in the education component. The curriculum and pedagogy are motivated by the need to address synergistically linked domains of learning processes (memory attention, observation), cognitive skills (reasoning, comparing, contrasting, etc), specific information, language (literacy, reading, writing, oral skills), emotional well-being, psychosocial stimulation and physical well- being (motor skills, movement, coordination). It is interesting to note that despite the ECCE policy advocating for the inclusion of indigenous and culturally relevant practices, the suggestions for parent and community involvement are restricted to spreading awareness, sensitising them and mobilising their support only for certain kinds of practices.
Language should be home language or mother tongue and expression of all languages should be encouraged, followed by phasing in the formal school language (regional or English)
Training caregivers to handle multiple languages
Adaptability and flexibility of curriculum for children with different impairments and special education needs
Multi-age groupings (also pragmatic in rural areas, low funding for ECCE)
Promote equal opportunities for boys and girls through expectations, treatments and interactions
Use teaching material free of gender bias such as stories, songs, games, role play, activities which depict all genders in similar roles and positions
Build positive disposition to learning processes by avoiding formal curricular practices, repeated criticism
Appropriate teacher-child ratio
Daily, weekly and yearly planning for activities, themes, goals
Continuous observation, documentation and interpretation of each child’s development, to be shared with parents at least twice a year, along with appropriate intervention based on this
Portfolio of each child with sample work, developmental progress checklist, medical health form, progress reports
Different types of books: large board books, picture books, local folk tales, simple story books, comics, children’s magazines
Drama equipment: dolls, doll sized furniture, play utensils, food, dress up clothes, mirrors, comb
Blocks in different shapes, colours, sizes
Small toys like vehicles, animals, human figures etc
Paper, crayons, pencils, slates, chalks, paint, brushes, pieces of fabric, tape
Notebooks, pencils and other stationary
Locally available or naturally occurring material
Music CDs or tapes, local instruments if possible Display few materials at a time, and change them regularly to sustain interest
Accessible shelves with labelling and drawings for storage
Display walls
Child-sized colourful furniture or coloured mats
Material for sports and outdoor play: bicycles, jumping ropes, tyres, sand box, swings, slides etc
Parental education on importance of home language and mother tongue Sensitisation, orientation and training on Special Education Needs (SEN)
Strengthening families by building on positive family attributes
Involvement of parents at home with their children through reading books, playing games, narrating stories and conversing with them.
Parental commitment towards timely enrolment
Involvement in creation of play materials
Taking part in the assessment process through attention to the child’s development process
Nutrition and health education for pregnant and lactating women
Taking the help of local crafts persons, artisans for creating play material for children, using indigenous material and locally available resources
Selection of caregiver/teacher from within the community (as in the case of AWWs)
Self-help services through mobilization of the community and their resources, voluntary efforts
Voluntary collectivisation of women and mothers
i) Supplementary nutrition: Under the SNP, children between three and six years of age are provided with hot cooked meals at AWCs. Pregnant women, lactating mothers, adolescent girls and children under the age of three are given rations. The food items included are fortified foods, rice, wheat, green grams and milk powder and is provided based on the needs of the target group. The objective of the SNP is to bridge the gap between the Recommended Dietary Allowance (RDA) and the Average Daily Intake (ADI).
ii) Immunisation: Children between the ages of 12-23 months are immunised against preventable diseases such as diphtheria, tetanus, tuberculosis etc. Pregnant women also receive immunisation against tetanus. Immunisation camps are held regularly at the AWCs.
iii) Health check-ups and referral services: Antenatal care, post-natal care and regular health check-ups for children under six are provided under this component. As part of the health check-up, weight and height of children and pregnant women are regularly recorded; growth monitoring is undertaken; abdominal girth, BP and haemoglobin levels of pregnant women are checked; malnourished children are identified and monitored, and other simple illnesses, such as diarrhoea and de-worming are managed through simple medication available at the AWC, by the AWW and the Auxiliary Nurse Midwife (ANM). In case of severe illnesses, children are identified and referred to primary or tertiary hospitals for further treatment. Both immunisation and health services are carried out in convergence with the Ministry/Departments of Health and Family Welfare, via the National Rural Health Mission (NRHM).
iv) Nutrition and health education: AWWs organise monthly meetings and home visits with pregnant and lactating women enrolled at the AWC with purpose of disseminating information on health, nutrition, infant and young child feeding practices and child care. Additionally, a monthly Village Health and Nutrition Day (VHND) is organized as a health and nutrition camp for the entire village.
v) Pre-school education: Pre-school education is to be provided to children between 3 – 6 years of age by the AWW at the AWC. Under the restructured ICDS, the AWC has been repositioned as a vibrant ECD centre which is to provide a stimulating environment for children through developmentally appropriate activities and the play-way method with the goal of holistic development in the cognitive, physical, socio-emotional and psychological domains.
CHILD DEVELOPMENT SCHEME (ICDS): AN ANALYSIS OF THE NATIONAL BUDGETS WITH SPECIAL REFERENCE TO THREE STATES (Delhi, Odisha and Telangana)
This report presents an analysis of ICDS national and state budgets (for Delhi, Odisha and Telangana) for four years from 2014-15 to 2017-18. It analyses these budgets in relation to changes in financial planning in India, following the introduction of the Fourteenth Finance Commission, as well as in relation to the specific populations and additional/ differential provisions {e.g., with regards to salaries of workers, timings of Anganwadi Centres (AWCs), schemes, etc.} made by individual states. The section also provides an account of sample ICDS centres visited across the three states and attempts to analyse the budgets in relation to the processes and practices noted there, as well as in relation to the discussions undertaken with ICDS functionaries.
It analyses these budgets in relation to changes in financial planning in India, following the introduction of the Fourteenth Finance Commission, as well as in relation to the specific populations and additional/ differential provisions made by individual states.
The key points noted in this report are the decline in the number of ICDS beneficiaries availing ICDS services, and budgets in the recent years. It also notes that among the states, Odisha, with the highest shortage in number of operational AWCs, also has the highest child population between 0-6 years, as well as the highest number of enrolments in AWCs. Telangana, a newly formed state, has the highest working hours for AWCs and the highest honorarium for workers among the three states. Among the states, Odisha is also the only state with a separate budget for PSE. Delhi has the highest per capita ICDS spending, which is perhaps driven by high rents. The visits to AWCs in the states, though very limited in terms of number, suggested the highest level of satisfaction from the services in Telangana, indicating that expenditure on salaries, training and motivation of human resources coupled with attention to monitoring by and accountability to diverse stakeholders is perhaps more important in terms of ensuring quality service than investing in infrastructure alone. Although this is not an either/or choice, investment in human resources seem to be a necessary condition while investment in infrastructure is a sufficient condition.
TABLE 1: Six tier classification of accounts 63
TABLE 2: ICDS budgets and expenditures between 2014-15 and 2017-18, GOI 65
TABLE 3: Comparative analysis of anganwadi functioning hours, salaries and benefits 71
TABLE 4: Number of anganwadis: sanctioned and operational: Delhi, Odisha and Telangana 71
TABLE 5: ICDS budgets and expenditures between 2014-15 and 2017-18, Delhi 72
TABLE 6: ICDS budgets and expenditures between 2014-15 and 2017-18 for Odisha 73
TABLE 7: ICDS budgets and expenditures between 2014-15 and 2017-18 for Telangana 74
TABLE 8: Average per annum, per capita ICDS expenditure across the three states 78
FIGURE 1: Nominal and real expenditure on ICDS 65
FIGURE 2: ICDS expenditure for Delhi 73
FIGURE 3: ICDS expenditure for Odisha 74 FIGURE 4: ICDS expenditure for Telangana 75
FIGURE 5: Social sector expenditure as a proportion of total expenditure 75
FIGURE 6: ICDS expenditure as proportion of social sector expenditure 76
FIGURE 7: ICDS expenditure as proportion of total expenditure 77
FIGURE 8: Proportion of ICDS expenditures on different elements across the three states 78
FIGURE 9: Average per annum, per capita ICDS expenditure across three states 79
Thisreport presents an analysis of the national and individual state-specific ICDS budgets and follows the status report presented in Report 1. The report focuses on the analysis of budget and expenditure for the ICDS scheme in India with a special focus on the three selected states. It also combines the finding based on the fieldwork on the ICDS functioning across the three states.
The budget-related findings in this report are based on a primary analysis of budget documents for each state for the relevant years undertaken by CBPS. The analysis involved identifying budgets/expenditures on children between 0-6 years that cut across different programmes/functions even when analysing budgets and expenditures for the ICDS scheme alone. Therefore, it is also important to point out that since we have undertaken a thorough analysis of all budgets/expenditures allocated across different programmes, our estimates differ slightly from the data presented in another section of the status report (Report 1), which has been drawn from secondary sources and does not present further details about the manner in which the analysis was undertaken, thus not allowing one to see how the specific budget figures were arrived at.1 However, none of this impacts the inferences as major trends remain similar.
The
outlay on child
follows broadly a
would figure as below in the
The
As can be seen, outlay on the child welfare
under this
is provided under the function
include Women’s Welfare, Welfare of the
Security and Welfare. The other
The budget-related findings in this report are based on a primary analysis of budget documents for each state for the relevant years undertaken by CBPS.
Disabled and so on. The ICDS is one of the schemes under the Child Welfare programme. The other schemes under Child Welfare are Integrated Child Protection, Beti Bachao Beti Padhao (Save the Daughter, Teach the Daughter) and a few other schemes.
There are two other dimensions of classification. One used to be the Plan and Non-Plan categorisation; this practice has ceased since the financial year 2017-18 budget. Starting from the 2017-18 budget, expenditure under each grant (which is generally coterminous with a department/ ministry) is divided into two categories viz. administrative expenditure and scheme expenditure The latter is provided under five layers viz. centrally sponsored schemes, state schemes and district schemes, Special Component Plan and Tribal Sub Plan. Because of these layers, the same intervention appears several times. For instance, the ICDS scheme would appear under all the five layers.
Given that the budget classification in India does not follow a programmatic representation (although the term programme is used for Child Welfare), many other expenditures that cater to children’s well being are provided under different functions/programmes such as Elementary Education Programme: Midday Meal Scheme, Maternity and Child Health Programme and so on. Therefore, if one were to arrive at the expenditure on children in any particular state, one would have to search the entire budget and pick out schemes that relate to children in a substantial way.2 GoI publishes Statement 12 – Allocations for Welfare of Children, in which it lists grant-wise budget outlays for children but that too remains a partial exercise, as it does not focus on a number of initiatives by various departments.
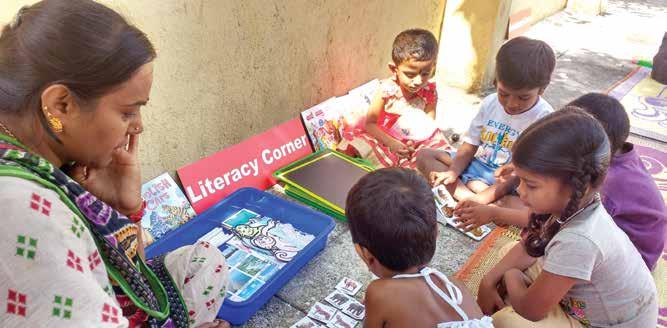
Since, the focus of the study is Early Childhood Care and Education, which is largely catered to by AWCs, it is enough to look at the budgetary outlay on Child Welfare – ICDS. But in addition, 2236-Nutrition has to be considered as the budget for meals provided to children at AWCs comes from this head.
Within the broad classification described earlier, each state follows its own manner of naming schemes and has its own interventions. The schemes under Child Welfare are shown under two broad headings – ECCE-related and Other Child-related - in the three states (Table 2). The Other
2CBPS has undertaken a comprehensive analysis of public expenditure on children in Karnataka with UNICEF analysis going beyond major heads, minor heads and schemes, and going into object heads to see what it was really spent on. The report is available on (http://cbps.in/ wp-content/uploads/Public-Expenditure-on-Children_KA.pdf & http://cbps.in/wp-content/uploads/Unicef-Karnataka-Policy-Brief_1-August2017-High-res-pdf.pdf)
Child-related schemes are those where the benefit extends to children beyond the 0-6 age group. Pregnant and lactating mothers’ nutrition has been treated as ECCE expenditure as it impacts the health and well-being of children in 0-6 age group. As adequate and good quality AWC infrastructure is important for the quality of ICDS delivered, the expenditure on construction and maintenance of AWCs has also been treated as ECCE-related.
2015-16
2016-17
2017-18
A-Anganwadi/ ICDS 16679.20 15566.11 14710.60 15445.19
B – Pre-school education 0.00 0.00 0.00 0.00
C – Nutrition 473.88 289.60 809.00 4200.00
D – Anganwadi infrastructure 0.00 0.00 0.00 0.00
E – Others 446.10 496.85 597.50 648.00
Total expenditure (Nominal) 17599.18 16352.56 16117.10 20293.19
Real expenditure 14900.79 13602.40 12939.20
GDP at current prices 12445128 13682035 15183709 GDP at constant prices (2011-12 series)* 10536984 11381002 12189854
Discount factor 1.18 1.20 1.25
The transfer to states for the ICDS scheme is made as grant-in-aid under major head 3601. Therefore, the break-up of ICDS funds under different categories such as AWW’s wages, nutrition, etc. is not available. However, what is evident from the outlay on ICDS is that the GoI has somewhat reduced the outlay (during 2015-17) before restoring it to the 2014-15 level. Thus, in real terms, the outlay has actually gone down over the last four years, both in nominal and real terms, the decline being slightly higher in real terms as compared to nominal terms.
While discussing the state-wise budgets in detail, a description of the AWCs visited in each state is given to present a picture of the ground-level functioning of the ICDS scheme, against which then the budget allocations and expenditures can be examined and understood better. The selection of ICDS centres in each state was based on proximity to other types (private and NGO) of centres studied, along with constraints placed due to requirement of necessary permissions from state departments.
The ICDS centre visited in Delhi was one supported by Save the Children (STC) and located in Tekhanda village in Okhla, predominantly an industrial area. The centre was located in a remote corner, not easily accessible to outsiders. That is what made it easier for the children to access. But the roads to reach the place were muddy and narrow with a number of vegetable markets and shops lined on both sides. The AWW’s timings were from 9.00 A.M. to 2.00 P.M. while the centre runs from 9:30 A.M. till 12:00 noon.
The centre was in fact a small room on the ground floor of a house which appeared to be of 10 X 10 square feet on sight. The room was rented out from a community member who lived in the same building. The room had 3 shelves, 4 little chairs, a stool and a chair. There was one story book corner with about 15-20 books. The centre had only one window and one door with a lock. To summarize, the room was quite small and dark with hardly any ventilation. There was one toilet built outside the room which was used by both boys and girls. The walls were painted with scenes from the zoo and park and also letters of the alphabet. The centre has an enrolment of 18 children and on the day of the visit there were 15 children in the class (8 girls and 7 boys). There were no benches in the classroom and all the children were seated on mats. There was a sink with attached water storage. Drinking water was supplied in the locality once in two days and needed to be filled up regularly. The charts in the classroom were prepared by the AWW and the Anganwadi Helper. All the related stationery such as chart papers, crayons, colours, mats, toys, table, chairs, registers, etc. are provided by the DWCD periodically, though the periodicity varies.
The AWWs said that, in most cases, more girls are enrolled at the AWC than the boys. According to them, girls are more ‘sincere’. Within an AWC, kids are grouped into two age groups - 3 – 4 years and 4 – 5 years, sometimes including 6 year-olds as well. Usually for children who are partially physically disabled, the centre makes exceptions for the age-limit and enrols them. Otherwise, they are referred to an NGO present in the community. The day starts with some regular personal conversations about how the child spent the previous day. Classroom activities are planned for children from 3 – 6 years of age. These activities involve prayers in the morning, discussions related to hygiene and self-help, poetry, rhymes, storytelling, physical exercises such as body movements and balancing exercises and free play. On the day of the visit, the children were made to do counting exercises, recitation of poems, balancing exercises that ended with about 20 minutes of play time. The medium of instruction and interaction was Hindi. Non-Hindi speaking children tend to pick up the language quickly and are accompanied by their mothers for the initial few days. Learning materials included dolls, plastic vegetables, wooden blocks, footstep imprints for balancing exercises, chart papers, crayons, blackboard and chalk.
Each child is allocated 50 grams of snacks and 270 grams of food. For every 35 AWCs, there is a common kitchen which provides the food. The parents and the teachers were unhappy with the quality of the food and mentioned that sometimes it was inedible as it tasted so bad. The earlier contractor provided better meals but the new one was not up to the mark. In their view, poor supervision was the reason. On special days such as 15th August (Independence Day), the AWWs provide toffees to the children from their own pockets.
Parents were only sending their children to the AWC since they could not afford private schooling and hoped they would eventually shift them to private schools. Some others preferred sending their older children to the MCD school which provided free books and uniforms and did not charge any fees and were sending their younger ones to the AWC primarily to discipline them, or because there was no other option. Both the parents and workers were appreciative of Save the Children’s (STC) involvement with the centre, providing it with materials and helped in improving the functioning of the AWC.
The association with STC had helped. The room where the centre was housed was found through support from STC. The STC representative even facilitated negotiations with the owner regarding the delay in payment of rent. The STC had procured and provided a lot of the materials, such as the books and some toys for the AWC. In fact, all the story books in the centre were donated by STC under one of their programmes. However, the AWW was very submissive toward the STC representative and became meek as soon as the STC representative stepped into the centre. The AWW also became more animated with the kids in the presence of the STC representative.
The STC had procured and provided a lot of the materials, such as the books and some toys for the AWC. In fact, all the story books in the centre were donated by STC under one of their programmes.
The two ICDS centres visited in Mohana block were at Lambapanka (not supported by any external agency) and Badakhani (NGO-supported). Both the centres functioned as standalone centres.
The ICDS centre in Lambapanka in Mohana block appeared to be scarce on resources, with scanty play and teaching materials, poor storage facilities for rations, small number of beneficiaries, etc. The conversation with the Anganwadi Helper (all the AWWs had gone to block headquarters for training on the day of the visit) suggested that the uptake was low among children as well as pregnant and lactating mothers. The atmosphere of the centre seemed to be somewhat lax in nature, though it is difficult to determine if it was because of the absence of the AWW or it was always like that. The parents expressed strong discontentment about the functioning of the centre with respect to several issues: poor performance of the AWW, children not learning, poor quality of meals, biased selection of members for the monitoring committee, poor monitoring by government supervisors, etc. The reason cited by some parents for availing the ICDS facility was the lack of other affordable options within the vicinity and availability of the basic nutrition for the children through meals provided in the AWC.
This ICDS centre at Lambapanka is an independent government building (300 sq. ft.) located on the main road which connects to the village with a single toilet attached to the outer wall of the centre but without any water connection. Although the centre had a tube-well close to the entrance, the water availability was close to nil, compelling the Anganwadi Helper to carry water from the tube wells located inside the village. It did not have any boundary wall.
The ICDS centre at Badakhani was an independent rented house (450 sq. ft), with three rooms and a balcony. The centre was well located and was approachable by road, though it did not appear to be very secure due to the absence of a boundary wall. The centre did not have a toilet or any provision for water. The Anganwadi Helper has to source water from the tube well, located 50m away from the centre.
Both centres lacked sufficient play materials, visual displays and wall charts, was inconsistent in growth monitoring of children, shortage of water and irregular provision of rations by the government.
Thus, the two centres were not very different in terms of physical resources and access to services but the community engagement was visibly different in the centre supported by the NGO. The
CCWD3 was supporting the Badakhani ICDS centre in a minimal way, by orienting a teacher from the CCWD’s non-residential education centre for children above six years of age to support ICDS activities as one of her many responsibilities. The focus was on community mobilisation and the presence of a non-governmental organisation appeared to have an impact in terms of creating better awareness and involvement of community. The scheme seemed to have better uptake in the village.
Parents were aware of their inability to gauge the child’s progress due to their low awareness levels, and hence expressed their interest in adult literacy and provision of study materials for home so that the children are able to practise. They also expressed the need for consistent delivery of rations.
During a focus group discussion, AWWs expressed their dissatisfaction with the low honorarium, which is even lower for Mini-Anganwadi centres, work burden and documentation, lack of basic infrastructure, in-pocket expenses accruing from phone bills, transportation costs and other sources which are not reimbursed. It seemed that some AWWs opted for this work due to lack of other working opportunities for women within their villages and a preference for Scheduled Tribes for certain jobs. These bottlenecks were also reflected to a certain extent while interviewing the ICDS supervisor, who spoke about lack of funds being a hindrance to better operating of the scheme.
Even though Nua Arunima was initiated by the government of Odisha in 2012 for introduction of instruction in multiple tribal languages and guidebooks were distributed to all tribal centres, almost all AWWs we interacted with seemed to continue teaching the children in the state language of Odiya.
Two ICDS centres were visited in Ibrahimpet block of Nizamabad district - one each in Maganpally and Pocharam. While the centre at Maganpally was located within a primary school with safe access, a compound wall and adequate play area (about 500 sq. ft. shared between the school and AWC), the second centre was a standalone institution and had no compound wall. The surroundings of the second centre were unkempt with lots of weeds and marshy area. The AWC located in the primary school had separate toilets for the children in the AWC and a single slide for children. The room size was about 15ft X 5ft, and it was colourfully decorated with various charts and posters. There was an additional room used as a kitchen and for storage about 5ft X 3ft. The centre was well-ventilated with two windows, one light bulb and one fan. The number of beneficiaries in the first centre were as follows: 60 children between 6 months and 3 years, 20 children in the preschool age (3 – 6 years) (10 boys and 10 girls), 14 pregnant women and 15 lactating women.
With regards to the second AWC, there was a 12 X 15ft class room along with a small kitchen (8X8ft) with RCC roofing. The AWC had a functioning toilet at the back side with asbestos sheet roofing. They get water from a public tap located at the entrance of the school. The teacher maintained a small garden at the backyard of the school where they have grown vegetables and fruits. The AWC had electricity with a light bulb and a fan. The utilities were provided and maintained by the gram panchayat. The ventilation at the centre was good. The classroom was covered with charts on all the sides with the alphabet, parts of the body, numbers and so on. There were two corners where play items and models were displayed. The children do not have space to play outside. The total strength of the AWC was 16 comprising of 12 girls and 4 boys.
Provisions for cooking/nutrition and naptime were adequately available in both the centres. There was a gas cylinder, stove and vessels for cooking and serving food. Four large carpets were provided at the AWC of which two carpets were in a usable state and could be used by the children
The classrooms were not organised in any particular way. All the children were sitting on the floor in a circle. In one corner, there were lot of teaching-learning material stacked, many of which were hand-made. There were hand-made models of weighing scales and puzzles. There were hand-made shapes. Other material available in the AWCs were puzzle boards, drum, clock, flash cards with names of the children on them, puppets, a target box (basically a box where children could aim and throw a ball), carom board, a small basketball hoop, games for buttoning, stitching, sticking Velcro pieces, slates, abacus, charts and workbooks. The workbooks were provided by the state government which had many school readiness concepts such as the concepts of big-small, weight, colours, etc., which were to be taught through illustrations. The medium of instruction was Telugu, with use of some Hindi in between. In addition, the centre also had a chart on nutrition put up and the food menu to be served to the children. There was also a scale drawn on the wall to measure height. Though there was no timetable that we could see displayed, the AWW shared a detailed timetable that was available in the form of a booklet in Telugu. The timetable was divided both day-wise (with time) and month-wise.
The workbooks were provided by the state government which had many school readiness concepts such as big-small, weight colours, etc., to be taught through illustrations. The medium of instruction was Telugu, with some Hindi used in places.
The centres had one AWW and one helper each. With respect to her work, one of the AWW said that she receives the children in the morning beginning the day with a prayer followed by organization of the children for indoor play followed by out-door play. This is followed by story-telling, rhymes and preparing the children for some cultural performances. Before children went home, she also taught letters in English and Telugu and some numbers. The AWW mentioned that the children were not made to write on slates but are taught mainly using charts and boards. Before the children leave for home at 4.00 P.M., she spends 30 minutes on recapping what had been done during the day. The children are dropped to their respective homes by the AWW though she does not pick them up in the morning. As for supplementary nutrition, children are provided with eggs between 9.30 A.M. – 9.40 A.M. in the morning, lunch is provided to them between 12.15 P.M. – 1.00 P.M. and some snacks are provided to the children at around 3.00 P.M. The children get a nap time between 1:00 P.M. -1:30 P.M.
With regards to children’s assessment, AWW fills what is called an ‘Improvement Development Book’. The book is to be filled thrice a year – in July, December and April. The parameters assessed are physical, social, cognitive development and learning styles. In addition, the assessment sheet also contains space for monthly recording of attendance, weight and height, appearance, and opinion of the AWW. There are a total of 50 indicators in the assessment sheet. The AWW also organises parent-teacher meetings twice a month to report about the nutrition, health, education and developmental status of the child. ECCE day is also conducted once a month and the parents are shown the different activities that are done with the child in the AWC and at what stage the child is. AWWs reported that parents demanded that English be taught in the AWC and children be provided with small rice instead of big rice for nutrition.
Every Friday, the AWWs reported undertaking home visits from 2:30 P.M. – 4:00 P.M. Priority in home visits is given to the beneficiaries who were anaemic/malnourished. Further, she tries to make home visits to the homes of children between 5 – 7 months at least twice a months.
The health facilities/services in the AWC whose AWW was interviewed seemed to be functioning. It was reported by the AWWs that she arranged for immunisation every second Saturday of the month. According to her, for immunization the beneficiaries preferred the AWC rather than the Public Health Centre.
With respect to training, the AWW completed a one and a half month Job Course Orientation (JCO) training at the time of joining in 2001 wherein the ICDS goals, objectives, services, the role of the AWW, the role of the Anganwadi Helper and their responsibilities were discussed. The pedagogical approach used was a combination of lectures, field visits and role play. The training was conducted by the Training Department of the DWCD. The AWW attended refresher trainings in 2010, 2011, 2012, and 2015. In addition, she also received training on pre-school education, attended a 15 day Master Training course in Vijaywada and a training on the Arogya-Lakshmi scheme.
The work in the AWC is monitored by the parents, supervisor, sarpanch and village secretaries with all taking up the responsibility. There are sudden visits by different stakeholders. The supervisor visits once in a month and the CDPO visits once in three months. According to the AWW, the supervisor monitors by checking what the children have learnt by asking the children some questions and if they are able to answer them and if the syllabus is being followed; checking the stock, checking the registers and seeing if there are any long absences among beneficiaries. If these processes are not in place, she motivates the worker to complete these tasks on time.
Parents interviewed reported that their children regularly received food and also attended pre-school classes at the AWC. While parents are not involved in any activities/decision-making in the AWC, the AWW discusses issues that are of important such as the importance of education for children, monthly meetings to discuss the benefits of Arogya Lakshmi scheme, good child care practices, importance of good habits and good food, etc. Parents were happy with the provisions in the AWC, satisfied with the quality of the food provided in the AWC and reported that the children were happy there.
However, the lack of availability of clean water was a primary concern of many parents. Drinking water is not available in one of the AWCs and is bought from one of the households which is about 100 meters away. There was a need for more play materials for the children. Lack of electricity/ power-cuts was an issue in the summers with children being uncomfortable because of the heat..
An analysis of the ICDS scheme across the three states shows that there are regional differences in the ways in which ICDS is implemented. An important point pertaining to the ICDS budget is that though it has been a centrally sponsored scheme (CSS), different states have added their own components and additional budgets leading to difference in the model: working hours, remuneration and benefits are different for different states. For instance, both Delhi and Odisha function for the same number of hours but the honorarium is different; the same is true for Telangana and also, Karnataka. Karnataka pays significantly less than Telangana but it has social security benefits (medical and health insurance, job for dependents in case of death, etc.) that does not exist elsewhere. These differences have an impact on the motivation levels, retention and engagement of the workers.
ICDS and ECCE are treated as interchangeable as only expenditure that relates to children in age group of 0-6 has been considered ICDS expenditure.
Telangana 9:00am -4:00pm 9:00am -4:00pm Rs. 10,500 Rs. 4,500 No Delhi 9:30 am - 12:00 noon 9:00am- 2:00pm Rs. 5,000 Rs. 2,500 No Odisha 9:00am- 2:00 pm 9:00am- 2:00pm Rs. 4,000 Rs. 2,000 No Karnataka 9:30am-4:00 pm 9:30am-4:00 pm Rs. 8,000 Rs. 4,500 Yes.
Note: Since this information existed for Karnataka, the same has been added though the study focuses only on the remaining three.
Source: Department for Women and Child Development websites for respective states.
Table 4: Number of anganwadis sanctioned and operational in Delhi, Odisha and Telangana
AWCs sanctioned 11150 74154 35700
AWCs operational 10897 71204 35353
Percentage of AWC operational 98 96 99 No. of AWW sanctioned 11150 74154 35700 No. of AWW in position 10806 68865 33518
Percentage of AWW in position 97 93 94 No. of children enrolled in the AWC (0-6 years) 425000 4392393 1696840
Source: Statistics on Children in India: A Hand Book by NIPCCD, 2012
Table 4 shows that Telangana is better placed than the other two states in terms of the percentage of operational AWCs against the sanctioned number. In terms of AWWs on position, Delhi is better placed, followed by Telangana and Odisha. With a high number of AWCs in Odisha and with a deficit of 4% operational AWCs against the sanctioned number, Odisha faces a big challenge. The implementation of the scheme varies across the three states and a summary table presenting the same is presented in Annexure 1.
This section provides the analysis of ICDS5 expenditure in the three states of Delhi, Odisha and Telangana. Firstly, it may be noted that GoI transfers bulk of the ICDS budget as grant-in-aid to the states under head ‘3601- GIA to State Governments’. Secondly, the three states vary in area, population and past investments. Therefore, comparing them at face value would be misleading. Therefore, an attempt has been made to assess the budget outlays and expenditure in terms of trends and significance (as proportion of social sector expenditure and total expenditure). Thirdly, outcome (effectiveness) of expenditures is an altogether a different dimension, meaning, a high expenditure may not necessarily translate into the enhanced well-being of children.
5ICDS and ECCE are treated as interchangeable as only expenditure that relates to children in age group of 0-6 has been considered ICDS expenditure.
The figures analysed are actual expenditure (AE) for 2014-15 and 2015-16, revised estimates (RE) for 2016-17 and budget estimates (BE) for 2017-18. This period 2014-18 is marked by two significant changes in public finance in India. Firstly, the Fourteenth Finance Commission award (2015-2020) enhanced untied fiscal transfers from centre to the states from 32% to 42%. While putting more untied funds in the hands of state governments, this has drastically reduced the centre’s funding of centrally sponsored schemes (CSS). GoI had restructured the CSS, retaining some flagship schemes such as MGNREGS, SSA, NHM, ICDS and cut down funding on several others giving the states’ an option to continue to fund them. The second major change in budgeting was the removal of the classification of budget outlays into Plan and Non-Plan baskets and introducing administrative expenditure and scheme expenditure.
The Delhi government does not have a separate outlay for pre-school education. Also, it has no outlay for capital expenditure for construction and maintenance of the AWCs. The other remarkable feature of Delhi government’s child welfare budget is that a substantial amount is provided for girl child protection scheme i.e. Ladli Yojana
A-Anganwadi/ ICDS 14711.58 15666.17 17638.89 19250.85
B – Pre-school education 0.00 0.00 0.00 0.00 C - Nutrition 14761.72 14135.69 17626.00 17731.00
D – AWC infrastructure 0.00 0.00 0.00 0.00 E - Others 9948.68 10407.38 11279.03 11684.15 TOTAL 39421.98 40209.24 46543.92 48666.00
Note: Rs in lakh
While expenditure/budget on AWCs has risen consistently at about an average rate of nine percent per annum, the growth in respect of nutrition has been erratic, with reduced outlays in two out of three years.
6A longer period for analysis was not possible as Telangana which was formed in June 2014 has separate accounts only from 2014-15.
Rupees Lakh 2014-15 AE 2015-16 AE 2016-17 RE 2017-18 BE
A - Anganwadi/ ICDS 14711.58 15666.17 17638.89 19250.85
B - Pre School Education 0.00 0.00 0.00 0.00
C - Nutrition 14761.72 14135.69 17626.00 17731.00
D - Anganwadi Infrastructure 0.00 0.00 0.00 0.00
E - Others 9948.68 10407.38 112790.03 11684.15
the only
which has provided outlay separately for PSE and has a new scheme under the name ‘Malati Devi Prak Vidyalaya Paridhan Yojana’. Although the sum provided is modest at Rs. 34 crore for the entire state, recognition of PSE as an independent component of ICDS is an encouraging sign. The government of Odisha is also investing a fair amount of money in the developing of AWC
However,
the higher number of ICDS
the
we will see later,
for Odisha
Nevertheless, the trends in expenditure do not show consistent provisioning. There are sudden bursts as in the case of AWC infrastructure and other expenditure (from 2014-15 to 2015-16) and in Anganwadi/ICDS in the year 2016-17 as compared to previous year. A factor which might have influenced the sudden burst is construction of AWCs with Panchayat Raj Department. There were drops in outlays as in the case of nutrition from 2015-16 to 2016-17. About 3000 AWCs though sanctioned are yet to be established (71204 against 74154 AWCs). Only 40% AWCs have their own buildings, about 26% run in school buildings and 9% operate in rented buildings7 . The rest are
run in community buildings and other places. There is a need to upgrade the AWC infrastructure at the earliest. Despite sanctioning of AWCs on demand by GoI ( June 2014), the state failed to operationalise about 1281 AWCs due to slow progress in location of AWCs, recruitment of CDPOs and AWWs as of June 20168
ODISHA - ICDS Expenditure 120000 110000 100000 90000 80000 70000 60000 50000 40000 30000 20000 10000 0
Rupees Lakh 2014-15 AE 2015-16 AE 2016-17 RE 2017-18 BE
A - Anganwadi/ ICDS 67067.43 65133.94 109989.75 108384.95
B - Pre School Education 1696.94 1652.37 3400.00 3400.00
C - Nutrition 92584.15 104555.20 76732.45 125515.59
D - Anganwadi Infrastructure 5058.89 23613.44 20454.89 22139.53 E - Others 40.00 6487.24 6677.31 6541.99
Telangana is a new state which has been formed after the bifurcation of Andhra Pradesh in June 2014. After the initial year, it has substantially increased its overall budget outlay which is reflected in increased outlay on social sector as also on child welfare.
Table 7: ICDS Budgets and Expenditures between 2014-15 and 2017-18 for Telangana (GoI)
- Anganwadi/
- Pre school
-
- Anganwadi infrastructure
- Others
Note:
in lakh
159933.25
The government of Telangana has increased outlay on ICDS substantially over the four year period. The growth in outlay on AWCs in 2017-18 has remarkably increased by 48 percent as compared to the previous year. In nutrition too, there has been substantial increase in the 2015-16 over the previous year, but it slackened in later years.
2017-18 BE
A - Anganwadi/ ICDS 42456.53 51045.08 61748.25 89025.43
B - Pre School Education 0.00 0.00 0.00 0.00
C - Nutrition 29748.12 56337.06 68244.35 64502.82
D - Anganwadi Infrastructure 2291.88 3634.22 8542.90 4649.03
E - Others 2987.18 2766.50 5188.43 4553.53
The proportion of expenditure on social sector with respect to the total budget available for social sector is the prerogative of the state. Hence, we lot of under-expenditure in the social sector as a whole and especially in ECCE.
Social sector expenditure (SSE) as a proportion of total expenditure(TE) of the state serves as a good indicator in understanding the focus on SSE. It is clear that as compared to 2014-15, the SSE as a proportion of total expenditure over the period of 2014-2018 indicates no real increase
in Odisha and Delhi where the share remained almost static at 54% and 37/38% respectively. It showed an increase in Telangana from 31 to 34% in the same period though one has to see how much of the budget allocations really translate into expenditure. This is an important point to note as two major reports(State of Social Sector Expenditure in 2015-16 and Social Sector Expenditure of States – Pre and Post Fourteenth Finance Commission)9 had concluded that the share of social sector has increase in all states between 2014-15 and 2015-16 by comparing the actual expenditure with revised estimates. This conclusion does not hold true for these three states when the actual expenditure is considered instead of revised estimates for 2015-16 into account. Another important noteworthy point is that Delhi spends more than half of its total expenditure on social services as the total size of the expenditure itself is low as compared to population, which also gets reflected in the low per-capita ICDS expenditure that we discuss later.
One way of examining whether or not ICDS is a priority is to assess the expenditure on ICDS as a proportion of total expenditure on social sector and as a proportion of total expenditure. ICDS has emerged as a priority in Odisha when compared to other two states (Figure 6 & 7).
However, the ICDS expenditure as a proportion of SSE has seen a declining trend across all the three states during the period 2014-2017. This may be more pronounced if it is adjusted to inflation. The proportion of ICDS in SSE is higher in Odisha as compared to Telangana and Delhi but this may be due to higher population being served in the state. The decline of ICDS share in the SSE of Telangana
the increased share of SSE in total expenditure indicates that ICDS has received relatively less attention despite increased allocations to the social sector.
9Please refer to http://accountabilityindia.in/sites/all/paisafiles/Newfiles/Summary%20State%20of%20social%20sector%20spending%2015-16.pdfhttp:// niti.gov.in/writereaddata/files/document_publication/Social%20Sector%20Expenditure%20of%20States_%20Paper.pdf
The expenditure on ICDS as a proportion of total expenditure also follows the similar trend as that of its share in SSE. The proportion of ICDS expenditure to total expenditure indicates a decrease in its relative share across all the three states, if one does not take note of the budgetary allocations made for 2017-18 in Odisha. Considering the significance of ECCE and the poor condition of the ICDS centres in most states, this is not a welcome sign.
The budget for all schemes of child welfare is provided under the minor head ‘102 – Child Welfare’. They broadly relate to a) ICDS (expenditure on AWW i.e. their wages / honoraria and construction and maintenance of AWCs); b) nutrition (of children under the SNP and nutrition for pregnant and lactating mothers); and c) other child protection schemes such as ‘Beti Bachao Beti Padhao’, Ladli Yojana, etc. which relate to children and not necessarily those in 0-6 years age group. Accordingly, the budgets for all the three states have been grouped under five heads and analysed to see the respective shares in different states.
It is seen (Figure 8 below) that ICDS and nutrition take major share of expenditure in all the three states. Two exceptions to note are: a) only Odisha has a separate allotment and scheme for PSE; and b) Delhi spends considerable amount on the child protection society, Bal Sadan and other child welfare schemes (all grouped under ‘Others’ in Figure 8) and has no budget for construction/repair of AWCs. This might be because of the fact that the AWCs in Delhi runs in rented or community donated spaces.
Another way to compare would be to examine the average outlay on ICDS during 2014-17 per child expenditure. Delhi is spending a higher per child amount per annum as compared to Odisha and Telangana. The higher rent paid for running AWCs may have added to the higher expenditure in the state of Delhi10 whereas the higher salaries in Telangana have contributed in making the per child ICDS expenses in the state higher than Odisha. Per child expenditure in Odisha would have been further lowered if the expenses were not as high on infrastructure. Despite spending more than half of its total expenditure on the social sector, Odisha has the lowest per-child ICDS expenditure, which, as pointed out earlier, is reflective of relatively smaller size of its economy. This also means that different features are driving the per child ICDS costs in different states with varying implications for the quality of service delivery.
In conclusion, what emerges from the analysis of budgets of the three states and the GoI is that there is no consistency in provisioning. While it is understandable that in case of infrastructure there could be different levels of outlays in different years depending upon the requirement of new infrastructure, the same cannot be said to hold true for pre-school education and nutrition expenditure in ICDS, which are recurrent in nature. The erratic nature of spending on these heads is difficult to explain. The visits to AWCs in the state, though very limited in terms of number, suggested the highest level of satisfaction among different stakeholders from the services in Telangana, indicating that expenditure on full recruitment, high salaries, training and motivation of human resources coupled with attention to monitoring by, and accountability to, diverse stakeholders is perhaps more important in terms of ensuring the quality of services than investing in infrastructure alone.
Further, differences in components such as staff salary, which ranges from Rs. 4,000 in Odisha to Rs. 10,500 per month in Telangana are bound to impact the functioning of the AWCs and the quality of teaching as it is bound to affect the motivational levels of the workers. Aside from fund allocations, various initiatives by state governments such as services for pregnant and lactating women also impact the overall quality and possibly the child development outcomes in these states. These differences, as well as other differences such as the introduction of community management of malnutrition in Odisha, differences in timings for PSE across the states and the lack of adequate finances (as in the case of Odisha), need to be comparatively analysed through more focused studies in order to fully understand the impact of these differences on enrolment and child outcomes.
1 Supplementary nutrition programme
Per head ration is 6 INR for normal children (7 months to 6 years), per head ration is 9 INR for severely malnourished children (7 months to 6 years).
Point of implementation SHGs (E-payment for THR to be done into the joint payments of ICDS and SHG)
WCD
SHGs (Stri Shakti) and 8 NPOs were selected by WCD (from 2006) and later 23 NPOs for preparation and distribution of SNP (from 2014). The NPOs are regularly monitored and given directions for ensuring safety and hygienic parameters in the kitchens being run by their SHGs in terms of infrastructure, raw material, safe drinking water being used for preparation of supplementary food, and also during the transportation of the food at the doorstep of the AWCs.
2 Early child education Nua Arunima Conducting Pre-School Education with children between 3-6 years as per pre-school time table using Pre-School Kit
3 Nutrition and health (0-6 years) Operation Plan (20092013) for 15 “High Burden” districts of Odisha to reduce malnutrition over 4 years among children.
Food model for THR for 7 months – 3 years children;
Food Model for spot feeding of 3 – 6 years children; Food Model for Additional Supplementation for SUW/SAM/MAM Children of 3– 6 years
Weaning food for children up to 1 year, morning snacks and hot cooked meals.
The Mother Non Profit Organizations/SHG concerned supply the required quantity of cooked food/weaning food based on the indent of the concerned Anganwadi worker. Each SHG has its own separate kitchen to prepare hot cooked meals/morning snacks for the target beneficiaries in their project
Pustikar Diwas on 15th of every month in the PHC/CMC, for treatment of severely undernourished children (0-6 years) referred by AWW/ANM.
Infant and Young Child Feeding (Surakhya) to reduce child mortality below 2 years of age. Community based management of acute malnutrition in areas where at least 10% of children under 5 years of age are moderately malnourished and chances of aggravating, with the involvement of the community.
NHD-I & NHD-II Immunization, Health checkups, Referral services
4 Pregnant and Lactating Mothers THR Aarogya Lakshmi (One Full Meal)
Village level institutions Jaanch Committee/ Mothers’ Committee Mothers’ Committee
Remuneration of AWC staff AWW- Rs. 4,000 per month
AWH- Rs. 2,000 per month
Mini AWW- Rs. 200 per month
Rs. 4,200 to Rs 7,000 for teachers and Rs. 2,200 to Rs. 4,500 for helpers in February 2015.
Hiked from Rs. 7,000 to Rs. 10,500 in 2017.11
Timings of Preschool
A.M. to
P.M.
Committee
AWW (Rs. 2700 from GOI and Rs. 2300 from Delhi)- Rs. 5000 per month
AWH (Rs. 1,350 from GOI and Rs. 1,150 from Delhi)- Rs. 2500 INR per month
A.M. to 4.00 P.M. 9:30 A.M. to 2:00 P.M.
Community management of malnutrition to be extended to all 30 districts, after successful piloting in 2 districts of Kandhamal and Bolangir (June 2017)
Children suffering from acute malnutrition: 4300.
Nua Arunima: Preschool learning and training kit developed by WCD containing a handbook for the AWW, 2 age appropriate books for children, 12 theme based training CDs (one for each month), audio CD with 37 audio songs; in 10 tribal languages in 25000 AWCs in tribal areas. (2013)
State specific Conditional CT maternity benefit scheme - Mamata for pregnant and lactating mothers (for the first two live births) since 2011. Rs.1,500 after 6 months of pregnancy and Rs. 1,500 after 3 months of the child is provided.
Aarogya Lakshmi in 2013 In 2014, it was decided to convert 30 AWCs into AW-cum-creche for taking care of children of working women. Additional Worker has to be provided in these AWC cum crèche. Out of 30, 23 AWC cum crèche have been started.
Hike in salaries of AWWs in 2015 & 2017.
Enhancement of rental norms for better infrastructure of AWCs. (2014)
Redefinition of roles and responsibilities of AWC staff in 201512
(2014) Aadhar enrolment for all children (0-5 years)
Grants in aid given to State Government to construct AWC buildings under MNREGA in convergence with ICDS (2015-16)13
Constituting District Level Monitoring and Review Committee in 2012 to review overall progress in implementation14
Decentralisation of ICDS scheme from ICDS Headquarters to District WCD offices.
Geo mapping of AWCs Rapid Reporting System started with online monthly & annual progress reports wef March 2015 for all functional AWCs.
Continued on next page
12http://www.teachersbadi.in/2015/05/tsgo14-telangana-anganwadi-workers-anganwadi-helpers-roles-responsibilities-honorariumpayment.html
13http://icds-wcd.nic.in/icds/icdsimg/Funds%20released%20for%20Construction%20of%20AWC.pdf
14http://www.wcddel.in/pdf/MoitoringCommitteesICDS.pdf
9 Fund Allocation The amount of funds released under ICDS scheme for Odisha was Rs. 65643.69 lakhs for the year 2015-16 (4.25% of All India). The state government is likely to lose around Rs 800 crore as Central share under Integrated Child Development Services (ICDS) programme, aimed at early childhood development, as the Union government has slashed the budgetary allocation by more than 54 per cent for the ensuing financial year.
Fund is allocated following the 60:40 ratio between centre and State15. For 2016-17, the amount released to Telangana was Rs. 475.55 lakhs for continuation of ICDS.
Funds allocated as per 60:40 ratio between centre and state according to latest directives by NitiAayog for 2017-18 (despite it being borne 100% by the centre for all other Union Territories except Pudduchery)16
This section presents an analysis of various models of ECCE across the three states of Delhi, Odisha and Telangana, together with an analysis of their costs and revenues. The report is split into two sections: cost estimations and resource mobilisation. The first section presents a conceptual and analytical framework for a comprehensive analysis of the costs of various ECCE models in the country to arrive at alternative cost models. The second section highlights the range of funding sources available within these models and the various ways in which the raised resources are allocated for different expenditure heads.
The method for undertaking a comparative analysis of various ECCE models involved two steps: first, developing estimations of the total annual cost by taking monetary estimates of monetised and non-monetised processes and annualising capital investments taking into account opportunity costs for assets like land or buildings. A second step involved estimating capital expenditure and annual recurrent costs that do not include any nonmonetised/opportunity cost. Similarly, an analysis of resources has been undertaken by first categorising the various kinds of resources drawn on by organisations followed by a cost-versus-resource analysis for each model.
Information regarding costs and resources were gathered using both primary and secondary sources. Primary sources included interaction with various stakeholders in the field using multiple tools like Focus Group Discussions, interviews, and observations. The secondary sources mainly included balance sheets and annual reports as provided by the respective organizations. (Find calculations in Annexure 4).
Information regarding costs and resources were gathered using both primary and secondary sources. Primary sources included interaction with various stakeholders in the field using multiple tools like Focus Group Discussions, interviews, and observations.
Altogether, the section provides insights into emerging lessons for funding of ECCE programmes in the country and advocates the need for a diverse set of cost models for diverse target groups and locations.
TABLE 1: Base framework of process/component-cost relationship
TABLE 2: Parameters used in for calculation of rental value
TABLE 3: Abbreviation, model, type and management
TABLE 4: Cost Estimates for identified models (by cost heads)
TABLE 5: ECCE centre instructor’s salaries, qualifications and teacher-pupil ratios
TABLE 6: Space, physical infrastructure and physical facilities in ECCE centres
TABLE 7: Capital costs Incurred by the models (per centre costs in rupees)
TABLE 8: Annual recurrent costs incurred (per centre costs in rupees)
TABLE 9: Summary of estimated costs and revenue
TABLE 10: Rough snapshot of revenue sources and expenditure heads
FIGURE 1: Per child unit cost 109
FIGURE 2: Model-wise cost component share breakup
FIGURE 3: Annual per centre cost
FIGURE 4: UPSC revenue sources (from Annual Report 2015-16)
FIGURE 5: CUSP revenue sources (from Annual Report 2015-16)
FIGURE 6: Donation sources (from Annual Report 2015-16)
FIGURE 7: CBCDC revenue sources (calculated from field notes)
FIGURE 8: UBM revenue sources (from Annual Report 2015-16)
FIGURE 9: UCBM revenue sources
FIGURE 10: SSUP revenue sources
FIGURE 11: LUPS revenue sources (as provided in P&L accounts of 2015-16)
FIGURE 12: UPPS revenue sources 130
As mentioned earlier, this is an indicative exercise to understand different kinds of costing that exists in the ECCE sector, argue for provisions with more realistic and differentiated costing norms and, if necessary even for diverse models, for publicly funded programmes. It is very clear from the analysis that the needs of various groups and locations are diverse and a unified and homogenous cost approach does not help. This analysis uses the costs of various models following different approaches and providing different kinds of services in varied locations to diverse target groups to understand the range that exists and to be able to make suggestions that allow for such in-built flexibility in contextually responsive ECCE models. In this process, these models themselves become representatives of diverse practices rather than one unique model. The name of the organisations whose costs and revenues are being analysed are kept anonymous. These have been referred to as a model that represents the approach and location (e.g., urban independent ECCE centre, rural pre-school and so on).
It is important to understand that the interventions are usually conceived or understood better in terms of either processes (what would happen there: teaching, playing, sleeping, eating, training, monitoring, etc.) or components (what is needed there: physical space, facilities, support materials, curriculum, training facilities and materials; human resources - teacher, helper, manager, supervisor etc.), and not in terms of what are usually known as cost heads (e.g., salary, travel, rent, etc.). Therefore, it makes much more sense to understand the processes and components of the programme first followed by an understanding of the expenses involved and resources required. Some of these costs and resources may not be in the shape of monetary figures in certain cases (e.g., parents volunteering to teach at least once every week). These costs then need to be monetised using suitable assumptions to get an understanding of the entire cost.
At the first stage of cost estimates, we have attempted to estimate ‘total’ annual per centre and per child costs for providing ECCE services taking both capital and recurrent costs into account.
Therefore, the first step was to make a matrix of the components/processes on one side and cost heads on the other and map the two in a matrix. Table 1 presents our framework for the cost estimates carried out for different ECCE models. This was followed by adapting the matrix for each of the models separately, taking the model-specific details into account. Annexure 2 provides the model-specific matrices.
The next step was to estimate the costs and revenue of respective models. We have undertaken three exercises for all models:
i. estimating the total annual costs by taking monetary estimates of non-monetised processes/ contributions and by annualising the capital investments, including opportunity costs, wherever suitable.
ii. estimating the capital expenditure and annual recurrent expenses; this does not include any opportunity cost.
iii. estimating the annual revenue taking diverse sources into account; this does not include non-monetised inputs
This exercise is followed by a discussion of the implications of these cost patterns for public policy and finance. It is important to mention here that the cost estimation uses various reasonable assumptions for both monetisation and annualisation exercises and therefore there could be some minor deviation between the estimates and real costs. This could also happen because the cost and revenue related information are sometimes collected through interviews and understanding of the processes of respective models rather than the account books, which were sometimes not accessible and which also sometimes did not include all the elements of the model that have cost implications. However, this does not have any sig nificant implication for either comparative analysis or in terms of deriving inferences for the policy and costing of public programmes.
Finally, before presenting our cost analysis, it is also important to state that this exercise in trinsically builds in questions of quality within the analysis. However, this analysis of quality is different from what quality studies usually measure – that is, the study does not measure the impact of programmes on children, as this was not possible due to time constraints. Neither does the analysis identify which models seem to be the most appropriate or best to under take ECCE. This we argue is not possible to undertake as models are very different in their size, scales, approaches, intentions, and target population. Instead, quality has been intrinsi cally tied to the question of cost – to understand what are the costs of certain practices (that
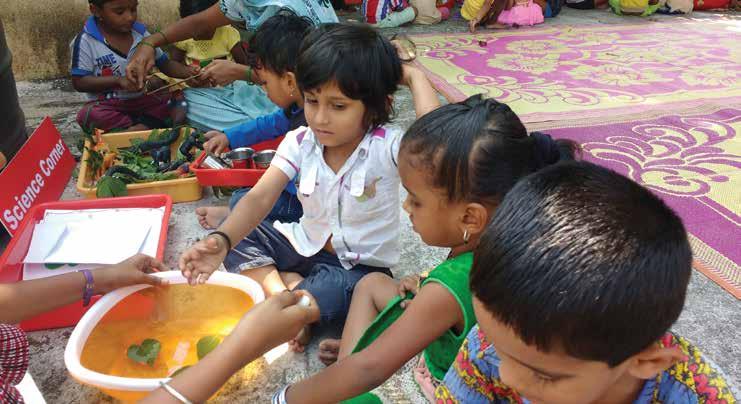
are already identified within literature as ‘good practices’ or as desirable) included within models, and how does this impact the sustainability and financing of the model, who bears the burden of these costs important to bring in quality.
At the first stage of cost estimates, we have attempted to estimate ‘total’ annual per centre and per child costs for providing ECCE services taking both capital and recurrent costs into account. As mentioned earlier, this is to ensure that per child or per centre costs are not underestimates and include capital and non-monetised costs as well. However, that does not mean that these are the annual running costs – annual per-capita running expenditure may be lesser than this as that often does not take initial capital investments into account. In other words, this exercise is to estimate the actual economic costs and not the expenditure alone. Both normative and statistical analytical
TABLE 1: Base framework of process/component – cost relationship
Processes / components
Cost heads Rent / land –building
Capital goods facilities (furniture/ Salary
Materials (teaching learning) Travel Misc. others
Teaching Building/ Desks, etc. (if relevant for the approach)
Consumable materials (physical) and nutrition and auxiliary facilities
Teaching learning materialsRooms
Teachers salary
Playing playground Play materials Sleeping Space* Bedding Food items
Eating Space* Health
Auxiliary services Teacher training** Space* Trainers remuneration
Monitoring Salary / remuneration
Training materials
Travel of teachers / trainers
Travel of teachers / trainers
Travel to headquarters, etc. Community mobilisation** Salary Food items
Managing Space** Furniture Salary
Training materials Travel to workshop place * if separate from teaching-learning area **depending on the approach the model follows
methods have been used for analysing data for costing exercises and for calculating per centre/per child cost. Most of the information on cost is collected through the use of multiple tools: management questionnaires, FGDs, interviews and income and expenditure sheets . It is also assumed that capital asset costs are at current prices.
In general, an estimation of annual value of capital cost is difficult because the capital is paid in one or two years’ time, but the yields are spread over a much longer period. So, if we take the entire capital expenses, it would inflate the cost of the model in the initial period. If the assets are rented, then the annual rent can be used to represent the value of the capital resource used during the year. However, in our analysis of some models, capital assets like land and building are not rented and therefore some estimates are required for the annual value of used capital. To resolve this, we estimated imputed rent which measures the annual value of the amount of capital used up each year and used this to arrive at total annual costs of respective models.
For calculating rental value of capital investments, rate of depreciation and interest rates are estimated first. The interest rates have been used to estimate the opportunity cost, which refers to the alternative possible use of the asset. In many cases, assets like land and building are pre-existing and donated by the community, government, or someone else but these buildings and land may have had alternative usage and the decision to build or use it for a particular purpose may mean the sacrifice of an opportunity to build or use it for something else. In such cases, we have used interest rate plus rate of deprecation for calculating the rent value of assets (land and building). We have used interest rates that could have been earned through alternative usage of the same asset to be equivalent to bank rate of Reserve Bank of India on first class bills of exchange (6% per annum, 2017); based on assumption that this is modest and reasonable. For assets that have been created just for that purpose, only deprecation rate is considered for calculating the rental value of the assets as one may already be paying interest on loans taken for that purpose. The rate of depreciation is a much-disputed item. Depreciation depends upon the life span of the asset. For the purposes of this study, the working life of a permanent and semi-permanent building is assumed to be 50 years and that of the computer and other equipment five years. The life of all other assets is assumed to be 10 years. For calculating the rates of depreciation, the straight line method is used which assumes equal rates for each year. This may be a simple assumption and the reality may be a little different but it suits the needs of the present analysis.
The recurring costs in this analysis consists of the sum total of six different components viz, i) Infrastructure, space and resources (either given or imputed, as explained above); ii) Salaries
2: Parameters used in for calculation of rental value
(Teachers/Caregivers/ Staff); iii) Nutrition and auxiliary services; iv) Learning material and curriculum development; v) Teacher/Other trainings vi) Parent/Community-centred practices. After estimating the annual current expenditure, per centre/per child, the annual cost has been arrived at by dividing the total cost of the programme by total number of centres/children under that particular model. Monetisation of some non-monetised practices makes reasonable assumptions, listed in Annexure 3. For estimating per centre or per child cost for composite institutions that provide services for nonECCE age groups or classes, each institution is divided into the number of classes it offers and for the costs of the components that are used by all but no clear divisions are available, the annual amount for that component is divided by the number of classes first. Then that amount is multiplied by the number of classes that the ECCE services account for, as explained below. For instance, if the centre caters to students from pre-primary to primary, then it means there are eight classes in the centre (three for pre-primary and five for primary), and the annual cost of that component would be first divided by eight and then multiplied by three to arrive at the annual cost for the ECCE stage.
For calculating ECCE centre/pre-school cost:
Total Cost of Recurring Component (including imputed Rent)
Total No. of Classes in the Centre/School
X Total No. of Classes Under ECCE centre
Annexure 3 provides the assumptions and estimation of each component of all the models.
This section presents a comparative analysis of nine non-ICDS models that we studied. Table 3 describes the models, their locations, management and focus. The abbreviations given in the table
Type Management
Urban programme involving community stakeholders Child and communityfocused NGO
(1) Composite urban school with preprimary sections Child-focused NGO
(2) Composite urban school with preprimary
Rural community-based child development
Urban balwadi
crèche
University supported urban pre-school
attached to a university (funded by the state government through the university)
pre-school+
Child-focused NGO
and communityfocused NGO
and parent-focused
and parent-focused
are used henceforth to refer to the respective models. Before going to the cost analysis, we briefly present here the major features of the models. This would help us in viewing the cost analysis from the perspective of the context in which it is operational and the approach it follows.
The NGO is registered as a society under the Societies Registration Act 1860. It started in Delhi in 1969 at a construction site at Rajghat and spread gradually to other such sites in Delhi as well as in Mumbai and Pune. Recently, it has also been identified as a technical resource by the MWCD under the restructured and strengthened ICDS programme to assist with attaining the specific objective of converting five per cent of all AWCs into Anganwadi cum crèche centres. The larger objective of the organisation is to provide good quality day care services based on the basic principles of child development and to cater to working women from some of the most marginalised communities who do not receive these benefits from any other source.
Each centre run by them is divided into three sections: crèche for 0-3 year olds, balwadi for 4-5 year olds and bridge courses for 6-12 year olds. There were a total of around 70 children enrolled.
While the crèche workers were Class V pass and the balwadi and bridge course workers were Class XII pass, the process of training is given more emphasis rather than qualifications. For higher positions, experience, knowledge and passion for the field are accorded greater importance.
The norms with respect to the crèche layout are fixed with respect to accessibility, hygiene and cleanliness, structure of building and the number as well as size of the rooms, with centres aiming to provide a room each for the crèche, balwadi, bridge course, along with toilets, a kitchen, a storage room, cleaning area and open space. The timings of the centre are from nine am to five pm for six days a week. It was observed that while the crèche room was 25 ft X 25ft, the rooms for the balwadi and bridge course were smaller – around 12 ft x 12 ft, with one window, one fan, one tube-light and a cooler. There was not much room for designated activity corners.
Both the crèche and balwadi had colourful wall displays made by teachers and some work by students. The learning materials at the balwadi included a sandpit, plastic blocks, puzzles, crayons, paint, paper, coloured paper, picture cards, mirror, strainer, strings, beaded strings, slate, chalks, blackboard, picture blocks, stones, wooden pieces, plastic balls, cloth balls, skipping rope, finger puppets, picture posters, printed posters, stuffed dolls, hats, pieces of cardboard to be strung, books (25-30 books in Hindi), worksheets, chart paper, combs and hair oil. The learning materials in the crèche included plastic toys, plastic cars, plastic rings, plastic slide, mini plastic scooters, dhols, picture posters, printed posters, balls, picture books, paper, crayons, chart paper etc. The non-curricular material included bibs, handkerchiefs, cradles, towels and cleaning equipment.
Only Hindi is used for teaching as well as for all interaction at all centres and the subjects taught are Hindi and Mathematics. There are often children from non-Hindi speaking states. According to
RIGHT START INVESTING IN EARLY YEARS OF EDUCATION
the teacher, they manage to interact with them through a combination of gestures, signs and basic words and since the children are young, they are able to learn Hindi in a short span of time.
The focus areas in crèches are care and nurturing along with conducting activities for developing fine and gross motor skills, free play, songs and rhymes. The balwadi follows a slightly more structured curriculum with activities that focus on developing pre-reading, pre-writing and number concepts. The curriculum is structured according to monthly themes and executed through a detailed daily schedule planned ahead. The centre maintains registers – the pathykram (syllabus) for the balwadi and the khelpitara (activity/games guide) for the crèche which has the monthly themes along with the daily lesson plan with the details of each activity and time slots allotted to them. There is time allotted to discussion, story-telling, poetry recitation, physical exercise, colouring, free play and meals.
For children with special needs, the NGO’s field team assists parents by way of providing references to the appropriate doctor/hospital and also through other forms of moral support, encouragement and practical help. A quarterly assessment of every child is carried out by the balwadi worker with the help of a checklist to record improvement in Hindi and Mathematics skills.
Health and nutrition form an integral part of this day-care model. For the health component, efforts are made to link the centre with a local PHC which provides nutrient supplements, de-worming tablets and immunisation, as per government rules/schemes, and one doctor per centre is hired on a voluntary basis to provide regular health checkups. Nutrition is also provided at the centre through two meals and a snack for every child above the age of six months. Two hot cooked meals are provided – rava/sooji kheer or halwa (similar to broken wheat porridge) as breakfast and khichdi (cooked rice and dal) with seasonal vegetables for lunch, along with an evening snack of sprouts, nuts or biscuits. Each child is to get 500 calories and 12 grams of proteins per day. For children identified as malnourished, an egg and a banana are added to the daily diet. For severely malnourished children, a meal prepared with a healthy grain mixture consisting of rice, wheat and chickpea is provided at frequent intervals through the day.
Only Hindi is used for teaching and all interaction at all centres, while the subjects taught are Hindi and Mathematics. There are often children from non-Hindi speaking states.
The internal monitoring is carried out through the organisational hierarchy and by ensuring that all records and registers are maintained for attendance, financials, stock, nutrition, health, education, daily plans and community meetings and that each of these records is monitored and supervised. To strengthen the MIS, in 2016, enterprise resource planning (ERP) was launched and all transactions having fiscal implications were integrated. The purpose behind launching ERP is to have real time data from the field for effective implementation and also to use the data for research and advocacy. A new performance management system (PMS) was also introduced which utilises the balanced scorecard method since it provides a more transparent assessment procedure for employees.
Parents of the children attending the day care centre seemed satisfied with its functioning. The positive attributes mentioned by them were: the fact that no user fee was charged, that the centre provided a safe space for children for the entire day while the parents were out at work and that three good meals were provided to their children. The organization also works to mobilise the community around issues of ECCE, hygiene, cleanliness and financial management.
This NGO-run centre has two kinds of models for ECCE – formal schools and learning centres for children from the economically disadvantaged sections of the society. Since most of the centres are located in industrial areas, the target population in this case also includes families of migrant labourers and slum dwellers. The organisation has centres in Delhi, Uttarakhand, Uttar Pradesh and Haryana. The organisation began as a charity institution in 1977-79 to ‘engage in a cause-related activity relevant to their faith but has now moved to a user fee-based model while also heavily relying on donations.
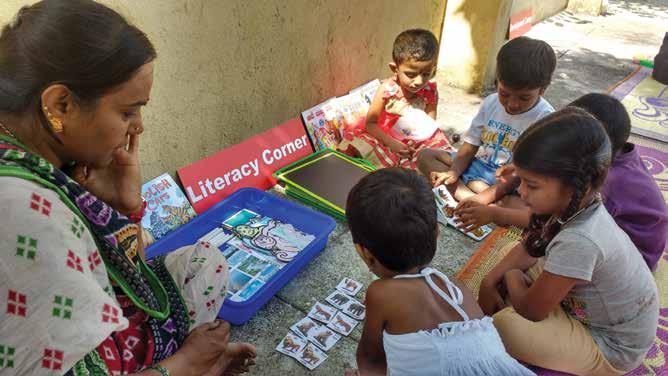
At present, there are two formal schools and 11 learning centres, the latter having been converted from formal schools after the RTE came into effect as they cannot comply with all the prescribed norms. The formal schools have classes from LKG up to Class X and the learning centres have classes from LKG till Class II.
The pre-school children are divided into two groups who sit in two separate classrooms: UKG and LKG on the basis of their age groups. Children between three and four years of age are in LKG and children between four and five years of age are in UKG. Each age group is further divided into two sections ‘A’ and ‘B’ where a norm of 35 children per classroom is maintained.
With regards to infrastructure, all the classrooms were spacious, well-lit and ventilated with interactive charts and learning materials put up on the walls, and bulletin boards.
The classrooms have one blackboard and one smartboard. The smartboards (projector plus remote) have a pre-designed package of poems, rhymes and games as a creative technology-based TLM
for UKG and LKG students developed by Educomp. A community library (‘community’ because it is run by volunteers and in-kind donations from individuals) is located in the learning centre that was observed for the study, with a large collection of toys, games and books. The library also has interactive material such as flash cards, building blocks, shapes, charts etc., that are often brought to classrooms to be used as teaching-learning resources. No timetable is displayed on the walls but the daily schedule, as explained by the teachers, includes diverse activities. One UKG teacher shared, “We start with something light like colouring for LKG, and sounds and the alphabet for UKG. We then move on to conceptual things such as dots and lines and shapes and sizes. After lunch, we try to engage them with interactive tools such as games, puzzles, blocks, cards, etc. because they tend to feel sleepy after lunch.” The biggest challenge as shared by the teachers was to keep the performance of all students at par. Since there are some age-inappropriate enrolments in classes and few slow learners, some students tend to lag behind. The teachers try to spend extra time with these children or stop them in corridors and spend some time talking with them to improve their conversational skills. The teachers personally do not prefer books but parents do not believe that something substantial is being taught without the use of books and hence they are forced to adopt books and assessment systems. The older teachers also use lesser TLM from the library as opposed to the younger teachers because they ‘don’t feel the need to do so often.’
The centres run by this organisation are embedded within the community since its inception in the 80s. A lot of community mobilisation was done initially, the need for which tapered off gradually because most families in the community were aware of the school. It was noted in a number of cases that parents chose this school over other schools in the vicinity because their children did not get admission into the private schools. Hence CUSP appeared to be their second choice with the private schools being the first.
The CBCDC model was established by the parent organisation in 1984 with the aim of empowering communities in the rural areas of Odisha through education and skill development. With ICDS being unable to reach out to remote pockets of Odisha, the children in the tribal pockets were unable to access any form of ECCE services. Given that the ICDS centres used the medium of the state language, the children from the tribal communities felt alienated, due to regional variations in mother tongue languages. Community-based child development centres came into picture with the aim to meet this challenge by setting up a two-fold model of home-based care and centre-based care in the tribal villages. It is a community-focused model, in the operational control of a nongovernmental organisation. The intervention started with 350 villages in 2007, with the international funding partner but is currently physically present in 32 villages, with most centres being gradually handed over to the government.
The number of enrolled students in the centre was 20, with equal number of boys and girls. The organisation practised the pupil-teacher ratio of 25-18:1, across all the 32 centres spread across three districts. Inside the class, the students are grouped age-wise, i.e. three and four year olds and four to six year olds.
The centre functioned as an independent establishment, out of a room of dimensions 20*22 ft (440 sq. ft.), with a compound wall and play area (600 sq. ft.), two windows, two doors, and a single light bulb. Although the centre was well-maintained and secure, it was inaccessible by road (5 km. stretch of mud road).
Focusing primarily on indigenous communities and their empowerment, one of the pioneering interventions taken up was the introduction of the mother tongue-based, multilingual early childhood education programme and the construction of a contextualised pedagogic framework with help from funders. As the senior manager of the CBCDC programme informed us CBCDC “created a team who visited the communities, collected local songs/stories/riddles and took photos of local vegetables/animals/fruits, etc. On the basis of this, we developed story books, riddles, play cards and introduced them into the curriculum.”2
The centre was equipped with various wall displays and play materials, indoors and outdoors. The centre appeared to have all the resources required to address a child’s cultural, social, emotional development as well as cognitive and thinking skills coupled with classroom activities such as storytelling, plays, dance and other forms of art. The play materials available in the centre are shape cards, puzzles, picture cards, storytelling cards, colouring books, crayons, etc. A number of locally made materials are also being used such as clay, mud, newspaper, sticks, pebbles and wire that have been painted and curated with the help of the organisation.
The community-based centre has been constructed with the support of the community. The centre is equipped with locally available play materials, kitchen gardens, classroom and toilets. All teachinglearning materials are designed by a special team trained by the organisation and revised every two years. These materials are designed in a manner that is locally embedded, so that the child is able to connect with the immediate surroundings.
For children in the age group of 3-4 years, the focus is on their grasp of the mother tongue. At the same time, for children between four and five years, the focus is on Odiya as well as the mother tongue. Some basic words are also taught in English, such as the parts of a human body, names of animals, birds, fruits, etc. This procedure is mainly to assist the children in getting acquainted with these languages prior to primary school. The progress of the child is tracked through quarterly assessments and report cards, where all activities done by the child are recorded.
The interaction between teacher and the children were well-coordinated. The teacher maintains a children’s activity board that showcases the activities taken up by them. For children with special needs, the teacher is advised to devote extra attention to the child while the organisation tries to facilitate the linkages of various government schemes with the beneficiaries. All the students were able to confidently recite the songs and rhymes, and were quick to follow the instructions given by the teacher, such as standing in a circle or a straight line.
Home-based care focuses on children in the age group of 0-2 years, where the teachers selected from within the community were trained and oriented in neonatal and postnatal care, child and mother immunisation, early stimulations for cognitive development etc.
As said by a Senior Manager of the CBCDC programme on 06.08.2017 in Berhampur.
The centre has a nap time for the children and nutrition is provided (pulses, rice, eggs and sattu), with rations partially mobilised from the government under ICDS as well as from community contributions.
A supervisor is appointed by the organisation from nearby communities and put in charge of four centres. S/he is responsible for the teacher’s performance. A monitoring committee comprised of community members and other stakeholders, such as the panchayat members, act as a local supervisory body. The teacher, selected from within the community, is supported by a community member on a rotation basis for non-teaching activities.
Community members are involved in monthly parent-teacher meetings, similar to the fixed monthly ECCE day at AWCs, as well as regular workshops organised to encourage community ownership of the intervention. The community pays a minimal amount of user fees, monthly as well as annually, which is used for maintenance and celebration of events in the centre. The community also contributes in terms of labour, food grains and space for conducting classes.
From conversation with the teacher, it seemed that because of a lack of comparison with other ECCE services, lack of access to ICDS centres and low education levels in the community, the parents might not be fully aware of the importance of the child’s progress in the centre and are concerned mostly about the child’s admission in the government schools. Although while conducting focus group discussions with the parents, the parents expressed their contentment about the differences noticed in the child’s behaviour when the child was directly sent to primary school earlier as against when the child experienced CBCDC as a stepping stone before primary school. The parents also spoke about how they would like to improve the infrastructure in the centres and improve supply of drinking water and food grains.
The UBM and the UCM models are being implemented by a non-governmental organisation working in the urban spaces of Bhubaneshwar for advancing opportunities available to marginalised children through education and vocational training.
The UBM Model comprises of balwadi centres (play schools) for children between three and six years, with a child- and parent-focused framework. The centre is a well-established ECCE centre, initiated a decade ago.
The communitybased centre has been constructed with the support of the community. The centre is equipped with locally available play materials, kitchen gardens, classroom and toilets.
Due to a reduction in the flow of funds from donors, several aspects of the model were changed within the short span of a year, such as discontinuing the provision of meals, lowering of teachers’ salaries based on user fees provided by parents and lesser overall maintenance of the centres. The parent organisation makes a one-time investment per centre for procurement of play materials annually, other than which all other expenses are borne through community contributions and donations.
The students in the centre are grouped age-wise i.e. three and four year olds and four to six year olds. The initial plan of the parent organisation was to accommodate 300 children across 12 centres.
But due to the introduction of user fees as a very recent step, the number of children has remained at 240. Across the 12 centres, the pupil teacher ratio (PTR) norm maintained is 15:1.
In terms of space and infrastructure, the centre was an independent shed within community premises, 25 x 18 sq. ft. It had a single fan and light bulb installed and no compound wall. However, the centre had an attached playground. The gate to the playground seemed to be locked even during the day as there were reports of misuse by some community members. In the UBM centre, the electricity charges are taken care of by the community while annual renovation is undertaken by the parent organisation.
The curriculum followed in the UBM is the standard set of books followed in Odisha for all pre-school children. The play materials, indoors and outdoors, are mostly provided by the organisation from their other education programmes. The organisation uses ICDS guidelines and consultations by their in-house staff on the pedagogy followed in the UBM centres. The centre used exercise books3, charts, playing cards and counting material as curricula.
Challenges faced increased over the last one year given the change from free education to user fees. Being an urban setting, parents have the capacity to pay relatively higher user fees for the maintenance of the teachers and the centres. Thus, in a way, the teachers become directly answerable to the community for their performance, which gets reviewed during parent-teacher meetings held monthly.
In conversation with parents, it became clear that the rationale for choosing the UBM was the poor functioning of the AWCs in the area, the discrimination among children on the basis of class and teacher incompetence resulting in lower levels of learning. One of the criteria used by parents to measure the progress of the child was the grasp over the English language, which they believe was a main outcome of the UBM. Apart from the user fees, a number of in-pocket expenses are also incurred by parents, such as on stationery. An interesting fact noted was the prevalence of private tutoring by the UBM teachers after school hours since parents felt the need to have a more focused learning for the children (in groups of three), apart from attending the centre regularly. Similarly, it was also noted that in the previous months, there had been dropouts due to children shifting to private schools. With no monitoring of the child’s progress at school, the child’s learning levels were unknown to the parents.
The urban crèche model (UCM) is a day care centre for the children of working and ailing mothers in the slums. The UCM functions under a partnership between the State Welfare Board (RGNCS) and the parent organisation based on a 90:10 funding ratio respectively. Due to inconsistencies in transfer of grants from the state, the parent organisation has been unable to make necessary improvements in the UCM.
Children are divided into two age groups -six months to three year olds and four to six year olds, with a total of 24 children. The PTR followed is 25:1, as specified in State Welfare Board norms.
The centre is spread over 375 sq. ft. and functions out of a single classroom with classes conducted in a circular seating arrangement on mats. It is established as an independent house (a tin shed), with the same classroom space being used for storage as well as a kitchen and a small porch. There is no compound.
The UCM curriculum is developed in-house in consultation with experts following the ECCE guidelines on activity-based learning. Although the centre had a number of displays and charts, they were considerably faded and unkempt and not visually stimulating.

The activities carried out in the centre as per the timetable include sessions of hygiene, prayer time, counting, learning the alphabet, storytelling, rhymes and home visits. In conversation with teachers, the UCM seemed to be in need of improvements in a number of areas such as dearth of play materials, updating TLM, capacity-building of teaching staff, better maintenance of the AWC, need for growth monitoring and improved remuneration for the teaching staff.
As per the RGNCS norms, nutrition, frequent health check-ups and home visits are provided.
For monitoring, a government-appointed supervisor is in charge of the functioning of the crèche. However, it was felt by the teachers that stronger supervision was required.
The classroom didn’t appear to be child-friendly in nature due to lack of space and poor infrastructure which reverberated in discussions held with parents where their concerns included the need for better quality and quantity of meals, provision of improved play and learning materials.
This is a well-established, stand-alone lab school which started 20 years ago and is a part of a state government university. It mostly caters to middle income groups like salespersons, service engineers and managers in the hotel industry. The staff of the university in charge of running this school has also provided support and training to ICDS.
The pre-school has a crèche, two nursery classes and one LKG and one UKG. There are seven children in the crèche currently, 26 students in one of the nursery classes, 27 in LKG and 15 in UKG. However, each class has the capacity to accommodate 25 children, and the PTR of 25:1 is normally maintained.
There are a total of five teachers to manage the pre-school who are supervised by an assistant professor of the university. While teachers varied in their qualifications, all of them had completed a self-paid pre-primary training certificate programme conducted by the university, which is a mandatory requirement for appointment. The teachers receive an 11-month contract which has to be renewed every academic year with the university and are not salaried staff of the university. Teachers are also assisted in making of TLM and lessons by students of the university.
In terms of infrastructure, the pre-school has no constraints as it is located within a university and is spread over a space of 4000 sq. ft. The nursery class aims to provide a space of 15 sq. ft. per child and the nursery and crèche observed was about 900-1000 sq. ft. The crèche and nursery were long, open spaces arranged as activity corners. The nursery has a few tables arranged in the front of the class in a circular format. The back end of the nursery has beds and the sides have cupboards (above a child’s height) with different kind of play material such as blocks and puppets and are marked as respective corners. Further, between the tables in front and the beds at the back there is open space where children could work on the floor. There was also a model house through which children could walk in and walk out. On one side of the class also there was equipment for taking height and weight of children. The nursery was well ventilated with five windows spaced out on one side of the room, six tube-lights and four fans.
The LKG class and UKG were slightly smaller at about 300-400 sq. ft. The LKG and UKG were organised like typical classrooms with benches and tables facing the teacher and the blackboard. The class was well equipped with materials, the children are provided with a desk and a chair, models
are displayed, charts are hung all over the walls. The rooms were well-ventilated with windows and two doors at both ends of the class.
Separate (and adequate) play areas exist for the nursery and LKG/UKG sections (again with an allocation of 15 sq. ft. per child). The outdoor play area has a sandpit, merry-go-rounds, seesaws, slides, monkey bars and also a water play pool (which we could not see). A total of eight toilets were available for the entire pre-school section.
Nutrition is not provided as part of the ECCE programme but the crèche has an attached kitchen area with a refrigerator and microwave and also had a washing machine. There were also provisions of beds and mattresses available for the crèche and nursery classes.
Curriculum is developed in-house following ECCE principles and pedagogy is activitybased learning. The timetable for nursery showed that the daily activities included outdoor activity (water play and sand play), informal talk, creative activity (cutting, pasting, crayoning, printing, collage) and indoor activity (story, blocks corner, puzzles and beads)
In LKG, the subjects include Mathematics, English, General Knowledge and Drawing and UKG children are introduced to English, Mathematics, EVS and language (Hindi). The teacher explained that the day is organised as follows: periods are of 20-30 minutes; they start with outdoor play; followed by prayers and attendance; the first period consists of Hindi, English, Mathematics or EVS. First, a concept is introduced orally. Only one letter is done in a day; this is also introduced in their mother tongue. Then books and pencils are distributed and children write in their books. In the afternoons, the Exponential Learning Programme (ELP) students make them do various activities on different days: story telling with flash cards, rhymes, drawing and blocks.
The progress of the children is regularly monitored and quarterly and half yearly and annual tests/exams are conducted at regular intervals. The progress is measured with marks.
The model includes parent education classes, conducted once in two months. These sessions are focused on parenting skills, techniques to raise children, how to engage children during holidays, behavioural problems, etc. Discussions with parents showed that the school had a good reputation in the community which is why they had enrolled their children here. Some of the strengths of the school identified by the parents were individual attention to the children, a homely environment, the play-way method and good engagement with the teachers. Classroom observations showed that children were happy and active and engaged in their activities of interest. The teachers were friendly, caring and helpful, assisting children with things like putting on their shoes or taking their respective bags to go home. However, on the downside, infrastructure issues such as leaking roofs were observed in some classes.
The school is a part of a chain of three schools run by a newly established, private educational company in Hyderabad, started in 2013. The company acquires existing schools with initial investments drawn from ‘angel’ investors and through social venture capitalists. The school has a
The school is a part of a chain of three schools run by a newly established, private educational company in Hyderabad, started in 2013. The company acquires existing schools with initial investments drawn from ‘angel’ investors and through social venture capitalists.
diverse clientele, with parental occupations ranging from university lecturers to vegetable vendors and support staff of the school.
The school has classes from nursery to Class X, with a total of 570 students. In the pre-primary section, there are a total of 131 students, with approximately equal number of girls and boys. The school also has an inclusion policy and takes in children who may be differently-abled. Special infrastructure and curricular provisions have been made for them. Across the three schools managed by the private company, the norm for PTR maintained is 1:20 for the nursery section (extendable up to 25) and 1:30 for LKG and UKG, not exceeding 35 students per class. The students are grouped age-wise, with the nursery having an intake of students between 2.5-3.5 years; LKG between 3.5 - 4.5 years and UKG between 4.5 years-5.5 years.
Teachers have a minimum qualification of a Bachelor’s degree. One helper is also provided for each class. Training for teachers is an ongoing process and in the initial period, teachers are hand-held for a week continuously within the classroom. In addition, they also receive training from external content providers such as Astragen and Karadi Path.
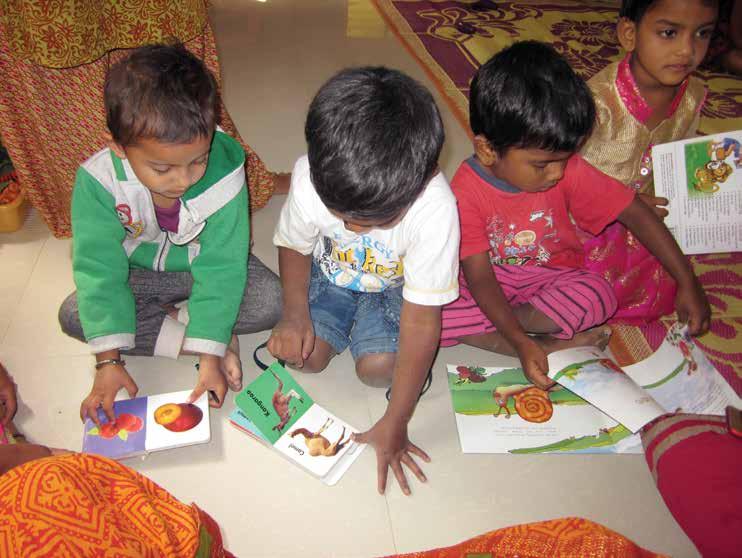
The school visited was located in a single building, without a compound wall or playground. While a playground has been hired at some distance from the school, it cannot be used for the nursery section due to the distance. Classrooms were typically about 300 sq. ft. and there were clean wellmaintained toilets. Nursery classrooms are bigger and have a few round tables and chairs on one side, while the rest of the room can be used for other activity. The classroom was well - ventilated and had two windows and the approach to the classroom was safe. The LKG and UKG are arranged as conventional classrooms with rows of desks and benches. The school also has a computer lab, science lab and library.
The school follows the state board curriculum. At the pre-primary level, the focus is more on routines and getting children adjusted to school after which focus is given to writing as parents demand it. An integrated approach is also adopted with lessons cutting across topics in Mathematics, English and EVS while also incorporating cognitive skills training and stimulation of gross and fine motor abilities.
There were several handmade charts and posters and danglers on letters, numbers, animals, shapes, fruits, vegetables, colours, etc. in the classroom, as well as material such as puzzle boards, beads, flash cards, blocks and crayons. The teachers said that other materials for fine motor skills such as cutting and sticking are made by them according to the lesson plans. For the LKG and UKG, additional curricular input is drawn from content providers such as Astragen, Butterfly Fields and Karadi Path.
Teachers seemed friendly, were able to use non-threatening/non-violent ways of gaining children’s attention/correcting behaviour (e.g., they use strategies like suddenly calling out for children to alternate between loud claps and soft claps by modulating their own voice). Teachers felt motivated working in the school. Children also seemed happy and were actively participating in familiar routines (e.g., saying Jai Hind at the end of the day, etc.).
Parental involvement is minimal, with just one orientation programme and monthly meetings to inform parents about what will be done at school. The parents were happy with the quality of education, teachers, the fee structure and provisions for flexible payment of fees.
The school is run by a social welfare organisation. It is a standalone lab school started in 1987 for students of PG Diploma in Early Childhood Care. Following a collaboration with an NGO and a state-level resource for education, this centre was recognised as the State Resource Centre – Early Childhood Education (SRC-ECE) for Andhra Pradesh. The SRC-ECE is located in the same premises as the college though its budgets are completely separate from the college budgets. Initially, this was started free of cost for their own helpers’ children, for the slum nearby and for the doctors and others looking for an alternative education model. However, since the centre did not have books and used play-way methods, in the first year itself, 11 of 20 parents removed their children feeling this was not the way education should be provided to children.
Apart from running this school, the organisation has also extensively supported the ICDS, balwadis, Janshala programme, and other NGOs working on PSE in the past. The organisation has been involved extensively in developing pre-school/ECCE curriculum for the state government and has
engaged in several innovative projects such as radio-based education, bridge courses for tribal children transitioning from AWCs to primary schools, etc. The success of this model relies on the resources and knowledge of the organisation and the partnerships they foster with experts in the field.
The lab school was initially started for the low income socio-economic group but since these parents did not like the approach of the school, now most children come from the ‘educated class’ (e.g., professors, engineers and doctors). Children also come from different states to the school. Free education is also given to five children who cannot afford education at all. Thus, they also have children of fruit vendors and auto drivers. The fee structure for different groups of children therefore also varies, as reported by the parents.
The school has classes from nursery to Class III. There is one nursery, 2 LKG, 2 UKG and 2 Class I sections and one each of Classes II and III. Currently, the school strength is 200, also their upper cut-off limit for enrolments. An attempt is made to maintain a PTR of 20:1.
There is a total of 14 teaching staff and the qualification expected is Masters with at least a PG Diploma in Early Childhood Education. Training and feedback are provided to the teachers on a weekly basis. In addition, they are also given an opportunity to attend external training programmes such as those conducted by the SCERT.
The school is located within a university campus and is spread over 14,000 sq. ft. Each classroom is about 330 sq. ft. and additionally there is an activity hall and lunch room. There is also a training room on the second floor, which has been used also train external candidates such as officials of the WCD. The classrooms are organised around a central courtyard which has some movable play items like jungle gyms, slides, etc. The nursery, LKG and UKG are arranged in a circular format and there is no furniture for these classes, exact small tables to work on activities for children.
SRC-ECE started focusing on curriculum development from 1990s. Prior to that, they did not have any specific curriculum. They developed a curriculum called Shishu Vikasa Karekram, which is a 10-month programme with a calendar, teacher resource book and manual for the teachers. The development of the curriculum was supported through a project by UNICEF. The curriculum was developed through several sets of consultation from people over the country. The curriculum contains a mix of play-based activities as well as a school readiness component. It was realised after using the play-based material and approach that the transition was still not smooth in the first levels after children had been taught through games and songs. Therefore, at least six weeks of school readiness is planned for before children enter Class I (this is eight weeks for tribal children, since they have to prepare in Gond, Telugu and an additional language, perhaps English. For the Chenchu tribe, this programme has been planned for 12 weeks).
Since the organisation has had a long history of supporting the preparation of curriculum and TLM for the government, many of these resources are used with their own children, like radio-based pre-
and post-learning programmes, print material, cassettes with rhymes, songs and stories, learning kits. Children learn good habits as well as other academic activities.
The play way method used was appreciated by the parents as they felt that it did not burden the child. Monthly meetings are conducted with parents where they are advised about what areas to work on with their children.
An estimation of total per child annual cost using the methodology described above shows wide variations among these models (Figure 1). To reiterate, these are not the annual running expenditures. In some ways, these are annual economic costs taking the value of capital as well alternative costs into account. The range varies from as low as Rs. 6,400 (UBM) and Rs. 8,636 (UCM) to as high as Rs. 29,527 (CUSP-2) and Rs. 28,769 (SSUP). While the salary component constitutes the largest share of annual cost in each of these models, their share varies and they are not necessarily the driver of the higher costs. The component driving the cost upwards varies from one model to another. While it is salary in case of UPPS, it is a combination of salary and infrastructure in the cases of CUSP-2 and SSUP, it is the cost of nutrition and auxiliary services that push the costs in case of UPCS (Figure 2).
It is important to note that the salary component, the largest component of each of these models, varies not only in terms of the proportion of total cost that it covers but also in terms of the levels. Salaries are significantly higher in some models as compared to others and these differences exist at times even for cases where the qualifications levels are not very different (Table 5). The difference in salary is partly explained by locations (i.e., the salaries are high in cities as compared to that in periurban or smaller towns or villages), partly by the approach (i.e., decision to give not less than a particular level) and partly by the workload or the time the workers/instructors are expected to spend). Another variable that determined the total amounts spent on salaries included PTR, which also varied from one model to another (Table 5). A lower PTR means the requirement for the number of teachers is higher than in case of higher PTRs. The approach of the model in terms of training as well as supervision/monitoring in terms of provision for specific staff and their salaries also made a difference in terms of the size of the salary respective models had.
Space, infrastructure and physical facilities occupy 12 to 34 percent of the annual total cost for different models. The estimates for the absolute amounts per centre for this head also varied significantly, this being as low as nearly Rs.25,000 per annum to as high as nearly Rs.8 lakhs per annum.
However, in general, the salaries are not high when compared to the salaries of regular teachers in schools or even in comparison with remuneration that AWCs receive. UPCS is an exception as it pays the highest among these models though the qualification requirements are lower. However, the work timings here are longer than in all other models. This points towards the fact that ECCE still remains seen largely an un-professionalised job and the professionals in the sector perhaps remain unorganised.
Space, infrastructure and physical facilities occupy 12 to 34 percent of the annual total cost for different models. The estimates for the absolute amounts per centre for this head also varied significantly, this being as low as nearly Rs.25,000 per annum to as high as nearly Rs.8 lakhs per annum. Four out of nine models have an annual cost on this head below one lakh per annum while for the remaining five models, this cost varies roughly between 1.5 to 8 lakhs. Among these five, this cost is high for two models: SSUP (about 8 lakhs) and LUPS (about 6.5 lakhs); while SSUP is the lab school for running professional courses on ECCE and is modelled accordingly, LUPS is the low-cost private school whose physical infrastructure serves as the main attraction for parents.
In addition to the size of space used for the classroom, sleeping and pay, etc. what becomes the most critical in determining the relative size for this component is, quite expectedly, the rate of land and building costs or the rent in respective cities/locations. The centres that are located in the middle of big cities spend much more on infrastructure. No clear trend emerges from the centre being part of a larger setup, e.g., a CUSP (2) or just a standalone ECCE centre. The models with highest and the lowest annual cost for this head are both standalone ECCE centres, located in the middle of the urban centre and in a suburb respectively.
ECCE centre instructor’s salaries, qualifications and Teacher-pupil ratios
Whether provision for any social security (PF, gratuity, etc.) exists (Yes/ no)
Teacher pupil ratio (norm / average)
Teacher/ worker’s education and professional qualification (minimum)
Teacher /workers’ timings
Centre’s timings
Whether annual increment exists for employees (yes/no)
of the
Yes
1:12-30 #
8th /10th or 12th Pass
9:00 am5:00 pm
9:00 am5:00 pm
Yes
01:35
DIET/ NTT trained or graduation
8:15 am2:15 pm
8:15 am12:30 pm
Yes
01:35
DIET/ NTT trained or graduation
8:15 am2:15 pm
8:15 am12:30 pm
No
01:15
No minimum educational qualification criteria, knowledge of mother tongue is considered important
7:30 am4:30 pm
7:30 am4:30 pm
No
01:15
No
01:25
Yes
01:25
Yes
1:20-30 ##
12th Pass (Flexible)
9:00 am12:00 noon 8:30 am12:00 noon
12th Pass
9:00 am to 4:00 pm
9:00 am to 4:00 pm
Graduation
Graduation
9:30 am-4:30 pm
9:30 am -12:30 pm
9:00 am –3:00 pm
9:00 am-12:00 noon/3:00 pm**
Yes
01:20
Post-graduation with a PG Diploma in Early childhood education
9:00 am –3:30 pm
9:00 am-12:00 noon/1:00pm ***
No
Yes
Yes
Yes
No*
No*
Yes
Yes
Yes
10800
UPPS
Increments are offered but not annually but once in four-five years; # 1:12 is the UCM classroom ratio and 1:30 is the balwadi classroom ratio
9:00am-12:00 noon -Nursery and 9:00am3:00 pm –LKG and UKG; ## 1:20 is the nursery classroom ratio and 1:30 is the LKG and UKG classrooms ratio
9:00 am -12:00 noon –Nursery and 9:00am -1:00pm –LKG and UKG
Model Per centre annual cost on space, infrastructure and physical facilities (Rs.)
Physical space used by one centre (in sq.-feet)
Playground size used by ECCE children in one centre (in sq.-feet)
of Physical Space
Child-friendly furniture/ fixtures/facilities exists (Yes / no)
* Information is imputed using CUSP (1) data
Only four of the nine models have a component of making provisions for nutrition and auxiliary (health check-up, etc.) services. Out of the four, one provides only auxiliary services and therefore this component covers less than one percent of the total annual cost. Of the remaining three, UCM is a standalone crèche and funded under the government programme of RGNS, and spends almost half of the total annual cost on this head. As mentioned earlier, nutrition appeared to be the main focus of this intervention, with the education component being relatively weak. The remaining two models, UPCS and CBCDC, where this component covers 29 and 18 percent of the total annual costs respectively, are both community-centred models serving children coming from marginalised communities, one in urban and one in a rural setting. This translates itself into an amount of only about Rs.6,269 per child per year in case of UPCS and Rs.1,872 per child per year for CBCDC. Nutrition is integral to these models and plays a very critical role in enrolment, retention and the learning of children.
This component covers about one to 19 percent of the total annual costs, varying between 4 and 10 percent of total cost in four out of eight models for which we have the data. The high proportion of this component in the private ECCE model (LUPS), which spends 19 per cent of its annual cost on this component (nearly 4.3 lakhs per annum on one centre), can perhaps be attributed to the fact that they are using materials and services from external, corporate-based, content providers. Most of the remaining models make their own materials or use other resources developed/provided by NGOs and support agencies.
Training accounts for between 1 to 7 per cent of total costs for the five models for which we have the data. For one model (UUPS), this cost is merged with salary and that in part could explain the high share of the salary component for this model (85).
Out of nine models, one model (private) had no such provision, two had included this in teachers’ salary probably because teachers are responsible for community mobilisation and the data was not available for three models. The remaining three spent between 0.4 to 2 per cent of its total annual cost for one centre on this component.
Figure 3 shows that the pattern for the per centre and per child cost is the same. This means that despite some variations in the PTRs, salary levels and the space being used for the ECCE centres, the relative positioning of the models in terms of per centre cost and per child cost remain the same. However, it is possible that the number of centres a model has or the scale of the model also lead to certain externalities and impact the per-centre or per child cost. We explore this aspect at a later stage after discussing the revenue sources for the models.
We estimated annualised total cost of models to understand the total cost of respective models and to be able to take a comparative analysis. In order to understand the implications for scaling up and also the role that the size of scale of the intervention plays in either increasing or decreasing the cost of a model, we also need to separate the capital and recurrent cost. Tables 7 and 8 provide total capital and annual recurrent cost estimates respectively. We have included initial investment on curriculum development and one-time induction training as capital costs to argue that these are essential investments for starting an ECCE centre whether as part of a composite school or as a standalone institution, even though the information was not available for most models.
The total capital cost on land and building is expectedly determined by the approach and target group (stable population, migrants, moving – e.g. – construction workers, etc.), nature of intervention (community and children-focused, only child-focused, etc.), primary purpose (to serve as a learning lab to develop and evolve ‘good schooling’ practices, to make profit, to serve unserved, low-income household children while also allowing mothers to work, to orient parents on good parenting and
provide children space for good care and education), location (urban, semi-urban, rural) and perhaps also the size of funds that could be accessed. The model that primarily serves children of construction workers does not create any assets as their sites keep changing (UPCS). Other community-based or community-focussed organisations have incurred relatively modest investments (CBCDC, UBM, UCM). On the other hand, models that are part of larger initiatives - either composite schools or social welfare organisation or even as labs - have incurred much greater investments on buildings or creation of physical spaces (CUSP, SSUP, UPPS). They have also invested relatively larger amounts on furniture, play materials, equipment, etc., which has generally, though not always, added to the quality of the delivery. The only private organisation has also invested on materials and equipment, especially focusing on technological aids, which is also their primary attraction for customers (i.e. parents) and have not invested in building/land, etc. (LUPS). It has helped them in keeping the total capital investment low while making the centre look attractive to aspiring parents and also allowed them the flexibility to move locations if required.
TABLE 7: Capital costs incurred by the models (per centre costs in rupees)
Land Cost of building Cost of furniture, material, play material, equipment, vehicle, etc.
UPCS No capital
No
No capital asset DNA DNA NA 530 14
DNA DNA 1765562
DNA DNA 6313220
DNA DNA 342160
DNA DNA
DNA DNA
20000
DNA DNA
Part of research staff salary
Table 8 shows that annual per child recurrent cost is lower than the annual total cost estimated earlier for the models because it does not include the annualised values of capital costs. The annual recurrent cost is higher (between Rs.15 – 25,000 per child) on account of:
1. not investing in building, etc. as the rent component goes up (UPCS, LUPS)
2. providing high quality nutrition component (UPCS)
3. providing TLM (the nature of TLM varies depending on the approach but spending is high) (UPCS, CUSP, SSUP, LUPS, UPPS)
4. high expenses on salaries and other benefits for teachers and management (CUSP-2, SSUP, LUPS, UPPS)
In addition to the size of the teachers’ salaries (discussed earlier), the scale or the number of centres that an organisation runs has a significant impact on the size of the salary component. The organisation that runs only one centre (SSUP and UPPS, serving as lab schools) or only two-three centres (CUSP-2 and LUPS), have a high annual salary and related expenses (between Rs.10-23 lakhs per annum for one centre) because their entire supervision, monitoring and management staff get absorbed by only one centre whereas in other cases, it gets observed by a larger number of centres/children. Community-based and community-focused organisations in rural areas or small towns have lower annual recurrent costs because of their dependence on community for a number of services and contributions as well as lower salary levels and rental values in their locations. Also, their spending on TLM is markedly lower than others (CBCDC, UBM and UCM). We return to discuss costs after analysing the revenue and their sources for these models.
A number of mechanisms exist for resource mobilisation and acting as sources of revenue for the organisations that run the models covered under this study. They also often use multiple sources. The data analysis from the models point towards eight kinds of revenue sources that they have been tapping into:
a. Donations: Donations are funds or resources received by organisations either in cash or in-kind. Cash donations include money received from individuals, institutions and corporate bodies from both Indian and foreign sources. Corporate bodies usually make donations under the mandatory clause of the CSR Act. In-kind donations include the direct provision of resources such as a TLM package, curriculum or infrastructural components such as lowcost toilets donated by NGOs or corporate bodies.
b. Aid/Grants: Aid and grants include funding provided by the state, a state-run institution, international agencies (bilateral or multilateral) including foundations and international NGOs (INGOs).
c. Collaborations: Collaborations function on the principle of quid pro quo and capitalise on the strengths of all the partner organizations involved to ensure smooth functioning of the programmes. Collaborations involve the organisation providing its expert knowledge in the form of either research or training to other organisations or to support/scale up state-level schemes. In return, the resources raised are either in the form of governmental support or result in collaborative products such as a curriculum package.
d. User fees: User fees refer to the fixed amounts charged directly to the parents of the child. Depending on the organisation, this user fee is divided into various components such as admission fee, caution deposit fee, school bus fee, tuition fee, application fee, registration fee,
re-admission fee, special fee, annual fee and replenishment fee. These sub-components differ depending on the strategy of the organisation and are allocated for different expenditure heads.
e. Out of pocket (OOP) expenditure: Out-of-pocket expenses refer to the money spent by parents on items bought for their children such as uniforms, textbooks, stationery, etc. Some of these items are optional such as transportation where the parents choose whether or not to avail the facility. At times, parents choose how to spend the money on these items. For instance, the amount may differ on the kind of stationery parents may choose to buy for the child or the transport expenses would differ depending upon the choice of a school-provided bus versus a public transport bus versus if the child is picked and dropped by his parents in a private vehicle. But parents do not have much choice in certain cases such as textbooks and uniforms and have to go for what is asked for by the service providers. The difference between user fees and OOP expenses is that user fees are fixed and determine the entry point of a child into the institution whereas OOP expenses are slightly flexible and allow the parent to adjust their expenses to some extent.
f. Volunteering and contributions: Contributions from parents and community members has emerged as an important source of revenue. These contributions are in the forms of resources, time, labour and expertise. Contributions might either be in the form of direct provision of resources such as vegetables from the parents’ house to cook mid-day meals or provision of land space to run the centre. Examples of time and labour contributions include community members helping to build centre spaces or for cooking mid-day meals. Expertise of PRI members and community leaders are directed for the purpose of communitybased monitoring.
g. Investments: Investments, in the strictest sense, are usually large sums of money pumped into an organisation usually with the objective of earning returns. Only one organisation running a ‘for profit’ ECCE service has received investments in the present study from a set of private ‘angel investors’ from the US and also from a social venture capitalist called Acumen Fund.
The following paragraphs discuss the individual model’s resource generation strategies first followed by a comparative analysis.
As mentioned earlier, they have several models but this analysis is limited to the day care direct delivery model at construction sites under which ECCE centres are run and managed at designated sites through a combination of their own funds and assistance received from respective construction companies or authorities. As mentioned earlier, each centre is divided into three sections: crèche for 0-3 year olds, balwadi for 3-5 year olds, and bridge courses for 6-12 year olds.
The organisation tries to run 12 centres at a given point in time to be most efficient and one site is functional for anywhere from one to five or years, depending on the site. The biggest challenge within this model is that it caters to a highly fluid and constantly moving section of society i.e. migrating construction labourers. While the site may remain functional for several years, the population within the labour camps keeps shifting from one site to another, so the number of children at one centre
A number of mechanisms exist for resource mobilisation and acting as sources of revenue for the organisations that run the models covered under this study.
also keeps on fluctuating. In the year 2015-16, 3232 children were covered under this model, leading to an average of 57 children per centre. Donations, interest from corpuses, contributions from construction companies and community efforts are the main sources of revenue.
%, Others, 2.99, 3%
%, Corpus Funds, 46.04, 46%
%, donations , 44.97, 45%
%, Contributions, 5.86, 6%%, Aid, 0.15, 0%
Donations: Donations are either general or earmarked to the corpus fund, or are in kind. Donations are from Indian as well as foreign individuals, institutions and corporate bodies.
Corpus Funds: Excess of donations are transferred into a corpus fund and interest on the corpus fund also serves as a source of income. The corpus fund is marked as a separate section in the organisational budget as it represents the part of the donations transferred to the fund plus the interest earned on previous funds available for the current year. This corpus fund is used for core administrative expenses and as reserve in case of a financial crisis.
The largest share of resources is raised through donations, a share of which is transferred into the corpus funds and together they form 92% of the resource pool. The organisation has been functioning since 1969 and has built a large corpus fund over the years. These two resources combined are diverted for the recurrent expenditure heads of salaries, nutrition, TLM/curriculum and training, covering more than 85% of the total annual expenditure.
Contributions: The contributions, in this case, refer to contributions from the primary stakeholder i.e. the building or construction company. While the space provided to construct the centre is an in-kind contribution, builders are also expected to spend separately on other capital costs such as furniture, construction of building and setting up of utilities. The contractors and builders also contribute to the operational costs of their own sites, varying from 5 – 70% of total operational costs for different companies. A cost analysis done by the organisation itself pegs that 28% of the expenditure of the direct delivery model at construction sites was borne by the construction company in 2015-16 (as given in annual report 2015-16). These operational expenses may include any kind of expenses under the major heads of salaries, nutrition, pedagogy training or TLM and curriculum development. The management shared that only one out of the three companies they approached agreed to contribute to the building and running of crèches at the site in 2015-16.
Aid: A nominal amount of aid was also provided by the government under the RGNCS but that has stopped since 2016.
Others: The Others category includes all the resource collection, donations in kind, sale of assets, redemptions, income on special funds etc.
Community efforts also play a central role. The organisation identifies local community leaders who maintain an interface between the builder company/contractor and the community members, and aid with the organization’s community outreach programme. Some of their responsibilities are maintaining safety after work, identifying and resolving local issues such as water/electricity, local purchasing of material, monitor children with severe malnourishment, track entry of new labour in the camp, provide basic first aid, and help with linkages with government departments. Community members are also involved through other means of street plays, health camps and through monthly parent-teacher meetings where issues of infant and young child feeding practices, nutritious food, cleanliness and hygiene, the importance of appropriate childcare practices at home and outside, redistributing care work within families, the impact and holistic growth on children as well as matters not directly related to ECD such as financial security or health insurance are discussed. A group of community leaders called Saathi Samuh has been created who work on a voluntary basis and help in sustaining the agenda of community awareness even after the NGO’s direct intervention ends at one particular site.
On the whole, the organisation is able to offset about 45% of its total expenses through contributions from the community and the builder company (about 30% of running expenses, 12% of infrastructural resources and 1% of community-based practices and certain fixed costs).
The model needs to be accommodative of the transitory nature of its target population and to gain their trust before even initiating negotiations with the main community stakeholder i.e. construction companies. The success of this strategy depends on these negotiations and the level of their buy-in to finance and run the model. In this model, buy-in from the community stakeholder i.e. builders, is a major deal breaker for the setting up of the centre itself. Even after the non-recurring costs of land and building are taken care of, community contributions are necessary for recurring costs and raising awareness. A higher contribution from the stakeholders helps in not only scaling up the model but also in improving the quality of services.
Further, an optimum usage of funds would be ensured only if there is full enrolment and participation of students. Given the transient population category, the enrolments and attendance rates are constantly fluctuating which does not always ensure efficient usage of funds received by the organisation. The major obstacle in the way of scalability is the lack of personnel, as shared in the management interview. Since salaries under this model are highly dependent on donations, the organisation has started diversifying into other models and has also collaborated with MWCD as a training partner to raise more funds. Thus, besides depending on donations and community contributions from builders, the organisation is using its expert knowledge to raise funds through other sources as well. But in order to sustain the intervention even after its exit from the site requires community volunteers who are willing to spend time to raise awareness about ECCE, healthcare and other related issues, as proven successful with the help of the community--based group Saathi Samuh
This organisation runs both schools and learning centres and is mainly dependent on donations and user fees to run ECCE centres. These two means cover about 92 percent of their revenue.
Donations: The Annual Report 2015-16 of the organisation divides this category into individual donations, corporate grants, funding agency grants, government grants, donation box and sponsorship, the distribution of which is depicted in Figure 6 below (taken from Annual Report 201516). The individual sponsorship programme is a form of donation where individuals can sponsor a single child in the school (to the tune of Rs. 7000 per child in LKG/UKG). Another method to raise donations is by placing donation boxes in restaurants, gift shops, garment stores, etc. All these sources combined totaled about five crores of funds in 2016 and constituted almost half of the total revenue. The management interview revealed that in recent times, funding has reduced drastically because of the CSR Act leading to corporate bodies starting their own Foundations and directing all their money there rather than donating to NGOs. To combat this, the organisation has devised ways to exhibit their impact and thus garner more donations from other sources.
User fees: The second largest resource share is that of user fees. The school charges Rs.250 per month for a girl and Rs.350 per month for a boy. In 2015-16, the funds raised through user fees alone was close to four crores. The management shared that the major part of these two resources goes towards recurrent programmatic expenditure which includes salaries, development of TLM and teacher trainings. The principal of one of the centres justified the charging of user fees as a way of keeping the community involved. She said:“Our main philosophy is that parents must understand that nothing comes for free and the community we work in must understand the value of what we are providing them. Hence, we charge a nominal fee from them that keeps them involved in the process. In fact, we call this community contribution and not user fees. And this system contributes in rapport-building as well.”
Sundry Receipts: Sundry receipts comprise the income gained from miscellaneous sources such as the sale of greeting cards made by the children (not more than Rs.15 each) or from the sale of assets.
Out-of-pocket expenditures: Out-of-pocket expenditures by parents includes uniforms and learning material such as books, notebooks and stationery. Since nutrition is not provided at these centres, this also becomes an out-of-pocket expenditure for the parents. There are three subjects in the pre-primary section and the costs incurred on purchasing these textbooks is between Rs.900 – Rs. 1200 per child.
Investments and Fixed deposits: This pertain to the income received on sale of assets and maturity of various investments and fixed deposits in the banks or in any other form.
As per the cost analysis, the total estimated costs of one ECCE service in the learning centre model is Rs.5,60,506 and for the composite school, it is Rs.17,41,548. The resources set aside for running one ECCE centre in a learning centre is Rs.47,11,372 and in a composite school is Rs. 86,37,516 (Refer to resource calculations in Annexure 4). This means there is a large amount of surplus available with the organisation. This shows that though a non-profit organisation, it has managed to generate surplus because of high donations it receives and also because of the user fee policy.
The organisation follows a unique process of initiating an ECCE centre, mobilising the community and withdrawing once the government enters the village. They hand over the centre to function as the ICDS centre and identify a new village with no access to ECCE to go to. The organisation leverages a number of large networks at the state-level, working with Dalit, fishermen and Adivasi communities for networking and campaigning. They have together formed task forces at various levels in order to lobby the CBCDC model to the government.
There are two kinds of models run under this programme: centre-based camps and home-based camps. The centre-based camps are based within the community and provides mother tongue- based, multilingual ECCE to tribal children from two to six years of age. It focuses on mother tonguebased learning for children in the two to four years of age category and multilingual education for children from four to six years of age by introducing the state language, English and Hindi along with their mother tongue. The home-based camps are mainly for educating caregivers on care during pregnancy, neonatal and postnatal care, colostrum feeding, exclusive breast feeding till the baby is six months old, child and mother immunisation, early stimulations and the importance of ECCE. A total of 480-500 children are covered across 32 centres, with 15-18 children per centre. The programme caters to low income families and minorities, five percent of the total population catered to are Scheduled Castes. Only the centre-based camps are being analysed here.
The organisation follows a unique process of initiating an ECCE centre, mobilising the community and withdrawing once the government enters the village. They hand over the centre to function as the ICDS centre and identify a new village with no access to ECCE to go to.
User Fees: The user fee collected from the parents is very nominal with Rs.10 as annual fees and Rs.1 as monthly fee.
Community contributions: The organisation strongly believes in being a people’s institution for the sake of sustainability. The building for the centre is provided by the community. In certain cases, where a building is not available, the community is mobilised to contribute labour and other resources such as brick-making, carpentry, masonry, woodwork, building of boundary wall, etc. to build a small hut with minimal standards like a roof or a slab. The community members also contributed their labour and time for the construction of toilets.
One person from the community helps in preparing meals on a rotational basis and food is prepared within a community building. Even for the raw material, the parents and community members contribute food grains for preparing meals at the centre in case of delays in government supplies. The programme also locally sources items such as sticks and stones as learning material for counting exercises. Even the monitoring committee of 7-12 members consist of parents, youth, PRI members and committee leaders who work voluntarily.
Aid: Water in these centres is sourced from tube wells installed by the government at designated points. Donations and grants: They have received grants from an international agency amounting to Rs.60, 000 per village.
The revenue in monetary form available per centre is Rs.60,343 while the cost required to run it is Rs. 1,33,080. This is one of the few organisations that have resources less than the cost and that is because the model is largely community-based. The manager of the organisation estimated this to be nearly 40 to 50 per cent of the contribution of building costs.
This urban slum-based organisation has been working in those areas for 32 years and running remedial classes. Because of its presence in the slums, the organisation did not need to undertake any special mobilisation efforts to start the first balwadi centre. The model started with 40 centres, after which the state government opened some AWCs and hence some balwadi centres closed down. As of today, 240 children are covered in 12 centres under this model with a targeted norm of 25-30 children per centre.
Donations and grants: The organisation receives donations and grants from national and international sources both in-kind and cash. The balwadi centres used to be funded by American Jesus World Solutions and they also received support from CRY and Bernard van Leer Foundation for two years. Some of the grants received were ear-marked for specific purposes. For instance; Concern Worldwide funded the construction of floors, windows and doors and Water-Aid supported the construction of low-cost toilets. Red Cross supported one teacher training programme.
User Fees: Since 2016, the organisation has started motivating parents to pay a nominal amount in user fees i.e. Rs.150-200 per month. The amount was decided through mutual discussions between the Parents Committee and the Basti Education Committee. There is not much clarity on whether this user fee goes under the head of Self-generated income or Expenditure over income. Using the number of children covered under this programme, the user fees estimates amount to Rs.5,76,000 in a year.
Others: Since this category was not explained in the financial statement, it could include anything from surplus funds from previous year, income earned from sale of assets or simply the worth of in-kind donations.
Community contributions: The main philosophy behind involving the community is that it makes the programme more sustainable and practical. One of the major features of the programme is to use existing low-cost community resources such as empty buildings e.g., churches and unused community spaces for housing the centre. Electricity charges (wherever available) are also taken care of by the community. A unique community contribution in this model came in the form of labour and time. With respect to the new toilets that were constructed after the 1999 cyclone; the materials were provided from the organisation but the community contributed with free labour. The wall for the playground was built by the slum members and paid for by them. Under the TLM head, old play materials were brought in from the earlier centres and community members brought in old waste boxes for preparing TLM. The community also monitors the performance of the teachers’ attendance.
Out-of-pocket expenses: The parents are compulsorily expected to buy a package of one set of uniform, belt, tie and ID card by paying Rs.600 per child from the same organisation. Other than that, parents buy books and bags for around Rs.500. Since the nutrition component is dropped out of the programme, parents also spend extra on buying tiffin boxes and sending snacks with their children.
Salaries which form the largest expenditure head (67%) are paid directly from the user fees component as shared by the management. It is unclear from the budget which component exactly constitutes the user fees. User fees could either be expenditure over income or self-generated income or under the Others category, all of which combined account for 21% of the resource pool. Even these three categories combined would not be able to fund the salaries component as the mismatch is huge. The user fees component alone would definitely not match up with the salaries account.
The cost analysis showed that the yearly cost of one ECCE centre is Rs.84,180 while the resources available amounted to Rs.2,19,622 (refer calculations). It is likely that the organisation spends this surplus of revenue on cost facilities such as the child helpline that may have been excluded from the cost analysis undertaken here and also for running a number of other programmes under health and vocational training that they undertake.
The management interview revealed that while the organisation had planned for 300 children in their centres, there were only 240 children currently and this is mainly because of the introduction of the user fees component. The organisation seemed to be heavily dependent on its funding agency because as soon as it stopped, the operational expenses of the centres were in jeopardy. This over-dependence on donations forced the organisation to change their provision of providing raw materials and cooking of meals to the parents and the community. This decision of offsetting the cost by involving the community is what helped the model reach its break-even point during previous years.
The crèche model is also run by the same organisation in urban slums for children between six months to six years of age and primarily caters to children of working and ailing mothers in the slums. The organization is sanctioned to run crèches under the RGNCS. The organisation started
running crèches since 1992 with one centre each in three slums of the state capital. As present, there are six crèches located in six slums covering 155 children. The organisation maintains a norm of 25 children per centre. The organisation also maintains certain norms in order to have a fair representation of age groups and economic backgrounds. Forty per cent of the children in each centre must be below three years and half of the children must be below the poverty line.
Government aid: As per RGNCS norms, 90% of the funds of this organisation are provided by the state government as aid. The government also funds and organises monitoring by independent agencies. A non-recurring grant of Rs. 5,000 is provided by the government towards replacement/purchase of equipment, furniture, water filter, etc. at an interval of five years and a one-time grant of Rs. 10,000 when the crèche was started.
User Fees: The remaining funds i.e. 10 per cent of the budget is raised through charging user fees. The organisation uses a progressive user fee norm where a child from BPL family pays only Rs.20 per month, a child coming from a household with income up to Rs. 12,000 per month pays Rs. 100 per month and those coming from households with income above Rs.12,000 per month pay Rs.200 per month. Provision of TLM and pedagogy trainings are completely financed through user fees.
Others: Water Aid supported the construction of toilets in these centres. Auxiliary services of immunisation are provided through support from ASHA and ANM workers, i.e. using public resources. Monitoring is undertaken through inspection visits by the social welfare board members, voluntary positions at the helm of the organization.
The cost analysis shows that the cost incurred to run one ECCE centre is Rs.1,75,775 while the resource available per centre is Rs.4,39,245. Since the funding scheme of the crèche follows government norms under RGNCS, the resources obtained by the organisation do not differ from year to year. The user fees, on the other hand, change from year to year because of the change in the number of users and also their composition in terms of which economic category they come from. Given the size of surplus over cost , there may be a case for reducing the user charges or enhancing the quality and range of services, especially in view of the fact that the centres were plagued by a number of operational inefficiencies. The centre we visited was dark and dusty with hardly any play materials. The teachers were also confused with respect to the timetable to be followed at the centre, their employee benefits, the health components of the programme, the tracking and assessment system followed and other related things. Even the parents were unhappy with the irregularity of meals and insufficient play materials available.
User fees: The fee breakdown for children attending the ECCE programme is as follows –a onetime caution deposit of Rs. 5,000 and a tuition fee of Rs. 1,000 - 1,200 per month . This amount primarily goes towards teachers’ salaries and materials for running the ECCE centre.
Grants: The centre receives grants from the university. As per the university records, the amount set aside for this college is Rs. 40,000 annually. The grant is used for the setting up of the centre, utility expenses and the cost of one guest lecturer per year.
Out-of-pocket expenses: Parents have to pay separately for textbooks and notebooks for English, Maths, Hindi and EVS. In addition, one field trip is organised per academic year, for which Rs. 20 is additionally collected from parents towards snacks. A day care facility is also offered to children
The management interview revealed that while the organisation had planned for 300 children in their centres, there were only 240 children currently and this is mainly because of the introduction of the user fees component.
whose parents have difficulties in taking children back home in the middle of the day. The fee for this is an additional cost and parents pay an additional Rs. 1,200 a month. One of the parents revealed the school offered some additional classes after school hours (such as dance and singing) for additional fees, the amount of which was not revealed.
The largest expenditure head of salaries that forms 65% of the total costs is financed through the largest resource head i.e. user fees. The university grant which is three percent of the total resources is used for providing the building space, construction of the centre and utility expenses. The expenses on teacher training is borne by the teachers themselves to the tune of Rs. 4,000 per head. The
estimated annual resources available for the centre is Rs.16,92,600 as against the annual estimated recurrent cost of 19,83,039. It is possible that the additional fees charged for which we do not have the data offsets some of the expenses.
Since this is an experimental lab school, the organisation has no plan of scaling it up in the future and would only be used as a training site for students. Sharing of resources between the university and the centre is common: resources owned by the university (playground, classrooms, bus, etc.) is used by the ECCE centre and the TLM prepared by the students of the ECCE programme as part of their training or assessments is later used in the ECCE centre . As part of their hands-on training, students are also expected to take up certain classes at the ECCE centre. So most of the costs are either distributed as user fees to the higher classes or are obtained as in-kind resources from the larger institution.
The organisation running this model is registered as a private limited company and that was started in 2013 by an IT engineer from Georgia Tech who was passionate about making a mark in the education sector, especially in the context of low cost private schools.
According to the head of the pre-primary programme, the basic idea of the model is to acquire schools under their portfolio. They currently have a total of three schools in the state capital. The organisation seeks to acquire small schools and then expand as the revenue increases with increase in the enrolments. These three schools have classes running from nursery to Class X. Each school has three pre-primary sections – nursery (2.5 years to 3.5 years), LKG (3.5 years to 4.5 years) and UKG (4.5 years to 5.5 years). Parents of children who attended these schools ranged from being university lecturers to support staff at the same school.
User Fees: The schools under the LUPS model collect user fees which are in turn paid to the head organisation as service fees. The user fee is split into various components of tuition fees, school bus fees, admission fees and application fees. The admission fee is Rs. 2,000 per child in 2016-17 but the school management has discretion to offer concession/discount on admission fees. Further, during the admission period, there are promotional offers which predominantly include an admission fee waiver which is largely availed by the parents and the monthly tuition fees include the school diary and badge (the school diary and ID card are charged to the students one-time at the time of purchase of books). If the students opt to take up transportation, then the school bus fee also needs to be paid. The management claims that this cost is heavily subsidised as the total transport cost ranges between Rs 10,000 and Rs.12,000 per month depending on seating capacity while on an average only Rs.6,000 per month is recovered from the parents. According to the management, the average fee for nursery is about Rs. 13,000 while the average annual fee as reported by the parents turned out to be Rs.15,000 per child.
The user fee is allocated largely towards payment of salaries, building and playground rent, school bus cost, professional services and other office expenses.
Recovery of past dues and other income: Recovery of past dues largely includes unpaid fees of the previous year which are recovered in the subsequent year. Other income includes interest income from bank, etc.
Investments: It has received initial capital from private firms which has been used to set up the school. The initial investment for setting up a school was Rs. 70-80 lakhs. Initial investments included creating ‘learning infrastructure’, that is, benches and desks, a computer lab consisting of at least 25-30 computers, internet connections, power backups, office equipment, CCTV camera, office computers, printers, including library set up and books, science lab equipment, initial renovation and painting and rent of the playground. The interest helps in financing the maintenance and organising one induction training of teachers at the beginning of the year, a subject-specific training programme in English, Mathematics and Science for a period of two days and to purchase other contents and teaching aids from corporate content providers.
Out-of-pocket expenses: The parents informed us that they spent about Rs. 500-650 for one uniform set. Books are purchased from a vendor and sold to students. The training and digital content are included in books cost by the vendor and hence not recovered separately. Text books
Figure 11: LUPS revenue sources (as provided in P&L accounts of 2015-16)
are sold at MRP to the students. LUPS purchases books from third party vendors – Karadi Path (for English in lower grades), NIIT (computer education) and Butterfly Fields Science experiments for high school) that are sold at a discount to the students (20-30% of the purchase cost). The average cost of books in 2016-17 was Rs.2,000 (for pre-primary the average cost would be Rs.1,500) according to the management. Parents spend about Rs.1500 - 2000 for textbooks alone and maybe another Rs. 200-300 for notebooks.
User Fees: This basically included different types of user fees such as application fee, registration fee, admission fee, re-admission fee, tuition fee, special fee, annual fee and replenishment fee. From the interview with the management , it was found out that the fees per child for one year is Rs. 20,000 which includes an admission fee of Rs. 4,000, a special fee of Rs. 1,500 and a tuition fee of Rs. 6,000 (per child, per annum). A clear breakdown of the utilisation of this resource was also provided. The admission fee is used towards infrastructure - on repairs, purchasing or replacing furniture, or to make additions to infrastructure like labs, etc. The tuition fee is used to support salaries and allowances, including EPF, PF, gratuity, etc. The special fee is used towards the programme - for activities, stationery, etc.
Interest: In case a surplus amount is collected in any year, it is sent to a fund called the Teacher’s Fund. The interest received on this fund is to be used in years when the school runs in deficit like the current year.
Income from projects: A large proportion of the funds is also raised through other services such as training and supporting other organisations and state-level ECCE schemes. They have extensively supported the ICDS in their state both with curriculum development for AWCs as well as for training AWWs. They also supported the ECCE component of the DPEP. The unit has also worked on several research projects. In 1990, they undertook a nation-wide study in collaboration with NCERT on utilisation of pre-school services by the community. They have pre-tested existing play material in the state and developed a pre-school kit based on this experience. Another microstudy was conducted to study the impact of privatisation (in one village) to understand parental
preferences for private schools/English medium education. The ECCE unit of the NGO has also been commissioned and submitted a report on the contextualisation of the ECCE policy/curriculum for the southern states and in the past, have also supported the Dr. B R Ambedkar Open University in the development of their early childhood programme curriculum.
They also developed a curriculum called Shishu Vikasa Karekram with UNICEF support which is now being translated into several languages such as Gujarati, Hindi, etc. The unit has also developed a language readiness curriculum with UNICEF funds (used in tsunami-affected areas) and an early stimulation package for under three year olds. NCERT developed a programme called CHER in which teachers conduct classes orientating the child to a radio programme and check on the child’s knowledge and understanding after the broadcast which was adopted by this organization.
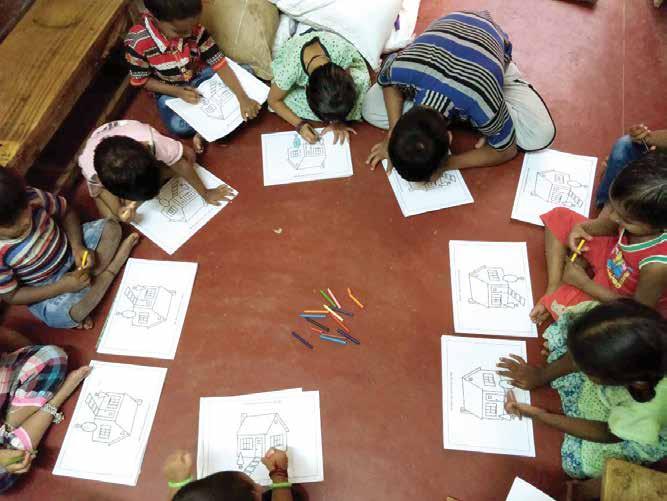
Another unique model piloted in Adilabad was that of the community-managed balwadis in which the financial management of balwadis was given to the community and one parent was invited every day to be present at the balwadi to manage it. These projects either helped in raising funds directly or in creating resources as an output of these projects that indirectly helped in the TLM or curriculum component of the programme.
The admission fee is used on maintenance of infrastructure since the capital costs has been taken care of by Osmania University through its in-kind donation of building. Government support has been highly instrumental in pushing innovations and recognising this institution as an expert resource in the field. Based on the track record of this organisation, the DoE (i.e. Commissioner and the Principal Secretary) funded the development, updating and translation of an ECCE curriculum package called Shishu Vikasa Karekram.
The estimated resource available is Rs 53,64,403 and the estimated annual recurrent cost of the centre is Rs.25,42 ,192. This means they have a huge surplus available.
The estimated revenue of one centre is Rs. 14,78,687 per annum, which is less than the estimated annual recurrent cost of Rs.20,90,892 per centre. The management shared that there is an initial operational loss of 2-3 years for the schools to grow and for the cash flow through user charges to entirely offset the running cost. This model is user fee-dependent and therefore highly sensitive to enrolments. The management explained that in terms of parents’ preference and to be a costeffective (and profit-making) model in the long run, a revenue-based model run by a private entity is best functional as a composite school. This helps in distribution of costs among different age groups and in achieving economies of scale.
Models
Total Cost (annualized) (Cost in Rupees)
Capital and recurrent costs and annual revenue (Cost in Rupees)
Per child Per centre Per centre capital cost Per centre annual recurrent cost Annual revenue (per centre)
Total No. of centres
Total No. of Students (Per Centre)
UPCS 21626 821796 NA 821769 8,78,667 14 38
CUSP 1 9338 653681 1765562 560506 47,11,372 11 70
CUSP 2 29527 2066924 6313220 1741548 86,37,516 2 70
CBCDC 10537 158053 342160 133080 60,343 32 15
UBM 6400 127990 640838 84180 2,19,622 12 20
UCM 8636 215906 616688 175775 4,39,244 6 25
SSUP 28769 2675599 8546000 1983039 14,78,686 1 93
LUPS 15761 2159264 545258 2090892 16,92,600 3 137
UPPS 23947 2634213 2616702 2542192 53,64,403 1 110
Table 9 provides a summary of cost and revenue estimates along with the size of the models in terms of the number of centres they run and the number of students covered by these centres.
Table 10 provides a rough snapshot of the revenue sources and expenditure heads for the nine models. What emerges clearly is that a number of NGOs have also moved to charging user fees and the models charging user fees are able to fund their running costs and also generate surpluses.
Those not charging user fees have to depend heavily on contributions from the community or other stakeholders. Another important point that emerges is that the organisations which have established themselves and earned a good name can also generate high revenue through donations or services. While these raise a number of issues and provide a number of pointers for the lessons that are to be translated for public policy and finance here, we next move to an analysis of scaling up the implications of the costs, before discussing the policy implications in the next and final chapter.
Donations and user fees
User fees and investments
Aid and user fees
Donations, aid, user fees and contributions
Donations and contributions
User fees
User fees and investments
No provision
No provision
Aid, user fees, out-of-pocket, collaboration
User Fees and collaborations
User fees
Aid and user fees
User fees
Aid, contributions and user fees
Out-of-pocket
Out-of- pocket and contributions User fees, outof-pocket and investments
Aid and user fees
Donations, outof-pocket and contributions
User fees, outof-pocket and investments
Out-of- pocket and grant
User fees and collaborations
Donations
User fees, aid and contributions
Donations and user fees
Contributions
User fees
Donations and user fees
Contributions and donations
Aid and Contributions
Out-of-pocket
Donations
Donations and contributions
Donations, user fees and out-of-pocket
Donations and contributions
Donations
Donations and user fees
Donations
space and resources
Nutrition and auxiliary services
TLM and curriculum development
Pedagogy Training
The analysis clearly shows that though there are obvious lessons emerging, there are also limitations that one faces when trying to seek lessons from small models funded from diverse sources for publicly funded programmes serving largely the poorer sections of the society. However, here we list the lessons and raise some emerging issues and dilemmas while we translate these into policy suggestions in the concluding chapter.
An unambiguous lesson that emerges is the need for diverse cost models for diverse target groups and locations as one size does not fit all. For instance, as in case of UPCS, it indeed makes sense to have a full-day model with no creation of permanent capital assets that serve children of construction workers or other similar target groups where parents, especially mothers, also work full days for a period of time after which the site becomes dysfunctional. The period for which a site remains active and functional depends on what kind of site it is: construction, brick kiln, sugarcane harvest and so on.
Similarly, the models serving children in urban slums in the hearts of cities might function without the creation of capital assets such as building because space is both costly and rare to find. Provision for an amount that is commensurate with prevalent rents in particular areas is critical for such locations. On the other hand, creation of separate spaces and physical facilities meant for ECCE services in rural areas where space is available makes greater sense.
In this context, another lesson that emerges from two models, SSUP and UPCS, is that even in urban areas, existing public and private institutions such as universities and other such organisations can be tapped to provide land and building facilities for ECCE centres not only for their own employees’ children but also for neighbourhood population groups. Space for a variety of activities and play is an important enabling component of early years’ education and care, and therefore, the paucity and high cost burden in urban areas can partly be addressed though such provisions.
An important point often raised in the context of public services is that if those are meant only for poor people, the quality remains poor. If that is taken as being somewhat true, this kind of measure could offer one way of breaking this divide. The provision by universities could initiate this, enabling children from different classes and communities to attend ECCE centres together. Although given the present trend of the entire middle class moving away from public education and health services, it is a major challenge to break the divide. However, measures such as these could help in moving in that direction.
Another lesson that emerges is that high quality and stimulating ECCE services require certain fundamental provisions, as documented earlier in our framework derived from the literature and these provisions have significant cost implications. Considering our experience of homogenous and standardised norms for provisioning becoming rigid and often unsuitable for diverse contexts, it makes greater sense to define non-negotiables for space and physical environment (minimum space per child – not less than…; playground, ventilation, light, etc.), teachers’ qualification and quality, range and kinds of TLMs, and pedagogy.
A clear definition of ‘non-negotiable’ norms would ensure that every centre has to have that and a list of ‘non-acceptable’ would ensure that practices known to have adverse impacts on the stimulation and learning in early years are not included. This would also allow creative freedom by not defining everything that is to be done, while developing clarity regarding what is not to be done.
Teachers’ quality and qualifications could also include respectful and accepting attitudes towards the multilingual backgrounds of children even in the context when the official medium of instruction may include only one or two major languages. This is relevant in both urban areas where migrant populations come from diverse language contexts and rural areas where groups may have diverse home-languages (e.g., tribal areas). Sometimes, even the same language is spoken differently by different communities and children could be allowed to use their version before moving to whatever the ‘standard’ version demands. Also, immigrant groups also come in for harvest and other occupations in rural areas as well, making respect for a variety of languages critical there as well.
The issue of teachers’ qualifications also brings forth the issue of teachers’ salaries. As mentioned earlier, the salary levels are low for most models, and in some ways comparable to what ICDS workers receive given that those who receive slightly higher salaries in these models also have higher qualifications. UPCS is one exception which pays higher salaries despite the fact that the qualifications are not as high. Even in this case, the remuneration is limited only to minimum wages for skilled labour. Therefore, considering the demanding and professional nature of the job, the minimum remuneration must be equal to minimum wages for skilled labour for that much time. Time estimations should include all the responsibilities and expectations from the person and not be limited to teaching hours. Also important is to add the component of purchasing power parity in terms of additional allowances for those working in cities and high-priced locations.
The issue of languages is also linked with the choice of pedagogy and the kinds/range of TLMs. The analysis shows that models that came across as more vibrant and lively had also invested more on TLMs and pedagogy training and also followed a more research-based approach towards the development or purchase of TLMs and monitoring of processes. Therefore, adequate cost provision for such interventions is also necessary. The material found in the field sites ranged from sticks and stones in the CBCDC model to a smart board with a projector in the CUSP model. LUPS, the private, profit-oriented initiative, focuses on technology-based aids and this is a major attraction for parents. It is important to have clarity regarding TLMs as well. What is suitable and what is not suitable at this age must be included in the list of non-negotiables and non-acceptables.
The teacher training in almost all the organisations was done with the help of external consultants. Regular training backed by research and supportive monitoring helps in better results. The literature clearly says that and field visits validate it. Therefore, adequate cost provisions are critical but also as important is to define the kinds of training that could help and the kinds that would not. Mere provision for training does not help if it is not suitable and sustained though other support measures.
Nutrition has long been a vital component of the early childhood care policy in the country and also a need given that India still has a disproportionately high burden of malnourished children. Among these models, only UPCS follows the norm of providing food containing defined nutritional value and has the highest per child recurrent expenditure on this head. Per child recurrent expenditure on food
and nutrition is relatively lower in another community-based model, CBCDC, and is dependent on community labour, knowledge and contributions to strengthen the component. Community members provide a number of locally used and available nutritious food items and also take turns in cooking, pushing the costs for this component up when all these are monetised. Community involvement with food also facilitated mobilisation around desired parenting practices at home and also for appropriate pedagogical practices for young children.
Both of these provide important pointers for policy: it is important that adequate cost provisions are made for food and nutrition and it is also perhaps important to design mechanisms for engaging communities in this process in a manner that they are also made accountable to strengthen both education and nutrition elements of early years through their parenting practices. This brings in the aspect of community focus and mobilisation. Only two models, the UPCS and the UPPS, have clearly made separate financial provisions for community education/engagement, though most models do expect teachers to undertake this exercise as part of their responsibilities. Making separate financial provision helps in establishing the need and importance of such mechanisms; otherwise the component can easily be left out. However, it is equally important to understand the rationale for this and make provisions flexible: for instance, learning from CBCDC, in large programmes, some elements of the food and nutrition can be left to the local community collectively to include what is locally available and also considered nutritious. This allows space for both local knowledge and participation thereby leading to ownership. Group of community leaders like the Saathi Samuh in the UPCS model or involving the PRIs in the organising activities of community engagement, backed by financial allocations, have helped in sustaining the ECCE agenda even after the organisation’s exit from the site, in both rural and urban contexts. Other examples come from the CUSP model, where parents were asked to accompany teachers and children on the field trip to help manage the kids and in the SSUP model, where parents volunteered to help organise health camps and field trips.
Two major challenges emerge in the context of scaling up: (i) the centralisation-decentralisation dilemma, and (ii) resource mobilisation.
The lessons learnt clearly suggest the need for a decentralised approach and context-specific models. But this poses a challenge for large-scale interventions where the need for standardisation is critical for the sake of accountability and efficient management.
Therefore, what appears to be the best solution is to adopt a middle path: a combination where decentralised approaches are encouraged within a common framework of non-negotiables and nonacceptables for physical and process norms and a list of ‘basic principles’ for financial norms for various locations (rural, urban, cities) and contexts (migrant children, tribal children, etc.). The list of basic principles could include aspects such as not less than minimum wage for salary, market contextual provision for rent, etc.
The issue of monitoring also emerges as a major challenge in scaling up. A decentralised approach that engages both ‘experts’ and community may be the best solution there. If provisions are made for periodic monitoring, leading to sharing of observations with the community, leading in turn to emergence of community groups as local support groups, this could strengthen the functioning of large-scale, publicly funded initiatives as well.
Teachers’ quality and qualifications could also include respectful and accepting attitudes towards the multilingual backgrounds of children even in the context when the official medium of instruction may include only one or two major languages.
Collaboration with established and proven NGO initiatives and coalitions for expert service, technical resource support and research is already not so uncommon in some states but can be further strengthened through institutionalised mechanisms.
Most models depend on user fees as a major source of revenue. Private donations are another major source. Considering that the nature of ECCE services is that of public good, it is not advisable to include user fees. Even if the initiative is meant for all, poor and non-poor citizens, it should be kept free, in order to retain and respect the public good orientation of the service. The state, both union and state governments, must find resources to fund ECCE initiatives through public resources.
The government of India before introduction of Goods and Services tax (GST) charged education and Swachh Bharat cess and collected large amounts of revenue that goes to an indivisible pool: it is not necessary for the union government to share that with states. Considering the important role that ECCE plays in (i) both participation and learning of children in higher classes, and (ii) health and nutrition status of individuals throughout life, a part of these resources must be systematically diverted to ECCE initiatives.
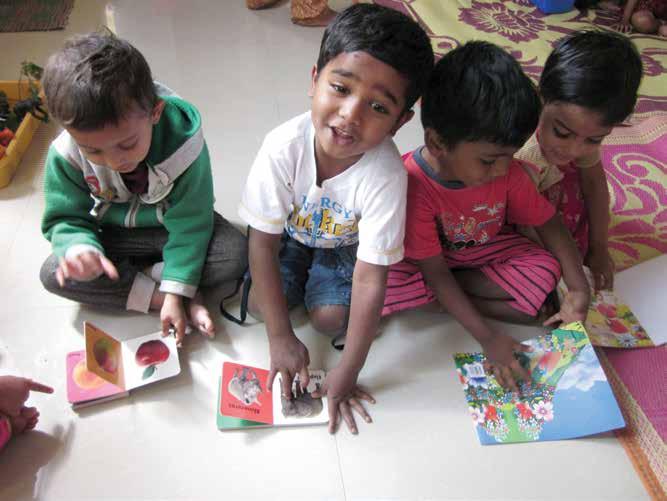
A common method increasingly used these days within the ambit of public service is the publicprivate partnership (PPP). The idea is that both public and private institutions come together to fund and support initiatives of joint interest. However, the experiences of PPPs in most cases, especially in the social sector, shows that public resources are diverted for private benefits. Schools and
hospitals in Delhi are one set of examples which were bound by law to admit 20 per cent of students and patients free of cost. This was never implemented till the High Court intervened (Soni, 2013). And even then, it often turned into elite schools running evening schools for poor children rather than mixed schools as envisaged by the law. Also, a number of examples exist where private partners enter public schools in the name of quality improvement and end up just serving their own interests, using public resources by making it compulsory to buy all the products (learning aids etc.) that they are selling (Jha, 2016).
Therefore, considering that private entities are aiming at profit which clashes with the objective of public good-based services, it is best that such partnerships are barred. Instead, the state might think of initiating public funds for ECCE where resources can be pooled through several mechanisms including donations and mandatory contributions. This would call for the quality of public ECCE services to be reliable, on one hand, and appropriate institutional mechanisms and processes be developed on the other.
The next and final chapter will go deeper into these implications and dilemmas, along with the analysis of the present budget/cost provision for ICDS, arrive at conclusions and provide suggestions for reform in the ICDS programme and costs.
Tools for STC-ECCE Study
Date:
Name of Field Investigator:
Name of Centre/Headquarter:
:
Basic details of the ‘Model’ as well as all data available from secondary literature to be filled in before going to them and some of these to be confirmed at site-visit:
for
programmes
b. What has been seen as practical over a period?
What is the size of the centre - _____ class rooms, _____ sq. feet play area; ___ sq. feet kitchen; _____ sq. feet storage area, etc., and whether there are variations in different centres?
Is the full enrolment capacity of the centre being utilised?
What is the difference between the enrolment and participation rates? Do you need special effort to enroll/enable participation? What are these and how successful are they?
What are the most significant challenges you face? How have you tried to solve them?
12. When was the programme started?
13. Did it start here in this state or elsewhere? Tell us a little about how it evolved
14. What is the legal status of the entity? registered as a a) not-for-profit society; b) charitable trust c) minority institution; or d) for profit company
15. Are any members of parents/community/government represented in the governing body?
16. What is the funding arrangement? a) donations to corpus; b) donations / contributions for specific activities/projects; c) government aid; d) contributions in kind by community / parents; e) user fees; f) grants; and g) a combination of all /some of the above
17. If you charge fees, they are fixed in such manner that fees:
a. cover the operational (variable) cost; b. are what you think parents can afford;
c. are what other similar providers charge? d. do you factor in any other costs?
18. What are the fees per child paid by parents?
19. Are there any additional costs incurred by parents such as for meals, uniforms, books, play materials, etc.?
20. What is the total cost of the programme? (Preferably the Annual Budget along with expenditure data if available)
21. What is the per centre cost?
22. What is the per-child cost of running the programme?
23. Do you think, at current level of funding, The quality of services provided is satisfactory / adequate?
a. The quality of services is somewhat inadequate but could be improved with more funds? What would be the additional cost per child?
What are the strengths of your programme and where do you think there still are possibilities of improvement?
Is there an optimum size for the programme that would help break even?
Is the programme scalable? What are the challenges for scaling the model?
Anything else you would like to share?
Is the centre located on own property/rented property/property being used with permission of owner without payment?
If it is own property, how was the land acquired? a) purchased; b) provided free of charge by a donor; c) provided by the government / panchayat? (If there are other centres, how was land got for the other centres)
If land/ premise was purchased, when was it procured and at what cost?
How was the acquisition funded - through donations; government aid; charges to parents?
If premises are not owned – are they rented or provided free of charge by parent(s)/ community?
What is monthly rent?
How is the expense on monthly rent met? from interest on corpus; from fees charged to parents; subsidy from government
Were there any specific construction costs incurred especially for making the centre childfriendly/accessible to CWSN? If yes, what were these costs?
What were the costs incurred for construction of toilets, water tanks, kitchen, etc.?
Were there any norms considered for construction of toilets (i.e., how many toilets per group of children?) Were any cost considerations taken into account for arriving at these norms?
How were these costs met? through donations, through fees charged to parents; through government aid, grants
Would construction costs become more reasonable through scaling? If yes, what would be the optimal size required for this?
What costs were incurred on outdoor play material
How has this been funded - a) through donations; b) charged to parents; c) through government aid?)
Would costs on outdoor play material become more reasonable through scaling? If yes what would be the optimal size required for this?
If nutrition is one of the services, what is provided? snacks once a day; in addition, meals once a day
What is provided in snacks and meals –in terms of grams/calories per child?
How many teaching, care staff (eg: cleaners, attendants), managerial staff (eg: receptionists and office staff) are there per centre? Additionally, how many regular staff members are involved in the programme as supervisors, coordinators, managerial etc. (that may not be present at the centre)?
What are their respective sex, qualifications and salaries?
What is the ratio of each type of staff to the number of children? How were these norms arrived at? Was cost a consideration in fixing the number of staff?
What are the qualification requirements for each type of staff? How were these qualifications fixed? Was cost a consideration in fixing qualification criteria for each type of staff?
49. What are the salaries of each type of staff (Include any social benefits such as EPF, insurance, etc. paid by the employer)? How were these salaries decided? Was cost a consideration for fixing salaries?
50. How is the expenditure the salaries for staff been met (e.g., through donations, through charges to parents; through government aid; through grants?)
Can the cost of salaries be made more reasonable through scaling? If yes what would be the optimal size required for this?
52. Was there any special trainings provided to staff? (Please mention type of training, number of training, and for which staff?)
53. What is the training and support model: how many days, divided into how many spells, how and where is it delivered? Is there any follow up done? How?
54. Was the content for training prepared in-house or were specialists/consultants engaged? What were the costs incurred on development of training approach and materials? What are the training organization costs involved?
55. What is the rationale for organizing the classroom space as has been done within the programme (e.g. circular seating on mats on the floor; as various activity corners; as within conventional elementary classrooms on desk and bench, facing the teacher, etc.)? Was cost a consideration in this decision?
56. What were costs incurred on procurement of benches, desks, mats, long work tables, etc.)?
If the class room furniture is rented, what is the rent paid?
58. How was the cost of class room furniture funded? through donations; through charges to parents; through government aid?
59. Would cost on classroom furniture be made more reasonable through scaling? If yes what would be the optimal size required for this?
60. Is there a specific designated area for nap/rest time?
61. How is this area organized? (i.e., do they have mats, blankets, mattresses, etc.?)
62. What specific costs were incurred on providing children’s nap/rest time? (E.g. on procurement of mats, blankets, etc.)?
How is the material divided per group / class (i.e., how many of each type of material is present for a given number of children?)
64. Was the cost of material for children’s nap/rest time off-set (e.g., through donations, through charges to parents; through government aid?)
Has/Can costs for making provisions for children’s nap/rest time be made more effective through scaling? If yes what would be the optimal size required for this?
66. What kinds of learning material are used at the centre(s)? (Name/list ALL material such as books, audio-visual devices, blocks, picture cards, toys, games, recycled items etc.)
67. How have these been procured? a) developed in-house/through consultation with experts/ workshops/training; b) purchased readymade; (c) donated
68. What was the cost of development (if developed) and what is the rough cost of reproduction?
69. What are the costs of procurement of the material (total and/or each type of material) per centre?
70. What is the periodicity of material development and material procurement?
71. What are the languages used in curricular material? What were the considerations while selecting the language? Does the choice of language lead to any extra costs in development and procurement of material (for example translation, printing costs)?
72. How is the material divided per group/class (i.e., how many of each type of material is present for a given number of children?)
73. How was the cost of developing/procuring material funded - through donations, through charges to parents; through government aid?
74. Would cost of developing / procuring learning material be made more reasonable through scaling? If yes what would be the optimal size required for this?
75. What languages are used for teaching purposes in class?
76. How is the presence of more than one language handled in classes? Is language training provided to teachers? What are the costs incurred on this?
77. Are there any specific guidelines or methodology that the caregivers/teachers practice, or any fixed set of goals/outcomes which they are expected to deliver?
78. How and by whom were these guidelines developed, and what were the costs involved? Are these costs included in the training cost of teachers?
79. How was the cost incurred on developing guidelines/methodology been funded - through payment from parents; donations; government aid?
80. Are there performance incentives for caregivers/teachers? What are the costs involved in such incentives and how are they offset (donations; fee payment; government aid)?
81. How is teacher performance supervised/assessed/reviewed? Does this process involve extra costs? (e.g.: through hiring professionals, regular performance reviews, frequent workshops) Is this cost offset?
82. Are any extra provisions available/made for children with special needs (trained teachers/ counsellors/curricular material/extra teaching hours)? What are the costs involved and are they offset?
83. Is the progress of the child documented? In what form and how often? Are extra costs incurred, over and above the salary of the teacher/caregiver?
84. Is extra time/attention or special curriculum provided for children identified with special needs? What are the costs incurred and is it offset (fee payment by parents)?
85. Are parent-teacher meetings held? How often? What are the organizational costs incurred?
86. Is any kind of training programme/awareness camp/educational workshop conducted exclusively for parents?
87. What are the organizational costs of such programmes?
89. How were these costs financed (through payment of fee by parents, donations, aid etc.)?
90. Are home visits or home-based interventions carried out by The ECCE centre? What are the total costs incurred (travel, material, salaries, etc.)?
91. How are home visit/intervention costs financed? (through fee payment by parents, donations, government aid)
92. Can costs for home visits and interventions be optimized through alternative models? What would be the costs incurred on such alternatives? To what extent would this contribute to savings?
93. Are parents involved in management/governance/planning/teaching activities? Is this on a voluntary basis or paid work?
94. Do parents contribute in terms of material resources/funds? How does this offset overall costs?
95. How can parent involvement be scaled and optimized? How would such scaling contribute to savings?
96. What were the motivations behind involving the community in the ECCE centre? (personal beliefs, donor imposed, cost, resource constraints, combination of these or any other factors)
97. Does the community participate in mobilizing resources in the form of funds, curricular and infrastructural requirements, volunteers, advocacy etc. for the ECCE centre? Is cost a criteria for involving the community?
98. To what extent is the community involved in the ownership and management of the ECCE centre (teaching, caregivers, administration, governing body, financing, planning, curriculum and pedagogical design and other such forms of involvement)? Is this paid or voluntary work? What are the costs incurred? Does voluntary work contribute to savings?
99. If the ECCE centre is community-owned, what are the overall costs incurred? If it is not community-owned, but involves participation, what percentage of costs is borne by community members?
100. Are any other services offered at the ECCE centre, apart from those that are educationrelated? What are these services? (health checkups, meals, nutritional supplements, immunization, referral services etc.)
101. What is the frequency of provision of such services?
102. Are these services provided by the ECCE centre itself, or through collaborations with other organizations? How are the costs shared among collaborating organizations?
103. What is the cost per child incurred for providing these services? Is this cost offset (through fee payment by parents, donations, government aid, NGO aid, grants etc.)?
104. Is your centre registered with some state-level authority? If yes, which one or under which Act? What were the various costs involved in the registration of the same?
105. Do you have a separate monitoring committee for your team? Who are the various
members on it? Are they permanent employees/visiting board members/external agency? What are the costs incurred on hiring them?
106. Which stakeholder undertakes inspection visits for your centre? How are the various costs accounted for in the process (i.e. transport, preparing reports, etc?)
107. What kind of monitoring framework is used to evaluate the functioning of your centre? What are the various methods deployed to collect data on the same and how are the respective costs accounted for?
108. Are there any innovative tools developed by you to track the progress of your centre? Please mention both the fixed costs (for developing) and recurring costs (for maintaining) that were incurred on them.
109. Are there any mechanisms in place to address specific grievances of the beneficiaries such as a toll-free number or a specific committee? What was the cost made on implementing these mechanisms?
110. What are the various kinds of reports prepared by your centre and the costs involved in the process?
Name of Organization/Centre:
Date:
Field Investigator:
FOR PARENTS (If conducting FGD, individual answers to be recorded for questions 1-8)
what
for
what are the
to
(e.g.,
for all of
they
13. What financial costs do they have to bear for each child for pre-school education? (List by educational type, and including any form of financial cost on fees, building fees, donations, uniform, textbooks, etc)
14. 15. What other forms of contribution do parents make in relation to their children’s ECCE (e.g., contribute in kind, such as vegetables for mid-day meals, contribute through voluntary services at the centre, contribute in terms of material for pre-school education, etc. To be noted for all of their children and types of institutions they engage with)
15. What aspects of programme are they dissatisfied with and why? (To be noted for all their children and each type of institution they engage with)
16. What are the various responsibilities you are entrusted with for maintaining reporting data?
17. What are the expectations of the parents from the ECCE centre?
Name of Organization/Centre:
Date:
Field Investigator:
Access to centre (safe, clean, approachable)
Type of building (e.g., shed, independent house, building, independent centre within school premise, etc.) Describe the building and approximate size.
No. of rooms in the centre (specify type of room - i.e., teaching-learning area, play area, kitchen, storage area, etc.)
a. No. of classes/batches in centre
How are the batches grouped? (e.g., age wise, ability wise?)
No. of children per class/batch (boys / Girls)
multi-grade teaching present, note number of children in each group and the number and range of the age/ability groups)
How many teachers / teaching staff / childcare professionals are present per centre?
Specify how many teachers / childcare professionals are present for one class/batch
Teaching staff qualifications
How many support staff are present at the centre? (caregiver staff such as helpers, cleaning attendants, nurse etc.)
How many office staff / administrative staff are present per centre?
Space within each classroom (in feet)
How is the space within the classroom organised? (e.g., as different activity corners; like a regular classrooms with desks and benches; circular with children seated on mat, etc.)
Is the room well-lit and well ventilated? Are there displays on the walls? What kind of displays, and are they visually stimulating? How are items organized/stored within the classroom and how accessible are these to children? Describe the classroom in detail.
Space outside classroom/ play area (in feet)
for
Is there a time-table and is it displayed/organisation of activities (list all kinds of activities undertaken and the time spent on each; describe how the day is organised. Include activities for school readiness, cognitive stimulation, sensory stimulation, fine and gross motor stimulation, socio-emotional learning, hygiene)
Describe/ list in detail all the learning material available (including material for school readiness, cognitive stimulation, sensory stimulation, fine and gross motor stimulation, socio-emotional learning, hygiene)
No. of toilets, type of toilets and whether separate for children and staff members
(Specify if there are separate toilets for girls and boys; special toilets for CWSN)
Provisions for water (e.g., corporation water sourced by taps; borewell / well; bought from tankers; water not available within premise and has to be sourced from elsewhere)
(If water sourced from elsewhere specify from what distance water has to be brought)
What provisions for drinking water are available at the centre?
Is any form of nutrition provided as part of the programme?
If yes, describe what is provided?
What facilities are present to provide the nutrition component (e.g., kitchen with dimensions; gas, utensils, plates and cups, etc.; storage area for food grains)
Any provisions for nap-time (e.g., blankets, beds, pillows, etc.)
strict,
Type of employment (permanent/contractual/daily wage/voluntary)
and Professional Qualifications
Selection process (Criteria/application/interview/demonstration of skills etc)
12. Employment benefits (medical insurance, EPF, housing, incentives etc)
13. Does the employee belong to the local community, if yes, was there any specific rationale behind selecting a community member? Was cost a consideration?
14. Did the employee undergo any training process prior to induction? What was the duration and content of the training? Was there any hands-on component? Is the training process a continuous one, if yes, what is the frequency?
15. Is the performance of the employee assessed or reviewed in any manner? With what frequency? Are there any outcome-based incentives?
16. How satisfied is the employee with the job and the functioning of the ECCE centre? What are they dissatisfied with and why?
17. What are the challenges perceived by the employee at the ECCE institution? In what ways are/can these challenges be dealt with?
18. What languages is the employee familiar with? Which languages are employed in the classroom/crèche?
19. Do all enrolled children attend regularly? If not, what are the possible reasons for nonparticipation?
20. How many children are present in one class? What is the age distribution within the class? Are the children divided into groups? What is the basis for grouping children in a particular manner?
21. What are the facilities/services for children between 0-3 years of age and 3-6 years of age?
22. In what ways is the employee involved in the provision of these services (care giving, teaching activities, health checkups, nutrition, immunization etc.)?
23. What is the curriculum and curricular material available for children? Is the employee involved in designing the prescribed curriculum? How much autonomy does the employee feel they can exercise in framing curriculum or obtaining curricular material according to the needs of the children?
24. What are the teaching strategies employed in class? Are these strategies prescribed beforehand, or developed/improvised during the in-class process by the teacher? What is the rationale behind specific strategies (games/activities etc.)?
25. What does the daily routine within a classroom comprise of? Is there a process of planning (daily, weekly, yearly) for classroom activities? Who is involved in this process?
26. Is the progress of each child monitored/documented? Are tests/exams held? What are the indicators along which progress is measured?
27. Is information regarding child’s progress shared with parents? If yes, how frequently?
28. Does the caregiver interact with the parents? How frequently? What is the rationale behind the engagement? What are the concerns of parents, if any, and how are these addressed by the teacher?
What is the kind of diversity present in class (language, socio-economic background, abilities etc)? Does the diversity pose any challenges? How does the caregiver cope with these challenges?
Is there a process for identifying individual developmental needs of children? What is the follow-up strategy in such cases?
Are there children with special education needs in the classroom? What are the provisions available for such children?
How are the children and their interactions supervised in case any problems arise?
Does the caregiver conduct home visits or organise interaction sessions with parents? What is the rationale behind such a programme? Are any home-based interventions carried out? If yes, what kind?
Is a helper assigned to the caregiver in the classroom? What are the responsibilities of the helper?
Does the caregiver play a role in budgeting and allocation of resources in the ECCE centre?
Does the caregiver feel that the children are adequately provided for at the ECCE institution? In what ways could it be improved?
What are the various kinds of records and registers that you are expected to maintain for monitoring the progress of your centre?
Does your centre have inspection visits? If yes, by whom and how often? What kind of reporting mechanisms are in place to be accountable to these inspections?
What is the nature of the relationship shared between the inspector/supervisor and the caregiver/teacher?
relationship
heads
and Water Charges and Repair and maintenance (27,892)
Materials (teaching
& curriculum
and
Facilities (furniture
Facilities
learning materials (32832)
Food Material and Utensils (193800)
of Ground Staff (Caregiver, Teacher, Principal and Helper) (213772)
Furniture, Material and Indoor play material (17784)
Building Rent (37848)
furniture for naptime (12768)
Doctor Visits, First Aid Kit etc (44415)
head
centred Practices
include: trainee food and transportation (5700)
Materials (teaching learning) and curriculum
and auxiliary facilities
Teaching- learning materials (10000) Curriculum –Data not available
Food Material (No Provision)
of ground staff (teacher, helper)
material and
play material
for
is
management staff
of
staff (supervisors
Evolution of process/component framework cost relationship
Misc.
Travel
Training Community/ parent- centred practices
Materials (teaching learning) and curriculum
Nutrition and auxiliary facilities
Salary
Capital goods Facilities (furniture and equipment)
/ land
Repair and maintenance and water and electricity charges (100000)
Teaching-learning materials (Books and Notebooks) and indoor Play Material (158100+15000) CurriculumData not available (developed in-house)
Expenditure on snacks (1860)
building
components
Salaries of ground Staff (teacher , helper) (1295955)
Basic Furniture, material (96000)
Building rent (272000)
Teaching
Play material (80000)
Play area /open space rent (239760)
Playing
Eating
Basic furniture for naptime (4800)
Bus rental charges for field visits/ Health Checkups (16000)
Sleeping
of Process/component framework-cost relationship
Misc.
Travel
Community/ parent- centred practices
Training
Materials (teaching learning) and curriculum
Nutrition and auxiliary facilities
Repair and maintenance and water and electricity charges.Other office expenses include office supplies, telephone, internet charges etcMisc. expenses (198578)
Travel Cost (6558)
No provision
Capital goods Facilities (furniture and equipment)
Teaching learning materials (books and notebooks) & uniform (383600) Curriculum(content development and execution) (46154)
No provision
Salaries of Ground staff (teacher, helper) (942632)
Basic Furniture, material (68372)
Building rent (345793)
Trainer’s remuneration and material cost (34154)
Play material
Play area rent (25804)
furniture for naptime (No Provision)
The recurring cost in the analysis consists of the sum total of six different components viz, i) Infrastructure, Space and Resources; ii) Salaries (teachers/caregivers/staff); iii) Nutrition and auxiliary services; iv) Learning material and curriculum development; v) Teaching/Pedagogy Training vi) Parent/Community-centred practices. As per our analysis, the cost required to run an ECCE centre (which include UCM and balwadi) is Rs 8,06,329 per annum and per child cost is Rs. 21,219 per annum (if number of students per ECCE centre are 38). Details of method used for estimating unit cost (per centre and per child is given below) is given below.
Unit Infrastructure, Space and Resources
Per centre per annum Recurring costs
Per centre per annum a) Building rent 37848
Per centre per annum b) Rental value of basic class furniture, material, equipment and vehicle etc. 17784
Per centre per annum c) Rental value of outdoor play material
Per centre per annum d) Rental value of basic furniture for naptime 12768
Per centre per annum e) Electricity and water charges 27,892
Per centre per annum f) Cost incurred in maintenance and repairs
Per centre per annum Playground rent Others, If any Total 96292
Per centre per annum Total no. of students in ECCE Centre 38
Per centre per annum Per child per annum (ECCE centre) 2534
For calculating infrastructure, space and resource per centre cost for the UPCS, data is gathered from costing and management survey and UPCS cost benefit analysis. UPCS model caters for student in three age groups i.e. UCM 0-3-year olds, balwadi 3-5-years old and bridge course for 6-12-yearsold. This means there are three classes in the centre, out of which (i.e. UCM and balwadi) two are specific to pre-school sections. Therefore, two thirds of the space- related costs are attributed to ECCE centres.
UPCS run 14 centres and provides holistic child care to 801 children (on an average, each centre has 57 children) which includes bridge course students. For separating bridge course students from UCM and balwadi a proportionate formula is used.
Total number of students in bridge course= Number of Children Under Bridge Course Total No. of students in Classroom
x Total No. of Students = 25 74 x 801 = 271
Average number of students under ECCE centre = Total Number of Students – Total Number of Students Under Bridge Course Programme No. of Centres = 801 – 271 14 = 350 14 = 38
For the costing analysis for the UPCS ECCE centre, only the pre-primary group is considered which is the 0-6 age group.
For calculating ECCE centre cost = Total Cost on Recurring Component Total No. of Classes in the Centre/School x
Total No. of Classes under ECEE Centre = Total Cost on Recurring Component 3 x 2
For cost analysis of the UPCS ECCE centre, only the pre-primary group is considered which is the 0-6 age group.
Building rent = Total cost incurred on building Rent 3 x 2 = 56772 3 x 2 = 37848
Rental value of setup cost = Total cost incurred on setting up UPCS Centre 3 x 2 = 56772 3 x 2 = 17784
Rental value of basic furniture for naptime = Total cost incurred on furniture for nap time 3 x 2 = 19152 3 x 2 = 12768
Electricity and water charges = Total cost incurred on Electricity and Water 3 x 2 = 41838 3 x 2 = 27892
Salaries of ground staff (teacher, supervisor, helper) 213772
Per centre per annum
Salaries of management staff (admin, accountant, etc.) 167762 Welfare expenses Others, If any Total 381534
Total no. of students in ECCE Centre Per Annum 38
Per child per annum (ECCE centre) 9538
For calculating salaries and allowance per centre cost for the UPCS, data is gathered from the UPCS cost benefit analysis and salaries and ground and management staff is used for the calculation. For our estimation, two-third of salary allowances-related cost are attributed to ECCE centres. This assumption for computing costs incurred on salaries and allowances is similar to one which we have outlined in first section i.e. infrastructure, space and resources.
Salaries include salaries of teachers, support staff, supervisors, management staff and MIS-related costs. Any other staff welfare measures are part of the overall salary component. Wherever separate salaries are available for the ECCE sections, that is what is included. In the absence of that, it has been assumed to be the same for teachers in all classes and estimated accordingly for the two age groups (UCM and balwadi). In this case, we have used total expenditure incurred on salaries and allowances as separate salaries for ECCE sections were not available and it has been assumed to be same for teachers in all classes.
For costing analysis UPCS ECCE centre only, the pre-primary group is considered as the 0-6 age group.
Cost incurred on salaries and allowances (ECCE centre)
= Total cost on Salaries and Allowance Total No. of Classes in the Centre/School x Total No. of Classes under ECCE Centre
= Total cost incurred on Salaries and Allowance 3 x 2
Cost incurred on ground staff salary
Total cost incurred on Salaries 3 x 2 = 320658 3 x 2 = 213772
Cost incurred on management staff salary
Total cost incurred on Salaries 3 x 2 = 251643 3 x 2 = 167762
Per Child per annum
UPCS
Nutrition and supplementary services 193800
Auxiliary services 44415 Others, If any Total 238215
Total no. of students in ECCE Centre 38 Per child per annum (ECCE Centre) 5955
Data for nutrition and supplementary services and auxiliary services component is collected from UPCS management interviews. The nutrition and supplementary service subhead includes expenditure on food material and fuel whereas auxiliary services include expenditure on health i.e. doctors visit, check-ups, medicine, first aid kits and weighing machines. For our estimation two thirds of nutrition and auxiliary service-related costs are attributed to ECCE centres. This assumption for computing costs incurred on nutrition and auxiliary services is like one which we have outlined in first section i.e. Infrastructure, space and resources.
Cost incurred on Nutrition and auxiliary services (ECCE centre)
= Total cost incurred on nutrition and Auxiliary Services
Total No. of Classes in the Centre/School
Total No. of Classes under ECCE Centre
Total cost incurred on nutrition and Auxiliary Services 3 2 = 290700 + 66622 3 x 2 = 238215
Cost incurred on TLM (Which also includes PSE kit and flexi funds) a+b+c+d 32832
a) Books
b) Audio visuals
c) TLM
Per Centre Per Annum
d) Others
Cost incurred in curriculum development Others, If any Total 32832
Total no. of students in ECCE Centre 38
Per child per annum (ECCE Centre) 821
Data for learning material is collected from UPCS cost benefit analysis document. The Learning material sub head include expenditure on plastic blocks, puzzles, crayons, paint, paper, coloured paper, picture cards, mirror, strainer, strings, beaded strings, slate, chalks, blackboard, picture blocks, stones, wooden pieces, plastic balls, cloth balls, , worksheets, sandpit, chart paper, comb, hair oil for balwadi and plastic toys, plastic cars, plastic rings, plastic slide, mini plastic scooters, dhol, picture posters, printed posters, ball, picture books, paper, crayons, chart paper for UCM. Data for curriculum development was not available. In our estimation, two thirds of learning material-related costs are attributed to ECCE centres. This assumption for computing costs incurred on learning material and curriculum development is like the one which we have outlined in first section i.e. Infrastructure, space and resources.
Costing analysis for UPCS ECCE centre only pre-primary group is considered which is between 0-6 age group.
Cost incurred on Learning Material (ECCE centre)
= Total cost incurred on Learning Material
Total No. of Classes in the Centre/School x Total No. of Classes under ECCE Centre
= Total cost incurred on Learning Materials 3 x 2 = 49284 3 x 2 = 32832
Unit
Per centre per annum
Training 52896
Others, If any Total 52896
Total no. of students in ECCE 38 Per child per annum (ECCE Centre) 1392
Data for Teaching/Pedagogy Training is collected from the UPCS cost benefit analysis document. In case of the UPCS, annual costs incurred on training is used for computing per centre training cost. Total training cost includes costs for training resource, material and stipend to trainees. Assumption for computing cost incurred on training (ECCE centre) is similar to one which we have outlined in first section i.e. Infrastructure, space and resources.
For the analysis for UPCS centre, only pre-primary group is considered which is between 0-6 age group.
Cost incurred on Teaching/Pedagogy Training (ECCE centre) = Total cost of Training
Total No. of Classes in the Centre/School x Total No. of Classes under ECCE Centre = Total cost of Training 3 x 2 = 121148 3 x 2 = 80765
Unit
Parent/Community-centered practices
Per Centre per annum
Cost Incurred on parent-centered training programmes/ Cost incurred on PTM 20000 Cost Incurred on community-centered training programmes
Others, If any Total 20000
Total no. of students in ECCE centre per annum 38
Per child per annum (ECCE centre) 526
The total costs for parent/community-centred practices include the community communication cost (which includes parent-teacher meetings). Per centre data is gathered from the UPCS cost analysis. The assumption for estimating costs incurred on parent/community-centred practices (ECCE centre) is similar to the one we have used in first section i.e. Infrastructure, space and resources.
For the analysis of the UPCS centre, only the pre-primary group (0-6 age group) is considered.
incurred on parent/community-centred practices (ECCE centre)
Total cost incurred on parent/community centered practices
No. of Classes in the Centre/School
Total cost incurred on parent/community centered practices
The recurring cost in the analysis consists of the sum total of six different components viz, i) Infrastructure, Space and Resources; ii) Salaries (teachers/caregivers/ staff); iii) Nutrition and auxiliary services; iv) Learning material and curriculum development; v) Teaching/Pedagogy Training; vi) Parent/community-centred practices. As per our analysis of this model cost required to run a CUPS (1) and CUSP (2) ECCE centre is Rs. 6,53,681 and Rs. 20,66,924 per annum and per child cost is Rs. 9,338 and Rs. 29,527 per annum (if number of student per ECCE centre are 70). For this analysis, only three components were considered as for other head data was not available or there were no provisions. Details of method used for estimating unit cost (per centre and per child) are given below.
(land+
Cost incurred on purchase of basic class furniture, material, equipment and vehicle etc.
Cost incurred on purchasing of outdoor play material
Cost incurred on purchase of basic furniture (mats)for nap time
Building rent
Rental value of basic class furniture, material, equipment and vehicle etc.
Rental value of outdoor play material
Rental value of basic furniture for naptime
Electricity and water charges
incurred in maintenance and
per
(ECCE
CUSP is running four programmes (Learning Centre, Composite School, Father-Daughter Alliance and Education on Wheels) under their educational heads. CUSP expenditure data was available at overall project level. So, in our analysis, costs are divided among each programme in proportion to number of students under each programme. Share of each programme in total expenditure
students
Programme name Share (in %)
(1)(LKG-II)
(2)(LKG-X)
Alliance
on Wheels
Note: For our analysis programmes with ECCE model are considered i.e. CUSP (1) and CUSP (2)
of
In the CUSP case, fixed assets like buildings and furniture were not rented and therefore for estimating the annual used value of the assets, imputed rent is calculated. In this case, fixed assets (buildings, furniture etc.) were not pre-existing and have been created just for the ECCE purpose. So, we have only used deprecation rates for calculating the rental value of the assets. The rental value of basic class furniture, material, equipment and vehicle include furniture and fixtures, electrical fittings and equipment, computers and equipment, vehicles, programme training equipment and buildings under construction.
The CUSP {CUSP (1)} model caters to students between LKG to Class II. This means there are four classes in the school, of which two (i.e. LKG and UKG) are specific to pre-school sections. Therefore, half of the space-related costs are attributed to EECE sections.
The CUSP {CUSP (2)} model caters to student between LKG to Class X. This means there are twelve classes in the school, out of which two (i.e. LKG and UKG) are specific to pre-school sections. Therefore, one sixth (i.e.2/12=1/6) of the space-related costs are attributed to EECE sections.
For calculating ECCE centre cost: Total Cost incurred on recurring Component Total No. of Classes in the Centre/School x Total No. of Classes under ECCE Centre
CUSP (1) = Total Cost incurred on recurring Component 4 x 2
Total land Cost: 22259607
CUSP (1) Share = Total land cost x CUPS (1) share = 22259607 x 0.33 = 7345670
Per CUSP (1) share = Total land Cost Total No. of Centres = 7568266 11 = 667788
Total building cost: 64959474
CUSP (1) Share = Total building cost x CUSP (1) share = 64959474 x 0.33 = 21436626
Per CUSP (1) share = Total land Cost Total No. of Centres = 21436626 11 = 1948784
Per Centre/school total cost = building + land Learning centre total cost = 1948784+ 667788 = 2616572
Building rent (learning centre) = Total Asset Worth x Rate of Depreciation 100 = 2616572 x 2 100 = 52331
CUSP (1) (ECCE): Total Cost incurred on recurring Component 4 x 2 CUSP = 552331 4 x 2 = 26166
CUPS (2): = Total Cost incurred on recurring Component 12 x 2
CUSP (2) share = Total land cost x CUSP (2) share = 22259607 x 0.59 = 13133168
Per CUSP (2) share = Total land Cost
Total No. of Schools = 13133168 2 = 6566584
CUSP (2) share = Total building cost x CUSP (2) share = 64959474 x 0.59 = 38326090
Per CUSP (2) share = Total Building Cost Total No. of Schools = 38326090 2 = 19163045
CUSP (2) Total cost = 19163045 + 6566584 = 25729629
Building rent (composite school) = Total Asset Worth x Rate of Depreciation 100 = 25729629 x 2 100 = 514593
CUSP (2) (ECCE): = Total Cost incurred on recurring Component 12 x 2 = 514593 12 x 2 = 85765
Similar method is used for calculating rental value of other fixed assets
of ground staff (teacher, Principal
of management staff (admin, accountant etc.)
centre
expenses
Total no. of students in ECCE centre per annum
child per annum (ECCE centre)
For our estimation half CUSP (1) and one-sixth CUSP (2) of salaries allowances related cost are attributed to ECCE centres. This assumption for computing costs incurred on salaries and allowances is similar to the one which we have outlined in the first section i.e. Infrastructure, space and resources. Salaries include salaries of teachers, , support staff, admin, accountant, etc. whereas Welfare expenses including any other staff welfare measures over and above the wages. Welfare services in this case include employer’s contributions towards PF and gratuity. Wherever separate
salaries are available for the ECCE sections, these are included. In the absence of that, it has been assumed to be the same for teachers in all classes and estimated accordingly for the three years. In this case, we have used total expenditure incurred on salaries and allowances as separate salaries for ECCE sections were not available and it has been assumed to be same for teachers in all classes.
Expenditure incurred on salaries and allowances (ECCE centre):
Total expenditure on Salaries and Allowance
Total No. of Classes in the Centre/School x Total No. of Classes under ECCE Centre
Total salary: 24686948
CUSP (1) Share = Total land cost x CUSP (1) share = 24686948 x 0.33 = 8146693
Per CUSP (1) share = Total Salary Total No. of Centres = 8146693 11 = 740608
CUSP (1) = 740608 4 x 2 = 370304
CUSP (2) share = Total land cost x CUSP (2) Share = 24686948 x 0.59 = 14565299
Per CUSP (2) share = Total Salary Total No. of Schools = 14565299 2 = 7282650
CUSP (2) = 7282650 12 x 2 = 1213775
Similar method is used for estimating management personnel salaries and welfare expenses.
incurred
(notebooks, shoes, uniforms and
Costs incurred in curriculum development
Total
Total no. of students in ECCE Centre
child per annum (ECCE Centre)
Data for TLM and books is collected from interviews with the management and income and expenditure documents. TLM minor heads include expenditure on periodicals and stationery and books. Minor heads include expenditure incurred on purchase of course books for three subjects-
Maths, English and Hindi - and notebooks. (taken notebooks as 200 and textbook as 400). The assumption for estimating ECCE centre cost is similar to the one we have used in the first section i.e., Infrastructure, Space and resource and the salaries and allowances component.
Expenditure incurred on learning material (ECCE centre):
Total expenditure on Learning Materials
Total No. of Classes in the Centre/School x Total No. of Classes under ECCE Centre
CUSP (1) (ECCE) = Total expenditure on Learning Materials 4 x 2
CUSP (1) (ECCE) = Cost on TLM + Books
CUSP (2) (ECCE) = Total expenditure on Learning Materials 12 x 2
CUSP (2) (ECCE) = Cost on TLM + Books
Cost on books = Total no. of students per centre*cost incurred on books and notebooks = 70* 600 = 42000
CUPS (1) (ECCE) = 16675 4 x 2 = 8338 + 42000** = 50338
CUSP (2) (ECCE) = 163972 12 x 2 = 27329 + 42000** = 69329
**Expenditure is borne by parents and expenditure on books is calculated using per child cost.
Unit Pedagogy Training
Training
Per centre per annum
Data not available Total Total no. of students in ECCE centre
Per child per annum (ECCE centre)
Cost Incurred on parent-centered training programmes/ Costs incurred on PTM
Cost incurred on community-centered training programmes
Per centre per annum
Total
Total no. of students in ECCE Centre
Per child per annum (ECCE Centre)
Data not available
The recurring costs in the analysis consists of the sum total of six different components viz, i) Infrastructure, Space and Resources; ii) Salaries (Teachers/caregivers/staff); iii) Nutrition and auxiliary services; iv) Learning Material and Curriculum Development; v) Teaching/Pedagogy Training; vi)
Parent/community-centred practices. As per our analysis of this model, the cost required to run a CBCDC ECCE centre is Rs.1,58,053 and per child cost is Rs.10,537 per annum (if number of student per UBM are 15). For this analysis, only three components were considered as for the other heads data was not available or there were no provisions. Details of the method used for estimating the unit cost (per centre and per child) are given below
Land 104000
TOTAL (land+ building)) 222160
a) Cost incurred on purchase of basic class furniture, material, equipment and vehicle etc.
b) Cost incurred on purchasing of outdoor play material
c) Cost incurred on purchase of basic furniture (mats)for nap time
d) Play area 120000
a) Building rent 17773
b) Rental value of basic class furniture, material, equipment and vehicle etc.
c) Rental value of outdoor play material
d) Rental value of basic furniture for naptime
e) Electricity and water charges
f) Cost incurred in maintenance and repairs
Playground rent 7200 Total 24973
Total no. of students in ECCE centre per annum 15
Per child per annum (ECCE centre) 1665
CBCDC is a standalone pre-school. In this case, land is donated by the community and labour and masonry charges for construction of building are also borne by the community members (Rs. 40,000) and an NGO for material Rs. 60,000. For estimating current prices of different real estate agencies in rural areas (Odisha) are used like Magicbricks, 99acres, Sulekha etc and an average value is used.
However, In CBCDC, case assets like buildings are not rented and therefore for estimating the annual used value of the assets imputed rent is calculated. In this case, land is donated by the community and for construction of building labour and masonry charges are borne by the community. However, these buildings and land may have alternative uses and the decision to build or use it for education may mean the sacrifice of an opportunity cost to build something else. So, we have used interest rate in addition to rate of deprecation for calculating the rental value of the building.
ECCE centre cost estimation:
Total land cost: Total area under ECCE centre (sq. ft.) x Per Sq. ft. Rate = 520 x 200 = 104000
Class room space = 440 Kitchen Area = 80
Total Area = Classroom space + kitchen space = 520
Total construction cost = 118160
Kitchen area construction cost is estimated using ECCE centre construction cost i.e. ECCE building construction cost/Area under ECCE centre = 100000/440= 227
Per sq. ft. cost of construction = Rs227
Cost of constructing kitchen area = per sq. ft. cost of construction x Area under kitchen = 227 x 80 = RS 18160
Total cost of construction = building + kitchen = 100000+18160 = Rs118160
Total building cost = Land cost+ construction cost = 104000+118160= Rs222160
Total land under play area = 600sqft
Per sq. ft. rate = Rs 200
Playground cost = Total area under playground x per sq. ft. rate = 600 x 200= Rs. 120000
Building rent = Total Assets Worth Rate of Depreciation 100 + Total Asset Worth x Interest Rate 100 = 222160 x 2 100 + 222160 x 6 100 = Rs 17773
Playground rent (Crèche) = Total Assets Worth x Interest Rate 100 = 220000 x 6 100 = Rs 7200
For calculating salaries and allowances, ground staff salaries are considered. Ground staff salaries include the salaries of caregivers, teachers and supervisors For computing caregivers’ salaries, the Anganwadi helper’s salary slab is used as caregivers are from the community (unpaid). Wherever separate salaries are available for the ECCE section, that is what is included. In the absence of that, it has been assumed to be the same for teachers in all classes and estimated accordingly for the ECCE age group. In this case, data on the separate salaries for ground staff was available and it is included in the analysis.
Teacher Salary = 54000----- (a)
Supervisor Salary = 108000*
*Under each supervisor, there are four centres
Per centre share = Total Salary Number of Centres = 108000 4 = 27000-----(b)
Caregiver salary = Rs 24000** -----(c)
Caregiver salary is estimated using Angawadi helper’s salary norms
Salaries of ground staff= (a)+(b)+(c) = Rs. 105000
Nutrition and supplementary services
Per child per annum
Auxiliary services
not available Total
Total No. of Students in ECCE centre per annum 15 Per child per annum (ECCE Centre)
Data for nutrition and supplementary services component is estimated using ICDS nutrition norms because CBCDC gets its nutrition supplement from government. Nutrition and supplementary services include cost incurred on food materials.
Cost incurred on nutrition and supplementary services (ECCE centre) = Per Child Cost x Number of Children= 1872 x 15= 28080
Per child cost per day cost =Rs. 6 (Anganwadi Norms)
Per child per annum Cost = 6 x 26 x 12= 1872
Per centre child norm = 15
Learning material and curriculum development: Data not available
Cost Incurred on TLM (Which also Include PSE kit and flexi funds) a+b+c+d
a) Books
b) Audio visuals c) TLM
Per centre per annum
d) Others
Costs incurred in curriculum development
Others, If any Total
Total no. of students in ECCE centre
Per child per annum (ECCE Centre)
5- Teacher/Pedagogy Training- Data not available
Training
Per centre per annum
Others, If any Total
Total no. of students in ECCE centre
Per child per annum (ECCE Centre)
6- Parent/community-centered practices: Data not available
Cost incurred on Parent-centred training programmes/ Cost incurred on PTM
Cost Incurred on community-centred training programmes
Per centre per annum
Others, If any Total
Total no. of students in ECCE centre per annum
Per child per annum (ECCE centre)
The recurring costs in the analysis consist of the sum total of six different components viz, i) Infrastructure, space and resources; ii) Salaries (teachers/caregivers/staff); iii) Nutrition and auxiliary services; iv) Learning material and curriculum development; v) Teacher/Pedagogy Training; vi) Parent/ community-centred practices. As per our analysis of this model, the costs required to run a UBM and UCM are Rs. 127990 and Rs. 215906 per annum and per child cost is Rs. 6400 and Rs. 8636 per annum (if the number of students per UBM are 20 and UCM are 25 respectively). Details of the method used for estimating unit cost (per centre and per child)) are given below
Land 569850 550200
Cost of building 58988 56488
Total (land + building)) 628838 606688
a) Cost incurred on purchase of basic class furniture, material, equipment and vehicle etc. 12000 10000
b) Cost Incurred on Purchasing of outdoor Play material
c) Cost incurred on purchase of basic furniture (mats)for nap time
Total 640838 616688
a) Building rent 15330 13951
b) Rental value of basic class furniture, material, equipment and vehicle etc. 1200 1000
c) Rental value of outdoor play material
d) Rental value of basic furniture for naptime 700 600
e) Electricity and water charges
f) Cost incurred in maintenance and repairs 3000 1000
Playground rent 23580 23580 Total 43810 40131
Total no. of students in ECCE Centre 20 25
Per child per annum (ECCE Centre) 2191 1605
In the cases of UBM and UCM, land is donated by the community and labour and masonry charges for construction of building are also borne by community members and an NGO pays for the material. For estimating current prices of land government rates for industrial infrastructure development corporation and data from different real estate agencies in Bhubaneswar are used like Magicbricks, 99acres, Sulekha etc and an average value is used whereas for calculating labour and masonry costs, state-specific MNREGA norms are used.
However, in the UBM and UCM cases, assets like buildings and furniture are not rented and therefore for estimating the annual used value of the assets imputed rent is calculated. In these cases, land is donated by the community for construction and labour masonry charges are borne by the community. However, these buildings and lands may have alternative uses and the decision to build or use it for education may mean the sacrifice of an opportunity cost to build something else. So, we have used interest rates in addition to rate of deprecation for calculating the rental value of lands and buildings. Other assets like furniture etc. were not pre-existing and have been created just for ECCE purpose, so we have only used deprecation rates for calculating the rental value of the assets.
Total land cost (UBM): Total area under ECCE centre(sq. ft.) x Per sq. ft. rate = 450 x 393= 176850
Play area (UBM): Total play area (sq. ft.)*Per sq. ft. rate = 1000 x 393= 393000
Total land cost (UCM): Total area under ECCE Centre(sq. ft.) x Per sq. ft. Rate= 400 x 393= 157200
Play area (UCM): Total play area (sq. ft.) x Per sq. ft. rate = 1000 x 393= 393000
Per sq. ft. rate range between 286 (government) to 500 (real estate agency). For estimating land cost, we have taken the average i.e. Rs. 393 per sq. ft.
Average cost incurred on purchase of material = 35000
Labour Cost = Per day labour charges x No. of workers x No of days = 176 x 4 x 22 = 15,488
Average cost incurred on construction of toilet = 8,500(UBM)/6000(UCM)
Cost incurred in construction of building = Average cost incurred on purchase of material + labour cost+ average cost incurred on construction of toilet = Rs. 58988(UBM)/Rs. 56488(UCM)
Building rent (UBM) = Total Assets Worth x Rate of Depreciation 100 +
Total Asset Worth x Interest Rate 100 = 235838 x 2 100 + 235838 x 6 100 = 15330
Building rent (UCM) = Total Asset Worth x Rate of Depreciation 100
Total Asset Worth x Interest Rate 100 = 213688 x 2 100 + 213688 x 6 100 = 13951
Rent for play area (UBM/UCM) = Total Asset Worth x Interest Rate 100 = 393000 x 6 100 = 23580
Rent for Furniture and other equipment = Total Asset Worth x Rate of Depreciation 100 = (120000)(10000) x 10 100 = 1200/1000(UBM/UCM)
For other variable cost subheads, data is used from interviews with the management and financial norm documents.
UBM UCM
Salaries of ground staff (caregivers, teachers) 57600** 54000
Salaries of management staff (admin, accountant etc) 10880 21075 Welfare expenses
Per centre per annum
Total 68480 75075
Total no. of students in ECCE centre per annum 20 25
Per child per annum (ECCE centre) 3424 3003
For calculating salaries and allowances, ground staff and management staff salaries are considered. Ground staff salaries include UBM and UCM teachers’ and helpers’ salaries and management staff salaries include those of the supervisor, programme manager etc . Wherever separate salaries are available for the ECCE sections, these have been specifically included. In the absence of that, it has been assumed to be the same for teachers in all classes and estimated accordingly for the ECCE age group. In this case, both centres are standalone ECCE centres and data on the separate ground staff salaries was available and is included in the analysis whereas in the case of management staff, it has been assumed to be same for all the programmes and estimated accordingly by dividing equally between different programmes. In our estimation, only the UBM and UCM share is used.
Nutrition and supplementary services No provision
Auxiliary services Part of Teachers salary 2000
Per child per annum
Total
Total no. of students in ECCE centre per annum 25
Per child per annum (ECCE Centre)
In UBM, there is no provision for nutrition and supplementary services and the cost of auxiliary services is part of teacher’s salary component.
Data for nutrition and supplementary and auxiliary services component for UCM is collected from the social welfare board financial norms and interviews with the management . The nutrition and supplementary services include expenditure incurred on food material for providing meals (snack + lunch). On the other hand, auxiliary services include expenditure incurred on doctors’ fees and medicine kit costs.
Expenditure incurred on nutrition and auxiliary services (ECCE centre) = Total Expenditure on Nutrition and Auxiliary Services
Total No of Classes in the Centre/School x
Total No. of Classes under ECCE Centre
Total Expenditure on Nutrition and Auxiliary Services 1 x 1 = 93600 + 2000 1 x 1 = 95600
4- Learning material and curriculum development
Per centre per annum
Cost Incurred on TLM (Which also Include PSE kit and flexi funds) a+b+c+d 10000** 3000
a) Books 10000**
b) Audio-visuals
c) TLM 2000
d) Others 1000 Cost incurred in curriculum development Total 10000 3000
Total no. of students in ECCE centre per annum 20 25 Per child Per annum (ECCE centre) 500 120
Data for the learning material subhead is collected from interviews with the management (UBM) and financial norms (UCM). For UBM, the learning material minor head includes expenditure incurred on books and notebooks. For UCM, the learning material minor head include expenditure on TLM and indoor play material.
Expenditure incurred on Learning Material (ECCE centre) = Total Expenditure on Learning Material
Total No of Classes in the Centre/School x Total No. of Classes under ECCE Centre
UBM = Total Expenditure on Learning Material 1 x 1 = UBM = 10000 1 x 1 = 10000**
UCM = Total Expenditure on Learning Material 1 x 1 = UCM = 3000 1 x 1 = 3000
**Expenditure is borne by parents and expenditure on books and notebook is calculated using per child cost.
Training
Total
Per centre per annum
Total no. of students in ECCE Centre
Per child per annum (ECCE centre)
Data for teacher/pedagogy training is gathered from interviews with the management (UBM/ UCM). Teacher/pedagogy training expenditure for UBM includes two trainings (10 days of residential training) per annum and one-day trainings thrice a year. For UCM, the expenditure on training includes two trainings (two days) per annum and one-day orientation programmes thrice a year.
Expenditure on training = Cost incurred on 10-day training programme* No. of trainings per annum + Cost incurred in one-day training* No. of trainings per annum = 1200 x 2 + 150 x 3 = 2850
Total expenditure on Training = Expenditure on training x No of teachers per centre = 2850 x 2= 5700
Expenditure on training = Cost incurred on two-day training programme x No. of trainings per annum + Cost incurred in one-day training x No. of trainings per annum = 300 x 2+150 x 3 = 1050
Total expenditure on training = Expenditure on training x No. of teachers per centre = 1050 x 2 = 2100
6- Parent/community-centred practices - They have a provision of parent/community-centred practices and it is part of the teacher’s roles and responsibilities. The cost of parent/communitycentred practices is included under the salary and allowance component.
The recurring cost in the analysis consists of the sum total of six different components viz, i) Infrastructure, Space & Resources; ii) Salaries (Teachers/Caregiver/ Staff); iii) Nutrition and Auxiliary Services; iv) Learning Material and Curriculum Development; v) Learning Material and Curriculum Development; vi) Parent/community-centred practices. As per our analysis of this model cost required to run a child and parent-focused ECCE centre (which includes crèche and balwadi) is Rs. 26,75,559 per annum and per child cost is Rs. 28,769 per annum (if the number of students per ECCE centre are 70). Details of the method used for estimating unit cost (per centre and per child ) are given below.
Land 3996000
TOTAL (land+ building)) 7396000
a) Cost incurred on purchase of basic class furniture, material, equipment etc 600000
b) Cost Incurred on purchasing of outdoor play material 500000
c) Cost Incurred on purchase of basic furniture (mats)for nap time 30000
Total 8526000
a) Building rent 272000
b) Rental value of basic class furniture, material, equipment etc. 96000
c) Rental value of outdoor play material 80000
d) Rental value of basic furniture for naptime 4800
e) Electricity and water charges 100000
f) Cost incurred in maintenance and repairs
Playground rent 239760 Total 792560
Total no. of students in ECCE centre 93
Per child per annum (ECCE centre) 8522
The SSUP is a standalone centre with a strength of 93 students (crèche to UKG). To estimate current prices of land (222sqyards) and building (2000sqft), unit price data is gathered from the Registration and Stamps Department, Telangana. For calculating rental value of the land and building rates of depreciation and interest rates are charged. However, In the SSUP case, assets like building and furniture are not rented and therefore for estimating the annual use value of the assets, imputed rent is calculated. In this case, land, building and basic furniture is donated by the government. However, these buildings and lands may have alternative uses and the decision to build or use it for education may mean the sacrifice of an opportunity cost to build something else. So, we have used interest rates in addition to the rate of deprecation for calculating the rental value of the assets.
Land cost: Total open space (sq. yard)*Per Sq. yard rate = 222(or 2000 sq. ft.) x 18000 = 3996000
Building cost: Total area under ECCE centre * Per sq. ft. rate = 2000*1700=3400000
Building Rent = Total Asset Worth x Rate of Depreciation 100 +
Total Asset Worth x Interest Rate 100 = 3400000 x 2 100 + 3400000 x 6 100 = 272000
Open area rent (Play Area) = Total Asset Worth x Interest Rate 100 = 399600 x 6 100 = 239760
Rental value (furniture and other equipment) = Total Asset Worth x Rate of Depreciation 100 +
Total Asset Worth x Interest Rate 100 = 600000 x 10 100 + 600000 x 6 100 = 96000
Rental value (play material-others) = Total Asset Worth x Rate of Depreciation 100 +
Total Asset Worth x Interest Rate 100 = 500000 x 10 100 + 50000 x 6 100 = 80000
Rental value (basic furniture for nap time-others) = Total Asset Worth x Rate of Depreciation 100 +
Total Asset Worth x Interest Rate 100 = 30000 x 10 100 + 30000 x 6 100 = 4800
For other variable cost sub heads data is used from interviews with the management.
SSUP model caters for student from nursery to UKG. This means there are four classes in the school and all four are pre-school sections. Therefore, overall space-related costs are attributed to EECE sections.
ECCE centre running cost = Total Cost incurred on Variable Component Total No. of Classes in Centre/School x
Total No. of Classes under ECCE Centre = Total Cost incurred on Variable Component 4 x 4
Salaries of ground staff (caregivers, teacher, Principal and helper)
Salaries of management staff (admin, accountant etc)
SSUP
Welfare expenses
Total
Total No. of students in ECCE centre per annum
Per child per annum (ECCE Centre)
Data for the salaries and allowances component is gathered from interviews with the management. In our analysis, ground staff and management staff salary expenses are considered. In case of SSUP ground staff, salaries include those for nursery, LKG, UKG, extra support teacher, supervisor and helper.. The helper’s salary data was not available and it was imputed using MNERGA state-specific norms whereas for the management salary sub head, cost incurred on accounting services i.e. accountant salary is used. The welfare expenses head includes cost incurred on benefits like PF and ESI.
Wherever separate salaries are available for the ECCE sections, they are specifically included. In the absence of that, it has been assumed to be the same for teachers in all classes and estimated accordingly for the four years. In this case, we have used the total cost incurred on salaries and allowances as separate salaries for ECCE sections were not available and it has been assumed to be same for teachers in all classes.
Nutrition and supplementary services
Auxiliary services
Per child per annum
Total
Total no. of students in ECCE centre per annum
Per Child per annum (ECCE centre)
Data for auxiliary services is gathered from interviews with the management . Under auxiliary services, health camps are organised by the SSUP and cost is incurred on snacks etc (Rs. 20 per child) and for fieldtrip, the college bus is used. Bus rental charges are imputed using bus rental service rates in Hyderabad (per bus charge is 4000 for 25-seater bus). The assumption for computing cost incurred on auxiliary services (ECCE centre) is similar to one which we have outlined in first section i.e. Infrastructure, space and resources.
Cost incurred on nutrition and auxiliary services (ECCE)
= Total Expenditure on Nutrition and Auxiliary Services
Total No. of Classes in the Centre/School
x Total NO. of Classes under ECCE Centre
= Total expenditure on Nutrition and Auxiliary Services 4 x 4 = 0 + 17680 1 x 1 = 17680
Cost incurred on TLM (which also includes PSE kit and flexi funds) a+b+c+d 173100
a) Books 158100**
b) Audio visuals
c) TLM
Per centre per annum
d) Others 15000
Cost incurred in curriculum development Total 173100
Total no. of students in ECCE centre per annum 93
Per child Per annum (ECCE Centre) 1861
Data for the learning material subhead is gathered from interviews with the management. The learning material minor head includes cost incurred on purchase of books and notebooks (i.e. Rs. 1,700 per child) and it is imputed using data from another pre-school’s per child cost on learning material (books and notebooks). It also accounts for cost incurred on purchase of indoor play material. The assumption for estimating ECCE centre cost is same as mentioned in last section.
Cost inccured on learning material (ECCE centre)
= Total Expenditure on Learning Material Total No. of Classes in the Centre/School
Total No. of Classes under ECCE Centre
= Total expenditure on Learning Material 4 x 4 = 158100 + 15000 4 x 4
= 158100** + 15000 = 173100
**Cost is borne by parents and cost on books and notebook is calculated using per child cost.
Per centre per annum
Training
Total
Total no. of students in ECCE centre per annum
Per child per annum (ECCE centre)
Pedagogy training cost includes guest lectures for teaching staff and once in two months supervisor (Assistant Professor) session with teachers and every fortnight classroom observation. For calculating supervisor charges per day, the UGC pay scale (Assistant Professor) is used.
Cost incurred on monitoring and training= Supervisors per day charges* Number of days = 1503*28 = 42093(No. of days = 6(Training) +22(Monitoring) = 28 days)
Assistant Professor Salary = Rs. 45100 per Month
Per day Charges = 45100/30= Rs. 1503
Cost incurred on guest lectures = Rs. 1000
Total cost on training = Cost incurred on guest lectures + Cost incurred on training and monitoring = 42093+1000=43093
Cost incurred on parent-centered training programmes/ Cost incurred on PTM 12000
Per centre per annum
Cost incurred on community-centred training programmes Total 12000
Total No. of students in ECCE centre per annum 93
Per child per annum (ECCE centre)
Parent-centred practices include cost incurred on guest lectures by psychologists or professors. Cost data was gathered from interviews with the management. The assumption for estimating costs incurred on parent-centred practices (ECCE centre) is like the one we have used in the first section i.e. Infrastructure, space and resources.
Cost incurred on Pedagogy training (ECCE centre)
= Total Cost on parent centered practices
Total No. of Classes in the Centre/School x Total No. of Classes under ECCE Centre
Total Cost on parent centered practices 4 x 4 = 12000 4 x 4 = 12000
The recurring cost in the analysis consists of the sum total of six different components viz, i) Infrastructure, space and resources; ii) Salaries (teachers/caregivers/staff); iii) Nutrition and auxiliary services; iv) Learning Material and Curriculum Development; v) Teacher/Pedagogy Training; vi) Parent/Community centered practices. LUPS is running three centres in Hyderabad. As per our analysis, the cost of running three different ECCE centres ranges between Rs. 15,50,586 - Rs24,46,987 per annum and the per child cost ranges between Rs. 11,968- Rs. 20,402. For our analysis, we have taken the weightage average of all three centres. Based on weightage, the average cost required to run an ECCE centre (which includes nursery, LKG and UKG) is Rs. 21,59,264 per annum and per child cost is Rs. 15,761 per annum (if the number of students per centre is 137).The reason for fluctuation in per centre/per child cost is because of variations in the price of land and which directly impacts cost living in the different areas where ECCE centres are located. The other reason for variation is the number of students per centre. Both these factors have led to variations in building rent and salaries of staff members. Details of the method used for estimating unit cost (per centre and per child) are given below.
TOTAL (Land+ building))
a) Cost incurred on purchase of basic class furniture, material, equipment’s and vehicle etc.
b) Cost incurred on purchasing of outdoor play material
c) Cost incurred on purchase of basic furniture (mats)for nap time
Total
a) Building rent 345793
b) Rental value of basic class furniture, material, equipment and vehicle etc.
c) Rental value of outdoor play material
d) Rental value of basic furniture for naptime
Per centre per annum
e) Electricity and water charges
f) Cost incurred in maintenance and repairs
g) Other office expenses
i) Others
Playground rent
Total
Total No. of Students in ECCE centre per annum 137 Per child per annum (ECCE centre)
LUPS has three centres with total strength of 1196. In the case of LUPS, data is available for all three centres separately so we have taken the weighted average for centres strength and cost details. In our analysis, we have used weighted averages rather than normal averages so that we can assign different weights to different centres based on their centre-specific cost and school strength ( assumed to be a model school). As per weightage, the average per school strength is 455 and per ECCE centre strength of students is 137 (which use for imputing all the costs).
However, in the LUPS case, assets like buildings are rented and furniture is not rented. Therefore for estimating the annual use value of the assets, imputed rent is calculated. In this case, assets (furniture etc.), though pre-existing created just for ECCE purposes have been handed over to LUPS by the previous owner. So, we have used deprecation rates alone for calculating the rental value of the assets.
The LUPS model caters for students from nursery to Class X. This means there are thirteen classes in the school, out of which three (i.e. three classes nursery, LKG and UKG) are specific to pre-school sections. Therefore, twenty three percent (i.e. 3/13) of the space-related costs are attributed to EECE sections.
For calculating ECCE centre cost:
= Total Cost on Recurring Component
Total No. of Classes in the Centre/School x Total No. of Classes under ECCE Centre = Total Cost on Recurring Component 13 x 3
Rental value (furniture, vehicle and other equipment)
= Total Asset Worth x Rate of Depreciation 100 = 2362784 x 10 100 = 236274 --(a)
Rental value (computer and other equipment) = Total Asset Worth x Rate of Depreciation 100 = 300000 x 20 100 = 60000 --(b)
For calculating ECCE centre cost:
Total Cost on incurred on (a + b) 13 x 3 = 296278 13 x 3 = 68372
For other variable cost subheads, data is used from interviews with the management and annual income and cost documents.
LUPS
Salaries of Ground Staff (Teacher, Principal and Helper) 942632
Per centre per annum
Salaries of management staff (admin, accountant etc) 107619 Welfare expenses
Total 1050251
No. of students in ECCE centre 137
Per child per annum (ECCE Centre)
In case of LUPS, ground staff salaries include salary of teaching and non-teaching staff and employer’s contribution toward PF whereas management expenses include cost incurred on accounting, consultancy and audit services.
Wherever separate salaries are available for the ECCE sections, they have been included. In the absence of that, it has been assumed to be the same for teachers in all classes and estimated accordingly for the three classes (nursery, LKG and UKG). In this case, we have used total cost incurred on salaries and allowances as separate salaries for ECCE sections were not available and it has been assumed to be the same for teachers in all classes.
In our estimation, twenty three percent (i.e. 3/13) of salaries/allowances-related cost is attributed to ECCE centres. This assumption for computing cost incurred on salaries and allowances is similar to one which we have outlined in first section i.e. Infrastructure, space and resources.
Cost incurred on salaries and allowances (ECCE centre)
Total expenditure on Salaries and Allowances Total No. of Classes in the Centre/School
Total Cost on Salaries and Allowances 13
Total No. of Classes under ECCE Centre
There is no provision for nutrition and auxiliary services.
Cost incurred on TLM (which also Include PSE kit and flexi funds) a+b+c+d 383600
a) Books 280850**
b) Audio visuals
TLM
d) Others 102750**
Cost incurred in curriculum development 46154 Total 429754
Total No. of students in ECCE centre 137
Per child per annum (ECCE centre) 3137
Learning material and curriculum development data is gathered from interviews with the management. Learning material minor heads include cost incurred on purchase of books and notebooks. For computing the cost of books and notebooks, the average value is used i.e. maximum and minimum value average is taken for calculating average value. Apart from learning material, per child uniform cost is also used for computing the total cost incurred on purchase of uniforms at the ECCE centre level. Curriculum development includes cost incurred on content development and execution. In our estimation, twenty three percent (i.e. 3/13) of curriculum development-related cost is attributed to ECCE centres. This assumption for computing costs incurred on curriculum development is similar to one which we have outlined in first section i.e. Infrastructure, space and resources.
Cost incurred on Learning material (ECCE centre) = Expenditure incurred on purchase of books and Notebook(per child) x No. of student per centre + Expenditure incurred on purchase of uniform (per child) x No. of student per centre = 2050*137+750*137 = 383600**
is borne by parents and costs on books and note books are calculated using per child cost.
Cost incurred on developing curriculum
Cost on
and
Total
No. of students in ECCE centre per annum
Per child per annum (ECCE Centre)
Data for teacher/pedagogy training is assembled from interviews with the management . The assumption for computing cost incurred on training (ECCE centre) is like the one which we have sketched in first section i.e. Infrastructure, space and resources.
In our estimation, twenty three percent (i.e. 3/13) of training-related cost is attributed to ECCE centres. This assumption for computing costs incurred on training is similar to one which we have outlined in first section i.e. Infrastructure, space and resources.
Cost incurred on Teacher/ Padagogy training (ECCE centre) = = Total expenditure on Training
Total No. of Classes in the Centre/School x Total No. of Classes under ECCE Centre = Total Expenditure on Training 13 x 3 = 148000 13 x 3 = 34154
Total cost of training: Per teacher training cost* No. of teachers = 4000 * 37= 148000
**Per teacher training cost is inclusive of trainer’s remuneration and material cost
There is no provision for parent and community-centred practices.
The recurring cost in the analysis consists of the sum total of six different components viz, i) Infrastructure, space and resources; ii) Salaries (teachers/caregivers/staff) iii) Nutrition and auxiliary services iv) Learning Material and Curriculum Development v) Teacher/Pedagogy Training; vi) Parent/community-centred Practices. As per our analysis of this model, the cost required to run an ECCE centre (which includes nursery, LKG and UKG) is Rs. 26,34,213 per annum and per child cost is Rs. 23,947 per annum (if the number of students per ECCE centre are 110). Details of the method used for estimating unit cost (per centre and per child ) are given below.
The UPPS pre-primary school is a standalone lab school with a strength of 200 (nursery to Class III), which is part of the college located in Osmania University campus. In this case, lease charges are available for land and part-building and is used to represent the value of those assets used during the year. However, another building has been built over the years and furniture also purchased over the
years; and therefore, for estimating the annual use value of these assets imputed rent is calculated to be able to get a complete picture of the associated costs. In this case, since assets (building, furniture etc.) were not pre-existing and were created just for ECCE purposes, we have used deprecation rates alone for calculating the rental value of the assets.
Unit (in rupees) Infrastructure, space and resources UPPS
Non-recurring costs (In rupees)
Cost of building 2120619
TOTAL (land+ building)) 2120619
a) Cost incurred on purchase of basic class furniture, material, equipment and vehicle, etc. 306083
b) Cost Incurred on purchasing of outdoor play material
c) Cost Incurred on purchase of basic furniture (mats)for nap time
Total 2426702
a) Building rent 46913
b) Rental value of basic class furniture, material, equipment and vehicle etc. 30608
c) Rental value of outdoor play material
d) Rental Value of basic furniture for naptime
Per centre per annum
e) Electricity and water Charges 58500
f) Cost incurred in maintenance and repairs 113000
g) Playground rent
h) Other/Misc. expenses 63768
Total 312789
Total No. of students in ECCE centre per annum 110
Per child per annum (ECCE centre) 2844
The UPPS model caters for student between nursery and Class III. This means there are six classes in the school, out of which three (i.e. three classes nursery, LKG and UKG) are specific to pre-school sections. Therefore, half of the space-related costs are attributed to ECCE sections.
For calculating ECCE centre cost:
= Total Cost on incurred on variable component
Total No. of Classes in the Centre/School x Total No. of Classes under ECCE Centre
Total Cost on incurred on variable component 6 x 3
Building rent = Total Asset Worth x Rate of Depreciation 100 = 4241238 x 2 100 = 84825
Building rent for ECCE centre = Total Building Rent 6 x 3 = 84825 6 x 3 = 42413
Building and land lease charges of ECCE centre = Total Lease Charges 6 x 3 = 9000 6 x 3 = 4500
Total Rent = Lease charges + building rent = 42413 + 4500 = 46913
Rental Value (Furniture, vehicle and other equipment) = Total Asset Worth x Rate of Depreciation 100 = 612165 x 10 100 = 61217
Furniture and other equipment rented for ECCE centre = Total Rental Value 6 x 3 = 61217 6 x 3 = 30609
For other recurrent cost sub heads, data is used from interviews with the management and annual income and expenditure documents.
Unit (In rupees)
Salaries of Ground Staff (Teacher, Supervisor and Helper) 1815500
Per Centre Per Annum
Salaries of Management Staff (Admin, Accountant, etc.) 162000 Welfare Expense 271500 Total 2249000
Total No. of Students in ECCE Centre 110 Per Child Per Annum (ECCE Centre) 20445
Salaries include salaries of teachers, researchers, support staff and supervisors, including any other staff welfare measures over and above wages. Welfare services in this case includes employer’s contributions towards PF and gratuity. Wherever separate salaries are available for the ECCE sections, that is specified. In the absence of that, it has been assumed to be the same for teachers in all classes, and estimated accordingly for the three years. In this case, we have used total expenditure incurred on salaries and allowances as separate salaries for ECCE sections were not available and it has been assumed to be same for teachers in all classes.
Expenditure incurred on salaries and allowances (ECCE centre)
= Total expenditure on Salaries and Allowances Total No. of Classes in the Centre/School x Total No. of Classes under ECCE Centre
= Total expenditure on Salaries and Allowances 6 x 3
3- Nutrition and auxiliary services: No provision In the UPPS model, there is no provision for Nutrition and auxiliary services.
4- Learning material and curriculum development Unit (in rupees) Learning material and curriculum development UPPS
Cost Incurred on TLM (Which also Include PSE kit and flexi funds) a+b+c+d 1648 a) Books
b) Audiovisuals
Per centre per annum
c) TLM 1648 d) Others
Cost incurred in curriculum development 19000
Total 20648
No. of students in ECCE centre per annum 110
Per child per annum (ECCE centre) 188
Learning material data is collected from interviews with the management and partially from income expenditure a/c. There is no provision for books and notebooks for pre-school students. The curriculum is revised once in 10 years. In our analysis, the annual cost incurred on curriculum development is divided by 10
Expenditure incurred on salaries and allowance (ECCE centre)
Total expenditure on Learning Material Total No. of Classes in the Centre/School
= Total expenditure on Learning Material 6
Total No. of Classes under ECCE Centre
3 = 3295
x 3 = 1648
Expenditure incurred on curriculum development per annum = Total coast No. of years
190000
= 19000
Note: Educational Equipment’s cost is covered under infrastructure, space and resource head
They have a provision of in-house training and it is provided by the research staff. Research staff salary is included under salary and allowance component.
Cost Incurred on parent-centered training programmes/Cost incurred on PTM
Per centre per annum
Cost incurred on community-centered training programmes Total
Total no. of students in ECCE centre per annum
Per child per annum (ECCE centre)
Parent centred practices include expenditure incurred on celebrations and functions. Expenditure data for celebration and functions collected from income and expenditure a/c. The UPPS model caters to students between nursery and Class III. This means there are six classes in the school, out of which three (i.e. three classes nursery, LKG and UKG) are specific to pre-school sections. Therefore, half of the parent-centred practices costs are attributed to ECCE sections.
Expenditure incurred on parent centred practices (ECCE centre)
= Total expenditure on parent centred practices Total No. of Classes in the Centre/School
= Total expenditure on parent centred practices 6
Total No. of Classes under ECCE Centre
3 = 103551
x 3 = 51776
Total budget for 2015-16 = 658.96 lakhs (from Annual Report 2015-16 provided as hard copy)
Expenditure on direct delivery model = 28% = 184.50 lakhs
Resource per centre = Expenditure on direct delivery model/ No. of centres = 184.50/14 = 13.18 lakhs
Resource per ECCE centre = (1318000/3) x 2 = 878667
Total budget for 2015-16 = 10,36,50,194 (from Annual Report 2015-16 taken from website)
CUSP (1)
Total resources for ECCE = (Total budget/4) x 2 = 5,18,25,097
Resource per ECCE centre = Total ECCE resources/No. of centres = 5,18,25,097/11 = 47,11,372
CUSP (2)
Total Resources for ECCE = (Total budget/13) x 2 = 1,72,75,032
Resource per ECCE centre = Total ECCE resources/No. of centres = 1,72,75,032/2 = 86,37,516
Since no budget documents were provided, field notes were used to estimate budgets
Total annual Fees = Per child fee*number of enrolments = 10*500 = 5000
Total monthly fee = Per child fee*number of months*number of enrolments = 1*12*500=6000
Funds per village*number of villages = 60000*32 = 19,20,000
Total resources = User fees + Donations = 19,20,000 + 11,000 = 19,80,343
Total budget for 2015-16 = 36,896,557 (from Annual Report 2015-16 given as hard copy)
Expenditure on education = 50% of total budget = 18,448,278
Assuming that each of the seven education programmes receives equal amount of funding.
For UBM model
Resources available = Edu expenditure/No. of programmes = 18,448,278/7 = 26,35,468
Resource per centre = Resources available/ No. of centres = 26,35,468/12 = 2,19,622
Resources available = Edu expenditure/No. of programmes = 18,448,278/7 = 26,35,468
Resource per centre = Resources available/No. of centres = 26,35,468/6 = 4,39,244
Since budget documents were not available, details from university website and field notes were used to estimate resources
University grant = 40,000
Caution Deposit Fee = Fee per child*no. of enrolments = 5000*93= 4,65,000
Tuition Fee = Fee per child*no. of months*no of enrolments = 1100*12*93 = 12,27,600
Total resources of the centre = User fees + grants = 16,92,600
Total budget = 1,92,22,929
Total resources for ECCE = (Total budget/13)*3 = 44,36,060
Resource per ECCE centre = Total ECCE resources/no. of centres = 44,36,060/3 = 14,78,686
Total resources for the centre = User fees + grants = 13,04,800
Total budget = 1,07,28,806 (as given in the Annual Budget of 2015-16)
Resources for ECCE = Total budget/no. of centres = (1,07,28,806/6)*3 = 53,64,403
YEARS
AND POLICY DIRECTIONS FOR ECCE IN INDIA
This report summarises the findings of the three research studies on ECCE undertaken: a) Status of ECCE: Provisions and Gaps in India, with special focus on three states (Delhi, Odisha and Telangana) b) Analysis of ICDS Provisions and Budgets and c) Analysis of the Costs and Resources of select non-ICDS ECCE models. Drawing on these studies, it provides certain critical insights for policy, organised under four heads: (i) quality (ii) costs and cost-norms (iii) scaling and (iv) resources. The underlying concern across all four heads discussed is the issue of ensuring equity in the current scenario wherein the ECCE sector remains unregulated and highly differentiated, with multiple models and options that are differentially available to children of different socio-economic groups. Within this context, the report calls for:
A strong regulatory framework which defines a set of ‘non-acceptable/non-negotiable’ provisions and practices, that ensure developmentally appropriate practices (DAP) of ECCE but also allow for innovation and contextually-relevant programmes
Defining non-negotiable cost heads while also setting ‘ranges’ rather than fixed costs and ceilings, to ensure equitable provisions and provisions of similar quality for all the need to plan large centralised programmes (such as ICDS) appropriately by understanding how economies of scale operate and how these cannot be reduced to per child costs
The need to pay attention to innovative ways of resource-sharing and resource generation, both across government bodies and agencies as well as between state and non-state agencies, to achieve maximum efficiency in programmes.
The need to pay attention to innovative ways of resource-sharing and resource generation, both across government bodies and agencies as well as between state and non-state agencies, to achieve maximum efficiency in programmes.
Early Childhood Care and Education (ECCE) has perhaps now come of age. In the last decade, there has been increasing attention paid by international development agencies as well as national governments to ECCE provisioning. Currently, efforts to fund and advocate for ECCE programmes is also seeing increased interest and efforts across the world. This can partly be attributed to the increasing research base that shows costs borne on ECCE programmes are outweighed by the longterm benefits they offer as also the recognition that the right to equal opportunities for education for all children starts with developmentally appropriate and good quality early childhood education and care that can minimise the otherwise reinforcing effects of socio-economic status, especially for the marginalised.
In this context, it is perhaps heartening to note the distinction that India has had of having conceptualised a holistic ECCE programme as early as the 1970s. The ICDS which adopts a lifecycle approach providing free and universal nutrition, health and pre-school educational services has made definitive improvements in certain areas of children’s development at least, namely health and nutrition. However, despite nearly half a decade of its existence, the programme still suffers from serious issues of access (with currently only about 48% of the child population between 0-6 years having access), quality, especially with regards to pre-school education and poor allocation of funds. Financial estimates set for the restructuring of the ICDS to improve quality are yet to be met and in recent years the budgetary allocations for ICDS have also been declining, even within the budget for social sector expenditure and financial allocations for components of ICDS have been erratic.
More importantly, the lack of importance given to Pre-school education (PSE) within ICDS is evident from the absence of a budget head for education within ICDS budgets across most states (with some exceptions such as Odisha). The lack of adequate funds and resources to undertake PSE and set parameters for assessment, in contrast to provisions made for supplementary nutrition and growth monitoring, has also meant that the ICDS and AWCs have come to be seen as merely feeding centres for the poor.
More importantly, the lack of importance given to PSE within ICDS is evident from the absence of a budget head for education within ICDS budgets across most states (with some exceptions such as Odisha).
The perception of poor quality of PSE within AWCs as well as the lack of a regulatory framework has contributed to a conducive environment for the growth of private and NGO-based ECCE services. This is particularly evident from data that shows declining enrolments in AWCs with increase in under-age enrolments in primary schools. Repeated conversations with parents show that aspirations for English medium education for their children along with early training in academic skills have contributed to these trends. Furthermore, what is also evident is that it is not just English/academic skills that parents prefer but just as in the case of primary schooling, perceptions of higher quality education to be had in private schools has further contributed to the exodus from state schools to private schools with pre-primary sections in states such as Telangana and high numbers of private schools in general.
Such trends have serious implications and should be a cause for concern. In the absence of regulatory and legislative frameworks, the available alternatives to AWCs and government-run schools have been impossible to estimate, their quality difficult to ascertain and the economic and social costs and outcomes of their programmes hard to determine. Currently, alternatives to state-run ECCE programmes vary from high end, chain pre-schools at one end of the spectrum to programmes run by NGOs in collaboration with communities with limited infrastructure and resources, at the other. The availability of these differential tiers of ECCE, of variable quality and costs, pose a real threat of consolidating inequality and inequitable outcomes for marginalised communities that is already a deeply embedded pattern within primary and secondary education (as a result of similarly available varied options).
As with primary and secondary education, the limited data available on PSE already shows how access to better quality programmes (perceived or otherwise) are mediated by factors such as social background and gender, even in the case of PSE, with boys and children from higher income quintiles and urban-locations having a greater likelihood of being enrolled in private pre-schools than girls and low income household children. Even when the quality in these private pre-schools may be suspect, the participation there gives them an edge in certain skills and exposure considered desirable in a highly competitive society.
Private and many NGO alternatives, in addition, also rely on user fees to sustain their programmes as our study shows (with rare exceptions such as UPCS or UBM/UCM that charge nominal fees). Others (e.g., CUSP, UPPS) that have started without a user fee have also gradually come to rely on user fees. All non-state alternatives (examined) have come to rely on some or the other kind of community contribution, in kind (e.g., land, volunteering services, donations in kind such as fruits or vegetables, books and play material, etc.), cash (as donations, corporate or individual sponsorships) or out-of-pocket parental expenditure (e.g., on books, transport, nutrition, etc.).
This is strongly indicative of the fact that any alternative to state-run ECCE programmes face the real challenge of sustenance and, in the absence of state intervention, the probability of ECCE costs, currently completely unregulated, being off-set to communities, particularly those in disadvantaged circumstances. As with school education, the lack of regulation with respect to specific provisions for ECCE, has also allowed for questions of quality to be conflated with questions of cost with the result that, on the one hand, programmes for elite communities/private ECCE programmes have come to justify their user fees in the language of quality, while generating a surplus1 and, on the other, locally sourced/locally prepared resources have come to be justified as adequate/appropriate for marginalised communities due to their ‘low costs’. Without disputing the value of locally developed resources and material, the argument we place here is the need to critically interrogate the quality of provisions across all programmes, and estimate their real costs, rather than accepting different standards of quality (and costs) for different communities.
In addition, in an unregulated environment, it is not just differences in social status and access that can contribute to inequities but also differences in the orientation and nature of intervention itself that need to be critically evaluated. As research suggests, different interventions have differential effects and address different aspects of development (Barnett, 1995). Thus, even enrolment in preschools or pre-primary sections of schools (private or state) has to be cautiously viewed, as the focus within such models may well remain on a limited range of school readiness skills such as literacy, numeracy and self-regulation.
1Although it should be noted that for some models like UPPS, which are highly enrolment-dependent, the surplus is used to create a teacher fund, to guard against yearly fluctuations in income and increase security for teachers.
As much research in ECCE shows, considering the continuous and cumulative nature of child development, ECCE programmes need to be planned appropriately, going beyond practices of simplistic downward extension of curriculum. It is important for programmes to pay attention to the child’s developing physical, cognitive, socio-emotional, linguistic and creative-expressive capacities and support this appropriately. Important variables that have been identified for this include caring child-adult relationships, play-based curriculum as well as preparation of primary schools to receive children from ECCE programmes. While different kinds of models (i.e., centre-based, community-based programmes, etc.), have all been found to improve later school outcomes, more fundamentally it is perhaps the inclusion of certain principles and processes that guide these models, despite differences, that contribute to better outcomes. Critical among these factors is the role of teachers, classroom management and organisation practices and the availability of adequate play and learning materials and appropriate use of these in activity-based learning opportunities that link across the various domains of development, rather than those that address different domains serially (Kaul and Chaudhary, 2017).
All of these factors also make evident the need to fundamentally invest in the ECCE teacher/caregiver who currently receives little attention, has little bargaining power and occupies a marginalised position within the education system as well as within society in general. As our study shows, though there are variations. Salaries for pre-school teachers/caregivers in general remain lower than even for primary school teachers and even AWWs in most of the non-ICDS models studied, indicating that this largely remains an un-professionalised role. Even though salaries as a whole consume the largest portion of the ECCE budgets across models, even for models demanding higher qualifications (e.g., PG Diplomas in ECCE), salaries for teachers remain low. Further, as reported by AWWs and other pre-school teachers in the study, ECCE and ECCE professionals are not afforded the same importance as school education or teachers by parents, a large majority of whom are not aware of the developmental significance of the period or the importance of a sound, developmentally appropriate curriculum or trained faculty. Thus, the importance of investing in the teacher and in parental awareness programmes is also critical.
Taken together, the findings of the study point to four major considerations for policy: first, with respect to quality, second, in relation to costs and cost-norms, third, about economies of scale and fourth related to resources. These are elaborated below:
An Anganwadi Worker plays a critical role in promoting child growth and development. She is the basic functionary of the ICDS program and is the linkage between different departments working in ECCE. They conduct pre-school activities and provide health and nutrition related education and information to families and community members especially to pregnant and lactating mothers and also adolescent girls. Anganwadi workers are the essential link of the Indian healthcare and are the key informants of the healthcare issues. An Anganwadi Worker is the pillar of the program. She runs the AWC, ensure that food is served with adequate nutrition, conduct pre-school education, take up health care issues with the relevant health care professional and so on. With such a crucial role of the Anganwadi Workers and their influence in the development of the children, it is high time we recognise the Anganwadi Workers as ECCE professionals.
There are certain entitlements that the children must have in the ECCE centre and these must be practised universally.
The early years are crucial for holistic development of the children. A quality pre-school should be able to provide children with opportunities to learn social skills, develop learning dispositions and build a strong foundation for children’s future learning. With the use of age-appropriate materials and objectives, the teacher in the ECCE centre should help children practice their skills.
A child is entitled to get a safe and comfortable space in the ECCE centre. This is especially true for urban areas where there is a lack of space and since, many centres run in rented spaces, there is no outdoor space for children. A pre-school teacher repairs or remove any items or things that poses a threat to the children and their actions should help the children feel comfortable and confident within their surroundings. An ECCE centre should ensure a safe environment for their children. They should strive to address cultural or special needs of the children – emotional, physical or educational.
Children should be provided access and early orientation to effective hygiene in the pre-school centres. Promoting hygiene in the ECCE centres would protect the children from germs and hence, in long term from health-related issues.
Once age-specific norms and non-negotiable are defined, it is also important to have principles that help us cost the ECCE services. Based on cost analysis undertaken in view of the quality delivered, we recommend the following principles for cost estimations that take entitlements of both children and workers into account:
Professionalisation of teachers / caregivers, through better salaries is important to build better quality ECCE programmes, and better quality ECCE programmes are critical if we are worried about quality of education at all levels of schooling - primary to higher education. Any profession cannot be professionalized without paying the minimum respectable remuneration and social security benefits. In the case of ECCE workers, the remuneration must be at least equal to the minimum wage rate for skilled workers. In this context, lessons can be drawn from models such as SSUP, LUPS and UPPS that have provision for PF, ESI and also the Government of Karnataka, which has made a number of social security provisions for Anganwadi Workers in recent past.
Under the Integrated Child Development Scheme (ICDS), children are entitled to a morning snack (in form of milk/banana/seasonal fruits or micronutrient fortified food) as well as a hot-cooked meal at an Anganwadi Centre. Given the high prevalence of malnourishment and the criticality of early years’ nutrition for learning as well as health in all stages of life, this is a very important intervention. The recent revision in the per child per day unit cost for this purpose from Rs. 6 to Rs. 8 by the Government of India is a welcome step but here too, it may be a desirable policy step to peg it to the WHO recommended norms, as is practiced by UPPS. What is important to understand is that the benefits of this additional burden on public expenditure would spread over the entire life cycle
of these children, leading to enhanced well-being and productivity, which would easily offset what may seem a high burden at present. The cost of not making this investment currently can be huge in terms of poor health and learning leading to low productivity. Also, since the burden of low nutrition and learning is disproportionately higher for poorer children, the inequality would further grow in absence of such public investments.
Adequate infrastructural support is one of the prerequisites for meaningful ECCE activities. A number of studies have shown space as a major issue, especially in urban areas. Also, given that the country is diverse, the number of children varies in each centre, and distinction is made only for tribal and non-tribal areas. It is important to get out of the practice of centralised norms as the state or even the districts are so diverse. The current unit cost norm for ICDS infrastructure is based on one unit of building (Rs. 4 lakhs of which 75% comes from the state government). It does not take the per child need for space into account. As per guidelines, the ICDS centres can accommodate 20 to 40 children. This can cause problem and make the delivery difficult especially because the space has to be used for diverse activities: cooking, feeding and learning activities. It would help to have a per-child need based space defined to act as the basis for estimates and the recommended unit cost for building be as a range for this space. Similarly, it is important to change the rent norms for urban areas and peg it to prevalent rates. This is a clear lesson emerging from non-ICDS models that given high level of migration and concentration of urban poor in urban localities, the need for providing ECCE services implies high expenditure on space. Similarly, no provision for maintenance in centres that do not have their own building needs a relook, as most places on rent in urban areas where ICDS centres are located require maintenance and the owners / providers do not necessarily take that burden.
Keeping in mind the need to allow for diversity as well as numbers, it is perhaps also necessary to allow for various kinds of partnerships. Partnerships can also take other innovative forms, like central university campuses, public sector companies providing space for ECCE centres not only for their own employees but also for publicly funded programmes catering to poor neighbourhoods. It could also mean mandating private companies/industries to provide space and options for state or non-state run ECCE programmes for staff as well as children from the neighbouring communities, as a part of their corporate social responsibility. This suggestion has emerged from the experiences of Telangana based models: SSUP and UPPS, where universities have played an active role, as well as Delhi based UPCS, where construction companies have been made to provide space.
The decision for moving ICDS centres in school premises may help in urban areas where the enrolment in public schools is witnessing a decline and the cost / rents for adequate space pre-school provisions could be very high. But, in rural areas, this decision should be case-based exercise to ensure that young children enrolled to respective ICDS centres are not located very far from the school where the centre is being relocated. Co-location with additional resources for the pre-school needs further analysis and evaluation. However, this cannot be deemed as a solution given the fact that the focus should be on extension of RtE to the pre-school rather than just locating the ECCE centre in the premises of the school.
Good quality programmes with developmentally appropriate practices and curricula, such as Telangana’s UPPS, have been built over the years through large investments made in curriculum
development. UPPS, in its initial period, received support (financial and otherwise) from development organisations such as UNICEF and the state government, which has allowed them to develop a strong curriculum through multiple rounds of consultations and collaborations. It is important to make such provisions non-negotiable that can the improve quality of programmes.
It is important to ensure that certain cost-heads such as budgets for curriculum development and nutrition are established as non-negotiable for both public and other ECCE providers. It is difficult to recommend a particular amount for this cost head, but the presence of the head would enable investments. Considering the continuous and cumulative nature of child development, ECCE programmes need to be planned appropriately, going beyond practices of simplistic downward extension of the school curriculum
While India already has a National Policy on Early Childhood Care and Education (2013), which also provides an in-depth, developmentally relevant curriculum, in the absence of a legislative mechanism, ECCE provisions largely remain unguaranteed and not assured entitlements. There is a need to strongly articulate ECCE as a right, just as with primary education, with a strong regulative framework laying down conditions for quality, ownership, responsibility, cost, partnerships, curricula, etc. Each of these points also need careful consideration, as we elaborate further below.
While it is important to set parameters for quality, it is also important to ensure that these parameters do not create barriers for creativity, innovation, experimentation and for contextualisation of interventions. Our study importantly reveals that variety of programmes that are available and also contextually-situated and suited. It is important to ensure the possibility for innovation, without compromising on certain basic features.
In order to allow for the possibility for contextually-relevant learning opportunities, while also ensuring quality, it is important to develop a list or framework of non-acceptable and non-negotiable processes and practices, rather than a list of must-do processes and practices. This can ensure diversity while simultaneously ensuring that programmes or models do not create adverse conditions.
Further, regulation of quality should also be uniformly linked to developmentally appropriate practice (DAP) which not only advocate the need for age-appropriate skills and pedagogic practices but also the importance of learning in the mother tongue in the early years. This is important to counter the current trend of pushing children in the early years to read and write in English and guarding against the attraction of early English medium education presented by certain private operators who feed on parental anxieties about preparing children early for later schooling.
Considering that knowing English as a symbol of social status and viewed as necessary to have for any social or economic mobility, it is important to have an effective, mass-media based campaign to educate people about the need for home/local language-based education in early years to enable learning needed for academic excellence and ability to pick English simultaneously and in later years.
THE RIGHT START INVESTING IN EARLY YEARS OF EDUCATION
An important component of this report has been the evaluation of various ECCE models with regards to their costs and qualities. Both public and private models are seen to have various kinds of lacunae in this regard. Public provisions have clearly been inadequate and are declining. Despite commitments to a re-structured ICDS, funding has failed to match estimates for improving quality. Further, with the changes brought by the Fourteenth Finance Commission, the centre’s share of CSS has declined, while providing greater untied funds to states. In states such as Odisha, with a larger (rural) child population, this has also been accompanied by poorer management of finances and implementation of ICDS (CAG Report 2016). On the other hand, private and NGO models show larger variations in per child costs and are also seen to off-set these costs to parents and community. Further both public and private models are seen to critically fail with respect to investing in important ECCE provisions: for example, there is no separate head for PSE under ICDS and provisions for play and learning material in AWCs has also been found inadequate. ICDS and other private and NGO models are seen to invest very little in teachers/caregivers who form the backbone of the ECCE programme.
Further, many non-state interventions fail to provide for nutrition and other auxiliary services (despite charging user fees). What is also important to note is that of the various non-state interventions studied, five of nine models have costs which well exceeds the per child annual expenditures of ICDS which provides a range of additional services other than PSE (which ranges from Rs. 4,340 in Odisha to Rs. 7,415 in Delhi). Ranges for the non-state models, on the other hand, extend from Rs. 6,400 at the lowest end to Rs. 29,527, of which only two models provide some form of nutrition. While this observation is not made to advocate simply lowering costs (as this does affect the quality of provision as seen with ICDS, which suffers from unrealistic budgets for rent, honoraria, transport of food, etc.), the observations have important implications for policy.
The policy implications remain the same for state-run programmes (i.e., ICDS) and for regulation of non-state-run programmes although they may need to be articulated differently. Here, we present the policy suggestions while also articulating what it would mean for state-run programmes and what implications it has for regulation of non-state programmes. Towards the end, we also discuss certain specific issues pertaining to both state and non-state run programmes. The policy suggestions are:
The policy implications remain the same for staterun programmes (i.e., ICDS) and for regulation of non-staterun programmes although they may need to be articulated differently.
It is important to ensure that certain cost-heads such as budgets for curriculum development and nutrition are established as non-negotiable, as these form the crux of the programme. Good quality programmes with developmentally appropriate practices and curricula, such as UPPS, have been built over the years through large investments made in curriculum development. UPPS, in its initial period, received support (financial and otherwise) from development organisations such as UNICEF and the state government which has allowed them to develop a strong curriculum through multiple rounds of consultations and collaborations. It is important to make and allow for such provisions that can improve quality of programmes.
Similarly, budgets for nutrition are critical, particularly when working with disadvantaged communities. Provisions for nutrition are important in a country with still high numbers of malnourished children, as these critically influence enrolment, retention and learning, as noted by UPCS. Considering some of these costs as non-negotiable would be a desirable practice.
Another important component identified within certain models was the role of community involvement which increases ownership, knowledge and awareness and contributes to better outcomes. Community volunteering, in terms of time and resources, can also off-set costs but this requires efforts at building community interest and skills. In successful models like CBCDC, community engagement has had positive dividends where it has been possible to hand over centres to the community for management, reducing costs for the parent organisation. However, it is also important to ensure that this does not become burdensome for the community and hence financial planning, along with conceptual planning for such provisions is important.
This implies that both in state and non-state programmes, these cost heads must be present. The actualisations may vary but provisions for these components is essential.
This is particularly important in the context of state-run programmes but is also relevant for others. Most government programmes, including ICDS, suffer from the presence of unique and rigid norms for the entire country. Even if the provisions for minor modifications exist, these require permissions that take ages to come. This fails to take diverse contexts and needs into account. Even when the state governments have taken steps to revise ICDS norms, they have remained as rigid and centralised within states which also happen to be large and diverse geographical entities.
One way to break this rigidity is to define principles for determining the cost range and define cost-ranges rather than the cost per se. For instance, the principle for determining the salary for the ECCE instructor/teacher can be that it would not be less than the prevailing minimum wage for skilled labour in any area, will also be responsive to ensure purchasing power parity (higher in urban areas than rural areas if the prices are higher in the former) and will also take all the tasks that she/he is supposed to undertake, including preparation, into account in counting the number of hours that she works for, in estimation of wages. This would mean that a graduate AWW would get at least Rs.17,604 per month and a matriculate but not graduate AWW would get at least Rs.16,182 per month in Delhi as per the current legal provision2. This could also be made part of the regulatory framework for non-state programmes, whether run by NGOs or private entities. These cost norms could work in conjunction with quality norms such as one for qualifications and number of working hours for ECCE instructors/teachers.
A question may be raised about the ease of implementation, especially for state-run programmes, as one argument for rigid norms is that those are easy to implement. The answer is that the government systems are implementing similar norms in various other streams, e.g., salaries of their own employees where the Dearness Allowance is linked with prices and various other infrastructure projects where cost overruns are routine occurrences. Also, the education departments in a number of states have implemented one programme, District Primary Education Programmes (DPEPs) that for many years followed quality framework-based cost norms successfully. It is more a matter of accepting the need and then developing appropriate frameworks and accountability processes rather than an issue of the ease of implementation.
Such norms are also more in line with a de-centralised frame of governance, especially in view of transfer of high amounts of untied funds to local governments. The government can also think of having a model where local governments can be made responsible for filling the gaps using these cost norms on top of the transfers made for programmes such as ICDS using their own resources.
An important finding of the study is that most though not all non-ICDS models charge user fees. The practice is not limited to private institutions and includes NGOs. These remain unregulated and sometimes perhaps even unreported. It definitely calls for a caution against unregulated user charges and there is indeed a need for ceilings on such charges. Ceilings must be fixed not just on user charges/tuition fee but also for compulsory contributions in kind and out-of-pocket provisions that can place a burden on poor and disadvantaged families and communities. In this context, lessons can be drawn from models such as CBCDC and UCM that have used nominal community contributions and user fees as ways of sustaining the programmes through community efforts and interests while not overly burdening them.
As mentioned earlier, the lessons learnt clearly suggest the need for a de-centralised approach and context-specific models. The need for de-centralising monitoring using both experts and community and collaboration with NGOs has also been mentioned in the last report. An important question that we sought to address through the study was the relationship between size/scale of programmes in terms of costs. Most non-ICDS models are small in scale and do not have many lessons to offer. However, it is clear that costs for centralised features such as curriculum, teacher training, monitoring and supervision can be reduced if the scale is not very small. A particular number of institutions would help in bringing down per centre and per child cost. Here too, it is important to note that while it is desirable to an optimal level to save resources, caution should be used not to make any of these centralised features over-centralised. All features should have the scope to be contextualised within the defined framework.
Another important aspect is that the cost norms be determined after taking note of the fact that fixed and variable costs are not the same as capital and recurrent costs. This is something the centralised cost norms rarely take into account. For instance, there would not be much difference in total costs for running an ECCE centre for 20 children and 40 children as the infrastructure and teacher requirements would perhaps remain the same. This means that these are fixed costs and when the second teacher is brought or the second room is built/rented, the total cost would again remain roughly the same till the number crosses the limit of, say, 80 children. This has two implications: one, that per child cost should not be made the basis for estimation of resources without taking their location into account; two, even if the intervention is large scale, the dispersed nature of the intervention would prevent it from taking full advantage of economies of scale.
The biggest question with respect to funding and financing ECCE programmes revolves around the issue of whether this should be a public good or allow for private provision as well. Further, in case of public provisioning, particularly if ECCE were to be legislated as a right, it also raises the question of which ministries/departments should be responsible for ECCE. While the DWCD has already made huge investments in setting up of AWCs and has the administrative infrastructure in place, it also occupies a lower position within the hierarchy of ministries compared to education. The DoE, on the other hand, has higher budgets, larger administrative machinery, and a more professionalised cadre of workers who are more fundamentally connected with questions of education, unlike the AWW, who is also burdened with several responsibilities in addition to preschool education. Further, considering the transition that children would have to make to primary schools, the DoE also appears to be the right body to plan for ECCE such that it can ensure a smooth transition into
schooling. On the other hand, considering the interrelated aspects of development in the early years, also tied to maternal health, children’s nutritional status and health, AWCs also appear to make a compelling case for locating early childhood education services in them. In addition, there is another risk of shifting ICDS or the ECCE component to the DoE. If not done appropriately, it could lead to even earlier introduction of reading and writing practices (instead of pre-number and pre-letter, and all kinds of age-appropriate stimulation activities/games) which will be counterproductive.
Considering the different advantages offered by both, it is perhaps important to conceive of different ways of integrating provisions across departments and for cost-sharing. For example, such provisions can perhaps take the form of making the DoE responsible for training of AWWs and monitoring and supervising the educational components of the ICDS scheme, while retaining PSE as part of ICDS. Moving ECCE centres to the primary school premises wherever it is possible (as is being done in Telangana), might also be considered.
Keeping in mind the need to allow for diversity as well as numbers, it is perhaps also necessary to allow for alternative providers for ECCE as well as for collaborations between the state and nonstate providers. But this needs to be carefully regulated, the conditions of partnership well-set and, as mentioned before, costs and expenditures on these models maintained on parity with other public services so that it does not create hierarchical tiers of PSE as with primary and secondary schooling.
Further, it is important to ensure that partnerships do not just take the form of the state investing funds in private programmes without returns or certain forms of accountability. For example, partnerships could take the form of investments in curriculum development or in training which can also then be used for state ECCE programmes. Partnerships can also take other innovative forms, like provisions of land for programmes within state and central university campuses, public sector companies etc. while also making mandates on private companies/industries to provide space and options for state or non-state run ECCE programmes for staff as well as children from the neighbouring communities. Public-private partnerships and alternative provisions need not be completely avoided but must be carefully planned and regulated.
Finally, we conclude by presenting a set of good practices observed that might be taken together for planning:
a. Addressing infrastructure costs and availability by making ECCE programmes a mandated part of larger public and private institutions such as universities and industries, as seen in the case of SSUP and UPPS.
b. Ensuring better pay and building ECCE teacher/caregiver motivation and morale. Though this was not seen in any specific model, UPCS is one of the models that provided the highest pay to their teachers.
c. Developing professional capacities of the teacher through training which was visible to some limited extent across models. LUPS has invested in training for better classroom management though teachers’ across other models seemed to also manage classrooms well.
d. Investing in developing a sound curriculum with extensive teacher handbooks and resources to support classroom learning, as has been undertaken by UPPS, for better quality of learning.
e. Developing community involvement as an integral part of the model, as has been planned for in the CBCDC model, to ensure greater community involvement and ownership, which allows for phased handing-over of centres to the community.
f. Considering nutrition as an integral component of programmes for learning, as has been done by UPCS, as this affects motivation, retention and learning.
ANM Auxiliary Nurse Midwife
ASHA Accredited Social Health Activists
AWC Anganwadi Centre
AWW Anganwadi Worker
CBPS Centre for Budget and Policy Studies
CECDR Centre for Early Childhood Development and Research, Jamia Millia Islamia
CECED Centre for Early Childhood Education and Development, Ambedkar University Delhi
ECCE Early Childhood Care and Education
ECD Early Childhood Development
FGD Focus Group Discussion
FW Family Welfare
ICDS Integrated Child Development Service
ICT Information and communication technology
INR/Rs. Indian Rupee
P&LM Pregnant and Lactating Mothers
PTR Pupil Teacher Ratio
MFHW Ministry of Family Health and Welfare
MHRD Ministry of Human Resource Development
MIS Management and Information System
MO Medical Officer
MSJ& E Ministry for Social Justice and Empowerment
MWCD Ministry of Women and Child Development
NFHS National Health Family Survey
NGO Non-Governmental Organisation
NIPCCD National Institute of Public Cooperation and Child Development
NMR Neonatal Mortality Rate
OBAC Odisha Budget and Accountability Center
OECD Organization for Economic Cooperation and Development
PSE Pre-school Education
RSOC Rapid Survey on Children
RTE Right to Education
SNP Supplementary Nutrition Programme
UNICEF United Nations Children’s Fund
WHO World Health Organisation
ASER (2017). Annual Status of Education Report (Rural) 2016. New Delhi: ASER Centre. Retrieved from http://img.asercentre.org/docs/Publications/ASER% 20Reports /ASER%202016 /aser_2016.pdf
Barnett, W. S. (1995). Long-term effects of early childhood programs on cognitive and school outcomes. Future of Children, 5, 3, 25-50. Retrieved from https://www.princeton.edu/future ofchildren/ publications/docs/05_03_01.pdf
Britto, P.R., and Engle, P. (2015). Parenting education and support: Maximizing the most critical enabling environment In P.T.M Marope and Y. Kaga (Eds.), Investing against Evidence: The Global State of Early Childhood Care and Education (pp.158-173). Paris: UNESCO
CBPS - UNICEF (2017). A Review of Expenditure and Services of ICDS in Karnataka Hyderabad: UNICEF Hyderabad Field Office
CECDR. (2013). Development, Implementation and Evaluation of the Restructured ICDS Curriculum in Selected Pilot Projects in Haryana, Delhi and Rajasthan. New Delhi: Centre for Early Childhood Development Research, Jamia Milia Islamia.
CECED (n.d.). Quality and Diversity in Early Childhood Care and Education. New Delhi: Centre for Early Childhood Education and Development, Ambedkar University
Claeson, M., Bos, E.R., Mawji, T., and Pathmanathan, I. (2000). Reducing Child Mortality in India in the New Millennium. Bulletin of the World Health Organisation, 78, 1192-1199. Retrieved from http:// www.who.int/bulletin/archives/78(10)1192.pdf
Paul, S., Krishnan, S., and Bikhchandani, T. (2016). Pre-Primary Sections in Government Schools: Current Landscape and Recommendations. New Delhi: Central Square Foundation. Retrieved from http://www. centralsquarefoundation.org/wp-content/uploads/2016/02/CSF-Report_Pre-Primary-Sections-inGovernment-Schools.pdf
Dahlberg, G., Moss P., and Pence, A.R. (1999). Beyond Quality in Early Childhood Education and Care. London: Falmer Press
Engle, P. L., Black, M. M., Behrman, J. R., De Mello, M. C., Gertler, P. J., Kapiriri, L., ... & International Child Development Steering Group. (2007). Strategies to avoid the loss of developmental potential in more than 200 million children in the developing world. The Lancet, 369(9557), 229-242.
Fernald, L. C., Gertler, P. J., and Neufeld, L. M. (2008). Role of cash in conditional cash transfer programmes for child health, growth, and development: an analysis of Mexico's Oportunidades. The Lancet, 371(9615), 828-837.
Friedman, D. (1994). Business and early childhood care reform. Theory into Practice, 33, 4, 235-241 FSG. (2015). Program To Improve Private Preschool Education (PIPE). Scaling Affordable Private Sector Preschool Solutions. Retrieved from https://www.fsg.org/sites/default/files/20160825%20PIPE%20 Dissemination%20Event%20Presentation.pdf
Ganotra, K. (February 02, 2017a). Budget 2017-18 disheartening for children. Down to Earth. Retrieved from http://www.downtoearth.org.in/blog/budget-disheartening-for-children-56953
Ganotra, K. (February 06, 2017b). Union Budget 2017. Education: What did our kids get? Allocation remains at 10 year low. Financial Express. Retrieved from http://www.financialexpress.com/budget/ budget-and-you-2017/union-budget-2017-education-what-did-our-kids-get-allocation-remains-at10-yr-low/538914/
Gill, S., Winters, D., and Friedman, D. S. (2006). Educators’ views of pre-kindergarten and kindergarten readiness and transition practices. Contemporary Issues in EarlyChildhood, 7,3, 213-227.
Government of Odisha website. http://odisha.gov.in/
Government of Telangana. (2015). Telangana Social Development Report 2017. Retrieved from http:// www.telangana.gov.in/downloads/reports
EARLY YEARS
HAQ. (2016) Budget for Children 2016-17. Not even half Way through its Demographic Dividend. New Delhi: HAQ: Centre for Child Rights. Retrieved from http://haqcrc.org/wp-content/uploads/2016/03/ budget-for-children-2016-17-not-even-halfway-through-its-demographic-dividend1.pdf
Jha, J. (2016). Education India private limited. IIC Quarterly: Education at the Crossroads , 42, 39-51. New Delhi : India International Centre.
Kapoor, S. (2006). Early childhood care and education: An Indian perspective. In Edward Melhuish and Konstantinos Petrogiannis (Eds.), Early Childhood Care and Education: International Perspectives (pp. 133-150). Oxon: Routledge
Kaul, V., and Sankar, D. (2009). Early childhood care and education in India. Education for All Mid-Decade Assessment. New Delhi: National University of Educational Planning and Administration (NUEPA). Kaul, V., Mathur, P., Kohli, P., and Chadha, P. (2012). Early Childhood Care Education in India: A Snapshot: ECED Brief II. Retrieved from http://centralsquarefoundation.org/wp-content/uploads/2016/02/EarlyChildhood-Education-in-India-A-Snapshot.pdf
Kaul, V.,Bhattacharjea, S.,Chaudhary, A.B.,Ramanujam, P.,Banerji, and Nanda, M. (2017). The India Early Education Impact Study. New Delhi: UNICEF
Legrand, J., Grover, D., and Schwethelm, B. (2015). Institutionalization and the Early Childhood Years: Perspectives from Central and Eastern Europe and the Commonwealth of Independent States. Paris: UNESCO Lokshin, M., Das Gupta, M., Gragnolati, M., and Ivaschenko, O. (2005). Improving child nutrition? The Integrated Child Development Services in India. Development and Change, 36,4, 613-640
Melhuish, E., and Petrogiannis, K. (Eds.). (2006). Early Childhood Care & Education: International Perspectives. Routledge.
MHRD. (2013). Status Report: CABE Committee on “Extension of the Right of Children to Free and Compulsory Education Act 2009 to Pre-school Education and Secondary Education”. New Delhi: Ministry of Human Resource Development, Government of India MWCD. (n.d.). ICDS Mission: The Broad Framework for Implementation. New Delhi: Ministry of Women and Child Development, Government of India. MWCD. (2013). National Early Childhood Care and Education Policy (NECCEP). New Delhi: Ministry for Women and Child development, Government of India. MWCD. (2014). Rapid Survey on Children (2013-14) National Report. New Delhi: Ministry of Women and Child Development, Government of India and UNICEF MWCD. (2016). Rajiv Gandhi National Creche Scheme for the Children of Working Mothers. New Delhi: Ministry of Women and Child Development, Government of India Myers, R.G. (2007). Quality in Program of Early Childhood Care and Education. Education for All: Global Monitoring Report. Paris: UNESCO.
Nambissan, G.B. (2012). Low-Cost Private Schools for the Poor in India: Some Reflections. In IDFC Foundation, India Infrastructure Report, pp. 84-93.
IIPS. (2015-16).National Family Health Survey 4 (NFHS 4) India and State Fact Sheets Mumbai: International Institute of Population Studies. Retrieved from http://rchiips.org/nfhs/factsheet_NFHS-4.shtml
NIPCCD. (2006). Three Decades of ICDS: An Appraisal. New Delhi: National Institute of Public Cooperation and Child Development NIPCCD. (2014). Statistics on Children in India: Handbook 2014. New Delhi: National Institute of Public Cooperation and Child Development
NIPCCD. (2016). Annual Report 2015-16. New Delhi: National Institute of Public Cooperation and Child Development
OECD. (2001). Starting Strong: Early Childhood Education and Care. Paris: Organization for Economic Cooperation and Development
OECD. (2006) Strong II, O. S. Early Childhood Education and Care. Paris: Organization for Economic Co-operation and Development. Ohara, Y. (2013). Early Childhood Care and Education in India. Graduate School of Asia-Pacific Studies, Tokyo, Japan. Retrieved From http://www.childresearch.net/projects/ecec/2013_13.html
Parliament of India, Rajya Sabha. (2016). Demands for Grants 2016-17 (Demand No. 97) of the Ministry of Women and Child Development. Report No. 278. New Delhi: Rajya Sabha Secretariat. Retrieved from http://164.100.47.5/newcommittee/reports/ EnglishCommittees/Committee%20on%20HRD/278.pdf Pence, A., and Hix-Small, H. (2009). Global children in the shadow of the global child. International Journal of Education Policy, Research and Practice: Reconceptualizing Childhood Studies, 8,1, 83-100
Planning Commission. (2011). Report of the Inter Ministerial Group on ICDS Restructuring. New Delhi: Planning Commission. Retrieved from http://planningcommission.nic.in/reports/genrep/rep_icds2704. pdf
Rajan, P., Gangbar, J., and Gayathri, K. (2014). Child and Maternal Health and Nutrition in South Asia: Lessons for India. Working Paper 323. Bangalore: Institute for Social and Economic Change. Retrieved from http://www.isec.ac.in/WP%20323%20-%20K%20Gayithri_1.pdf
Rao,N., and Sun, J. (2015). Quality Early Childhood Care and Education in Low-resource Level Countries in Asia Paris: UNESCO
Ruel, M., and Hoddinott, J. (2008). Investing in early childhood nutrition (No. 8). International Food Policy Research Institute (IFPRI). Retrieved From https://econpapers.repec.org/paper/fprpolbrf/8.htm
Serpell, R., and Nsamenang, A.B., (2015). The Challenge of Local Relevance: Using the Wealth of African Cultures in ECCE Programme Development. Paris: UNESCO Sinha, D., and Bhatia, V. (2009) Learning from Models of ECCD Provision in India. Retrieved from http:// www.forces.org.in/publications/documentsforwebsite/ Dipa_Sinha_ECCD_in _India.pdf
Soni, R. (2013). Status of Implementation of RTE Act-2009 in context of disadvantaged children at elementary stage. New Delhi: National Council for Educational Research and Training. Soudee, A. R. (2009). Incorporating indigenous knowledge and practice into ECCE: A comparison of programs in the Gambia, Senegal and Mali. Current Issues in Comparative Education, 11, 15-23.
Technavio (2016). Preschool or Child Care Market in India 2016-2020. Retrieved from https://www. technavio.com/report/india-k12-and-higher-education-preschool-or-child-care-market UNESCO. (2015) Investing Against Evidence: The Global State of Early Childhood Care and Education. Paris:UNESCO Publishing UNESCO. (2016). New Horizons: A Review of Early Childhood Care and Education in Asia and the Pacific. Paris and Bangkok: UNESCO Paris and Bangkok
UNICEF. (2008). The Child Care Transition: A league Table of Early Childhood Education and Care in Economically Advanced Countries. Innocenti Report Card 8.Florence: UNICEF Innocenti Research Centre
UNICEF. (2015). Early Childhood Education: A Statistical Snapshot. New York: UNICEF.
UNICEF. (2016). The State of the World’s Children: A Fair Chance for Every Child. New York: UNICEF WHO. (2015). Global Health Observatory. Retrieved From http://www.who.int/gho/child_ health/ mortality/neonatal_infant_text/en/ Woodhead, M. (2007). Changing Perspectives on Early Childhood: Theory, Research and Policy. Education for All: Global Monitoring Report. Paris: UNESCO. Yoshikawa, H., Weiland, C., Brooks-Gunn, J., Burchinal, M. R., Espinosa, L. M., Gormley, W. T., ... and Zaslow, M. J. (2013). Investing in our Future: The Evidence Base on Preschool Education. Retrieved from http://www.srcd.org/sites/default/files/documents/washington /mb_2013_10_16_investing_in_ children.pdf