e-ISSN :2378-703X
Volume-07, Issue-01, pp-241-250
www.ajhssr.com

e-ISSN :2378-703X
Volume-07, Issue-01, pp-241-250
www.ajhssr.com
Magister of Accounting, Universitas Trisakti, Jakarta, Indonesia Email :devitania2501@gmail.com , hasnawati@trisakti.ac.id
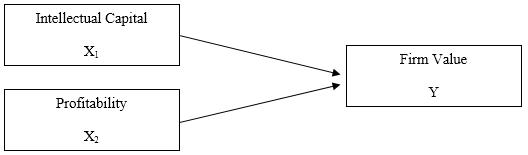
ABSTRACT : This research aims to determine the effect of intellectual capital and profitability on firm value in bank subsector companies listed on the Indonesia Stock Exchange from 2017 to 2021. The independent variable, namely intellectual capital, is measured by VAIC™ which is proxied by value added capital employed (VACA), value added human capital (VAHU), and structural capital value added (STVA), and profitability is proxied by ROE (return on equity). The dependent variable in this study is firm value as proxied by Tobin's Q. The data analysis technique used in this study was purposive sampling approach through the SPSS application. Form the result of research show there is no significant effect between intellectual capital toward firm value and there is a significant effect between profitability toward firm value.
KEYWORD: Intellectual Capital, VAICTM, VACA, VAHU,STVA, ROE, Tobins’ Q, Signalling Theory
Globalization, technology, and innovation are currently growing in the business world, thus indirectly forcing companies to continue to make updates in running their businesses to increase corporate value. Business competition must be balanced with consideration and knowledge of good resources in order to compete with both domestic and foreign companies. Companies that implement knowledge-based business in knowledge management as a means of earning income will see their company's value change (Sunarsih & Mendra, 2011).
Tobin's Q is one of several factors that can be used to calculate firm value.The higher the Tobin's Q value, the better the company's growth prospects.It can be seen that the greater the market value of the company's assets compared to the book value of the company's assets, the greater the willingness of investors to make more sacrifices to be able to own the company (Sukamaja, 2004). In addition to Tobin's Q, company value can also be measured based on the company's stock market price because the stock market price can reflect investors' assessments of the overall equity it owns (Wahyudi & Pawestri, 2006).
If the company's value is determined solely by its physical assets, the results will differ from the market value because other, intangible factors influence it. This value arises because there is a difference between the stock price and the book value of the company's assets. More appreciation of the company's shares from investors is believed to be caused by the company's intellectual capital (IC) (Sunarsih and Mendra, 2012). Wu et al. (2008), in Hadiwijaya (2013), provide a definition of IC in a broad sense, namely as an intangible asset owned by a company. According to Nugroho (2012), intellectual capital is knowledge and intellectual property that is able to find opportunities and manage threats so that they can affect the company's resilience and competitive advantage.
Knowledge assets are one of the essential components of business and sustainable resources needed to gain and maintain a competitive advantage. Intellectual capital (IC) is information and knowledge that can be applied to a job to create value for the company (Williams, 2001). The indicator used to detect intellectual capital is the Value Added Intellectual Coefficient (VAIC). VAIC is a method developed by Pulic (1998), and VAIC is a tool used to measure the performance of a company's intellectual capital. VAIC consists of three components, namely VACA (value-added capital employed), VAHU (value-added human capital), and STVA (structural capital value added).
Profitability is a ratio that can describe a company's ability to earn profits. According to Bringham and Houston (2001), profitability can be said to be a company's ability to generate net income from activities carried out in the accounting period. The goal of investors investing in the company is to get a good return. The greater the ability to earn profits, the greater the return expected by investors, and thus the greater the company's value. The importance of profitability can be seen by considering the impact that comes from the company's inability to obtain maximum profits to support its operational activities. When the company gets the maximum profit, it will have an impact on increasing the value of the company. Investors will be more interested in investing in
companies with high profits. This is captured as a positive signaling theory by investors so that they will be motivated to increase their share demand transactions, which will have an impact on increasing firm value. This research refers to research conducted by Rivandi and Septiano (2020) researchers to see how the presence of intellectual capital disclosure and profitability will affect the variable value of the company. Researchers see that there are many differences in the results of research conducted by previous researchers, and researchers see that company value plays a very important role in improving company performance. The increasing value of the company will have a big impact on the increase in the company's stock price. Rising share prices will provide welfare for shareholders.
The difference between this research and the previous research conducted by Rivandi and Septiano (2020), namely the first year of research observation, If the previous research conducted observed manufacturing companies listed on the Indonesia Stock Exchange, in this study, the researchers took a sample of sub-sector bank companies listed on the Indonesia Stock Exchange from 2017 to 2021. The aim of this study was to provide empirical evidence regarding the effect of intellectual capital and profitability on firm value. Research conducted by Rivandi and Septiano (2020) concluded that intellectual capital and profitability have a positive and significant influence on company value. Market value is able to provide maximum welfare to shareholders. An increase in share price can reflect the company's assets. This is supported by research conducted by Nopianti and Suparno (2021) concluding that profitability has a significant positive effect on company value.
Based on the background that has been described above, there are still gaps between research results, which results in inconsistent results or information inconsistencies. These results raise the desire of researchers to carry out developments in similar research under the title "Influence of Intellectual Capital and Profitability on Firm Value."
Signaling Theory, according to Brigham and Houston (2017), reveals that signaling theory is an indication from company management (internal parties) regarding how the company's prospects are in the future. This signal can contain information about what management does in its business activities. This information will be useful for investors in responding and can be used as a basis for making investment decisions. When the signal given is good or good news, the company's shares will be in demand by investors, and the company's stock price will increase.
According to Fauziah (2017), signaling theory is a guide made by companies for investors. Instructions from these signals can take various forms, both those that can be directly observed and those that must be studied more deeply to find out. Signals conveyed through corporate actions can be either positive or negative. The signal theory perspective emphasizes that companies can increase firm value by providing signals to investors through reporting regarding company performance so that they can provide an overview of prospects in the future. The higher the profitability figures reflected in the financial statements, the better the financial performance of a company. The growth of the company's prospects for the future as perceived by investors is captured as a positive signal so that it can increase the value of the company (Ayu & Suarjaya, 2017).
Resource-based theory (RBT) or resource-based economics is a theory developed to analyze the competitive advantage of a company that emphasizes the superiority of knowledge (a knowledge or learning economy) or an economy that relies on intangible assets (intangible assets). This theory discusses the resources owned by companies and how companies can develop competitive advantages from the resources they have. To develop a competitive advantage, companies must have resources and skills that exceed their competitors' (Cheng et al. 2010).
Tobin's Q is one of several factors that can be used to calculate firm value.The higher the Tobin's Q value, the better the company's growth prospects.This can be seen because the greater the market value of the company's assets compared to the book value of the company's assets, the greater the willingness of investors to make more sacrifices to be able to own the company (Sukamaja, 2004).
Intellectual capital is information and knowledge that can be applied to a job to create value for the company (Williams, 2001). In general, intellectual capital is divided into three components, namely customer capital, human capital, and structural capital. VAIC (value-added intellectual coefficient) is a method developed by Pulic (1998) and a tool used to measure the performance of a company's intellectual capital. The three components of VAIC are value-added capital employed (VACA), value-added human capital (VAHU), and structural capital value added (STVA).
According to Ulum (2005), intellectual capital is the definition of the amount of what is produced by the three main elements in the organization, namely human capital, structure capital, and customer capital, which are interrelated with knowledge and technology that can provide added value to the company in the form of organizational competitive advantage.
Profitability is the company's ability to generate profits at a certain level of sales, assets, and share capital. According to Bringham (2001), profitability is the end result of a series of policies and management decisions, where these policies and decisions concern the sources and use of funds in carrying out the company's operations listed in the statement of financial position. Profitability financial ratios are needed by investors in the long term to analyze profits to be received in the form of dividends (Saleh, 2008). The profit level is used as a way to assess the success of the company's effectiveness, related to the final results of various company policies and decisions that have been implemented by the company in the current period (Saleh, 2008).
The framework of thought in this study can be described as follows:
The stakeholder theory states that a company is not an entity that only operates for its own sake but must also provide benefits to its stakeholders (Ulum et al. 2008). Resources that are managed optimally can increase the value of the company, which will then increase company profits and generate profits for shareholders. Investors in the capital market will show appreciation for the advantages of intellectual capital owned by companies by investing in them, so that it will have an impact on increasing company value. Increasing the value of the company is directly proportional to the utilization of intellectual capital; if the performance and achievements of intellectual capital increase, the value of the company will also increase.
Randa and Solon (2012) tested the effect of intellectual capital on firm value. The results state that intellectual capital has a positive effect on firm value in the context of manufacturing companies listed on the Indonesia Stock Exchange. Solikhah's research (2010) shows that there is a significant positive effect between intellectual capital and company value, as proxied by PBV (price-to-book value). Chen (2005) states that intellectual capital has a positive influence on firm value. Based on the explanation and description above, the researcher formulates the first hypothesis as follows:
H1: Intellectual capital has a positive effect on firm value
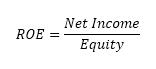
Profitability is a measure of management's performance in managing the company. ROE (return on equity) can be used to calculate company profitability by dividing earning after tax by own capital.The higher the ROE, the higher the company's ability to generate profits, which will make the company's profitability high. High profitability will provide a positive signal to investors that the company is in a favorable condition. This is an attraction for investors to own company shares. According to research conducted by Intan & Sudiartha (2006), Dhani & Utama (2017), Rivandi (2018), Susila & Prena (2019), and Chasanah (2019), profitability has a positive effect on company value. The success of a company in managing can increase profits, which illustrate the good performance of the company so that it can attract investors to invest. Based on the theory and reinforced by the results of the research, the second hypothesis proposed in this study is:
H2: Profitability has a positive effect on firm value
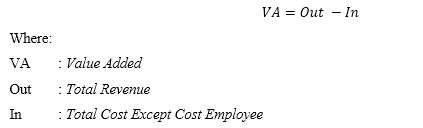
Intellectual capital as measured by VAICTM (Value Added Intellectual Coefficient). VAICTM is a method for measuring the performance of a company's intellectual capital (Pulic in Ulum, 2009). This method is the easiest approach because the data needed to calculate VAICTM is contained in the company's financial statements, namely the statement of financial position and income statement. This model begins with a company's ability to generate value added (VA). Value added is the most objective indicator for assessing business success and shows the company's ability to create value (value creation). VA is calculated as the difference between output and input. Output represents revenue and includes all products and services sold in the market, while input includes all expenses used to earn revenue. Calculation of Value Added:
The VAICTM component consists of 3 components according to Pulic (1998) in Sasongko et al. (2019), namely:
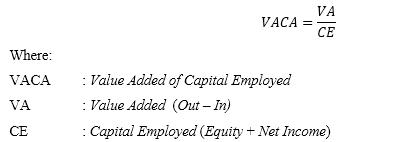
1. Physical Capital (VACA - Value Added of Capital Employed)is an indicator for the VA produced by one physical unit of capital (capital used). This ratio shows the contribution each unit of CE makes to the organization's VA.
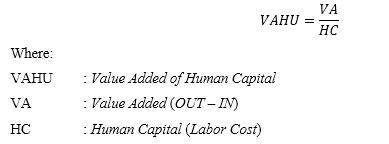
2. Human Capital (VAHU - Value Added of Human Capital)VAHU is an indicator for the VA produced by one unit of human capital (labor cost). VAHU measures the ability of human resources contained in a company to generate added value for the company.
3. Structural Capital (STVA - Structural Capital Value Added)shows the contribution of structural capital (SC) in generating added value. STVA measures how many SCs are needed to generate VA and is an indication of how successful SCs are at creating value.

The sum of the three ratios is formulated in a unique new indicator, namely VAICTM . The profitability measurement used in this study is the return on equity (ROE) ratio. This ratio examines the extent to which a company uses its resources to be able to provide a return on its own capital. This ratio shows the power to generate a return on investment based on the book value of the shareholders. The following is the formula used to calculate the return on equity (Hery, 2016):
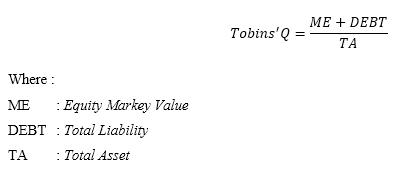
Firm value in this study is measured by the company's Tobin's Q value indicator. The following is the formula for company value with the Tobin's Q indicator:
The research population is the banking sub-sector companies on the Indonesia Stock Exchange from 2012 to 2021. The sampling technique uses purposeful sampling, namely sampling subjects based on predetermined criteria, namely (1) banking companies listed on the IDX (2) companies that publish annual financial reports for the study period from 2017 to 2021 (3) will use panel data to unbalance (4) book banking companies Based on the established criteria, a sample of ten companies is obtained. Based on predetermined criteria, ten banks were included in book category 4 for a period of five years (2017
2021), so the total number of observations became 50. The following is the result of a descriptive statistical analysis of ten banking companies on the Indonesia Stock Exchange from 2017 to 2021, as follows:
According to the table above, the number of valid data points, or N data points, in this study is 50. All of the data used in this study were obtained from 10 banking sub-sector companies listed on the Indonesia Stock Exchange between 2017 and 2021. The data displayed consists of the intellectual capital variable proxied by VAIC, which has a minimum value of 3.6315 and a maximum value of 7.4698; profitability proxied by ROE has a minimum value of 2.2900 and a maximum value of 19.1300; and company value proxied by TOBIN's Q has a minimum value of 0.8700 and a maximum value of 1.7100.
The classical assumption test is a statistical requirement that must be met in multiple linear analyses. The classic assumption test that must be fulfilled in the linear regression model is that the residuals are normally distributed, there is no multicollinearity, there is no heteroscedasticity, and there is no autocorrelation in the multiple linear regression model.
The normality test used in this study is the one-sample Kolmogorov-Smirnov method, where the residual values are said to be normally distributed if the significance is greater than 0.05. Conversely, if the significance is less than 0.05, the residual value is said to be not normally distributed. Testing for normality with the one-sample Kolmogorov-Smirnov test method, the output is presented in the following table:
The asymptotic value, Sig. (2-tailed), of 0.007 can be seen from the SPSS output for the normality test in the table above. This shows that the residuals in this study are not normally distributed because the asymp. sig. (2-tailed) is less than 0.05. so that the assumption of normality has not been met. In order for the residuals to be normally distributed, the authors eliminated data that were outliers with a z-score limit of 2.5 and then performed a transformation in the form of lag on all independent and dependent variables. The original research data set of 50 data points was reduced to 41.The following presents the output of the normality retest after eliminating outliers and transforming the data in the table as follows:
b.
c. Lilliefors Significance Correction.
Based on the table above, the results of the one-sample Kolmogorov-Smirnov test show the asymptotic value. sig. (2-tailed), which is equal to 0.126. The significance value is greater than 0.05, so it can be seen that this regression model is normally distributed.
b. Multicollinearity Test
The multicollinearity test is used to determine whether or not there is a correlation between the independent variables. The research data is said to have no multicollinearity if the tolerance value is more than 0.1 and the VIF value is less than 10. The results of the multicollinearity test are presented in the following table:
a. Dependent Variable: Lag_TOBINS_Q
Based on the table above, it can be seen that the tolerance and VIF values are different for each independent variable. The intellectual capital variable has a tolerance value of 0.917 and a VIF of 1.091. The profitability variable has a tolerance value of 0.917 and a VIF of 1.091. So it shows that the tolerance value of these two variables is more than 0.01 and the VIF value of these four variables is less than 10. Thus, based on the test results using the tolerance value and VIF value, there is no multicollinearity problem.
The heteroscedasticity test in this study used the Glejser test method. This test can be done by correlating the independent variables with the residual value. If the significance value of the independent variable is more than 0.05, then there is no heteroscedasticity problem. Conversely, if the significance value of the independent variable is less than 0.05, then there is a heteroscedasticity problem.
Coefficientsa
Based on the table above, it can be seen that the significance value for the intellectual capital variable is 0.731 and the profitability variable is 0.680. Thus, it can be concluded that this regression model does not show symptoms of heteroscedasticity and that homoscedasticity occurs. This is indicated by each independent variable having a significance value greater than 0.05.
d. Autocorrelation Test
The autocorrelation test aims to test whether, in the regression model, there is a correlation between one observation and another. In this study, the authors used the Runs test. The Runs test has testing criteria, namely a significance value greater than 0.05. Following are the results of the autocorrelation test:
Based on the SPSS output for testing autocorrelation with the Runs test method, it shows the asymptotic value. sig (2-tailed) has a value of 0.755. Asymp value. Sig. (2-tailed) is greater than 0.05 (0.755 > 0.05), so there is no autocorrelation in this regression model.
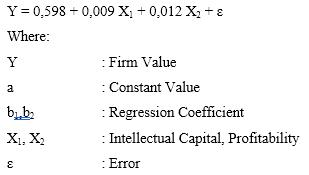
Multiple linear analysis aims to analyze the magnitude of the influence between two or more independent variables on the dependent variable. The analysis was carried out to see whether there is an influence between the independent variables and the dependent variable. In addition, this multiple regression analysis can determine the effect of a positive or negative relationship between the independent variables and the dependent variable. Based on the results of multiple liner tests, multiple linear regression equations can be formed in this study with the following mathematical model:
The discussion regarding the multiple linear regression equation is as follows:
a. A constant value of 0.598 means that if the values of the intellectual capital and profitability variables are both 0, then the company value is 0.598.
b. The regression coefficient value of the intellectual capital variable is 0.009, meaning that for every unit increase in intellectual capital, the value of the company will increase by 0.009, assuming that the other independent variables have a fixed value.
c. The value of the regression coefficient of the profitability variable is 0.012, meaning that for every unit increase in profitability, the value of the company will decrease by 0.012, assuming that the other independent variables have a fixed value.
The coefficient of determination is used to determine how strong the model's ability to explain the dependent variable is. The value of the coefficient of determination is indicated by the adjusted R square. The adjusted R-square value has a value of zero to one. If the resulting value is close to one, then the ability to explain the independent variables with the dependent variable is strong. When the coefficient value is close to zero, it means that there are limited explanations for the dependent variable. The following are the results of the correlation test and the coefficient of determination in the table, as follows:
Model Summaryb
Based on the SPSS output shown, it can be seen that the correlation coefficient value is 0.542. means that the correlation between intellectual capital and profitability variables on firm value has a moderate level of
relationship between variables. The results of the determination test show an adjusted R square value of 0.257. This value explains the ability of variable intellectual capital and profitability in explaining the company's value of 25%.while the remaining 75 percent is influenced by other variables not analyzed in this study.
The F test was carried out with the aim of testing whether the effect of all independent variables on one dependent variable, as formulated in a multiple linear regression equation model, is fit. Testing is done by looking at the significance value. If the test results show a significance value of more than 0.05, then the research model is not feasible to test; otherwise, if the significance value is less than 0.05, then the research model is feasible to use.
a. Dependent Variable: Lag_TOBINS_Q
b. Predictors: (Constant), Lag_ROE, Lag_VAIC
The table above shows the significance value in this study of 0.001. The significance value is below 0.05 (0.0010.05). These results indicate that the research model for examining the effect of intellectual capital and profitability on firm value is not feasible to test. The t test aims to test the effect of each independent variable on the dependent variable. The decision-making criterion for the t test is that if the significance value is greater than 0.05, then it can be said that there is no significant influence between the independent and dependent variables. However, when the test has a smaller significance value of 0.05, there is a significant influence between the independent and dependent variables. The results of the t test can be seen in the multicollinearity test table. The significant value of intellectual capital has a significance value of 0.536, which is greater than 0.05; thus, intellectual capital has no effect on firm value. The significance value of profitability has a significance value of 0.001; thus, profitability affects the value of the company.
Based on the research results, the following describes the discussion of the effect of each variable on firm value:
The hypothesis built in this study states that the intellectual capital variable has a positive effect on firm value. Intellectual capital influences the increase in financial performance, especially the company's performance in seeking profits, namely profitability through company assets. These results reflect that an increase in the value of a company's intellectual capital will be able to increase the value of the company, so that financial performance is directly proportional to changes or growth in intellectual capital.
The results of the tests conducted show that intellectual capital has no significant effect on firm value. The difference between the test results and the hypothesis is that technology in banking companies is progressing rapidly, or what is also called "industry 4.0," so it does not require a large number of laborers. This can be caused by measuring intellectual capital, which has long been irrelevant for measuring banking performance because the situation is different. Based on this description, it can be seen that the activity does not affect the value of the company. The results of this study did not show positive or negative values. So it is stated that the results of this study were rejected.
The hypothesis built in this study states that the profitability variable has a positive effect on firm value. Profitability is critical for businesses to maintain their performance.This is because profitability shows whether the company has good prospects for the future or not. The higher the profitability, the higher the rate of return on investment for shareholders, so that the value of the company will also increase. In contrast, the lower the profitability, the lower the firm's value.
The results of the tests performed show that profitability has a significant effect on the direction of the positive coefficient on firm value. Thus, it can be concluded that profitability has a positive effect on firm value. This means that the higher the profitability, the faster the value of the company increases. so that the third hypothesis proposed in this study is accepted. If managers are able to manage the company well, the costs incurred will be smaller, so the profits generated will be greater. Large profits will affect the value of
the company because of the results obtained through the management of the funds invested. High profitability shows how well run the company is.
Investors are advised to do an analysis first before investing in a company to minimize losses, and investors must be able to find out how the growth of investment in a company will be in the future. For future researchers, it is recommended to use research samples from other companies listed on the IDX over a longer period of time so that the research results can describe the condition of intellectual capital in Indonesia. for future researchers to add the latest research year so as to provide relevant data to determine the current research conditions.
[1]. Ahmadi, Nugroho .(2012). Faktor-Faktor yang MempengaruhiIntellectul capital Disclousure. Accounting Analysis journal . 1(2)
[2]. Ayu, D. P., & Suarjaya, A. . Gede. (2017). Pengaruh Profitabilitas Terhadap Nilai Perusahaan Dengan Corporate Social Responsibility Sebagai Variabel Mediasi Pada Perusahaan Pertambangan. E-Jurnal Manajemen Unud, 6(2), 1112–1138.
[3]. Brigham, E. F., & Houston, J. F. (2017). Dasar-dasar Manajemen Keuangan (A. A. Yulianto (ed.); Edisi 11 B). Salemba Empat.
[4]. Chang, Ming. dan Zwei Ching Tzeng. 2010. The Effect of Leverage on Firm Value and How The Firm Financial Quality Influence on This Effect,World .Journal of Management, 3(2), 30-53.
[5]. Chasanah, A. N. (2019). Pengaruh Rasio Likuiditas, Profitabilitas, Struktur Modal Dan Ukuran Perusahaan Terhadap Nilai Perusahaan Pada Perusahaan Manufaktur Yang Terdaftar Di BEI Tahun 2015-2017. Jurnal Penelitan Ekonomi Dan Bisnis, 3(1), 39–47.
[6]. Chen, Ming-Chin, Shu Ju Cheng, Yuhchang Hwang. 2005. An Empirical Investigation of The Relationship Between Intellectual Capital and Firm’s Market Value and Finance Performance. Journal of Intellectual Capital, 6(2), 159176.
[7]. Dhani, I. P., & Utama, A. . G. S. (2017). Pengaruh Pertumbuhan Perusahaan, Struktur Modal, Dan Profitabilitas Terhadap Nilai Perusahaan. Jurnal Riset Akuntansi Dan Bisnis Airlangga, 2(1), 135
148.
[8]. Fauziah, F. (2017). Kesehatan Bank, Kebijakan Dividen, dan Nilai Perusahaan: Teori dan Kajian Empiris. RV Pustaka Horison.
[9]. Hadiwijaya, R. C. (2013). Pengaruh Intellectual Capital Terhadap Nilai Perusahaan Dengan Kinerja keuangan Sebagai Variabel Intervening. Universitas Diponegoro Semarang, 13(1), 17-27.
[10]. Intan, dewa ayu, & Sudiartha, G. M. (2006). Pengaruh Profitabilitas, Ukuran Perusahaan, Dan Pertumbuhan Aset Terhadap Struktur Modal Dan Nilai Perusahaan. E-Jurnal Manajemen Unud, 6(4), 2222–2252.
[11]. Johari, N., Saleh, N., Jaffar,R. dan Hassan,M. 2008. The Influence of Board Independence, Competency and Ownership on Earning Management in Malaysia. Int.Journal of Economics and Management, 2(2), 281- 306.
[12]. Nopianti, R., & Suparno. (2021). Struktur Modal dan Profitabilitas Terhadap Nilai Perusahaan. Jurn, 8(1).
[13]. Pulic, A. 1998. Measuring The Performnce of Intellectual Potential in Knowledge Economy. Paper presented at the 2nd McMaster Word Congress on Measuring and Managing Intellectual Capital by the Austrian Team for Intellectual Potential.
[14]. Rivandi & Suparno. (2020). Pengaruh Intellectual Capital Disclosure dan Profitabilitas Terhadap Nilai Perusahaan. Jurnal Akuntansi Trisakti, 8(1), 123-126.
[15]. Sasongko, H., Alipudin, A., & Uria, M. Y. (2019). Effect Corporate Social Responsibility , Firm Size , and Intellectual Capital on Firm Value in Indonesia Stock Exchange. International Journal of Latest Engineering and Management Research (IJLEMR), 04(06), 78
89.
[16]. Sukamulja,Sukmawati,(2004),Good Corporate Governance di Sektor Keuangan: Dampak Good Corporate Governance Terhadap Kinerja Keuangan. 8(1), 1-25.
[17]. Sunarsih, N. M., & Mendra, N. P. Y. (2011). Pengaruh Modal Intelektual terhadap Nilai Perusahaan dengan Kinerja Keuangan sebagai Variabel Intervening pada Perusahaan yang terdaftar di Bursa Efek Indonesia. Jurnal Fakultas Ekonomi Universitas Mahasaraswati Denpasar.
[18]. Susila, M. P., & Prena, G. Das. (2019). Pengaruh Keputusan Pendanaan, Kebijakan Deviden, Profitabilitas Dan Corporate Social Responsibility Terhadap Nilai Perusahaan. Jurnal Akuntansi : Kajian Ilmiah Akuntansi (JAK), 6(1), 80.
[19]. Ulum. (2008). Intellectual Capital dan Kinerja Keuangan Perusahaan; Suatu Analisis dengan
Pendekatan Partial Least Squares. Simposium Nasional Akuntansi XI, 23-24. [20]. Wahyudi, & Pawestri. (2006). Implikasi Struktur Kepemilikan Terhadap Nilai Perusahaan dengan
Keputusan sebagai Variabel Intervening. Simposium Nasional Akuntansi 9. [21]. Williams. (2001). Intellectual Capital Performance and Disclosure Practised Related. Journal of Intellectual Capital, 192-203.