American Journal of Humanities and Social Sciences Research (AJHSSR) 2022
Table 1: Prevalence of child malnutrition by districts (Stunting with Hight for age)
District Percentage below 3 SD
Percentage below 2 SD Mean Z Score District
Colombo 4.3 15.6 0.7
Gampaha 2.9 12.8 0.8
Kalutara 1.7 12.5 0.7
Kandy 5.2 26 1.2
Percentage below 3 SD
Percentage below 2 SD Mean Z Score
Killinochchi 6.6 20.9 1.1
Batticaloa 3.6 20.6 1.1
Ampara 7.2 21.9 1.1
Trincomalee 3.5 15.5 1
Matale 14 1 Kurunegala 2 17.7 1
Nuwara Eliya 10 32.4 1.5
Galle 3.7 12.5 0.8
Matara 3.8 15.6 0.9
Puttalam 2.9 11.7 0.7
Anuradhapura 5.9 19.1 1.1
Polonnaruwa 3 11.1 0.8
Hambanto ta 2.6 11.8 0.9 Badulla 6.5 20.6 1.2
Jaffna 1.5 13.7 0.8
Monaragala 3.5 15.9 0.7
Mannar 4.6 20.8 1.1 Rathnapura 4 17.8 1.1
Vavuniya 6.1 18.7 0.9 Kegalle 8.4 23.1 1.2 Mullative 6 16.7 0.9
Source: Department of Census and Statistics, 2017
Table 1 indicates the evidence of malicious malnutrition levels for all districts in Sri Lanka. It clearly shows that the incidence of malnutrition in terms of stunting (HFA) is highest in Nuwara Eliya district. It is 32.4% and 10% below 2 SD and below 3 SD respectively [8]. In addition, in many districts including Mannar, Killinochchi, Batticaloa, Ampara, Badulla, Kegalla malnutrition is critically high. However, Sri Lanka has not been paying an adequate attention to improving nutritional status among children. Also, the research studies aimed at investigating economic determinants of malnutrition among school children in Sri Lanka are very limited even though the well nourished and healthier children are vital in achieving economic development of the country. The objective of this study is to investigate the economic determinants of malnutrition among school children in the Nuwara Eliya district, Sri Lanka. Finding of this study will support policymakers in formulating effective policies to reduce child malnutrition backing up to reach the country development goal.
II. LITERATURE REVIEW
Different approaches are existing in detecting child malnutrition. Theoretically, the term malnutrition is broadly defined in two aspects as overnutrition and undernutrition [1]. However, child malnutrition is much talked in term of undernutrition. Widely used anthropometric indicesavailable to assess the incidence of child malnutrition are Weight For Age (WFA), Height For Age (HFA) and Weight For Height (WFH) [9].Low weight for age, low height for age and low weight for height are known as malnutrition in the aspects of underweight, stunting and wasting respectively [9].
Previous literature has demonstrated various economic determinants of child malnutrition in different countries. An association between family income and malnutrition has been found and observed that having lower family incomes increases the prevalence of malnutrition [10]. Similarly, it was illustrated that being a child from low family income appeared to be highly malnourished [11],[4]. Nutritional status of children in rural areas are influenced by the level of parental income[12]. In Sri Lanka, it has been investigated thatlow monthly income appeared to be an important factor associated with undernutrition [13], [14], [15]. Income is associated with improving nutritional status at the upper end of the conditional weight and height distributions [16]. Higher pay is a main attribute to the nutritional status of children [12]. Poverty of household was suggested as strong and significant predictors of stunting, wasting and underweight [17]. Total expenditure had a significant effect on malnutrition [18]. Higher availability of employment is a main attribute to the nutritional status of urban children [12]. Nutrition was significantly associated with paternal occupation. [19]. It has found that mother’s occupation as physical labor as a key factor for malnutrition [1]. Maternal employment appeared to be an important factor associated with undernutrition [12]. Maternal occupation and paternal occupation showed statistically significant association with nutritional status of children [20].Childhood malnutrition has a higher possibility of being because of the economic decision to sell more than the population consumes [21].
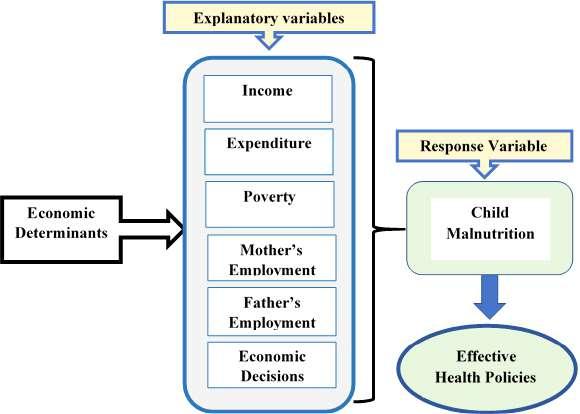
Following Fig. 1 indicates the proposed conceptual frame work which developed based on the literature for the relationships between economic determinants and child malnutrition.
AJHSSR Journal Page | 120
Figure 1: Conceptual framework
Source: Developed by the researcher, 2022
Hypothesis: following hypothesis will be tested using empirical data to investigate the objective of the study.
Null: There is not a significant impact of economic determinants on malnutrition among school children in the Nuwara Eliya district, Sri Lanka
Alternative: There is a significant impact of economic determinants on malnutrition among school children in the Nuwara Eliya district, Sri Lanka
III. METHODOLOGY
This study was based on the quantitative research approach. The study used primary data gathered through structured questionnaire as the main data collection method. In addition, face to face interview method was adopted in data collection. The sample was selected from grade 6 school children of government schools in the Nuwara Eliya district, Sri Lanka applying multi stage stratified random sampling technique.
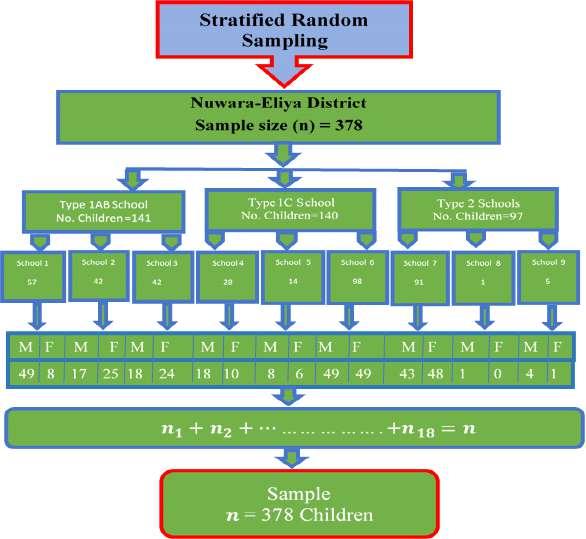
Figure 2: Sampling procedure
Source: Developed by the researcher, 2022
American Journal of Humanities and Social Sciences Research (AJHSSR) 2022 AJHSSR Journal Page | 121
American Journal of Humanities and Social Sciences Research (AJHSSR) 2022
At the first stage, Nuwara Eliya district was selected from 25 districts in Sri Lanka as the study area purposelydue to high prevalence of child malnutrition. The government schools have been categorized in to four types i.e., type 1AB schools, type 1C schools, Type 2 schools and types 3 schools. As demonstrates in Fig. 2, three types of schools which hold grade 6 classes were considered as strata. Three schools from each type were selected randomly at the second stage. The final sampling units are grade six school children. The sample size was 378 and it was decided based on the Morgan table. Finally, sampling units were selected from grade 6 classes of the selected schools. Proportional allocation was utilized in deciding the number of male and female children. To ensure the randomness, the lottery method and random number table were adopted to select the schools from each type of school and final units (children) respectively. Considering the accuracy and consistency, the information was gathered from the parents of the selected 378 grade six school children. The ethical approval to conduct the research was obtained from ethics review committee, University of Kelaniya, Sri Lanka and agreed not to reveal individual identity of both children and schools.
Table 2: Descriptions of the variables used in the study
Variables Dependant Independent Type of variable Measurement Scale
Income
Continuous Ratio
Continuous Ratio Expenditure
Poverty √ Categorical (Binary) Nominal Mother’s
(Multi category) Nominal Father’s
(Multi category) Nominal
(Binary) Nominal
Developed by the researcher, 2022
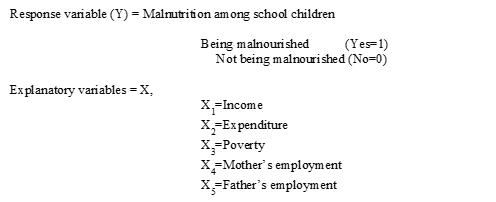
The variable types and measurement scales of the response and explanatory variables ascertained for this study are given in table 2. The responses variable was measured in binary nominal scale as suffering from malnutrition coded as 1 while not suffering from malnutrition coded as 0. Three types of child malnutrition are prevailing as wasting, underweight and stunting and the malnutrition classifications were based on global standards: <−3 z score, <−2 z score, and ≥−2 z score [22]. Malnutrition in term of stunting was considered in this study and it was measured using Hight For Age (HFA) Z score.
formula to obtain HFA
score
Children with HFA z score below
SD of the median of reference population were considered as malnourished (stunted) and others are not malnourished (not stunted). The explanatory variables used in this study are the economic determinates. Income and expenditure are total monthly family income and expenditure and they were used as continuous variables while poverty, mother’s employment and father’s employment as categorical variables. The families entitled for Samurdhi was considered as poor while others are as non poor.
The key technique of investigating economic determinants of child malnutrition is the multiple binary logistic regression analysis (Binary logit model). Descriptive statistics were used to identify the distinct characteristics of the sample. In addition, ANOVA, Pearson's correlation, t test and chi square test, Kolmogorov Smirnova test and Q Q plot were utilized to fulfil some requirements for the main analysis. To check whether the assumptions for logistic regression are violated, types of explanatory variables are essential. The explanatory variables in
AJHSSR Journal Page | 122
√
√
employment √ Categorical
employment √ Categorical
Malnutrition √ Categorical
Source:
The
z
is ���������������� = ���� ���� ������ Where, ��0 =������������������������������������������������������������������������������ ���� =���������������������������������������������������������������������������������������������� ������ =����������������������������������������������������������������������������������������������������������
−2
American
of Humanities and Social Sciences

logistic model belong to continuous, binary categorical and multi categorical. Therefore, different tests were used for checking multicollinearity depends on the types of explanatory variables.
The Binary Logistic Regression model is used in the analysis as follows
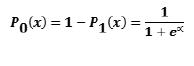
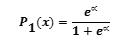

For Malnourished
For not Malnourished
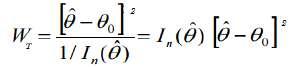
Wald test Statistics as given below was applied to check the significance of each explanatory variables
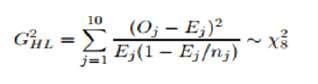
Overall googness of fit of the logistic model was assesed by Hosmer and Lemeshow goodness of fit test statistics as given below
IV. Result and Discussion
4.1 Key Characteristics of the sample
The distribution of the sample of 378 school children was presented using descriptive statistics and the graphical approach regarding the economic characteristics such as income, expenditure, poverty, mother’s employment, and father’s employment. In addition, the study considered some of the other individual characteristics; gender, living sector, race, religion and types of school in identifying the nature of sample distribution.
Table 3: Descriptive Statistics of the sample Characteristics Categories Having Malnutrition All (%)
(%) No (%)
Gender Male 14 86 55
Journal
Research (AJHSSR) 2022 AJHSSR Journal Page | 123
Yes
American Journal of Humanities and Social Sciences Research (AJHSSR) 2022
Female 33 67 45
Living Sector Urban 29 71 21 Rural 21 79 68 Estate 28 73 11
Race Sinhala 22 78 72 Tamil 28 72 24 Muslim 29 71 2 Burger 0 100 2
Religion Buddhist 22 78 70 Hindu 27 73 21 Islamic 29 71 2 Catholic 22 78 7
Type of School Type 1AB 22 78 37 Type 1C 23 77 37 Type 2 25 75 26
Expenditure ≤20000 28 72 42 20001 30000 15 85 30 30001 40000 19 81 18 40001 50000 30 70 8 >50000 23 77 2 Poverty Poor 64 36 18 Non poor 14 86 82
Mother’s Employability Government 77 23 7 Private 90 10 13 Self Employment 57 43 4 Others 50 50 3 Not Employed 03 97 73
Malnutrition 23 77 100
Source: Researcher’s finding using sample survey data analysis, 2022
As provided in the table 3, considering the overall sample, percentage of children suffering from malnutrition and not suffering from malnutrition are 23% and 77% respectively. The malnourished percentage (23%) found in this study is lower than the percentage (32.4%) provided by the Department of Census and Statistics in 2017 for the Nuwara Eliya district in the aspect of stunting which was measured through HFA Z score. Thepercentage of male (55%) is higher than the female (45%) while the percentage suffering from malnutrition is higher for female (33%) than that for the male (14%). Majority of the children (68%) in the sample live in the rural sector. The highest malnutrition is appeared in the urban sector (29%) while it is least for the rural sector (21%). Majority of the sample was represented by Sinhalese (72%) while the prevalence of malnutrition is higher for Muslims (29%) and Tamils (28) than others. Considering the religion, the highest percentage (70%) of the sample was recorded form Buddhist religion group. The percentage of having malnutrition is similar for the two religion groups of Buddhism and Catholic (22%). The malnutrition is appeared to be highest among the Islamic children (29%). Considering the type of schools, percentage of having malnutrition for the children who learning in type 2 schools (25%) is greater than the children who learning in types 1AB and 1C schools (22% and 23%). Considering the expenditure groups, the two groups that show the highest malnutrition are 40001 50000 (30%) and ≤20000 (28). Based on Samurdhi recipients, the highest malnutrition (64%) was recorded for the children belonged to poor families compared to non poor (14%). Further it highlighted that for poor, percentage of suffering from malnutrition (64%) is higher than the percentage of not suffering from malnutrition (well nourished) (36%). Considering mother’s employment, the highest malnutrition is seen among the children whose mothers are working in the private sector (90%). For all employment groups except for never employed mothers, the percentage with malnutrition was larger (77%, 90%, 57%) than the percentage without malnutrition (23%, 10%, 43%). The lowest percentage (3%) of having malnutrition was recorded for the children of mothers who never employed.
AJHSSR Journal Page | 124
Figure 3: Family income and child malnutrition
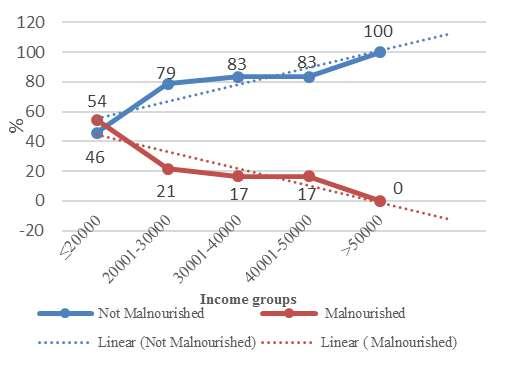
Figure 4: Father’s employmentand child malnutrition
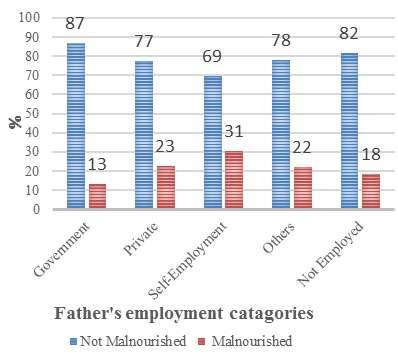
Source: Researcher’s finding using sample survey Source: Researcher’s finding using sample survey data analysis, 2022 data analysis, 2022
As revealed by Fig. 3, percentages of children suffering from malnutrition decrease with the increase of income while percentages of not suffering from malnutrition increase with the increase of income. The highest percentage of malnutrition was recorded (54%) for the lowest income group (≤20000) and it is the only group that records the percentage with malnourishment is higher than the percentage of without malnourishment. The lowest malnutrition is seen for the highest income group (>50000). According to Fig. 4, the percentage of malnourishment is lower for the children whose fathers are employed in a government job (13%) while it is highest for children of fathers involving a self employment (31%).
4.2 Economic determinants of child malnutrition
The study applied multiple logistic regression technique to investigate the impact of economic determinants on child malnutrition. The response variable in this study is child malnutrition which was measured in nominal binary scale. At the first step of the analysis, five economic explanatory variables, income, expenditure, poverty, mother’s employment and father’s employment were considered. Requirement for running multiple logistic regression model is independence among explanatory variables (Assumption of Multicollinearity). For using parametric techniques (ex. ANOVA, T test) to check for multicollinearity among continuous variables normality assumption was checked for income and expenditure.
Table 4: Kolmogorov Smirnova test for normality
Variables Kolmogorov Smirnova
Statistic df Sig.
Shapiro Wilk Statistic df Sig.
Income
Lilliefors Significance Correction
Source: Researcher’s finding using sample survey data analysis, 2022
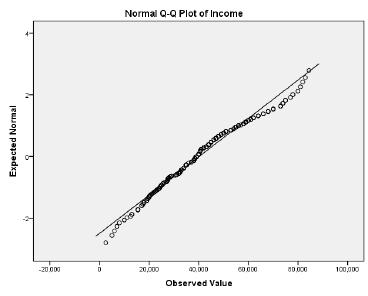
Figure 5: Q Q Plot for normality
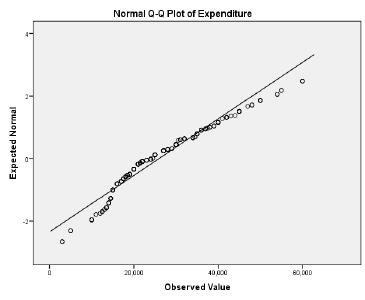
Source: Researcher’s finding using sample survey day analysis, 2022
American Journal of Humanities and Social Sciences Research (AJHSSR) 2022 AJHSSR Journal Page | 125
0.082 378 0.053 0.978 378 0.05 Expenditure 0.096 378 0.05 0.985 378 0.049
American
of Humanities and Social Sciences Research (AJHSSR) 2022
Kolmogorov Smirnova test (Table 4) for normality and Q Q plots (Fig. 5) show that normality assumption was satisfied for both variables income and expenditure.
Table 5: Checking multicollinearity among economic explanatory variables
Determinants Income
Expenditure Pearson Correlation (p value=0.000)
Poverty T test (p value=0.061)
Mothers’ Employment ANOVA (p value=0.469)
Fathers’ Employment ANOVA (p value=0.393)
Expenditure Poverty
T test (p value=0.004)
ANOVA (p value=0.422)
ANOVA (p value=0.000)
Chi Square (p value=0.051)
Chi Square (p value=0.923)
Mothers’ Employment
Chi Square (p value=0.532)
Source: Researcher’s finding using sample survey data analysis, 2022 Table 5 demonstrated the results of ANOVA, t test, the Pearson’s correlation and Chi Square test used for checking multicollinearity among all economic variables willing to be employed for logistic regression analysis based on the different types of variables. The highlighted cell clearly shows that a significant relationship exists between income and expenditure, poverty and expenditure and fathers’ employment and expenditure at 0.01 level. Relationship among other variables are not significant. Therefore, the variable expenditure was removed from the model due to the violation of the assumption of multicollinearity. Finally, income, poverty, mother’s employment and father’s employment were retained as explanatory variables while incidence of malnutrition in terms of stunting as the response variable in the logit model.
Table 6: Results of Multiple Binary Logit Model
Explanatory Variables
B S.E. Wald Sig. Exp(B)
Income .050 .024 4.288 .038 .951
Poverty (1) 3.201 .695 21.244 .000 24.562
Mothers Employment 71.863 .000
Government 5.359 .766 48.911 .000 212.580
Private 6.008 .772 60.571 .000 406.844
Self employment 4.229 .883 22.935 .000 68.635
Others 4.288 .894 22.994 .000 72.824
Fathers Employment 1.407 .843
Government .326 1.106 .087 .768 .722
Private .514 .853 .363 .547 1.671
Self employment .595 .853 .486 .486 1.812
Others .172 .789 .048 .827 1.188
Constant 6.184 2.284 7.323 .007 .002
2 Log likelihood 130.331
Hosmer and Lemeshow Test 9.677 (p value=0.288)
Source: Researcher’s finding using sample survey data analysis, 2022
Tables 6 provides the results of the fitted binary logistic regression model to find the economic determinants of child malnutrition in terms of Stunting. Wald statistic was applied to test the statistical significance of each variable in the model. As highlighted in the table 6, income is statistically significant at 0.05 level while poverty and mothers’ employment are statistically significant at 0.01 level indicating a significant impact of those variables on child malnutrition. Father’s employment was not statistically significant in the model indicating that it does not have a direct impact on child malnutrition. Overall adequacy of the fitted model was tested using Hosmer and Lemeshow goodness of fit test. It has given the test statistics is as 9.677 with p value of 0.288 justifying the model is adequately fit in the data in this study.
Income is a key economic variable that was used as a continuous variable in the model of identifying the economic determinants of child malnutrition. Table 6 has provided the evidence of statistically significant
Journal
AJHSSR Journal Page | 126
American Journal of Humanities and Social Sciences Research (AJHSSR) 2022
impact of income for child malnutrition in terms of Stunting. This result was supported by the findings of previous several studies conducted by different researchers. In rural Kelantan, Malaysia, it has beenfound that total household income β= 0.68, p <0.01 had a significant effect on malnutrition among children [18]. Further, it has been concluded that income is significant for child malnutrition [4], [19], [12] agreeing with this study.
The study found that odds ratio for one unit change in income is 0.951 and it is less than 1 showing a negatively effect on child malnutrition in terms of Stunting holding constant the other economic predictors. When the income increases by one unit, odds of being malnourished decreases by 0.951 times. The model indicates the probability of being malnourished is decreased with the increase of income. Being a child from low income family is more likely to have malnutrition than their counterparts. The similar findings were observed by the previous study conducted at Princess Marie Louise Children’s Hospital in Ghana in 2013 [10]. They found that having lower family incomes increases the prevalence of malnutrition of their children according to multivariate analysis. The studies conducted for stunting among Adivasi children age 24 59 months in Bangaladesh [11]agreed with the results found in this study. Further, several studies conducted in Sri Lanka [13],[15],[14] too supported to the findings of this study. In contrast, a study conducted in Sri Lanka has conclude that income has not a statistically significant relationship with nutritional status [23].
Poverty is another economic determinant showed a significant relationship with child malnutrition.Table 6 points out that Poverty has statistically significant impact on child malnutrition in terms of Stunting at 0.01 level. Results from this study agree with previous work conducted in India [17] which showed that bivariate Moran’s I statistics of Stunting with poverty 0.52 and suggested that the poverty of household was strong and significant predictors of Stunting, Wasting and Underweight. A study conducted in Sri Lanka has concluded that malnourished children usually come from poor physical and economic resourced households [24].
The study found that odds ratio of child malnutrition in terms of Stunting for poor compared to non poor is approximately 25 and it too indicates that odds of having malnutrition is higher among the poor children compared to non poor children holding constant the other economic predictors. The model predicts the probability of being malnourished (Stunting) for poor is 0.05 while probability of being malnourished for non poor is 0.002. Further it shows that 5% of poor children and 0.2% of non poor children are malnourished. Probability of being malnourished for poor is approximately 25 times higher than as it is for non poor with respect to Stunting. These findings pointed out that being a poor child is more likely to have malnutrition than a non poor child.
Mother’s employment was used as a categorical variable in investigating economic determinants of child malnutrition in this study. As provided in the table 6, mothers’ employment has statistically significant impact on child malnutrition in terms of Stunting at 0.01 level. Supporting the result of this study, a previous study has showed the maternal occupation has statistically significant association with nutritional status of children [20]. Further, other several studies too have found that maternal employment status as an important factor associated with child malnutrition [1],[25],[13],[23],[14].
The study found that odds ratio of child malnutrition for mothers’ who employed in government sector compared to mothers’ who never employed is 213 and it shows that odds of having malnutrition in terms of Stunting is higher among the children whose mothers employed in government sector compared to children whose mothers are never employed holding constant the other economic predictors. The model predicts the probability of being malnourished for the children whose mothers employed in government sector is 0.30. Further it shows that 30% of children whose mothers employed in government sector are malnourished while 70% is not malnourished. Odds ratio of child malnutrition between mothers’ who employed in private sector and mothers’ who never employed is 407 and it shows that odds of having malnutrition in terms of Stunting is higher among the children whose mothers employed in private sector compared to children whose mothers are never employed. The probability of being malnourished for the children whose mothers employed in private sector is 0.45. Further it shows that 45% of children whose mothers employed in private sector are malnourished while 55% is not malnourished. Odds ratio of child malnutrition between mothers’ who self employed and mothers’ who never employed is 69 and it shows that odds of having malnutrition in terms of Stunting is higher among the children whose mothers are self employed compared to children whose mothers are never employed. The probability of being malnourished for the children whose mothers are self employed is 0.12. Further it shows that 12% of children whose mothers self employed are malnourished while 88% is not malnourished. Odds ratio of child malnutrition between mothers with other employment and mothers’ who never employed is approximately 73 and it shows that odds of having malnutrition in terms of Stunting is higher among the children whose mothers with other employment compared to children whose mothers are never employed. The probability of being malnourished for the children whose mothers with other employment is 0.13. Further it
AJHSSR Journal Page | 127
American Journal of Humanities and Social Sciences Research (AJHSSR) 2022
shows that 13% of children whose mothers self employed are malnourished while 87% is not malnourished. Further, the probability of being malnourished for the children whose mothers are never employed is 0.002 and it shows that only 0.2% of children are malnourished among mothers with never employed.
These findings pointed out that the probability of being malnourished is higher for the children whose mothers are employed than the children whose mothers are never employed. The highest malnutrition is revealed among the children whose mothers are employed in private sector while the least malnourishment is seen among the children whose mothers have never employed. Further, it concludes that for all employment categories, the percentage of malnourished children is lesser than the percentage without malnourishment except for never married mothers.
However, table 6 shows that fathers’ employment is not statistically significant in logit model of investigating economic determinants of child malnutrition. It indicated that fathers’ employment does not directly impact on child malnutrition. This result is at variance with the results of previous several studies. Nutritional status as measured by Wasting was significantly associated with paternal occupation [19]. Paternal occupation showed a statistically significant association with the nutritional status of children [20].
V. CONCLUSIONS
This study focused on investigating the economic determinants of malnutrition among school children in the Nuwara Eliya district, Sri Lanka using primary data collected through a structured questionnaire. Descriptive statistics have provided the sample distribution concerning economic characteristics such as income, expenditure, poverty, Mother’s employment, and father’s employment and some of the other individual characteristics; gender, living sector, race, religion and types of school in identifying the nature of sample distribution. The results revealed that for the sample, percentage of children suffering from malnutrition is 23% in the aspect of stunting which was measured through HFA Z score. Thepercentage of male in the sample is higher than the female while percentage of suffering from malnutrition is higher for female than that for male. Majority of the children live in the rural sector and the highest percentage of malnutrition appeared in the urban sector.
The study employed multiple binary logistic regression technique for identifying economic determinants of malnutrition among school children. The incidence of malnutrition was the binary response variable measured in a nominal scale using HFA Z score. Based on different types of variables, the assumption of multicollinearity was checked with the use of Pearson’s correlation, ANOVA, T test and Chi square test. Wald statistics derived from multiple logistic regression model showed that income, poverty and mother’s employment were statistically significant in the model to describe the variability of the incidence of child malnutrition. These findings pointed out that the income has a negative effect on child malnutrition and being a poor child is more likely to have malnutrition than a non poor child. Further it is evident that the probability of being malnourished is higher for the children whose mothers are employed than the children whose mothers are never employed while the highest malnutrition is recorded for the children of mothers employed in the private sector. Father’s employment was not statistically significant in the model indicating the absence of its direct impact on child malnutrition. Hosmer and Lemeshow's goodness of fit test value is 9.677 with a p value of 0.288 and it ensured that the model adequately fits the data in this study.
This study contributes to filling the existing gap in investigating the economic determinants of malnutrition among school children in the Nuwara Eliya district, Sri Lanka. It is concluded that the child malnutrition among school children are influenced by income, poverty, mother’s employment as economic determinants. The study suggested in implementing supportive strategies to increase income, alleviate poverty and introduce proper mechanisms to take care of children of employed mothers to reduce child malnutrition. This study provides a guidance in policy implications to achieve country development with overcoming child malnutrition by addressing these economic determinants found in this study with creating a fascinating environment to live in the country.
REFERENCE
[1] Das, S. & Gulshan, J. Different forms of malnutrition among under five children in Bangladesh: a cross sectional study on prevalence and determinants. BMC Nutrition,3(10), 2017. https://doi.org/10.1186/s40795 016 0122 2
[2] WHO (World Health Organization). Malnutrition., World Health Organization Available from: https://www.who.int/news room/fact sheets/detail/malnutrition, 2021.
AJHSSR Journal Page | 128
American Journal of Humanities and Social Sciences Research (AJHSSR) 2022
[3] Bhattacharya, A., Pal, B., Mukherjee, S. & Roy, S.K. Assessment of nutritional status using anthropometric variables by multivariate analysis. BMC Public Health, 19, 1045, 2019. https://doi.org/10.1186/s12889 019 7372 2
[4] Zhang, N., Bécares, L., & Chandola, T. Patterns and Determinants of Double Burden of Malnutrition among Rural Children: Evidence from China. PloS one,11(7), e0158119, 2016. https://doi.org/10.1371/journal.pone.0158119
[5]
Rahman, A., & Chowdhury, S. Determinants of Chronic Malnutrition among pre school children in Bangladesh. Journal of Biosocial Science, 39(02), 2007, 161 173. https://doi.org/10.1017/S0021932006001295
[6] WHO (World Health Organization).Malnutrition, World Health Organization Available from: https://www.who.int/ news room/fact sheets/detail//malnutrition, 2020.
[7] Cunningham, K., Ruel, M., Ferguson, E. &Uauy, R. Women's empowerment and child nutritional status in South Asia: a synthesis of theliterature. Maternal and child nutrition, 11(1), 2015, 1 19. https://doi.org/10.1111/mcn.12125
[8] DCS (Department of Census and Statistics). Demographic and Health Survey Report 2016. Retrieved from line http://www.statistics.gov.lk/page.asp?page=Health, 2017.
[9] Casadei, K, & Kiel, J. Anthropometric Measurement. [Updated 2021 Apr 25]. In: Stat Pearls [Internet]. Treasure Island (FL): Stat Pearls Publishing Available from: https://www.ncbi.nlm.nih.gov/books/NBK537315/, 2021.
[10] Tette, E.M.A., Sifah, E.K., Nartey, E.T., Nuro Ameyaw, p., Tete Donkor, P., & Biritwum, R.B. Maternal profiles and social determinants of malnutrition and the MDGs: What have we learnt? BMC Public Health, 16(1), 2016, 214. https://doi.org/10.1186/s12889 016 2853 z
[11] Kabir, M. R., Rahman, M., Mamun, M. A., & Islam, H. Prevalence of malnutrition and associated factors affecting the nutritional status of Adivasi (tribal) children aged 24 59 months in Bangladesh. Asian Journal of Medical and Biological Research, 4(2), 2018, 178 185. https://doi.org/10.3329/ajmbr.v4i2.38253
[12] Fagbamigbe, A.F., Kandala, N.B. & Uthman, A.O. Demystifying the factors associated with rural urban gaps in severe acute malnutrition among under five children in low and middle income countries: a decomposition analysis. Sci Rep, 10, 2020, 1 15, 11172, https://doi.org/10.1038/s41598 020 67570 w
[13] Galgamuwa, L.S., Iddawela, D., Dharmaratne, S.D., & Galgamuwa, G.L.S. Nutritional status and correlated socio economic factors among preschool and school children in plantation communities, Sri Lanka. BMC Public Health, 17, 2017, 377. https://doi.org/10.1186/s12889 017 4311 y
[14] Keerthiwansa, J., Gajealan, S., Sivaraja, S., & Subashiniv, K.Y. Malnutrition and anaemia among hospitalised children in Vavuniya. Ceylon Medical Journal, 59 (04), 2014, 141 143.
[15] Rathnayake, I.M., & Weerahewa, J. Determinants of Nutritional Status among Pre School Children in Sri Lanka. Tropical Agricultural Research,17, 2005, 148 161
[16] Aturupane, H., Deolalikar, A. B. & Gunewardena, D. The determinants of child weight and height in Sri Lanka: A quantile regression approach. WIDER Research Paper, No. 2008/53, 2008, The United Nations University World Institute for Development Economics Research (UNU WIDER), Helsinki.
[17] Khan, J., & Mohanty, S.K. Spatial heterogeneity and correlates of child malnutrition in districts of India. BMC Public Health, 18, 1027, 2018, 1 13. https://doi.org/10.1186/s12889 018 5873 z
[18] Cheah, W.L, Abdul Manan, W.M.W. & Zabidi Hussin, Z.A.M.H. A structural equation model of the determinants of malnutrition among children in rural Kelantan, Malaysia. Rural and Remote Health, 10(1), 2010, 1248. https://doi.org/10.22605/RRH1248
[19] Ayana, A. B., Hailemariam, T.W., &, Melke, A. S. (2015). Determinants of acute malnutrition among children aged 6 59 months in Public Hospitals, Oromia region, West Ethiopia: a case control study. BMC Nutrition, 1(34), 1. https://doi.org/10.1186/s40795 015 0031 9
[20] Duru, C. B., Oluoha, U. R., Uwakwe, K. A., Diwe, K. C., Merenu, I. A., Chigozie, I.O., & Iwu, A.C. Prevalence and Sociodemographic Determinants of Malnutrition among Under Five Children in Rural Communities in Imo State, Nigeria. American Journal of Public Health Research, 3(6), 2015, 199 206. https://doi.org/10.12691/ajphr 3 6 1
[21] Kandala, N., Madungu, T.P., Emina, J.B., Nzita, K.P. & Cappuccio, F.P. Malnutrition among children under the age of five in the Democratic Republic of Congo (DRC): does geographic location matter?. BMC Public Health11: 261, 2011. https://doi.org/10.1186/1471 2458 11 261
[22] WHO (World Health Organization). Guideline: assessing and managing children at primary health care facilities to prevent overweight and obesity in the context of the double burden of malnutrition,
AJHSSR Journal Page | 129
American Journal of Humanities and Social Sciences Research (AJHSSR) 2022
World Health OrganizationAvailable from: https://apps.who.int/iris/bitstream/handle/10665/259133/9789241550123 eng.pdf, 2017.
[23] Ubeysekara, N.H., Jayathissa, R. and Wijesinghe C.J. Nutritional Status and Associated Feeding Practices among Children Aged 6 24 Months in a Selected Community in Sri Lanka: A Cross Sectional Study. European Journal of Preventive Medicine, Special Issue: New Frontiers of Public Health from the Pearl of Indian Ocean, Sri Lanka, 3(2 1), 2015, 15 23. doi: 10.11648/j.ejpm.s.2015030201.14
[24] Chandrasekara, C.P. A Statistical Study on Nutrition of Sri Lankan Children under 5 Years of Age, (Unpublished Master’s Thesis). University of Sri Jayewardenepura, Nugegoda, Scholar Bank, (Digital Repository), Library, University of Sri Jayewardenepura. URI: http://dr.lib.sjp.ac.lk/handle/123456789/3954, 2006.
[25] Ajieroh, V. A Quantitative Analysis of Determinants of Child and Maternal Malnutrition in Nigeria., Nigeria Strategy Support Program (NSSP) supported by the CGIAR, Background Paper No. NSSP10, International food policy research institute, sustainable solution for ending hunger and poverty. Available on: https://media.africaportal.org/documents/NSSP_Background_Paper_10.pdf, 2009.
AJHSSR Journal Page | 130
