ISSN :2378
Issue 9, pp

ISSN :2378
Issue 9, pp
Ida Bagus Udayana Putra1 , I Made Suniastha Amerta2 , Ida Ayu Surasmi3
1(Faculty of Economics and Business/ Universitas Warmadewa, Indonesia)
2(Faculty of Economics and Business/ Universitas Warmadewa, Indonesia)
3(Faculty of Economics and Business/ Universitas Warmadewa, Indonesia)
ABSTRACT:The purpose of this study was to determine the effect of leadership style and loyalty on employee job satisfaction at Institutional Village Enterprises (Bumdes) in South Denpasar. This type of field research uses a descriptive qualitative approach to determine the respondents' assessment of leadership style, loyalty and employee performance. The population in this study were all employees at Bumdes in south Denpasar, totaling 30 people. Samples were selected using the census method. The data were processed using the multiple linear regression statistical test method. The results of the study prove that leadership style and loyalty have a simultaneous effect on employee performance. Leadership style has a significant positive effect on employee performance and loyalty has a significant positive effect on employee performance
Leadership style is very important in an organization as one of the conditions determining success in achieving the mission, vision and goals of the organization. In essence, in achieving goals, leaders and employees have an important role in running an organization. The organizational goals achieved indicate that the leader has succeeded in carrying out his leadership. Successful leaders are leaders who are able to carry out leadership effectively to achieve organizational goals[1]. Another factor that can affect the achievement of organizational goals is loyalty[2]. Work loyalty is a dedication, trust and also loyalty given to an individual or an agency, with full responsibility and always well behaved.
Organizations need employees who have high loyalty, because with high loyalty, employees can work in accordance with organizational standards and can improve work quality[3]. Loyalty is an employee's mental attitude that is shown in the existence of the organization. Low loyalty to the organization can result in low organizational performance. The low employee loyalty has an impact on the decline in organizational performance. The decline in performance is reflected in the decreasing level of employee attendance and employee disobedience to their leaders[4]. The lower loyalty in the organization can lead to behavior that is contrary to organizational goals so that it can damage the vision and goals of the organization.
Thus, it can be concluded that the leadership style of a leader becomes an important thing in shaping employee loyalty. Loyalty will emerge if the leader is able to maintain the comfort of his employees in the work environment. This convenience is the result of the policies issued, determined and applied to the work unit he leads. Leadership style and level of loyalty in accordance with the situation and conditions of the organization will provide high morale. High morale will improve employee performance. Employees will perform optimally in accordance with the competencies that exist within each employee[5]
Leadership is one of the issues in management that is still quite interesting to discuss today and leadership is still an interesting topic to study and research, because it is most often observed but is a phenomenon that is little understood. The phenomenon of leadership style becomes an interesting problem and has a big influence in organizational life The purpose of this study was to analyze the significance of the influence of leadership on employee performance and to analyze the effect of work loyalty on employee performance.
Style means attitude, movement, behavior, good attitude, good value gestures, strength, ability to do good[6] Leadership is the ability to influence other parties through communication both directly and indirectly with the intention of moving people so that they are fully understanding, aware, and willingly willing to follow the will of the leader[7].Indicators of leadership style include the ability to provide initiative to employees, the ability to solve problems, the ability to motivate employees to achieve goals, the ability to cooperate in all work with employees and the ability to understand employee complaints[8]
The higher the loyalty of employees in an organization, the easier it is for the organization to achieve organizational goals that have been previously set by the owner of the organization[9]. Conversely, for organizations with low employee loyalty, it will be difficult for the organization to achieve the organizational goals that have been previously set by the owners of the organization.Loyalty indicators include the ability to survive in various company situations, willingness to complete work to the maximum, willingness to keep company secrets, willingness to obey regulations and prioritize company interests.
Employee performance as work performance or work results both in quality and quantity achieved by human resources for a period of time in carrying out their work duties in accordance with the responsibilities given to them[10].Employee performance indicators include the level of work volume compared to the work facilities owned, the work is in accordance with the number of targets set, the work is completed on time, the task is completed with responsibility and thoroughness in work[11].
The framework of thought can be illustrated in Fig 1 The independent variables in this study are Leadership Style and Loyalty. The dependent variable in this study is employee performance. H2, H3 are hypotheses that formulate the influence of leadership style and loyalty partially on employee performance, while H1 is formulated as a simultaneous influence between the influence of leadership style and loyalty on employee performance.
Leadership Style (X1)
H2 H3
Loyalty (X2)
H1
The target population in this study were all employees at Bumdes in South Denpasar. Based on the data obtained, there were 30 (thirty) people. Sources of data used in this study are primary data and secondary data. Primary data in this study is data obtained directly from the subject under study several direct interviews with all employees of Bumdes Denpasar Selatan. The secondary data in this study were obtained from books related to leadership style, loyalty, employee job satisfaction, and related to the research problems of documents and literature related to leadership style. Data collection techniques using a questionnaire measured by a 5 point Likert scale, namely strongly agree (5), agree (4), disagree (3), disagree (2) and strongly disagree (1). The instrument test uses validity and reliability tests with Cronbach alpha. Classical assumption test using multicollinearity test, autocorrelation test, heteroscedasticity test and normality test. The data analysis technique used multiple linear regression and absolute difference test. The t test and absolute difference test used a significance level of 5%. If the p value < 0.005 then the hypothesis is accepted.
Based on the validity test of leadership style (X1), loyalty (X2) and employee performance (Y) shows that the total Pearson Correlation score of each instrument is above 0.30 and has a significance value less than 5% (0.05), then the instrument is feasible to be used as a measuring instrument for the variables studied [12]
Table 1. results of the validity test
Correlations X1_TOTAL Correlations X2_TOTAL Correlations Y_TOTAL
x1.1 .690** x2.1 .507** Y1 .705**
x1.2 .612** x2.2 .799** Y2 .823** x1.3 .514** x2.3 .840** Y3 .791** x1.4 .397* x2.4 .892** Y4 .836** x1.5 .526** x2.5 .899** Y5 .807** x1.6 .532** x2.6 .814**
Based on the results of the reliability test, it is said to have high reliability if the Cronbach Alpha value obtained is greater than 0.60. Based on the results of the reliability test with Cronbach Alpha on the variables of employee performance, leadership style and loyalty above 0.6 so that each variable is reliable.
Table 2.results of the reliability test
Variable Cronbach's Alpha N of Items
Leadership Style 0.71 6
Loyalty 0.836 6
Employee Performance 0.852 5
All variables in this study have passed the multicollinearity test which can be shown in Table 3. The tolerance value of the independent variable is greater than 0.1 and the VIF value is less than 10, so it can be concluded that there is no multicollinearity in the regression model
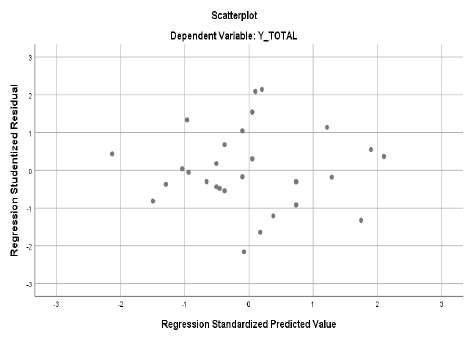
Table 3. results of the multicollinearity test
No Variable Collinearity Statistics
Tolerance VIF
1 Leadership Style 0,987 1,013
2 Loyalty 0,987 1,013
The heteroscedasticity test is shown in Fig.2.Based on the scatterplot graph, it can be seen that the distribution of data points does not form a certain pattern and spreads above and below the number 0, it can be concluded that there is no heteroscedasticity.
Figure 2 Results of Heteroscedasticity Test
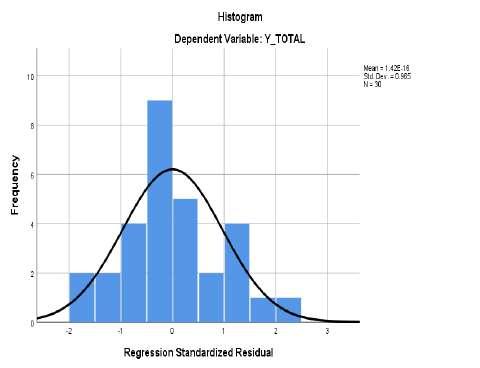
The normality test is shown in Fig.3. Based on the results of the normality test with a normal probability plot, it can be seen that the data points are collected around the normal curve, so they have fulfilled the normality assumption.
From the Table 3, there is a positive and partially significant influence between the variables of leadership style and loyalty partially positive and significant effect on employee performance at Bumdes in South Denpasar
Table 3. results of t test
Model Unstandardized Coefficients Standardized Coefficients t Sig. B Std. Error Beta (Constant) 4.283 4.222 1.014 0.319
Leadership Style 0.291 0.135 0.313 2.162 0.04 Loyalty 0.401 0.093 0.625 4.32 0
Multiple linear regression analysis in this study was used to determine the effect of leadership style, loyalty on employee performance. The estimation results are expressed in the equation: Y= 4,283 + 0,291. X1 + 0,401. X2
Constant value of 4.283, meaning that if the leadership style (X1) and loyalty (X2) are considered constant, then the employee's performance is 4.283.Leadership Style has a positive effect on the performance of Bumdes Denpasar Selatan employees with a coefficient value of 0.291, meaning that if the leadership style increases while loyalty remains, the magnitude of the employee's performance is 0.291. Loyalty has a positive effect on the performance of Bumdes employees in South Denpasar with acoefficient value of 0.401, meaning that if loyalty increases while the leadership style remains, the magnitude of employee performance is 0.401. The result of F test is shown in Table4. The statistical significance value of F is 0.000, which means that the leadership style and loyalty variables simultaneously have a positive and significant effect on employee performance at BUMDES South Denpasar.
Table 4. results of F test ANOVA
Model Sum of Squares df Mean Square F Sig.
Regression 59.965 2 29.982 10.736 .000b
Residual 75.402 27 2.793
Total 135.367 29
a. Dependent Variable: Employee Performance
b. Predictors: (Constant), Leadership Style, Loyalty
Based on the value of the multiple correlation coefficient (R), which is shown in Table 5 is 0.666, which means the relationship between leadership style variables and loyalty to the performance of Bumdes employees in South Denpasar is a high correlation because it is between 0.60 0.799 intervals.
R R Square Adjusted R Square Std. Error of the Estimate .666a 0.443 0.402 1.67113
a. Predictors: (Constant), Leadership Style, Loyalty
b. Dependent Variable: Employee Performance
The value of R2 = 44.3%, which means that 44.3% of the Bumdes employee performance in South Denpasar is influenced by the variables of Leadership Style (X1), and Loyalty (X2) and the remaining 55.7% is influenced by other variables not examined in this research.
Leadership style and loyalty simultaneously have a significant positive effect on employee performance, this result means that the better the leadership style and loyalty together, it can improve employee performance at Bumdes in South Denpasar. Although it has a significant positive effect, the overall indicators of the two independent variables need to be improved so that maximum results are obtained. Performance is the result of work that can be achieved by a person or group of people in a company in accordance with their respective authorities and responsibilities in an effort to achieve organizational goals illegally, not violating the law and not contradicting morals and ethics. Performance is influenced by predictors such as leadership style and loyalty.
Leadership style has a significant positive effect on employee performance. These results mean that the better the leadership style, the better the performance of employees at Bumdes in South Denpasar. Although it has a positive and significant effect on the overall indicators of the leadership style variable, it needs to be further improved so that maximum results are obtained.
Loyalty has a significant positive effect on employee performance. These results mean that the better the loyalty, the better the performance of employees at Bumdes in South Denpasar. Although it has a positive and significant effect, the overall Loyalty variable indicators need to be further improved so that maximum results are obtained.
[1] R. D. Parashakti and D. I. Setiawan, “Gaya Kepemimpinan dan Motivasiterhadap Kinerja Karyawan pada Bank BJB Cabang Tangerang,” J. Samudra Ekon. Dan Bisnis, vol. 10, no. 1, 2019, doi: https://doi.org/10.33059/jseb.v10i1.1125.
[2] B. S. Rasimin, “Manusia dalam Industri dan Organisasi,” Yogyakarta Univ. Gadjah Mada, 2008.
[3] F. Luthans, Perilaku Organisasi, 10th ed. Yogyakarta: Andi Offset, 2009.
[4] E. Sutrisno, Manajemen sumber daya manusia, 6th ed. Jakarta: Pranada Media Group, 2014.
[5] Wirawan, Kepemimpinan: Teori, psikologi, perilaku organisasi, Aplikasi dan Penelitian, 1st ed. Jakarta: PT. Rajagrafindo Persada, 2013.
[6] V. Rivai, Kepemimpinan Dalam Sikap Perilaku Organisasi. Jakarta: PT. Raja Grafindo Persada, 2009.
[7] A. Hartanto, “Analisis Gaya Kepemimpinan pada PT. Sinar Sarana Sukses,” Agora, vol. 4, no. 2, pp. 140 145, 2016, [Online]. Available: https://publication.petra.ac.id/index.php/manajemen bisnis/article/view/4787.
[8] A. Krisnadi, “Pengaruh Gaya Kepemimpinan terhadap Kinerja Keuangan melalui Perilaku Manajer Atas Isu Manajemen Lingkunga sebagai Variabel Intervening,” Bus. Account. Rev., vol. 4, no. 1, pp. 169 180, 2016, [Online]. Available: https://publication.petra.ac.id/index.php/akuntansi bisnis/article/view/4122.
[9] V. M. Soegandhi, “Pengaruh kepuasan kerja dan loyalitas kerja terhadap organizational citizenship behavior pada karyawan PT. Surya Timur Sakti Jatim,” Agora, vol. 1, no. 1, pp. 808 819, 2013, [Online]. Available: https://publication.petra.ac.id/index.php/manajemen bisnis/article/view/302.
[10] A. P. Mangkunegara, Manajemen Sumber Daya Manusia, 11th ed. Bandung: PT Remaja Rosdakarya, 2013.
[12] I. Ghozali, Aplikasi analisis multivariate dengan program IBM SPSS 25. Semarang: Badan Penerbit Universitas Diponegoro, 2018.
[11] M. D. M. R. A. Pratama, “Pengaruh Metode Pelatihan Dan Materi Pelatihan Terhadap Kemampuan Kerja Dan Kinerja Karyawan (Studi Pada Karyawan tetap PT Perkebunan Nusantara X Pabrik Gula Pesantren Baru Kediri),” J. Adm. Bisnis, vol. 62, no. 2, pp. 1 10, 2018, [Online]. Available: http://administrasibisnis.studentjournal.ub.ac.id/index.php/jab/article/view/2668/3062.