A.I. Industry Analysis and Guide
SUCCESS IS NOW A SCIENCE

NATIONAL
ANALYSIS

SUCCESS IS NOW A SCIENCE


All business leaders, including Cannabis brands, are continuously seeking to increase business value, while de-risking the organization and staying ahead of the competition. Cannabis brands are also faced with multifaceted challenges: startup costs, legal, regulation & compliance, increasing competition, and noise, not to mention the state & national implications.
Ultimately most brands know they’ll be successful if they can just reach their target audience. And the test for success, especially in highly-regulated industries such as Cannabis, is organic traffic.
This is why Arcalea created the PRISM AI™ platform, to leverage A.I. to determine the most important ranking factors in any industry. We have analyzed tens of millions of data points across hundreds of brands to deliver keys to success to our clients in Pharmaceutical, Manufacturing, Higher Education, and Healthcare…and now… Cannabis.
For the first time, we’re publishing the findings to the entire Cannabis industry - so now you can access A.I. to discover the best SEO tools for your company or client - without the Data Scientist or SEO teams. Provide this report to your teams (or your agency) to reduce costs and increase revenue. And you can apply A.I. to increase traffic to your business today!
Five years ago we conducted our initial analysis of the SEO industry using a statistical model to achieve better outcomes than the general SEO guidelines at the time (“write more content” or “get more backlinks”). We believed there were answers in the vast amounts of data if we could just analyze it at a deeper level. The statistical models we used were far superior to general SEO best practices. But we knew it could get even better.
Three years ago we began working on PRISM AI™ (Predictive Rank Intelligence in Search Marketing), an AI platform that could identify and weigh the precise search ranking factors that contribute to first-page rank. Now in its 11th generation, PRISM AI™ can identify the top-ranking factors in any industry, in order by weight, with discrete thresholds. PRISM AI™ can even distinguish between National, State, City, and County-level ranking factors.
Having delivered breakthrough analysis to global brands in other industries, PRISM AI™ has now analyzed the Cannabis industry, enabling every grower, manufacturer, processor, and retailer to take advantage of its unique insights, to be able to deconstruct the precise ranking factors nationally, and empower their teams, partners, and employees to compete on new levels, to increase traffic and revenue.

The first step in every analysis is to determine Share of Voice (SOV), which is a calculation of the percentage of total search traffic a brand can expect to capture based on keyword volume and average click through rates (CTRs). SOV is also a proxy for market share. For companies seeking to increase overall digital presence and brand awareness, SOV is best calculated as the share of organic traffic a brand receives for a certain industry topic relative to the whole.
Because SOV indicates the brand’s degree of reach to the addressable market, understanding a brand’s SOV in active and competitive markets is critical. The analysis provides a benchmark of the total addressable market, the competitive landscape, and provides insight into the effort required to increase organic visibility and traffic.
A measure of the market your brand owns compared to your competitors.
Page-one of search results receive over 90% of organic search traffic; the advantage of knowing industry-specific tactics that positively influence page-one rankings cannot be understated.
Ranking factors have been historically obscured by search engines, and misleading information is provided based on anecdotal evidence which is often proliferated within the search engine optimization community. The result wastes human resources and marketing budgets, and ultimately does not produce intended results.
Arcalea’s proprietary PRISM AI™ SRF analysis solves for this challenge, as the analysis enables brand teams to direct the right resources to the right places, and ensures resources are not wasted by over allocation past the degree of positive returns. The goal of this analysis is to provide an innovative solution to the inefficiencies that are prominent in SEO.
Factors relating to a website’s content, technical implementation, user signals, backlink profile or any other features the search engine considers relevant.
A group of content that revolves around a central topic and use a pillar page to link to and from.
Search Ranking Factors are industry-dependent, but also Topic Cluster-dependent. Clustering has a goal of grouping or “clustering” contextual examples based on similar characteristics. By analyzing the number of shared search results between queries, the clustering method partitions keywords into distinct topic clusters, which enables brands to better understand target topics for content creation.
Arcalea’s proprietary PRISM AI™ SRF analysis provides brand teams with a comprehensive assessment of the search queries that are nested within an industry’s various topics. Through building extensive content hubs based on industry contextual demand, brands have the opportunity to increase their digital relevance and pageone probability around various topics. The aggregate search volume for each cluster provides information about the value a page within a topic cluster may have, which empowers a brand to fortify content where there is ample search opportunity.
Share of Voice is determined for each brand’s website competitively, based on a list of aggregated, industryrelevant keywords within topic clusters. An industry list of keywords is determined by analyzing relevant terms with high search volume which are shared between industry competitors.
Following, the brand’s industry online search market share is calculated and analyzed; the voice share is defined by the total search volume, keyword ranking, and click-through rate for the given set of keywords.
Machine Learning algorithms are leveraged to deconstruct Google’s search ranking system to determine the most highly-correlated ranking factors with contribution to page-one search results within the overarching Cannabis industry.
While the specific details of the methodology may be complex, the output is fairly straightforward. In essence, the contribution of each of the variables, in this case, ranking factors, is calculated by measuring the marginal contribution of each with respect to the predicted outcome (probability of ranking on the first page); depending on the value of each ranking factor, this marginal contribution can either be positive, negative, or neutral. The marginal nature of each of these ranking factors must be emphasized, as it highlights the concept that page-one probability is the cumulative outcome of a host of variables.
In any instance, the following analysis is Arcalea’s own analysis and provided as informational. Ultimately success is dependent on many factors including the ever changing search algorithms and competitor activity and success cannot be guaranteed.
Topic Cluster Analysis is used to identify, organize, and implement specific contextual content (i.e., “clusters”) in ways that help search engines understand a site’s structure and topic relevance. Because the output of this analysis reveals specific topics, off-page elements, and technical factors that contribute to industry relevance, the resulting clusters correlate to increased visibility and ranking for the domain’s presence in search engine results pages (SERPs).
The Topic Cluster Analysis is a multi-step analysis, measuring keywords, clusters, and link performance using statistical analysis, data mining, and machine learning algorithms. The output of topics, semantically related keywords, and site parameters create industry-specific clusters most correlated with page-one probability when developed and supported as recommended.

Because brands are competing for the same positions and market share, a brand’s current SOV depends on how all other competing domains are positioned and ranking for the same topics. It is found that analyzed brands may rank highly for a subset of keywords, but do not utilize a wide enough spread of keywords that would contribute to a larger market share while still being relevant to users’ searches. The industry’s National SOV provides an overview into which domains have the most authority, and therefore are likely to rank the most competitively.

leafly.com
en.wikipedia.org
weedmaps.com
crescolabs.com
sunnyside.shop
risecannabis.com
healthline.com
medicalnewstoday.com
trulieve.com
thedispensarynv.com
verywellmind.com
veriheal.com
webmd.com
curaleaf.com
otdbluffton.com

verywellhealth.com
data.nj.gov
discovermagazine.com
medmen.com
kingstreetdispensary.com
moderncanna.com
vandyou.com
quora.com
thedispensaryflorence.com
diffen.com
eaze.com
allbud.com
terasana.com
wikileaf.com
mayoclinic.org
highprofilecannabis.com

windycitycannabis.com


nida.nih.gov
arborswellness.com
verilife.com
tarpenes.com
cannovia.com
fl
avorfix.com
caliva.com
Overall, industry aggregators such as leafly.com (20.44%) and weedmaps.com (8.82%) own a significant share of the organic market, signaling that search engines currently prioritize industry aggregators over dispensary domains.
National aggregators, such as wikipedia.org (8.87%), and health & wellness domains, such as healthline.com (3.51%) and medicalnewstoday.com (2.87%), further indicate the importance search engines place on 3rd party information within the industry, compared to brand-owned content.
While search engines appear to favor industry aggregators for top listings, local and multi-state dispensary domains still appear to own market share online.
Thedispensarynv.com (1.92%), crescolabs.com (5.13%), sunnyside.shop (3.95%), risecannabis.com (3.61%), and trulieve.com (2.09%) are dispensaries that own national share of voice, signaling opportunity for other dispensaries to also own and growth their share to rank amongst aggregators.
The following location-specific Share of Voice analysis provides businesses with valuable insights into regional market trends and consumer behavior, and serves as a starting point for businesses to assess their position in specific regional markets and devise effective growth strategies.
AK
en.wikipedia.org
leafly.com
crescolabs.com
curaleaf.com
healthline.com
medicalnewstoday.com
veriheal.com
risecannabis.com
verywellmind.com
sunnyside.shop
medmen.com
webmd.com
weedmaps.com
verywellhealth.com
discovermagazine.com
merriam-webster.com
windycitycannabis.com


moderncanna.com
vandyou.com
quora.com
highprofilecannabis.com
allbud.com
terasana.com
usnews.com
mayoclinic.org
arborswellness.com
wikileaf.com
cannovia.com
tarpenes.com
flavorfix.com
greensativa.com
yodabbadabba.com
nida.nih.gov
verilife.com
diffen.com
caliterpenes.com
forbes.com
realsimple.com
leafwell.com
pelicandelivers.com indeed.com shape.com
Multi-state dispensaries have emerged as the dominant players in Jacksonville’s cannabis market, capturing a combined market share of 20.99%. The presence of key players such as crescolabs.com (6.63%), curaleaf.com (4.57%), veriheal.com (3.58%), risecannabis.com (3.36%), and sunnyside.shop (1.85%), indicate the increasing competition among multi-state dispensaries for market share in Jacksonville. Interestingly, media outlets, including en.wikipedia.org (15.80%) with the largest market share, and industry aggregator leafly.com (13.17%), follow next in terms of market share.
The remaining domains, healthline.com (4.55%), medicalnewstoday.com (3.68%), and verywellmind.com (2.47%), fall under the category of health & wellness, highlighting the importance of this category in the cannabis market. The dominance of multi-state dispensaries and the emergence of media outlets as major players in the market suggest that Jacksonville's cannabis market is evolving rapidly and presents opportunities for new players to enter the market.
leafly.com
crescolabs.com
en.wikipedia.org
healthline.com
medicalnewstoday.com
risecannabis.com
verywellmind.com
webmd.com
verywellhealth.com
weedmaps.com
discovermagazine.com
veriheal.com
moderncanna.com
vandyou.com
quora.com
allbud.com
terasana.com
mayoclinic.org
arborswellness.com
wikileaf.com
nida.nih.gov
cannovia.com
tarpenes.com
fl
avorfix.com
medmen.com
greensativa.com
yodabbadabba.com
verilife.com
forbes.com
diffen.com
caliterpenes.com
hytiva.com
leafwell.com
realsimple.com
health.harvard.edu
shape.com
ncbi.nlm.nih.gov


inverse.com
thelodgecannabis.com
calihash.com
smokehotbox.com
elevate-holistics.com
There is opportunity for local and multi-state dispensaries to compete within the Anchorage market and grow their market share. The Anchorage market appears to favor industry aggregators such as leafly.com (17.11%) and weedmaps.com (1.71%) own almost 19% of the local market share, along with health & wellness domains owning over a collective 18% of the market share: healthline.com (6.11%), medicalnewstoday.com (5.02%), verywellmind.com (3.32%), webmd.com (1.95%), and verywellhealth.com (1.76%)
Multi-state dispensaries such as crescolabs.com (9.01%) and risecannabis.com (4.59%) own the next largest share as a category, at over 13% aggregate.
There is opportunity for dispensaries to gain share and increase their share of voice by dedicating efforts towards the known ranking factors in the market.
leafly.com
en.wikipedia.org
crescolabs.com
healthline.com
medicalnewstoday.com
risecannabis.com
verywellmind.com
webmd.com
weedmaps.com
verywellhealth.com
discovermagazine.com
veriheal.com
moderncanna.com

vandyou.com
quora.com
medmen.com
azdhs.gov
terasana.com
allbud.com
arborswellness.com
mayoclinic.org
wikileaf.com
flavorfix.com
tarpenes.com
cannovia.com
greensativa.com
yodabbadabba.com
nida.nih.gov
diffen.com
forbes.com
verilife.com
caliterpenes.com
realsimple.com
leafwell.com
health.harvard.edu
shape.com
hytiva.com
inverse.com
ncbi.nlm.nih.gov
thelodgecannabis.com
aznaturalselections.com

The local Phoenix market appears to favor industry and national aggregators: leafly.com (15.75%) and wikipedia.org (11.54%). However the health & wellness classification has the next largest collective market share: shahealthline.com (5.83%), medicalnewstoday.com (4.74%), verywellmind.com (3.14%), webmd.com (1.84%), and verywellhealth.com (1.59%)
Multi-state dispensaries such as crescolabs.com (8.52%) and risecannabis.com (4.35%), own market share, portraying the opportunity that other multi-state and/or local dispensaries also have the opportunity to own market share and compete with the health & wellness domains, and rank higher within search results when focusing on Phoenix’s dedicated ranking factors.
weedmaps.com
leafly.com
crescolabs.com
en.wikipedia.org
healthline.com
medicalnewstoday.com
risecannabis.com
verywellmind.com
webmd.com
verywellhealth.com
discovermagazine.com
veriheal.com
moderncanna.com
vandyou.com
quora.com
terasana.com
allbud.com
medmen.com
arborswellness.com
mayoclinic.org
wikileaf.com
tarpenes.com
cannovia.com
flavorfix.com
greensativa.com
yodabbadabba.com
nida.nih.gov
eaze.com
verilife.com
caliterpenes.com

diffen.com
forbes.com
realsimple.com
leafwell.com
shape.com
hytiva.com
ncbi.nlm.nih.gov

inverse.com
aznaturalselections.com
calihash.com
thelodgecannabis.com
Almost 30% of San Diego’s market is dominated by industry aggregators, such as weedmaps.com (15.17%) and leafly.com (14.32%), along with health & wellness domains, with about a collective 15% market share from healthline.com (5.29%), medicalnewstoday.com (4.34%), verywellmind.com (2.86%), webmd.com (1.63%), etc.. Based on the lower market share of the one-off health & wellness domains, there is opportunity for local and multi-state dispensaries to grow their share of voice, and compete against the health & wellness domains to rank higher in search results, especially for customers who are looking for dispensaries nearest them.
Based on the market share aggregators have, there could also be opportunity for local dispensaries to work with the aggregators in an effort to gain market share indirectly, while still deploying tactics to become the first local dispensary to rank.
leafly.com
en.wikipedia.org
crescolabs.com
healthline.com
medicalnewstoday.com
risecannabis.com
verywellmind.com
webmd.com
verywellhealth.com
weedmaps.com
discovermagazine.com
veriheal.com
moderncanna.com
vandyou.com
quora.com
medmen.com
terasana.com
allbud.com
arborswellness.com
wikileaf.com
mayoclinic.org
cannovia.com
flavorfix.com
greensativa.com
yodabbadabba.com
nida.nih.gov
verilife.com
diffen.com
forbes.com
tarpenes.com
realsimple.com
leafwell.com
health.harvard.edu
hytiva.com
elevate-holistics.com
ncbi.nlm.nih.gov
inverse.com
thelodgecannabis.com
shape.com
caliterpenes.com

smokehotbox.com
aznaturalselections.com
sciencedirect.com

Chicagos’ market appears to favor industry and national aggregators: leafly.com (16.03%) and wikipedia.org (9.54%). However the health & wellness classification has the next largest collective market share: healthline.com (6.05%), medicalnewstoday.com (5.03%), verywellmind.com (3.29%), webmd.com (1.96%), etc..
Multi-state dispensaries such as crescolabs.com (8.55%) and risecannabis.com (4.58%), own market share, portraying the opportunity that other multi-state and/or local dispensaries have the opportunity to own market share. By focusing on market share, dispensaries have the opportunity to compete with the health & wellness domains, and rank higher within search results when focusing on Chicago’s dedicated ranking factors.
leafly.com
en.wikipedia.org
veriheal.com
crescolabs.com
healthline.com
medicalnewstoday.com
risecannabis.com
verywellmind.com
windycitycannabis.com

curaleaf.com
merriam-webster.com
webmd.com
medmen.com
weedmaps.com
highprofilecannabis.com

verywellhealth.com
discovermagazine.com
moderncanna.com
vandyou.com
quora.com
terasana.com
allbud.com
mayoclinic.org
arborswellness.com
wikileaf.com
nida.nih.gov
cannovia.com
tarpenes.com
flavorfix.com
usnews.com
greensativa.com
yodabbadabba.com
diffen.com
verilife.com
forbes.com
caliterpenes.com
leafwell.com
realsimple.com
hytiva.com
elevate-holistics.com
In the Buffalo Center market, industry and national aggregators appear to be the most favored, as evidenced by the high share of voice (SOV) controlled by leafly.com (13.25%) and wikipedia.org (13.01%). Multi-state dispensaries also hold a significant collective market share, including crescolabs.com (6.75%), risecannabis.com (3.44%), Curaleaf.com (1.99%), medmen.com (1.58%), and others. Following multi-state dispensaries ,health & wellness domains hold a similar market share, with main contributions from healthline.com (4.56%), medicalnewstoday.com (3.75%), verywellmind.com (2.47%), and webmd.com (1.65%).
Dispensaries have an opportunity to compete with both other multi-state dispensaries and domains related to health & wellness, focusing on increasing their market share to rank higher within search results when focusing on Buffalo Center’s dedicated ranking factors.
leafly.com
crescolabs.com
en.wikipedia.org
healthline.com
medicalnewstoday.com
risecannabis.com
verywellmind.com
webmd.com
verywellhealth.com
weedmaps.com
discovermagazine.com
veriheal.com
moderncanna.com
terasana.com
vandyou.com
quora.com
medmen.com
allbud.com
mayoclinic.org
arborswellness.com
wikileaf.com
nida.nih.gov
flavorfix.com
tarpenes.com
cannovia.com
greensativa.com
yodabbadabba.com
health.harvard.edu
leafwell.com
verilife.com
diffen.com
forbes.com
caliterpenes.com


realsimple.com
hytiva.com
elevate-holistics.com
ncbi.nlm.nih.gov
inverse.com
thelodgecannabis.com
aznaturalselections.com calihash.com smokehotbox.com
In the Portland market, industry and national aggregators dominate the market share, with leafly.com (16.81%) and wikipedia.org (7.07%) being the top contributors to the share of voice. Health & wellness domains hold the second-highest market share, with prominent contributions from healthline.com (6.02%), medicalnewstoday.com (5.02%), verywellmind.com (3.27%), and webmd.com (2.06%). Additionally, several multi-state dispensaries, including crescolabs.com (8.99%), risecannabis.com (4.60%), and medmen.com (1.05%), hold a significant collective market share.
Dispensaries in Portland have an opportunity to increase their market share and compete with both multi-state dispensaries and health & wellness domains by focusing on improving their search engine ranking using Portland's dedicated ranking factors. By focusing on market share, dispensaries can differentiate themselves from other domains in the market and capture a larger share of the market.
leafly.com
crescolabs.com
thedispensarynv.com
en.wikipedia.org
healthline.com
medicalnewstoday.com
risecannabis.com
verywellmind.com
webmd.com
weedmaps.com
verywellhealth.com
discovermagazine.com
veriheal.com
moderncanna.com
vandyou.com
quora.com
terasana.com
allbud.com
arborswellness.com
wikileaf.com
medmen.com
tarpenes.com
flavorfix.com
cannovia.com
greensativa.com
yodabbadabba.com
mayoclinic.org
verilife.com
diffen.com
caliterpenes.com

forbes.com
leafwell.com
realsimple.com
nida.nih.gov
shape.com
hytiva.com
thelodgecannabis.com
ncbi.nlm.nih.gov


inverse.com
aznaturalselections.com
calihash.com
elevate-holistics.com
Industry and national aggregators such as leafly.com (15.64%), wikipedia.org (6.69%), weedmaps.com (1.65%), and quora.com (1.05%) collectively owning over 20% of the Las Vegas market, followed by health & wellness domains including healthline.com (5.61%), medicalnewstoday.com (4.74%), verywellmind.com (3.11%), webmd.com (1.81%), and verywellhealth.com (1.62%).
Multi-state dispensaries also own a significant market share, with crescolabs.com (8.47%) and risecannabis.com (4.32%) being the main contributors. Notably, a local dispensary, thedispensarynv.com, holds the third-largest market share at 7.47%.
As observed from the distribution of the top market share holders, there is opportunity for both local dispensaries and multi-state dispensaries to differentiate themselves and capture a larger market share by focusing on the Las Vegas-specific ranking factors to improve their visibility in the search results.
leafly.com
en.wikipedia.org
crescolabs.com
risecannabis.com
healthline.com
medicalnewstoday.com
verywellmind.com
webmd.com
weedmaps.com
verywellhealth.com
discovermagazine.com
veriheal.com
moderncanna.com
vandyou.com
quora.com
terasana.com
medmen.com
allbud.com
arborswellness.com
wikileaf.com
tarpenes.com
flavorfix.com
cannovia.com
greensativa.com
yodabbadabba.com
leafwell.com
caliterpenes.com
forbes.com
diffen.com
verilife.com
realsimple.com
mayoclinic.org
hytiva.com
shape.com
inverse.com
ncbi.nlm.nih.gov

thelodgecannabis.com
calihash.com
smokehotbox.com
elevate-holistics.com
aznaturalselections.com
nida.nih.gov
New York’s market is primarily dominated by aggregators, with leafly.com (16.38%) and wikipedia.org (9.20%) being the main contributors to market share. Following aggregators, health & wellness domains hold significant, collective market share with healthline.com (5.80%), medicalnewstoday.com (4.90%), verywellmind.com (3.22%), and webmd.com (1.72%) being the top contributors.
Multi-state dispensaries such as crescolabs.com (8.79%) and risecannabis.com (7.02%) also hold a notable share of the market, currently holding positions three and four in terms of largest market share in New York, conveying the opportunity for additional dispensaries to increase and maintain market share in this region. By leveraging the dedicated ranking factors, domains have the opportunity to challenge other domains with market share in spite of themselves.
leafly.com
en.wikipedia.org
crescolabs.com
healthline.com
medicalnewstoday.com
risecannabis.com
verywellmind.com
webmd.com

verywellhealth.com
weedmaps.com
discovermagazine.com
moderncanna.com
veriheal.com
vandyou.com
quora.com
medmen.com
terasana.com
allbud.com
arborswellness.com
wikileaf.com
health.pa.gov

tarpenes.com
cannovia.com
sunnyside.shop
flavorfix.com
greensativa.com
yodabbadabba.com
mayoclinic.org
verilife.com
diffen.com
forbes.com
caliterpenes.com
leafwell.com
realsimple.com
nida.nih.gov
shape.com
hytiva.com
thelodgecannabis.com
Industry and national aggregators have the highest market share, with leafly.com (16.73%), wikipedia.org (9.25%), weedmaps.com (1.58%), and quora.com (1.08%) as the main contributors. A variety of health & wellness domains collectively own a significant presence in this market, with healthline.com (5.81%), medicalnewstoday.com (4.85%), verywellmind.com (3.22%), webmd.com (1.81%), and verywellhealth.com (1.69%) holding a notable market share.
The multi-state dispensary crescolabs.com (8.81%) is the third-largest market share owner in this specific market, signaling market opportunity for dispensaries to surpass the health & wellness domains. Local dispensaries and other multi-state dispensaries interested in this market have an opportunity to increase their market share by focusing on leveraging the dedicated Pittsburgh ranking factors.
With the goal of increasing organic awareness, visibility, and traffic, starting with an SOV analysis provides a baseline from which to assess a brand’s core positioning against competitors. Ultimately the exact seed keywords chosen for total “voice” should be determined by each company in order to calculate more nuanced markets or niches within the Cannabis industry. Next, implement the known ranking factors (see the SRF analysis in the next section) that positively contribute to ranking on page-one of search results to improve probability of success.
Because digital is a dynamic and ever-changing environment, SOV and the following SRF analyses should be performed at least quarterly to ensure relevant optimization suggestions are provided and implemented based on current data, further eliminating wasted resources on implementation of “general SEO” tactics that have not been proven to contribute to increasing market share.


Brands compete for the same positions within search results as it’s a zero sum game; a limited number of brands can appear on each SERP, with positions 1-10 receiving the majority of search traffic. However, the PRISM AI™ SRF Analysis identifies:
The precise ranking factors which contribute to page-one rank

The discrete minimum and maximum values for each (how much is required of each factor, and when to stop investing)
The result is an A.I.-driven roadmap providing brand teams unparalleled intelligence, maximizing returns. The output from PRISM AI™ provides an itemized, ranked, and measured account of the top ranking factors driving page-one probability.
All ranking factors are defined in the Appendix.
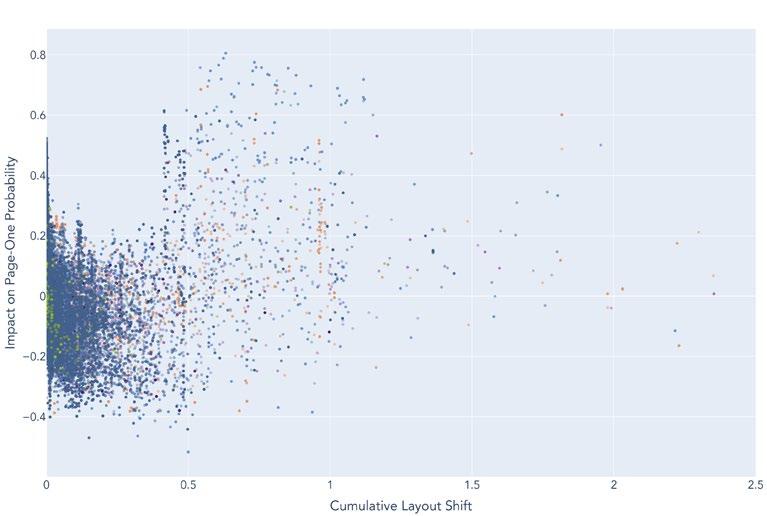
A dependence plot depicts the relationship between variables and predictions. In the following analysis, the dependence plots visualize the relationship between ranking factor measurements and page-one probability. Each plot provides a visual understanding for when a specific ranking factor has a positive or negative contribution towards page-one probability, and the optimal range for implementation.
In the example above, the Cumulative Layout Shift (CLS) is measured against page one probability. The majority of the observations are indicated by the cluster of points between 0 and 0.5 on the x-axis. However, because significant groupings are simultaneously below 0.5 CLS and below 0.0 page-one probability, the plot indicates to avoid CLS below 0.5. However, plotted points of 0.54-0.72 CLS are mostly above 0 on the y-axis, indicating a positive correlation to page-one probability and should be targeted.
The x-axis labels the ranking factor. The 0,0 origin is neutral, with neither positive nor negative contribution to pageone rank. The y-axis represents the correlation on page-one probability. Below the origin, on the y-axis indicates negative correlation on page-one rank.For a definition of all search ranking factor terms, visit the Appendix.
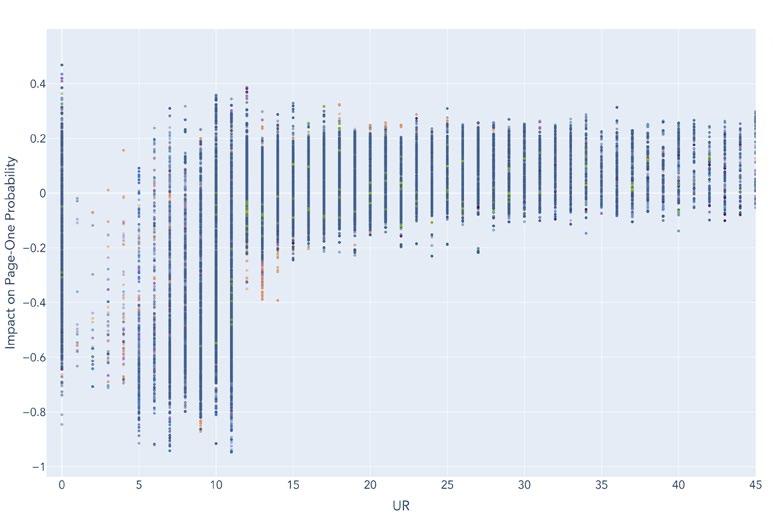
In the example above, the URL rating (UR) is plotted against page-one probability. The plot shows perpendicular lines over each UR (e.g., 5, 6, 7, etc.). The longer lines from UR 0-11 include several points with negative page-one probabilities on the y-axis (-0.2 to -1). However, URs above 12 are indicated by lines of observations mostly above 0 on the y-axis. As a result, UR of 12 to 45 are more likely to have a positive correlation with page-one probability.
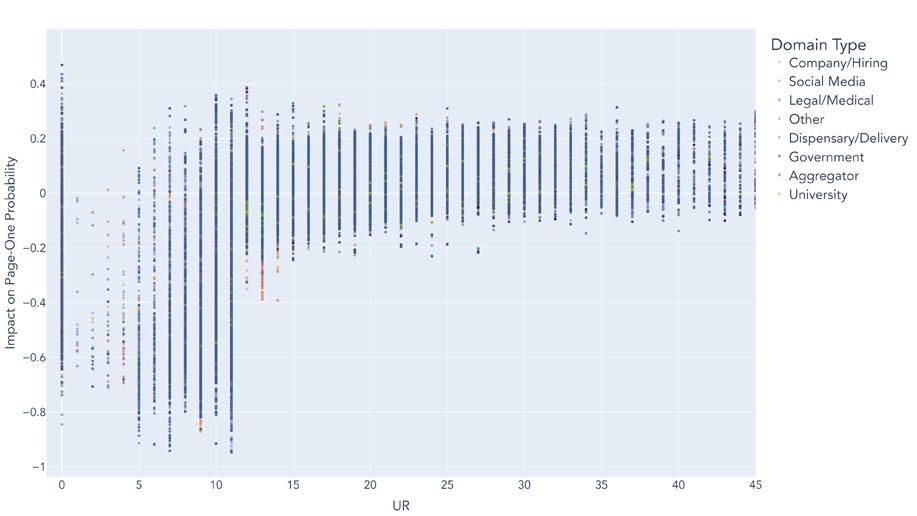
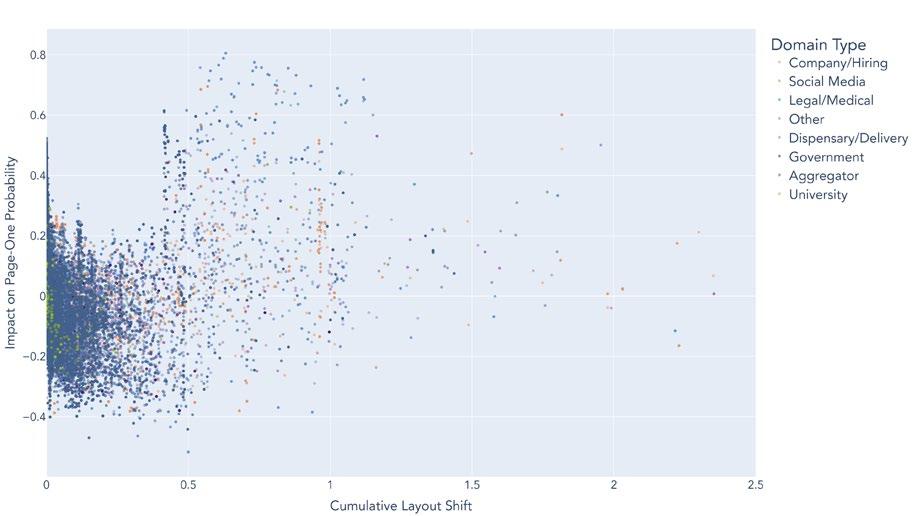
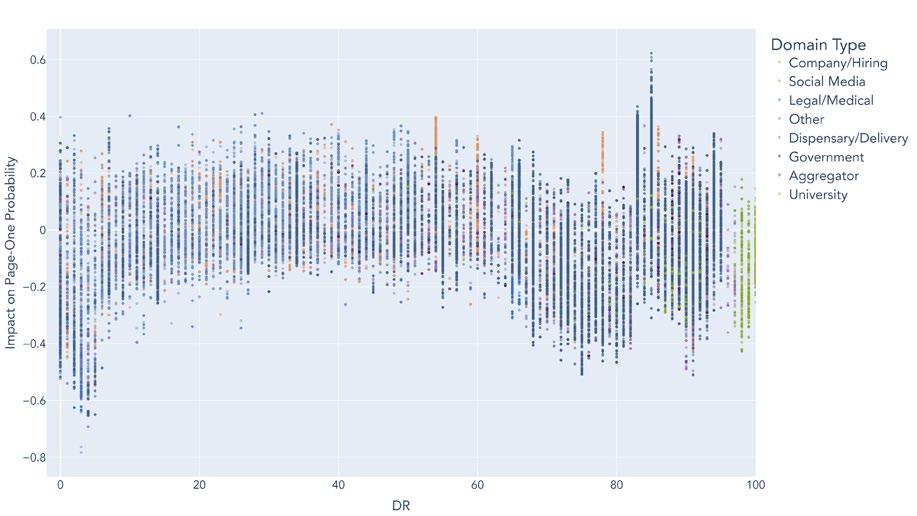
In order to understand the impact of each top-ranking factor on page-one probability, dependence plots of each of the variables can be analyzed. Dependence plots visualize a ranking factor on the x-axis against its contribution to page-one probability on the y-axis, revealing the ranges in which each factor maximizes page-one probability. Also overlaid on the dependence plots are the domain types for each URL observation, which may give further insight into how the combination of ranking factors and domain types influence page one probability.
The top 5 national cannabis search ranking factors are described on the following pages.
Through this analysis, a UR of 12 to 45 was found to have a positive correlation on page-one probability. UR values below 12 appear to have a negative correlation towards page-one probability. In order to increase a page’s UR, implement a robust link acquisition strategy that contributes to all measurable factors that are measured as part of UR and continuously monitor and report on the metric and each active component to know which efforts contribute or detract. Competitive domains with a UR of 0 may show to have a higher positive correlation on page-one probabilities, however, far more competitor domains suffer a negative correlation at this UR.
The analysis indicates that CLS values of 0.54-0.72 are primarily associated with a positive correlation on page-one probability; however, search engines have historically stated lower CLS values are recommended due to improved user experiences. Google has defined the best range to be <0.10 for CLS, which is to be considered while understanding that the competitive domains with higher CLS values are still observed, at times, to have a probability of ranking on page-one.
 0.54-0.72
According to the analysis, Domain Ratings in the range of 83-85 have a positive correlation on the probability of appearing on page-one. Conversely, ratings in the range of 30-40 have the least negative correlation for ratings under 60. A downward trend is observed in the 60-80 range. To effectively increase DR, implement a robust link acquisition strategy that contributes to all measurable factors that are measured as part of DR and Referring Domain quality, and continuously monitor and report on each active component to know which efforts contribute or detract. Because of the interdependent nature of DR, consider the relevance of each Referring Domain within the context of the website they point to.
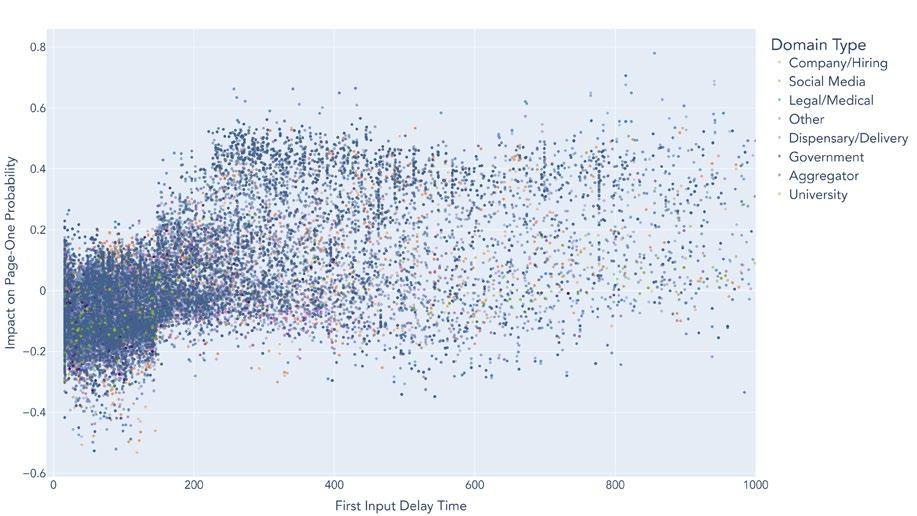
For this factor, the analysis shows values of 257-430 have the highest correlation of page-one probability, while the highest concentration of negative correlation is in values below 50. This is a reflection of the maturity of the industry and competitive landscape in terms of technical optimization. Google recommends a range of 0-130 for FID. While the dependence plot provides insight into the industry’s performance, intentionally aiming for a poor score based on Google’s established thresholds is not recommended.
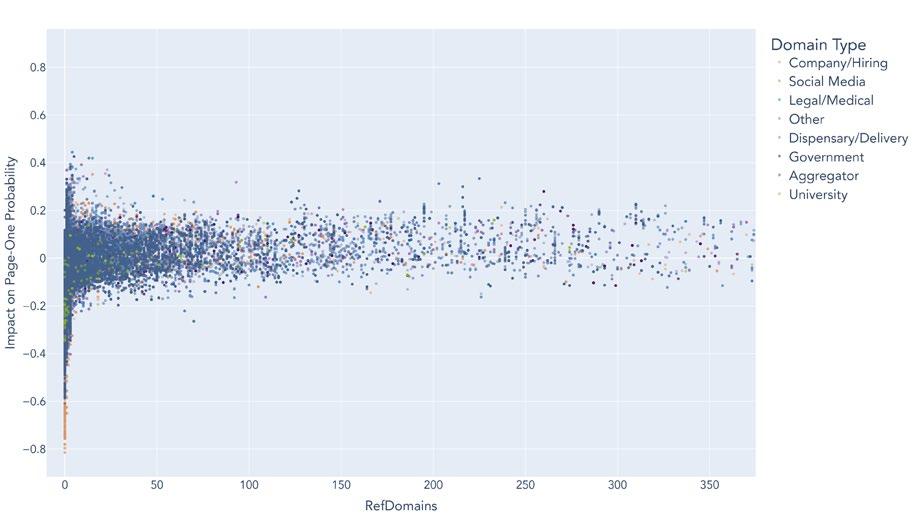
For Referring Domains, a count below 4 yields the lowest correlation with ranking on page-one. At a count of 5-15 Referring Domains, the correlation of ranking on pageone is the highest. At a count of 5-15 Referring Domains, the page-one probability is the highest. Therefore, creating a link acquisition effort targeting 15 Referring Domains maximizes page-one probability, above which only marginal returns may be realized.
According to the Search Ranking Factors analysis models, the cannabis industry has specific sets of top ranking factors that apply nationally and locally.
Based on this analysis, the most impactful national ranking factors have been identified. The implementation of national ranking factors should coincide with the goals of the business. Locality can be prioritized when needed, and reinforced by national ranking factors.
If the goal is to improve market share and increase the likelihood of ranking on page one of search results, it’s essential to implement the defined ranking factors from this analysis. However, it’s important to note that the market conditions and algorithms are continuously changing. Therefore, we recommend performing Arcalea’s PRISM AI™ SRF analysis at least quarterly to ensure that most relevant tactics are being implemented based on the most recent data.


In order to increase organic awareness, visibility, and therefore online market share, contextual keyword relevance is coupled with the unique search ranking factors to increase the probability of ranking on page-one. This keyword relevance is identified in the “Cluster Analysis.”
The following clusters represent the Cannabis industry’s most searched queries based on search volume. Also included are the unique ranking factors per cluster to increase the probability of ranking for each given cluster. These factors combine into a multifaceted approach to increase digital relevance by focusing on three dynamic elements: off-page, content, and technical recommendations.
OFF-PAGE FACTORS
CONTENT FACTORS
TECHNICAL FACTORS
It is recommended to create strategic content outlines for each Topic Cluster and implement them consistently on a weekly basis as part of a comprehensive content marketing plan. Each cluster presents numerous topic opportunities that should be analyzed and used across multiple content pieces.
The data included in each cluster is derived from search data, which is why the semantically related keywords contain erroneous spelling in addition to other grammatical errors. While it is not recommended to target misspellings, the data is included for reference.
1,892,540
SEMANTICALLY RELATED KEYWORDS
canabis store marijuan dispensary canibus store cannibis store weedstore weed dispensary
canabis dispensary
weed despensary
dispensary
INSIGHT: This cluster features a significant amount of Referring Domains from other websites, emphasizing the value of gaining trust from external sources.
605,940
indica vs sativa
sativa vs indica
difference between indica and sativa
difference between sativa and indica
indica or sativa
what’s the difference between indica and sativa

indica sativa
sativa vs indica chart
indica and sativa
whats the difference between indica and sativa
stevia and indica
sativa and indica
indica and sativa
sativa vs indica nugs
sativa or indica
INSIGHT: This cluster’s URL Rating is the lowest amongst the cohort, signaling a more achievable factor compared to other clusters.
INSIGHT: The server Response Time range for this cluster is less than 0.1 second, indicating a low threshold for variance in response time as speed is essential to meet the criteria.

274,450
indica
undica
indica strains

indica effects
indica cannibus
indica weed
what is indica
indeca weed
indic weed
indica strain names
what does indica do
indaca
whats indica
indigo weed
indica high effects
INSIGHT: This cluster has one of the lowest Image Tag Counts, indicating the need to optimize and reduce the HTML for all images on pages related to Indica to reduce load times, bounce rates, and improve user experiences.

248,480
diesel sour
girlscout cookies strain
zookies strain
wedding pie strain
girlscout cookie strain
zookies
kush mints
types of weed
kugh mints strain
different types of weed
pinaple express weed
gorl scout cookies strain
wedding pie
grape diamonds strain
strongest weed
INSIGHT: This cluster has one of the highest Image Tag Counts amongst the cohort, indicating the need to increase the number of image tags on the page, while keeping the underpinning HTML optimize as to not increase the load time for users. While more image tags are observed for optimial rankings, the user experience should not be negatively impacted
terpenes
mycrene
caryophyllene
terpene cannabinoids

limonine
humulene
beta-caryophyllene
beta carophyllene
what is terpenes
what are terrapins
terpene shield
ocimene
linalool terpene
myrcene effects
INSIGHT: The observed Unique External Outlinks is the highest for this cluster amongst the cohort, indicating the need to include quality outbound links to provide users with additional reference points within the content on pages that stem from the Terpenes cluster.
rick aimpson oil
rick simpson oil
rso oil
rick simpsons oil
rick simson oil
what is rso
rick simpson oul
rick sampson oil
rso weed
rso full spectrum
rso vs tincture
rso cookies
is rso decarbed
rso peanut butter is rso decarboxylated
INSIGHT: This cluster shows the lowest Referring Domains when compared to the cohort, indicating a lower number of total linking domains are required to be competitive.
114,610
medical marijuanas
medical card
allotment checker
mmj allotment
medical marijuana dispensaries
marijuana card
medical marijuanas dispensary
how to get a medical marijuana card
medical marijuanas jobs
how to get a medical card
medical marijuans
medical marijuna cards
medical dispensaries
medicinal cannabis dispensaries

mariguana card
INSIGHT: This cluster is observed to have the second lowest Cumulative Layout Shift, which aligns with SRF analyses performed within the healthcare industry. The similarities between medical and health related topics convey search engines’ level of importance for stability on pages that contain these topics.
109,230
cbg
ehat is cbg
what is cbg
cbg benefits
what iscbg
wjat is cbg
wgat is cbg
cbg cannabinoid
whay is cbg
cbg effects
what is cbg good for
what id cbg
what is cbg oil

cbg medical
whats cbg
INSIGHT: The CBG cluster has the lowest observed Largest Contentful Paint Time, indicating pages focused around this cluster should have the fastest load speed amongst the clusters cohort.
54,900
indica vs sativa vs hybrid hybrid strain
sativa vs hybrid sativa indica hybrid hybrid vs indica indica vs hybrid indica sativa and hybrid hybrid indica sativa
sativa vs indica vs hybrid chart hybrid weed high hybrid vs sativa
difference between indica sativa and hybrid indica dominant hybrid hybrid effects indica hybrid
INSIGHT: First Input Delay Time is observed amongst the lowest in this cluster, indicating pages focused around this cluster should have the best responsiveness and user interactivity.

To boost organic visibility in the cannabis industry, a content marketing strategy and implementation plan should center around defined topic clusters and unique ranking factors per cluster. Each cluster can generate numerous distinct pieces of content, which can enhance the domain’s contextual relevance on search engines and relative to competitors.


Content marketing and SEO are crucial for capturing organic traffic in nearly every industry.

Content marketing involves creating and distributing valuable, relevant, and consistent content to attract and retain a clearly defined audience. By providing useful content, businesses can establish themselves as thought leaders in their industry, build trust with their target audiences, and attract customers searching for products or services online.
SEO, on the other hand, involves optimizing a website to rank higher in search engine results pages (SERPs). This helps businesses to increase their visibility to potential customers and drive more traffic to their website.
Together, content marketing and SEO can help businesses to attract and retain customers, improve online visibility, and ultimately increase revenue.
In the cannabis industry, A.I. can be used to avoid wasted, general monthly SEO and content efforts in favor of precise SEO targets and content implementation. By analyzing Share of Voice (SOV), Search Ranking Factors (SRF), and Topic Clusters, businesses can improve their search ranking with targeted, prescriptive data, saving tens of thousands of dollars in resources and increasing revenues and lifetime value for the business.
This intelligence report provides the analysis and optimal implementation values for how to increase a domain’s probability of ranking on page-one of search results within the Cannabis industry.
Understanding there is a lot of information in this report, , it can be challenging for brands to decipher what is needed for their specific business based on needs and goals. If your team needs help implementing the included tactics, or has a greater marketing needs, please reach out to our consulting team at cannabis@arcalea.com.


Cumulative Layout Shift measures the visual stability of a page, quantifying how often users experience unexpected layout shifts. CLS is another user-centric metric and is part of the Core Web Vitals metrics that Google has confirmed as ranking signals. A low CLS helps ensure that the page is user-friendly, evaluating if there is a banner ad, image or video that loads after the content, causing the page to “jump down” and violates user experience.
Domain Rating measures the popularity and strength of an entire domain’s link profile (not just a single page like UR). DR is an aggregated, weighted measurement that is dependent on the number of high-DR sites that link to a domain, and also how many other websites these high-DR sites link to.
First Input Delay Time measures a user’s first impression of a site’s interactivity and responsiveness. It measures the time from when a user first interacts with a page to the time when the browser is actually able to respond to that interaction. The main cause of a poor FID typically is heavy JavaScript execution. Optimizing how JavaScript parses, compiles, and executes on a page will directly reduce the delay time. First Input Delay Time is part of the Core Web Vitals metrics that Google has confirmed as ranking signals.
Referring Domains measure the number of unique domains pointing to the observation URL. When managing organic efforts to increase Referring Domains, it is important to consider the quality of the domains along with the quantity, as high-quality and relevant Referring Domains can be more valuable than lower-quality and irrelevant domains.
Image Tag Count is the count of individual <img> tags that are a self-contained code element in HTML that contains image information and location, and sometimes instructions for displaying (height/width). Image Tag Count can be a proxy measurement for content richness. Overloading a page with images can also be detrimental to page-one ranking probability, as non-optimized, “heavy” images can increase page loading time. Increased load time can detract from the user experience and even increase the bounce rate. Therefore, it is important to consider the optimal thresholds for Image Tag Count.
Largest Contentful Paint Time measures perceived load speed as a user-centric metric. LCP is part of the Core Web Vitals metrics that Google has confirmed as ranking signals; therefore, it is important to consider this to maximize the probability of ranking on Google’s first page.
A domain that produces and distributes medical news & information
A domain that aggregates information or products from various sources within a particular industry.
URL Rating measures the qualitative components of popularity and strength of a specific page’s link profile. UR is a page-level metric, taking into account both internal and external links. It’s important to note that UR is an aggregate measurement of inter-linking, quality Referring Domains, follow v. no-follow attributes, the contextual relevance of the link profile, etc..
A domain that produces and distributes news, information, or entertainment.
A domain that operates in multiple states across the nation, offering a variety of products and services to customers in different regions.
A domain that operates only in a particular state, offering products and services that are specific to the laws and regulations of that state.