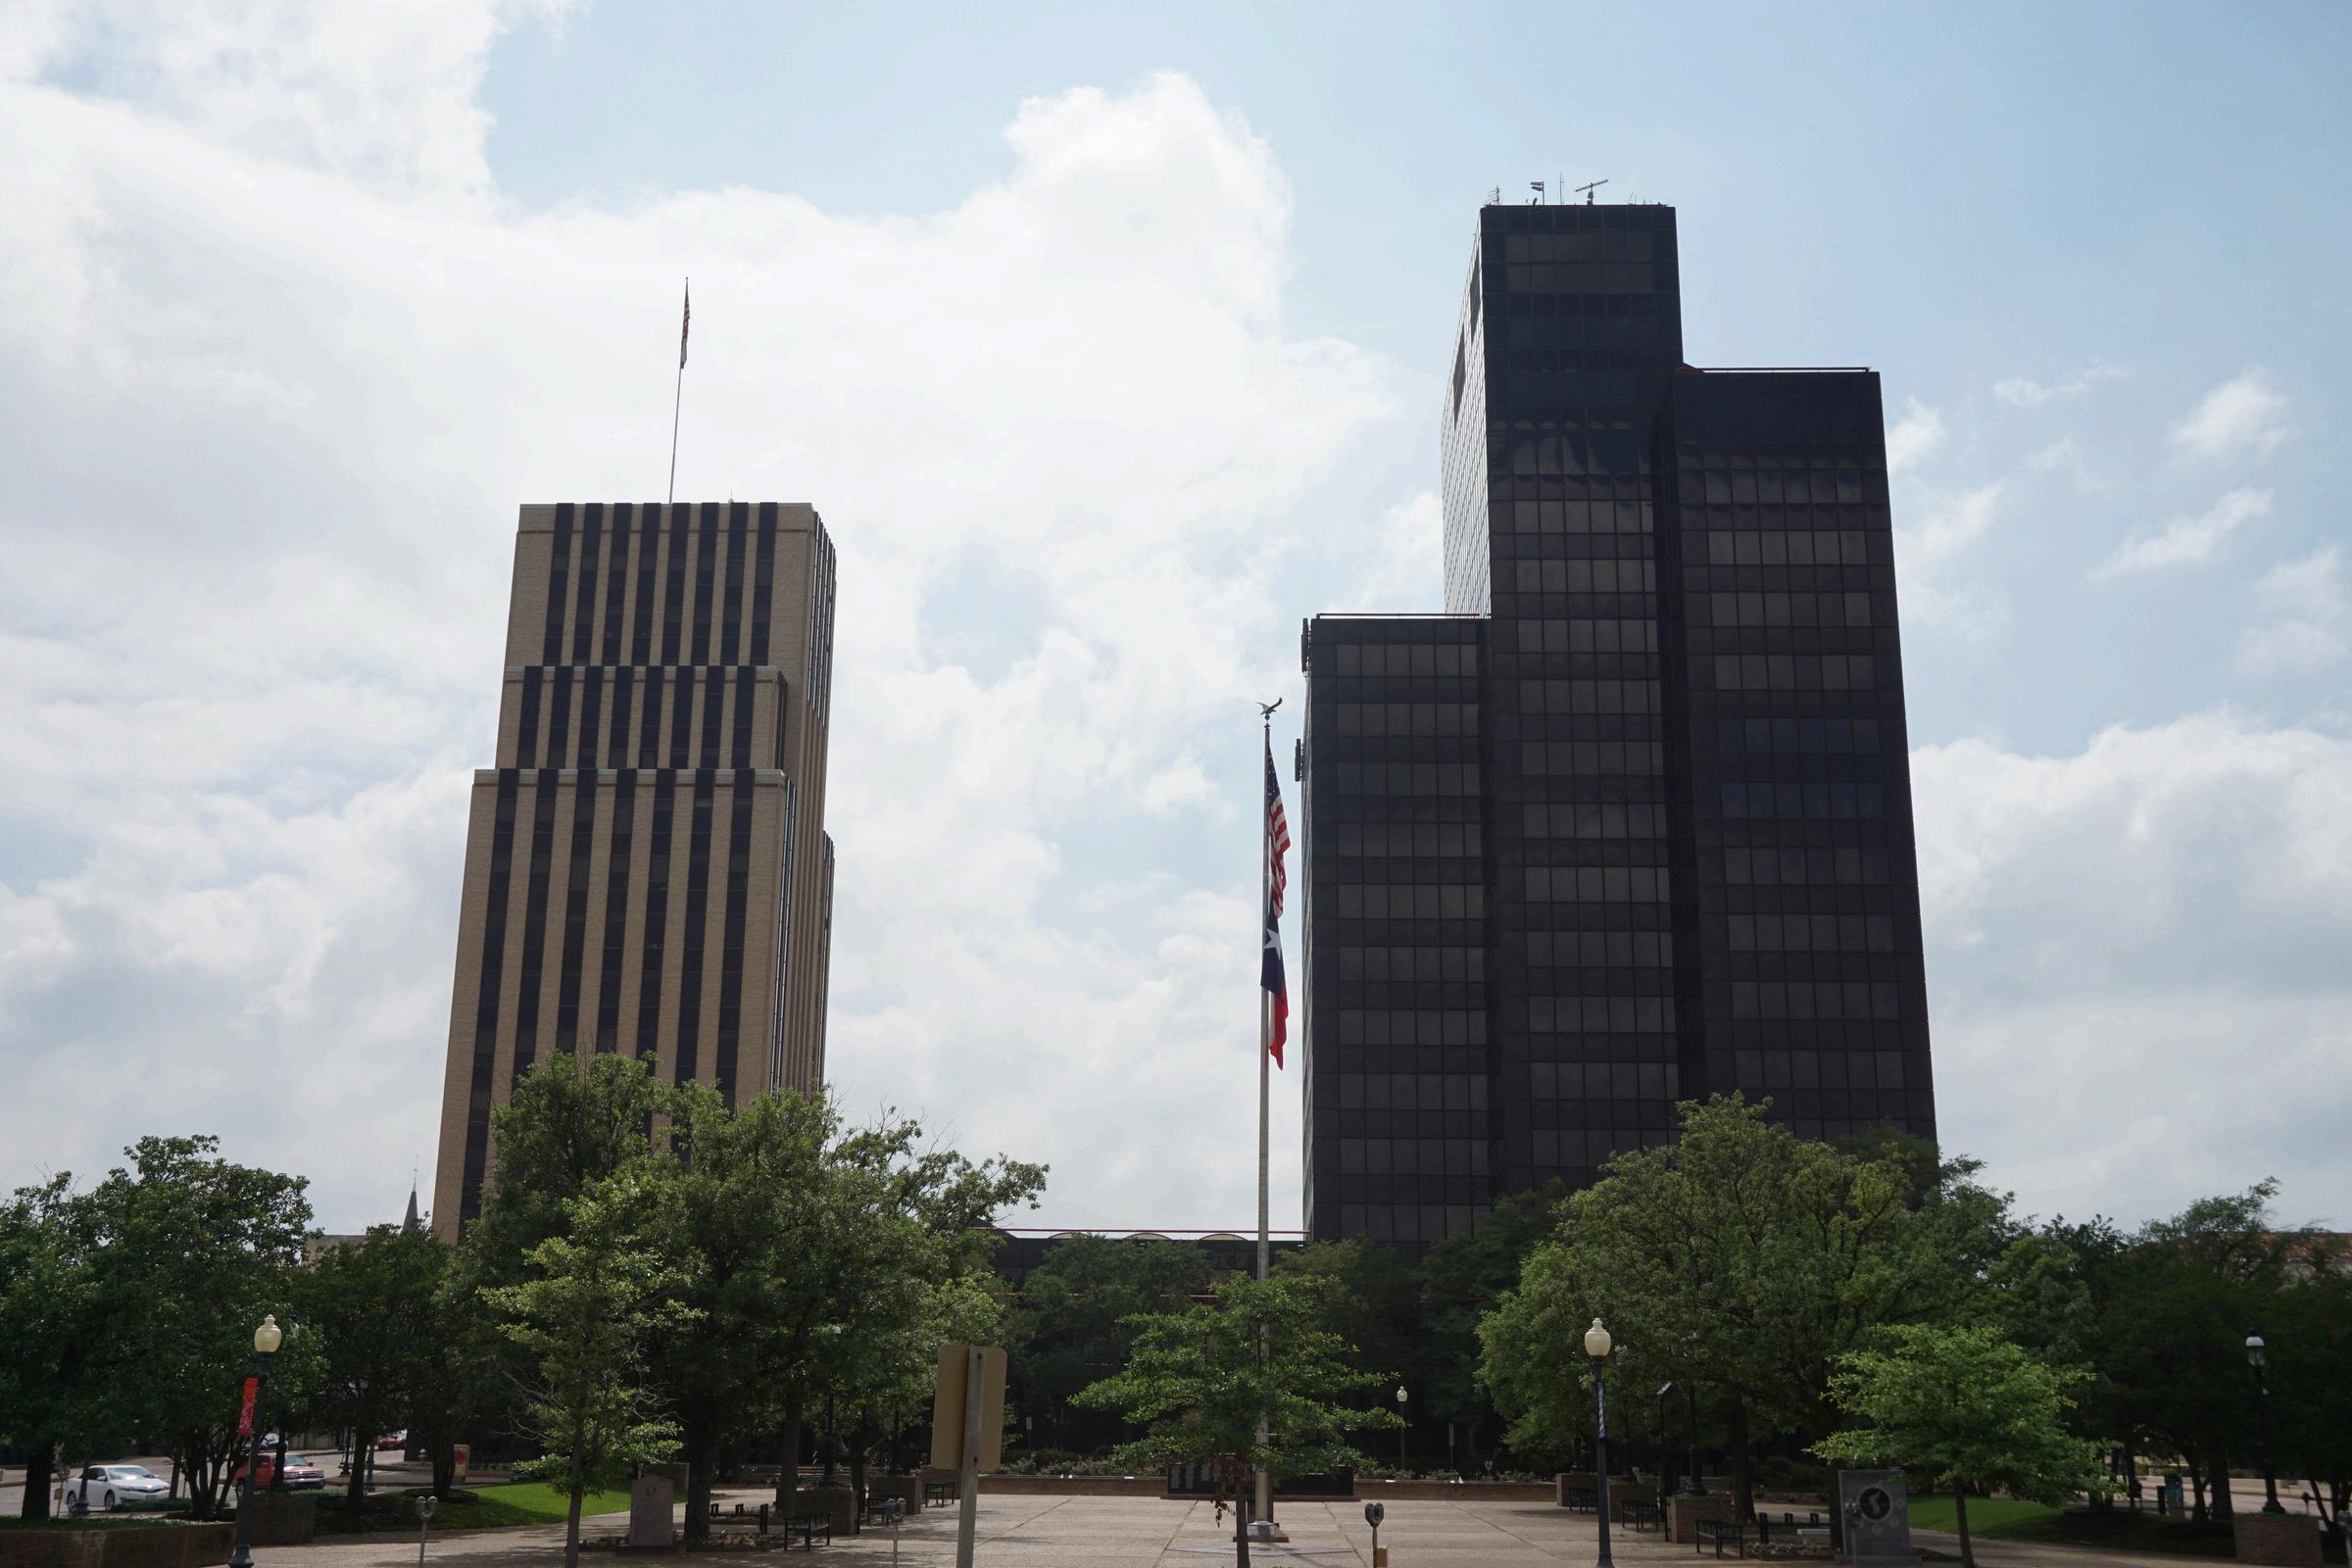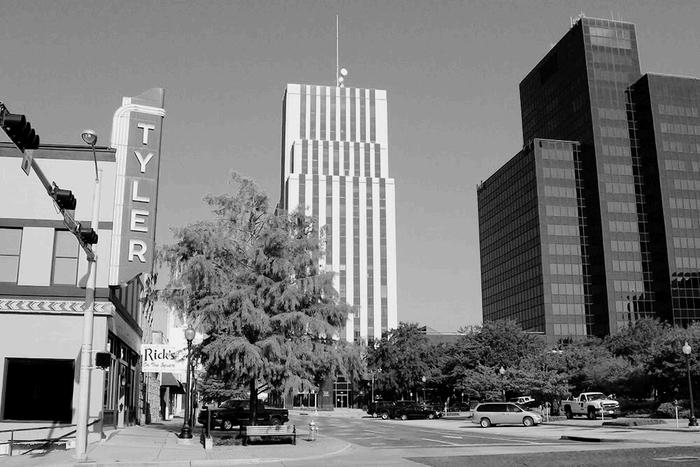


The Tyler Economic Dashboard is published quarterly. It provides regional and local data on demographics, socioeconomic conditions, the economy, taxes, the labor market, housing and office markets, and gasoline prices.
This report is a collaborative effort between the Tyler Economic Development Council and the Hibbs Institute for Business and Economic Research. Its primary goal is to deliver timely, relevant information to the general public and community leaders, supporting well-informed and strategic decisionmaking.

Population in the Tyler MSA (2010 -2023)

2023, the
MSA’s


Distribution of Annualized Household Income (2023)

11,260,645
81,987 Households Households Households $69,810 $66,252 $66,887
131,332,360
The Tyler MSA has a larger share of households earning between $75,000 and $99,999 than the state and the national averages, but a smaller share earning more than $100,000.
Per Capita Personal Income (2023)

Source: 2023 ACS 1-year estimates, and U.S. Bureau of

Real Gross Domestic Product (2023Q1 - 2025Q1)
Percentage change from preceding quarter

Source: U.S. Bureau of Economic Analysis $12,494,743
In 2023, the Tyler MSA’s GDP grew by 4.2% in 2023 outpacing the national rate of 2.8%, but trailing Texas’s 7.4% reflecting a steady local growth.
GrossDomesticProduct(GDP)
TheGrossDomesticProduct(GDP) measuresthetotalvalueofgoods and services produced within a country,state,orlocaleconomy It excludes intermediate goods and services used in the production processtopreventdouble-counting ChangesinGDParewidelyusedas an indicator of a region’s overall economichealth.

Real Gross Domestic Product Over Time in the Tyler MSA
Percentage change from preceding year (2012 - 2023)

Professional and business services, Educational services, and Real estate, rental and leasing drove the Tyler MSA economic growth over a decade. Industries that contracted include Wholesale trade, Arts, entertainment and recreation, and Mining, quarrying, and oil extraction.
Real Gross Domestic Product Across Industries in the Tyler MSA
Percentage Change (between 2013 and 2023)


In 2024, Tyler’s cost of living dropped to 93.5 6.5% below the national average with housing and miscellaneous goods accounting for 60% of household expenditures.
Share of Costs by Categories in the Tyler MSA

Source: Council

Cost of Living Index in Selected Texas MSAs, Relative to Tyler’s 2024 Annual Average Data

Among nearby East Texas metro areas, Longview’s cost of living is almost identical to Tyler’s, at just 0.2% higher. In contrast, living in Plano is 17.6% more expensive, while Harlingen and Amarillo are 12.9% and 11.2% cheaper, respectively.
Source: Hibbs Institute and TEDC's


Source: Texas Comptrollers

Hotel Occupancy Tax Revenue
Tyler MSA (in dollars)

Hotel tax revenue in Tyler remain steady at $3.4 million in 2024, while monthly sales tax collections reached a record high of $6 million in early 2025.
Monthly Sales Tax in the city of Tyler and Smith County
3-month moving average (March 2019 through July 2025)


Number of Jobs in Tyler MSA (2025 Q1)


U.S. Mortgage Rates Weekly averages as of 08/07/2025

30-year mortgage rates climbed to 6.63%—more than twice their 2021 low—signaling continued affordability challenges for homebuyers.
Source: FreddieMac (08/07/2025) (01/07/2021) (07/29/2021) (10/26/2023) (10/26/2023)


Average valueperdwellingunit


Home Sales and Median Housing Price in Smith County (December 2024 - June 2025)

In June 2025, home sales totaled 216 units, and the median sale price reached $336,000—up 0.4% from the annual median in 2024.
Active Units (Listing) Homes listed (June 2025)
1,521
Closed Units YTD Homes closed (June 2025)
1,231
Average Sales Price YTD Homes Prices (June 2025)
$362,766
$315,000

Median Sales Price YTD Homes Prices (June 2025) Source: Greater Tyler

Building Permits by Type and Subtype in Tyler, TX
Data as of August 13, 2025

Over the past 12 months, the City of Tyler issued 731 building permits, with Certificates of Occupancy making up more than half of the total. Among construction and renovation permits, commercial projects accounted for about 23%, while remodels and renovations represented about two-thirds of all permits issued.

Proportion of Commercial Building Permits in Tyler, TX by Subtype (2024)

Others
Offices,Banks,and Professional
Total 101
HealthClubandSports Facilities
Restaurant
StoresandCustomer Service
ServiceStationand RepairGarage
Offices, Banks & Professional buildings accounted for 27% of all commercial permits in 2024, while subtypes such as restaurants and stores represented between 5% and 8% each.
Source: the City of Tyler.


Data Sources
Demographic Variables
U.S. Census Bureau. 2022 ACS 5-year estimates. https://data.census.gov/
Gross Domestic Product variables
Bureau of Economic Activity. Gross Domestic Product. https://www.bea.gov/data/gdp/gross-domestic-product
Cost of Living Variables
Council for Community and Economic Research. https://www.coli.org/
Taxes Variables
Texas Comptroller. https://comptroller.texas.gov/taxes/sales/
City of Tyler. https://www.cityoftyler.org/
Labor Market Variables
Bureau of Labor Statistics. https://www.bls.gov/
Chmura Economics and Analytics. https://www.chmura.com/software
Housing Market Variables
Freddie Mac. https://www.freddiemac.com/
Greater Tyler Association of REALTORS® | GTAR . https://www.gtar.com/
Burns Commercial Properties. https://burns-commercial.com/tyler-tx-commercial-realestate-market-trends/
Texas Real Estate Research Center https://trerc.tamu.edu/
Commercial Permits Variables
City of Tyler Costumer Service Department
https://www.arcgis.com/apps/dashboards/685888e63a484b1b9d10bfd77ee26aa6
Gasoline and Diesel Variables
AAA Gas Prices. https://gasprices.aaa.com/

A collaborative effort by the team:

President / CEO
Scott Martinez, CEcD
Senior Vice President, Economic Development
Mary Alice Guidry
https://tedc.org/

Director and Research Analyst
Manuel Reyes, D.E.D.
Junior Research Analyst
Cecilia Cuellar, Ph.D.
https://www.uttyler.edu/hibbs-institute/ Research Assistants
Pedro Gallardo-Toledo
María Rodríguez