Economic, social and environmental importance of the wine sector in
the EU


1.
2.
3.
4.

A.
B.


1.
2.
3.
4.

A.
B.


The European Union (EU) has developed a complex value chain that involves different economic sectors and accounts for 62% of the world's total wine production

Wine value chain
Economic sectors | Market value1 (B€)
Viti-viniculture (Agriculture)
Main activities involved
• Vineyard care and management
• Grape harvesting
• Agricultural on-holding wine production using self-harvested grapes
The EU is responsible for 62% of global wine production volume5 62%
Winemaking (Industry)
Commercialization (Services)
• Wine production using not selfharvested grapes
• Crushing and fermentation
• Bottling, aging and maturation
• Distribution
• Retail sales
• On-trade consumption


In 2022, the wine sector in the EU contributed 130 billion euros to the Gross Domestic Product (GDP), equivalent to 0.8% of the EU's GDP

Wine sector contribution to EU’s GDP in 2022 (€ Billion)
Viti-viniculture Winemaking Commercialization
Each € of direct GDP from the wine sector generates a total amount of €2.3 to the entire EU’s economy x2.3
€130 billion
Wine total contribution to EU’s GDP (2022)
Equivalent to
• 0.8%1 of EU’s GDP: The economic activity generated by 125 Wine sectors would be equivalent to the whole economy of the EU
• 47.9%2 of EU’s Primary sector: The economic activity generated by the EU Wine sector is equivalent to almost half of the total agriculture, forestry and fishing Gross Value Added inside the EU
• 9.7%3 of Spain’s GDP: The economic activity generated by 10 EU wine sectors would be comparable to the size of Spain’s economy
Source: PwC estimates using Input-Output Methodology, Eurostat and Statista data (1) Source: Eurostat National Accounts GDP current prices for EU-27 in 2022. (2) Source: Eurostat Gross value added by industry current prices for EU-27 in 2022 (3) Source: Eurostat National Accounts GDP current prices for Spain in 2022 (4) Source: Eurostat International trade in goods with Extra-EU countries. (5) Source: European Commission Monitoring EU AGRI.FOOD TRADE March 2023 Direct
The wine produced in the EU generates a strong demand from abroad…
€15.9 billion positive trade balance4 3.7%
Without wine, trade deficit of the EU in 2022 would have been 3.7% higher
2nd
Wine was the second most exported EU agrifood product by value during 20225

Around 38% of the total GDP contribution, 50 billion euros, is generated indirectly through the value chain, benefiting a wide range of economic activities outside of the wine sector


Top 3 indirectly benefited sectors by the wine sector
15.4%
of indirect contribution to EU’S GDP corresponds to the trade & repair sector (€ 7,682 Million)
14.5%
of indirect contribution to EU’s GDP corresponds to the manufacturing sector (€ 7,235 Million)
Main activities involved by sector
• Wholesale and retail trade of:
▪ Wine glasses
▪ Transportation vehicles
▪ Wine fridges/coolers
• Wine cork manufacturing
• Wine bottles manufacturing
• Agricultural machinery manufacturing & repair
Source: PwC analysis
10.7%
of indirect contribution to EU’s GDP corresponds to the professional, scientific and technical activities (€ 5,331 Million)
• Engineering auxiliary services (agricultural support, wine safety tests…)
• Advertising campaigns, marketing/branding

In terms of employment, the wine sector generated a total amount of 2.9 million jobs in 2022, which represents 1.4% of EU employment1

Wine sector contribution to EU’s employment in 2022 (thousand – k – jobs)
2.9 million
Wine total contribution to EU’s employment (2022)
Equivalent to Viti-viniculture
Winemaking Commercialization
For each direct job in the wine sector a total amount of 1.6 jobs are generated in the whole economy x1.6
Labor productivity4 of wine is higher than that of its counterparts at every stage of the value chain…
• 1.4%1 of EU’s employment: The employees associated with 71 EU wine sectors are equivalent to the total jobs in the EU
• 20.3%2 of EU’s Construction employment: The associated employment of 5 EU Wine sectors is comparable to the total number of construction employees within the EU
• 11.3%3 of Italy’s employees: The employment generated by 9 EU wine sectors would be on par with the total employment in Italy
Viti-viniculture Winemaking Commercialization +90% +16% +5% vs crop and animal production vs manufacturing vs food and beverage activities
Additionally, wine farms are 15% more profitable than the average farm in the EU
Source: PwC estimates using Input-Output Methodology, Eurostat and Statista data (1) Source: Eurostat Employment for EU-27 in 2022. (2) Source: Eurostat employment by industry breakdowns for EU-27 in 2022. (3) Source: Eurostat Employment for Italy in 2022 (4) Labor productivity measured as GVA per employee. The values for counterparts were collected from Eurostat. 7

Rural areas in the EU, which have experienced a notable decrease in population, account for almost half of the territory. Vineyards, given its socioeconomic impacts, play a crucial role revitalizing them

Total change in population between 2015-2019 in rural regions with vineyards3
Population in rural areas1 in 2022
92.9 million people
Total surface covered by rural areas1 in 2022
1.9 million km2
Rural regions with expanding vineyards have nearly maintained their population, experiencing only a slight decrease of 0.4%. In contrast, areas with shrinking vineyards have seen a significantly higher decline in their population growth rate, which is 6.5 times greater at -2.6%
Rural regions where area under vines as increased Rural regions where area under vines has decreased -0.4% -2.6% x6.5
Rural regionswhere area under vineyards has increased
Rural regionswhere area under vineyards has decreased
Total surface covered by vineyards2 in 2020
31.8 thousand km2
-4%
Population in rural areas has been experiencing an annual decrease of around 0.7% since 20144 , resulting in a total decrease of 4%

Wine tourism promotes and develops rural areas in the EU, acting as an economic catalyst for generating economic value in related activities

Wine tourism is a key element for social and cultural promotion of rural areas because:
…increases the status of those rural areas converting them into premium destinations for potential tourists … contributes to develop the rural areas, create jobs and an opportunity to stay for young adults
Key figures of the wine tourism sector
…promotes other regional cultural values, such as gastronomy and local special products
€15 Billion 36 Million
Almost 36 Million people visited areas surrounding vineyards looking for experiences around wine during 20221
During their journey people take pleasure in exploring the rural landscape and its rich social and cultural traditions, generating revenues for the local businesses
€1.1 Billion
More than € 1 billion of estimated spending in wineries and wine museums visits in 2022 in the EU2
Including also related activities, total revenue of wine tourism in the EU reached 15 Billion euros in 20223
Visit of wineries and wine museums
Visit of vineyard’s suitable areas
Tour guides
Rural accommodation
Local gastronomy discovery
EU. (3)

The wine sector contributes over 1.1 billion euros to Research and Development (R&D) investment in the EU, equivalent to 0.3% of the total EU's R&D1 148

€1.1 billion
Wine total contribution to EU’s R&D (2022)
The wine sector directly contributes to R&D and innovation through different areas of study2:
Viniculture
Wine economy
Processes
Sustainability
Product Health
Source: PwC estimates using Input-Output Methodology, Eurostat and Statista data
(1) Data from the European Commission for 2021 (€331 billion). (2) Source: Wine Technology Platform areas of study in Wine research projects (PTV)
wine sector contribution to EU’s R&D in 2022 (€M)
Each € of direct R&D from the wine sector generates a total amount of €7.5 of R&D to the entire EU’s economy x7.5

The wine sector's total fiscal contribution was nearly 52 billion euros in 2022, representing approximately 0.7% of the EU’s general government expenditure1

Wine
Wine’s fiscal contribution can be disaggregated into 5 different types of taxes:
For illustrative purposes and to facilitate comparability, the total fiscal contribution in 2022 is equivalent to 76% of the GDP of Croatia3, and represents 1.2 times the GDP of Malta and Cyprus combined3

In addition, the wine sector contributes to the sustainability of the EU environment by boosting biodiversity, limiting soil erosion, improving water management and proving fire protection

Main areas of wine sector contribution to the EU environment
Boosting biodiversity1
+50% butterfly species x3 plant species x4 bee species
Limiting soil erosion2
Covering crops in vineyards reduce soil erosion by up to 8 times compared to traditional tilling
Improving water management1
25% to 35% water savings
Providing fire protection3
Vineyards have an average flammability x5 lower than average cereal crops
In addition to its EU environmental contribution, the EU wine sector have already taken action to mitigate their greenhouse gas emissions, identifying the sources of emissions and defining concrete actions to reduce them
Distribution of GHG emissions in IWCA winery members by scope5 (%)
Reducing environmental impact through specific measures….
82,000

Wine bottles saved by reusage saving 170 tons of CO24

25%
Anticipated decrease in carbon emissions associated with bottle weight reduction1

Fuel use for winery’s activity, vineyard soil emissions Eelectricity purchased from the local grid Transport & distribution, purchased grapes, wine packaging, etc.
While the wine sector is taking significant steps towards environmental sustainability, it also requires support and funding to adapt to a warming world and combat extreme weather events

Projected impacts for EU’s wine sector6 10 – 40 Days of anticipated phenological phases of grapevine

8 tons
Up to 8 tons per hectare of yield loss projections for some wine regions in the EU
(1) Source: European Commission Cineac “How wineries are adapting to a warmer world” (2) NEIKER technology centre (Instituto Vasco de Investigación y Desarrollo Agrario). (3) Pagadala, T., Alam, M. A., Maxwell, T. M., & Curran, T. J. (2023). (4) Source: European Commission Cineac “How wineries are adaptating to a warmer world” (5) Source: International Wineries for Climate Action GHG inventory (6) Source: Droulia, F.; Charalampopoulos, I. (2021),

1.1 Wine and its role over the European culture
1.2 The wine sector value chain
1.3 Objective and scope of the report
The European Union (EU) leads the world wine market with more than 165 million hectoliter (hl) produced, representing over 60% of the global share
EU wine production
165.7 Million hl 1
EU member states produced a total amount of 165.7 Million hl of wine products1 in 2022
62%2
EU member states produced 62% of the total wine in the world in 2022
(1) Source: European Commission Wine Production and opening stocks wine products include P.D.O and P.G.I wines, other wines varietal and non vinified,
(2) Source: OIV State of the world Vine and wine sector in 2022
(3) RoW: Rest of the World
The EU has maintained its position as the major producer in the world with a relative constant global share in the last decades, while other regions such as Oceania and America have increased their stake
63%
European Union America
19%
Oceania
5%
This leadership may result from the pivotal role that vineyards and wine have historically played in European culture
… elements of cultural identity
Vineyards & wine are…
In a time where other industries delocalize their productive processes, the European wine sector will continue creating and maintaining economic, cultural and social value for the EU’s communities.
… part of the agrarian heritage
Vineyards are a part of the agrarian heritage of the EU, from the ancient Greeks and the Roman Empire to modern Europe, vineyard landscapes and winemaking techniques have been a part of European’s identity for centuries shaping the local areas and adding tangible heritage to them, such as win cellars, traditions, folklore and festivals1
… tradition keepers … linked to the EU territory
Wine companies heavily depend on a certain territory and on the communities living there, establishing a positive synergy between the wine producers and the local communities.
European Wines uniqueness depends on the diverse European terroirs where the grapes are cultivated and harvested and, as a consequence of this, wine is a product absolutely linked with Europe’s territories.
(1) A.Pulpon et.al Potential of Vineyard Landscaps for Sustainable Tourism in Geosciences 2019 Source: CEEV https://www.ceev.eu/about-the-eu-wine-sector/
Wine sector’s long history has conformed a complex value chain that can be divided in three main activities: viti-viniculture, winemaking and commercialization. The three stages combined to form a market value of 100.3 billion € in 2022
The market value of each sector in the value chain incorporates the market value of the preceding sector. For example, the market value of commercialization encompasses the market value of winemaking.
Wine value chain (Economic sector) Market value
Viti-viniculture (Agriculture)
Activities involved
€29.4 Billion1
• Vineyard care
• Grape harvesting
• Agricultural on-holding wine production using self-harvested grapes
Key players

Grape producers


Winemaking (Industry) Commercialization (Services)
€50.3 Billion2
• Wine production using not selfharvested grapes
• Crushing and fermentation
• Bottling, aging and maturation
• Distribution
• Retail sales
• On-trade consumption

Wineries Wineries (using only self-harvested grapes)

Wineries Wholesale Retail HoReCa
Viti-viniculture is the first pillar of the wine sector, with a market value of almost 30 billion euros through the production of premium grapes
€29.4 billion
Viti-viniculture production value (2022)1
10.2% of total crop output production value in the EU
5.6% of agricultural output production value in the EU
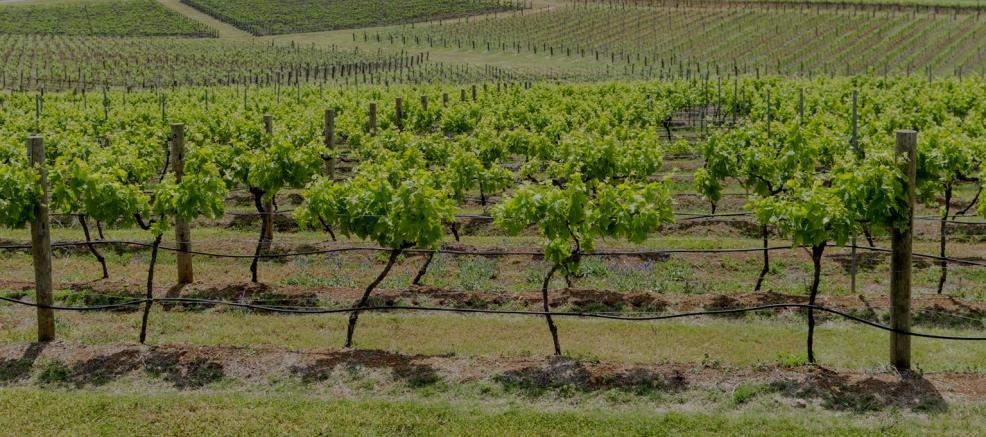
3.2 M ha
Area under vines in the EU2
2% of the utilized agricultural area in the EU
A vast majority of vines in the EU are destinated to the production of quality wines
45% of all vine-growing areas in the world (2.2M holdings)
Area under vines by type of production2
A vast majority of vines in the EU are destinated to the production of quality wines
(1) Source: Eurostat – Economic Accounts of Agriculture production value for 2022 (25.6 Billion €). Values for transformation of agricultural products wine and other grapes are for 2021 (3.8 Billion €)
(2) Source: European Parliamentary Research Archive The EU wine sector -July 2023. Values for 2020
Winemaking, the second pillar, involves more than 12,000 enterprises that contribute to the industrial sector, with a sold production value exceeding 50.3 billion euros
Wine products produced in the EU in 2022
3 - Million of hl €50.3 billion
Wine industry value of sold production1 12,031 enterprises2
66% of total hl produced were P.D.O & P.G.I wines

(1) Value of sold production of all wine products. Source: Statistics on the production of manufactured goods 2022 Eurostat
(2) Number of firms within category manufacture of wine from grape. Source: Structural Business statistics Eurostat 2021
(3) Wine production and opening stocks. Source: Directorate-General for Agriculture and Rural Development: European Commission
A powerful, decentralized, and diversified industry. With more than 12,000 firms, the total revenues per firm reached €4.2 million in 2022, with an average production per firm of 13,722 hectoliters.
Distribution and commercialization of wine represent the third pillar, the critical step in delivering the final product to customers through diverse channels, with a total market size of more than 100 billion euros
€100.3 billion

(1) Wine market size EU and world 2022 source Statista
(2) 2022 EU consumption source OIV
(3) Distribution of wine sales by volume and value in EU countries, source Statista
While the on-trade channel represents just a 25% of wine consumption, it accounts for 55% of the value Off-Trade On-Trade

The aim of this report is to quantify the economic contribution of the wine sector to the EU, considering every stage in its value chain, and acknowledging its impact on R&D, society, culture and the environment
Objective
The purpose of this report is to estimate the socioeconomic contribution of the wine sector to the European Union by computing different impacts
Economic
Scope
Employment
Social, cultural and rural
R&D Tax revenue
Environmental
Sectoral scope
The entire wine sector will be analyzed, from the grape cultivation up to the final sell of wine to customers in bars, restaurants and stores.
Source:
Geographical scope
The region considered for this study is the entire EU. Thus, we will compute the contribution of the entire wine sector for the whole European Union.
Temporal scope
The impacts are computed for the year 2022. For this matter we will use production and sales data for 2022.
The quantification will encompass not only the direct impact but also the spillover effect on the broader productive network through indirect impacts (supply chain) and induced impacts (household consumption)
In order to estimate the socioeconomic contribution of the wine sector to the EU’s economy we applied Input-Output methodology, a standard and widely accepted and utilized technical tool that allows to calculate three different effects:
• Direct effect. The effect generated by the activity of each stage of the wine sector (viticultors).
• Indirect effect. The effect generated by the investment and expenses made by the direct activities (suppliers of agricultural machinery, suppliers of cork stoppers).
Input-Output methodology Suppliers
• Induced effect. The effect generated by the household’s consumption of goods and services associated with the direct and indirect wages generated
This input-output methodology is applied to analyse the following key variables...
Direct effect
Direct effect
Direct effect
Source: PwC Analysis.
Note: A more detailed version of this methodology is contained in Annex A.

Wine sector's total economic contribution to EU's GDP was €130 billion in 2022, equivalent to 0.8% of the EU's GDP
€130 Billion
Each € of direct GDP in the wine sector generates a total amount of €2.3 to the entire EU’s economy
€
The wine sector generates a direct GDP of €56.1 billion through the payment of employees (salaries), payment of taxes on production (payroll tax, taxes on land and buildings, etc.) and the realization of benefits (EBITDA).
57%
Indirect effects (added value generated by suppliers of the wine industry) and induced effects (higher household consumption) together generate 57% of the total impact
The total GDP impact (€130 billion) can be categorized based on the primary actors in the wine sector that generate this impact: viti-viniculture, winemaking, and commercialization
Viti-viniculture (Agriculture) Commercialization (Services) Winemaking (Industry)
GDP contribution1
€31.6 Billion (24.3% share of total wine sector’s economic contribution)
GDP contribution1 €22.1 Billion (17.0% share of total wine sector’s economic contribution)
19,892 Million € (17.2%)
GDP contribution1 €76.3 Billion (58.7% share of total wine sector’s economic contribution)
Main activities benefited indirectly by the wine sector
• Wine glasses
• Transportation vehicles
• Wine fridges/coolers
• Wine cork manufacturing
• Wine bottles manufacturing
• Agricultural machinery manufacturing & repair
• Engineering auxiliary services (agricultural support, wine safety tests…)
• Advertising campaigns, marketing/branding
Due to the salaries generated directly and indirectly by the wine sector, household consumption has an induced impact on GDP of €24.2 billion, with this impact flowing mainly to sectors such as real estate, trade, and manufacturing
Induced GDP contribution of the wine sector in the EU in 20221 (€, Million)
Real estate activities
€44.4 Billion
€5,014 M
€3,652 M Trade & Repair
€3,246 M Manufacturing
Accommodation and food service activities
€1,553 M
Salaries generated directly and indirectly Consumption by households 20.6% 15.0% 13.7%
Financial and insurance activities
€1,539 M
€26.2 Billion
€24.2 Billion
€1,310 M Transporting and storage
Professional, scientific and technical activities
Administrative and support service activities
Information and communication
Human health and social work activities
€1,185 M
€1,121 M
€956 M
€906 M
€3,702 M Rest
49%
Real Estate, Trade and Manufacturing account for
49% of the total induced contribution of the wine sector
In this context of GDP creation, the European wine got exported to 194 countries in 2022, with a total export value of €17.9 billion, which represents around 32% of the direct GDP contribution
Key export figures
€ 17.9 Billion
Value of wine exports to non-EU countries in 2022. With €16 billion in PDO & PGI Wines (90%)

31.8 Million hl
Volume of wine exports to nonEU countries in 2022. With 23.1 Million of hectoliters of PDO & PGI Wines (72%)
67%
Exports to the US, UK, Switzerland, Canada and China accounted for € 11.9 Billion, representing 67% of total wine Extra-EU exports value in 2022
Distribution of EU external wine exports value by main partners in 2022
€ 4.9 Billion (27%)
6.9 Million hl (22%)
€ 1.2 Billion (7%)
2.0 Million hl (6%)
€ 3.4 Billion (19%)
7.2 Million hl (23%)
€ 1.1 Billion (6%)
1.6 Million hl (5%)
€ 1.3 Billion (7%)
1.7 Million hl (5%)
€ 0.9 Billion (5%)
2.8 Million hl (9%)
€ 1.3 Billion (7%)
1.7 Million hl (5%)

€ 0.5 Billion (3%)
0.2 Million hl (1%)
€ 0.4 Billion (2%)
0.8 Million hl (2%)
€ 0.3 Billion (2%)
0.4 Million hl (1%)
€ 0.3 Billion (2%)
0.4 Million hl (1%)
€ 0.3 Billion (2%)
0.4 Million hl (1%)
The strong export-oriented nature of wine played a crucial role in reducing EU’s balance of trade deficit by a 3.7% in 2022
EU’s trade balance in wine from grape annual evolution 2002-2022 (€, Billion)1
x3
Wine from grape surplus in Extra-Eu trade has tripled in the last 20 years
€5.3 billion
CAGR: +6%
€15.9 billion
The importance of Wine in extra EU trade
EU’s trade balance in goods in 2022 (Billion €)2
All products Food&Beverage
Wine from grape
- €432.6 billion + €71.5 billion + €15.9 billion
3.7%
Without wine trade, the deficit of the EU in 2022 would have been 3.7% higher
22%
of the total EU trade surplus in food & beverages corresponds to wine
(1) International trade in goods with extra-EU 27 countries in 2022, Source: Eurostat.
(2) International trade in goods with extra-EU 27 countries in 2022, Source: Eurostat.

The wine sector contributed to create and maintain around 2.9 million of jobs in the EU in 2022, which represents 1.4% of EU employment
Total employment contribution (2022)
2.9 Million Employment total contribution of the wine sector in the EU
1.8 Million jobs
The wine sector directly contributes to 1.8 Million jobs to the EU’s labor force during 2022 through viti-viniculture (18%), winemaking (7%) and commercialization (75%)
For each direct job in the wine sector a total amount of 1.6 jobs are generated in the whole economy
4 out of 10
4 out of 10 jobs are generated by the supply chain (indirect effect) and household’s consumption (induced effect)
Total employment contribution is equivalent to 1.4% of EU employment
Total job creation can be classified by examining the primary actors within the wine sector that generated the impact: viti-viniculture, winemaking, and commercialization
621,262 jobs
(21.4% share of total wine sector’s employment contribution)
19,892 Million € (17.2%) Employment contribution1
293,932 jobs (10.1 % share of total wine sector’s employment contribution)
1,986,219 jobs (68.5% share of total wine sector’s employment contribution) 6.7% of EU’s total Agriculture, forestry and fishing 2022 3 Persons employed 6.4% of EU’s total manufacture of food, beverages and tobacco 2020 3 Persons employed 12.1% of EU’s total Retail trade2 20203 Persons employed
The wine sector’s activity generated and sustained nearly 740,000 indirect jobs, with 50% of them distributed across trade, manufacturing, and agriculture sectors
14 out of 100
Out of every 100 employees generated indirectly due to the wine sector activity, 14 employees go to the agricultural sector.
+90%
Viti-viniculture workers produce almost twice GVA than crop and animal production workers
+16%
Winemaking workers produce 16% more GVA than manufacturing employees
+ 5%
Commercialization wine workers produce 5% more than employees in the food & beverage
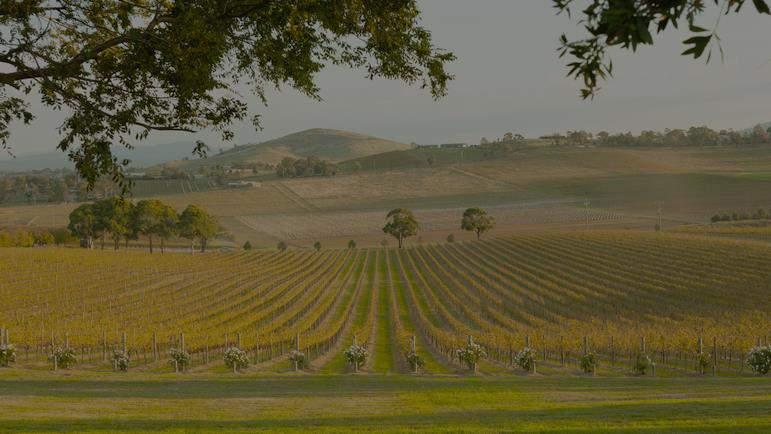
Across the EU, predominantly rural areas occupy nearly half of the territory and are home to almost 93 million inhabitants. Over the past decade, these regions have seen an average population decline of 0.7%
Rural regions have witnessed a decline in their young and working-age populations over the past few decades. This situation has accelerated in recent years. Between 2014 and 2020, EU’s rural areas saw a loss of 2.7 million individuals under the age of 65.
(1) Source: Eurostat classification of NUTS3 regions using population living in urban clusters or rural grid cells
(2) Source: Eurostat
(3) Source: Population by broad age group, sex and other typologies Eurostat . Population for Predominantly rural regions, Estonia, Italy and Croatia don’t report data until 2021.
More productive than other uses of agricultural area….
37%
Vineyards are 37% more profitable than other permanent crops
This results in rural regions in which the area under vines has increased tending to experience a smaller population decline
Total change in population between 2015-2019 in rural regions with vineyards1
Rural regions with expanding vineyards have nearly maintained their population, experiencing only a slight decrease of 0.4%. In contrast, areas with shrinking vineyards have seen a significantly higher decline in their population growth rate, which is 6.5 times greater at -2.6%
Rural regions in which the area under vines has increased tend to experience a smaller population decline…
5.6%
Viti-viniculture’s share of total agricultural output occupying only 2% of the agricultural area
90%
Rural regions where area under vines as increased Rural regions where area under vines has decreased
Rural regionswhere area under vineyards has increased Rural regionswhere area under vineyards has decreased
Viti-viniculture workers are 90% more productive than crop and animal production workers
(1) Source: PwC analysis using Eurostat data. Since Vineyard surface area is only presented by NUTS2 regions, we classified all NUTS2 regions with area under vines in 2015 and 2020 as rural regions if agricultural land area in the region is 25% greater than average share of agricultural area over total land area in all NUTS2 regions in the EU (39%) and population density is 25% lower than average population density in all NUTS2 regions in the EU (379 people per sq km).
On top of this rural contribution, the EU wine regions are a part of our cultural heritage, promoting a deep sense of tradition and a connection to the land

10 EU Wine growing regions have UNESCO WORLD HERITAGE status (1)
• Jurisdiction of Saint-Emilion
• The Loire Valley between Sully-sur-Loire and Chalonnes
• Champagne Hillsides, Houses and Cellars
• The Climats, terroirs of Burgundy
• Alto Douro Wine Region
• Landscape of the Pico Island Vineyard Culture
• Wachau Cultural Landscape
• Upper Middle Rhine Valley
• Tokaj Wine Region Historic Cultural Landscape
• Vineyard Landscape of Piedmont: LangheRoero and Monferrato
Wine tourism is a key element for social and cultural promotion of rural areas because:
…increases the status of those rural areas converting them into premium destinations for potential tourists
… contributes to develop the rural areas, create jobs and an opportunity to stay for young adults
…promotes other regional cultural values, such as gastronomy and local special products
Thus, wine has emerged as a tourist draw and, consequently, a key economic catalyst in many rural regions, with significant additional positive spillover effects on related activities
A whole industry of wine tourism has been established
Travel agencies
Rural accommodation
36 Million
Visit of wineries and wine museums
Thematic leisure activities
Visit of vineyard’s suitable areas
Key figures of the wine tourism sector
Transport Tour guides
Local gastronomy discovery
Wine therapy
Almost 36 Million wine tourists in the EU (1)
It is estimated that almost 36 million people visited the areas surrounding vineyards in 2022 in search of experiences related to wine. During their journey they take pleasure in exploring the rural landscape and its rich social and cultural traditions
€1.1 Billion
More than € 1 billion spending in wineries and wine museums visits (2)
Direct revenues from visits to wineries and wine museums estimates exceeded €1 billion in the entire EU in 2022.
€15 Billion
Almost 15 Billion revenue generated by wine tourism in the EU (3)
Total revenues from wine tourists (hospitality, transport, wineries and other expenses) are estimated to be close to €15 billion in the EU in 2022.
(1) Estimates from different sources and sometimes with different definition of a wine tourist, for countries with no information PwC estimated the number of tourists using the number of vineyard’s hectares in production and average visitors per hectare in other European countries Sources: Atout France, ACEVIN (Spain), Portuguese secretary of state for tourism, Geisenheim University and Wines of Germany , Cittá del Vino (Italy)
(2) Estimates using information available for Spain (ACEVIN) , then extrapolated to the rest of the EU.
(3) Estimates using information available for Germany, Italy and France and then extrapolated to the rest of the EU given estimated wine tourists. Sources: Atout France, Geisenheim University and Wines of Germany and Cittá dl Vino

The wine sector actively contributes to R&D and innovation with projects that can be categorized in 6 big areas of study: viniculture, wine economy, processes, product, sustainability and health
Wine R&D projects by area of study1
Viniculture
Projects related to agriculture improvement. Some of them to be enjoyed by other agricultural practices also.
Projects related to improve the final quality of wine.
Wine economy
Projects related to improve efficiency in different stages of the wine sector’s value chain.
Sustainability
Projects related to improve the whole wine sector resilience to climate change.
>> Key Wine Technology Platform (WTP) projects approved for the period 2021-20242
Digital Twins to optimize energy efficiency and product quality in Wineries
(1) Wine Technology Platform (WTP): https://www.ptvino.com/en/projects/
(2) Wine Technology Platform (WTP): R&D&I projects 2021
The use of seaweed extracts for reducing chemicals and improving grapevine resistance.
Processes
Projects related to address technical and technological challenges in the winemaking processes.
Projects related to increase the healthiness of wine products and to investigate about the wine and grape health contribution for individuals.
New microbiological strategies to reduce the effects of climate change on the quality of tempranillo wines
Demonstration project based on UV flashes as stimulator for pant defense and substitute for fungicides
The wine sector's direct activity, and especially its influence on its value chain (indirect activity), contributed to maintaining over 1.1 billion euros of investment in R&D and innovation in the EU in 2022
Total R&D contribution (2022)
€1,111 Million
R&D total contribution of the wine sector x7.5
Wine sector R&D contribution in 2022 (€, Million)1
Each € of direct R&D from the wine sector generates a total amount of €7.5 of R&D to the entire EU’s economy
€1,111 M (1)
Main sectors benefiting indirectly
37% of indirect R&D and innovation contribution is generated in the scientific and technical services


31% of indirect R&D and innovation contribution generated in manufacturing
10% of indirect R&D and innovation contribution is generated in telecommunications
The expenses and investments made by the wine sector in its suppliers generate a highly significant indirect contribution to R&D and innovation, largely due to the high innovation intensity of the entire supply chain of the sector
Total R&D contribution is equivalent to 0.3% of the total EU's R&D2

In addition to its contribution to economic activity and employment, the wine sector contributes to tax revenue through its own operations and the activity it generates in its supply chain (indirect effect) and in households (induced effect)
Scheme of the fiscal impact generated by the wine sector1 (1) Source: PwC analysis Taxes accrued directly, indirectly, and induced Taxes solely linked to the induced impact
The contribution of the wine sector to fiscal revenue comes from both taxes incurred (Corporate Income Tax) and collected (Personal Income Tax from workers, Social Security Contributions from employees, etc.) directly by the sector, as well as from the related economic activity (indirect and induced impacts).
Wine sector economic activity
Company Profits Employment Payroll Consumption
Corporate Income Tax
Social security contributions
Personal Income Tax
Value Added Tax (VAT)
Thus, the total fiscal impact generated by the wine sector amounted to nearly €52 billion in 2022, which is equivalent to 0.7% of the EU’s general government expenditure
Total fiscal contribution (2022)
€52 Billion
Total fiscal contribution of the wine sector
5 out of 10
Indirect effects (added value generated by suppliers of the wine industry) and induced effects (higher household consumption) together generate almost 50% of the total fiscal contribution
73%
The total fiscal contribution in 2022 is equivalent to 73% of EU-27 total general government expenses in cultural services2
(1) Source: PwC estimates using Input-Output Methodology, Eurostat and Statista data
(2) Source: Eurostat; data for latest year available (2021)
Total fiscal contribution of the wine sector in 20221 (€, Million
Total fiscal contribution is equivalent to 0.7% of the EU’s general government expenditure x2.0
For every € directly collected by the wine sector, an additional €2.0 is generated in taxes and social contributions
The majority of this overall fiscal impact stems from social contributions, comprising 57% of the total impact (€29.6 billion), along with personal income tax at 22.3%
Total fiscal contribution of the wine sector by type of tax generated in 20221 (€, Million)
57% of the fiscal contribution generated as a consequence of the wine sector’s activity is related to social contributions (employees and employer)
Social security contributions taxes paid by both employers and employees due to the salaries generated
Personal income tax paid by employees due to the salaries generated
(1) Source: PwC estimates using Input-Output Methodology, Eurostat and Statista data
(2) Source: Eurostat; National Accounts
Tax generated due to the higher consumption from households (induced impact)
(3) Special taxes on wine computed using consumption per country and special taxes on alcohol in EU member states
For illustrative purposes and to facilitate comparability, the total fiscal contribution in 2022 is equivalent to 76% of the GDP of Croatia2, and represents 1.2 times the GDP of Malta and Cyprus combined2
Tax paid by companies due to the profits generated
Special taxes on wine based on consumption per country in the EU member states
https://ec.europa.eu/taxation_customs/tedb/advSearchForm.html?taxType=EDU_ALCOHOL
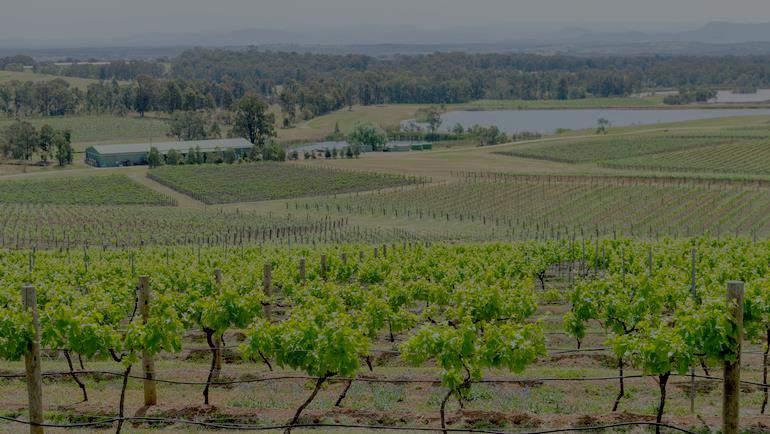
The wine sector contributes to the sustainability of the EU environment in many ways such as boosting biodiversity, limiting soil erosion, improving water management and providing fire protection
Vineyards often host a variety of plants and animals, creating diverse ecosystems. Some vineyards incorporate sustainable farming practices that can include planting cover crops, leaving natural vegetation around the vineyards, and avoiding the use of chemical substances. These measures can help support local wildlife and promote biodiversity around vineyard areas.
A project1 conducted in the vineyards of the German state Saxony-Ahnalt incorporated diverse seed mixtures to enhance biodiversity on steep slopes
+50%
Butterfly species x3
Number of plant species Bee species x4
The wine sector can contribute to this by implementing water-saving irrigation techniques, using advanced technology to monitor and manage water use, and collecting rainwater for vineyard irrigation. Sustainable water management not only benefits the vineyards but also helps conserve water resources, especially in regions facing water scarcity.
In the Spanish wine region of Priorat2 , This project’s team offered irrigation advice to 16 wineries and winegrowers covering 200 hectares.
25% - 35% of water savings
(1) Source: European Commission Cineac “How wineries are adaptating to a warmer world”
(2) International Wineries for Climate Action Regenerative Farming & Carbon Sequestration (IWCA). Data from IWCA in February 2021.
(3) NEIKER technology centre (Instituto Vasco de Investigación y Desarrollo Agrario).
(4) Pagadala, T., Alam, M. A., Maxwell, T. M., & Curran, T. J. (2023).
Soil erosion can be a significant issue in agricultural areas, but vineyards can help limit soil erosion through practices like planting cover crops, using erosion control techniques, and implementing sustainable vineyard layouts. These measures help to stabilize the soil, reduce runoff, and prevent erosion, which in turn protects the quality of the soil for future grape cultivation.
Covering crops in vineyards reduce soil erosion by up to 8 times compared to traditional tilling3
In some wine-producing regions, vineyards can serve as firebreaks or barriers, helping to protect against wildfires. The bare ground between vine rows can create a firebreak, preventing the rapid spread of wildfires. Some vineyard managers may also engage in controlled burning or other fire prevention practices to reduce the risk of fires spreading in the area.
Vineyards have an average flammability x5 lower than average cereal crops4
These areas of contribution are key to the future goals of the European Union, which has recently adopted ambitious environmental objectives in which the primary sector is a key player

11 December 2019
Presentation of the European Green Deal

14 December 2020
The EU Next Gen recovery and resilience plan was adopted to fund EU partner countries to boost the green, digital and healthy transition

17 November 2021
Commission adopts EU Soil Strategy for 2030 aims to promote sustainable soil management practices to protect soil health, preserve biodiversity and reduce carbon emissions from soils

31 August 2022
CAP Strategic Plans of EU countries are formally approved by the Commission. These Plans will shape how the new CAP, set to begin in 2023, will be implemented by each EU country at a national level
Source: European Commission (2019,2020 and 2021) and European Parliament.
20 May 2020

Presentation of the EU Biodiversity Strategy 2030 protect natural resources, and of the "Farm to Fork Strategy" to make food systems more sustainable

9 July 2021

The European Climate Law is published, setting the objective of climate neutrality by 2050 and reducing GHG emissions by at least 55% by 2030
Why take action?
The global average temperature increases at a rate of 0.18ºC per decade
Each degree increase in temperature decreases the yield of rice, corn and wheat by 3% to 10%
2 December 2021

A new and more ambitious CAP was formally adopted setting out the path for agricultural policies for 2023 and onwards
1 million species are at risk of extinction
5 July 2023
The initiative for a soil health law intends to grant soils the same level of legal protection as for air and water
More than 75% of global food crop types rely on animal pollination
is the need to shift to a more sustainable agriculture that minimizes the environmental footprint and does more to protect and sustain nature
Initiatives under the European Green Deal
Clean energy +
Prioritize energy efficiency, renewable resources, affordable energy supply and an integrated energy market in the EU
Sustainable industry +
Push industry to explore and create “climate neutral” circular economy-friendly goods markets
Building and renovation
Increase the use of renewable resources and the renovation rate of buildings

Farm to Fork ++
Ensure a more sustainable food chain
Eliminating pollution +
Aims to achieve cleaner air, water, and soil
Sustainable mobility
Encourage more sustainable, efficient and smart means of transport
Biodiversity ++
Restore ecosystems and their biological levels
Climate action +
Reduce EU greenhouse gas emissions
(++) Initiatives directly related to agriculture (+) Initiatives closely related to agriculture
Source: European Commission (2019,2020 and 2021) and European Parliament.
(1) The international "4 per 1000" Initiative: Soils for Food Security and Climate and Lal et al., 2015.
6/8
among the 8 main initiatives, 6 are directly or indirectly related to agriculture
-55%
Cut greenhouse gas emissions by at least 55% by 2030 and become climate neutral by 2050
Further initiatives to support the environment:
The International “4 per 1000” initiative1
The International “4 per 1000” initiative seeks to achieve 0.4% growth rate per year in soil carbon stocks. If the level of carbon stored by soils in the top 30 to 40 centimetres of soil increased this amount, the annual increase of carbon dioxide (CO2) in the atmosphere would be significantly reduced.

In this context, the EU wine sector have already taken action to mitigate their greenhouse gas emissions, identifying the sources of emissions and defining concrete actions to reduce them
Distribution of GHG emissions in IWCA winery members by scope1 (%)
Fuel use for winery’s activity, vineyard soil emissions (nitrogen application 2%)
Eelectricity purchased from the local grid Transport & distribution, purchased grapes, wine packaging (bottles, carton, cork, labels) employees commuting, etc.
Scope 1: Direct
Scope 2: Indirect
Scope 3: Indirect supply chain
Total 5% 10%
GHG inventories are a key measure that contributes to the environment because:
By maintaining thorough inventories, wineries can pinpoint areas of high emissions and apply specific strategies, subsequently monitoring their advancements in reducing emissions as time progresses
Reducing environmental impact through specific measures….
Reduction of wine glass bottles weight2
A commitment by leading wine retailers including EU companies to reduce the average weight of still wine bottles from an average of 550 gr to less than 420 gr by 20261 This reduction in weight will lead to lower emissions in the wine value chain.

25%
Anticipated decrease in carbon emissions associated with bottle weight reduction

(1) Source: International Wineries for Climate Action GHG inventory
(2) Source: Sustainable Wine Round Table Press Release October 10th 2023
(3) Source: European Commission Cineac “How wineries are adaptating to a warmer world”
100%
Recycling3
To showcase the feasibility of an eco-friendly system for collecting, cleaning, and reusing glass bottles within the wine sector in Catalonia (Spain). The initiative engaged consumers, producers, bars, restaurants, wholesalers, and retailers in a pilot study that encompassed the entire process of reusing wine bottles, spanning from washing, labeling, bottling, and market distribution to their eventual collection.
82,000
Wine bottles saved by reusage saving 170 tons of CO2
Alongside supply chain improvements, the wine sector is adopting techniques like organic vineyard farming to reduce direct emissions
The 328 thousand hectares of organic vineyards represent 10% of the total vineyards hectares in the EU

80% of the global organic vineyard surface
Organic viticulture is a production system that seeks to3
1
1 Sustain ecosystems and preserve soil fertility
2 Enhance biodiversity and safeguard natural resources
3 Advocate for the utilization of ecological processes and cycles
4 Reduce or eliminate external interventions and the use of chemically synthesized products
5 Utilizes organic products and procedures in the transformation and production processes, avoiding all methods that have a substantial adverse impact on the environment
6 Avoid the utilization of genetically modified organisms and any inputs derived from them
(1) Source: OIV Focus OIV The Organic Vineyard
(2) Source OIV Focus OIV The Organic Vineyard, countries considered Spain, France, Italy, Germany, Austria, Greece, Portugal, Bulgaria, Romania, Hungary, Croatia, Czech Republic and Slovenia
(3) Source OIV The Organic Vineyard according to Resolution OIV-ECO 460-2012.
While the wine sector is taking significant steps towards environmental sustainability, it also requires support and funding to adapt to a warming world and combat extreme weather events
Climate change can impact European viticulture…

Further alterations in the timing of grapevine phenology
High risk for established typical varieties

Upsetting the equilibrium in grape and wine composition, leading to the modification of traditional wine styles

Substantial shifts in the geographic locations of traditional cultivation regions
Adverse effects on grapevine productivity resulting from extreme weather occurrences like heatwaves, frost events, unpredictable storms, and destructive hailstorms

Source: Droulia, F.; Charalampopoulos, I. Future Climate Change Impacts on European Viticulture: A Review on Recent Scientific Advances. Atmosphere 2021,
Projected impacts for EU’s wine sector
10 – 40
Days of anticipated phenological phases of grapevine

8 ton
Up to 8 tons per hectare of yield loss projections for some wine regions in the EU


For this study, we calculated the direct, indirect, and induced effects of the wine sector on the European economy, considering the specifics of each stage in the value chain. We initiated our analysis with the primary stage of the value chain, which is viti-viniculture, encompassing agricultural activities. We then proceeded with winemaking, which falls within the industrial sector, concluding with commercialization, a part of the service sector. To prevent any double counting, we subtracted the production value of each stage from the next one. In order to obtain the share of GVA and employment from production values we used National Accounts and Structural Business Statistics from Eurostat. Below is a list containing the primary statistical sources from which we obtained the necessary information for each stage of the value chain
Other data & sources used for the study
• EconomicAccounts for Agriculture (Eurostat)
• NationalAccounts employment data by industry (Eurostat)
• NationalAccounts aggregates by industry (Eurostat)
• Structural Business statistics (Eurostat)
• Statistics on the production of manufactured goods (Eurostat)
Commercialization (Services)
• Structural Business Statistics (Eurostat)
• Market size (Statista)
• Wine consumption (OIV)
• Wine special taxes (European Commission)
• International trade in goods with Extra-EU countries (Eurostat )
• General Government Statistics (Eurostat)
• National Accounts aggregates by industry (Eurostat)
• State of the world Vine and wine sector in 2022 (OIV)
• Wine production in Mhl by country/region (OIV)
• Ruiz Pulpón, Á.R.; Cañizares Ruiz, M.d.C. Potential of Vineyard Landscapes for Sustainable Tourism. Geosciences 2019, 9, 472
• The EU wine sector July 2023 (European Parliamentary Research Archive)
• Wine Production and opening stocks (Directorate-General for Agriculture and Rural Development European Commission)
• Wine trade (Directorate-General for Agriculture and Rural Development European Commission)
• Population by broad age group, sex and other typologies– Regional statistics by other typologies (Eurostat)
• Farm Economy Focus Farm accountancy data network (FADN)
• UNESCO World Heritage List
• Informe visitas a bodegas y museos del vino 2022, 2020 (ACEVIN)
• L’Oenotourisme en France en 2016 (Atout France)
• Szolnoki, Gergely; Tafel, Maximilian; The Impact of Wine Tourism on Germany 2020
• Wine Technology Platform (PTV): R&D&I projects 2021
• Interenational Wineries for Climate Action Regenerative Farming & Carbon Sequestration feb 2021
• Droulia, F.; Charalampopoulos, I. Future Climate Change Impacts on European Viticulture: A Review on Recent Scientific Advances. Atmosphere 2021, 12, 495
• Neiker technology centre (Instituto Vasco de Investigación y
• Pagadala, T., Alam, M. A., Maxwell, T. M., & Curran, T. J. (2023). Measuring flammability of crops, pastures, fruit trees, and weeds: a novel tool to fight wildfires in agricultural landscapes. Science of the total environment, 906, 167489.
The economic contribution of the wine sector has been estimated using Gross Value Added (GVA) as Gross Domestic Product (GDP) is essentially the sum of the Gross Value Added (GVA) at basic prices across all sectors of the economy plus net taxes on products (VAT, excise taxes, etc., net of subsidies on products).
The Gross Value Added (GVA) at basic prices is calculated as the difference between production value (output) and the amount spent on the purchase of goods and services - intermediate consumption - (supplies, external services, and other current operating expenses), without deducting amortization or depreciation. It can be broken down into the following three elements:
GVA���� =����+������+������
Personnel costs (PC): Compensation for labor. It corresponds to all payments made to the company's own personnel for the remuneration of work (monetary or in kind), including social contributions and severance pay. It can be broken down into wages and salaries (gross) and social security contributions.
Gross Operating Surplus (GOS): Compensation for capital. It corresponds to the surplus generated by operating activities after remunerating labor and paying production taxes. It represents the available balance that allows for rewarding providers of equity and debt funds, paying profit taxes, and financing investments.
Net taxes on production (NTP): These are taxes that impose a burden on production, the use of labor, property, or the use of land, buildings, and other assets, regardless of the quantity or value of the products sold, minus subsidies for operation.
The figure below illustrates the decomposition of output (production value) between GVA at basic prices and intermediate consumption.
Personnel costs
GVA b.p.
Gross operating surplus
Net taxes on production
Intermediate consumption
In order to obtain the share of direct GVA of each wine sector value chain component and intermediate consumption we used GVA to production or turnover ratios per activity provided by official statistics from Eurostat.
In order to avoid double counting of indirect effects, for Winemaking (stage 2 of the value chain) we obtained the net intermediate consumption by deducting the production value of viti-viniculture, also for commercialization (stage 3 of the value chain) we eliminated from intermediate consumption all the winemaking production that will be commercialized in the EU (Winemaking production value – wine exports outside the EU).
Variable Viti-viniculture Source Winemaking Source Commercialization Source
Market value € 29.4 Billion
Gross Value Added
€ 13.5 Billion
Economic accounts of agricultureEurostat
National accountsEurostat
€ 50.3 Billion Statistics on the production of manufactured goodsEurostat € 100.3 Billion
€ 97.8 Billion Market size- Statista
Market size without special taxes on wine – European Commission
Intermediate consumption
€ 15.9 Billion National accountsEurostat
€10.9 Billion
€ 39.4 Billion
Structural business statistics- Eurostat
€ 31.7 Billion
NetIntermediate consumption
€ 15.9 Billion National accountsEurostat
(1) 17.9 Billion euros source: Eurostat
€ 10 Billion
Structural business statistics- Eurostat € 66.1 Billion
= (Winemaking Intermediate consumption) – (Vitiviniculture production value)
€ 33.6 Billion
Structural business statisticsEurostat
Structural business statisticsEurostat
= (Commercialization Intermediate consumption) –(winemaking production value) + (winemaking exports outside the EU1)
Economic impacts are calculated on the basis of the input-output (I-O) model based on data from Eurostat
Input-output models are a standard and widely used technique for quantifying the economic impact of economic sectors, business activities and infrastructure investments.They are based on Leontief’s production model, which states that the production requirements of an economy are equivalent to the intermediate demand for goods and services by the production sectors, plus final demand, as expressed in the following equation: X = AX + y
where X is the column vector that represents the production needs of each sector in the economy (using a 20 sector breakdown from FIGARO and 27 countries we have 540 individual sectors), y is a column vector that represents the final demand of each sector, and A is the so-called matrix of technical coefficients (in this case540 rows x 540 columns), which by row indicates the percentage of production destined for each one of the other sectors in the economy for each specific sector, and by column indicates the weight that demand by each one of the other sectors in the economy has over its total production of goods and services for each sector. The above formula can also be represented in the following way:
where, for instance, X1 are the production needs of sector 1, y1 is the final demand of that sector, and a11, a12, a13, …, a163 are the production percentages of sector 1 which are destined, respectively, for sectors 1, 2, 3, …,63 , while a11, a21, a31, …, a631 are the weights on sector 1 production of goods and services demanded, respectively, from 1, 2, 3, …, 63.
If we rearrange the above formula, we can calculate the production needs of an economy (X) based on the final demand (y) that it has to meet as follows: X
Where (I-A)-1 is the inverse Leontief matrix or the production multiplier matrix, which is used to calculate the impacts.
The GVA and employment multipliers that we have used in our analysis has been taken from the RIMS II framework developed by BEA.
Annual EU inter-country input-output tables industry by industry (FIGARO) provided by Eurostat have been used to estimate the model.
FIGARO Input-Output tables allowed us to compute the economic, employment, R&D and Tax contributions taking into account not only the national economic sectors relationships but also the international flows of jobs, income and trade inside the EU.
The latest publication of this Input-Output tables corresponds to 2020 but, in order to avoid the economic noise produced by the pandemic Covid-19 the 2019 FIGARO Input-Output table has been used for this study.

The estimated impact covers the entire EU
Expenditures and investments
Indirect impact
2 Effect over the value chain (suppliers)
Suppliers of the wine sector
Suppliers of suppliers
Employment GDP (GVA)
Tax collection
…
Direct Impact 1
Effect of the wine sector activity
Employment GDP (GVA)
Tax collection
Workers earnings (wages & salaries)
3
Induced impact
Effect of new additional household consumption from wages & salaries
Employment GDP (GVA)
Tax collection

This publication contains general information only. PricewaterhouseCoopers Asesores de Negocios, SL, does not promote through this document to provide any professional services or advice. Therefore, the information contained therein may not be considered or integrate professional advice, nor will it be used as a basis for making decisions or adopting measures that may affect any field. Before making any decision or adopting measures related to the scope or the information contained therein, you must have qualified professional advice personalized to your situation and area of interest. No entity in the PwC network of firms accepts or assumes any obligation, responsibility or duty of care regarding the consequences of the act or omission by it or third parties, based on the information contained in this document, or with respect to any decision based on it.
© 2023 PricewaterhouseCoopers Asesores de Negocios SL All rights reserved. PwC refers to the Spanish member firm and can sometimes refer to the PwC network. Each member firm is a separate and independent legal entity. See www.pwc.com/structure for more details.